Round Valley, CA Map & Demographics
Round Valley Map
Round Valley Overview
$27,014
PER CAPITA INCOME
$46,667
AVG FAMILY INCOME
$50,313
AVG HOUSEHOLD INCOME
1.3%
WAGE / INCOME GAP [ % ]
98.7¢/ $1
WAGE / INCOME GAP [ $ ]
0.50
INEQUALITY / GINI INDEX
739
TOTAL POPULATION
540
MALE POPULATION
199
FEMALE POPULATION
271.36
MALES / 100 FEMALES
36.85
FEMALES / 100 MALES
31.3
MEDIAN AGE
5.1
AVG FAMILY SIZE
3.5
AVG HOUSEHOLD SIZE
169
LABOR FORCE [ PEOPLE ]
31.9%
PERCENT IN LABOR FORCE
5.3%
UNEMPLOYMENT RATE
Income in Round Valley
Income Overview in Round Valley
Per Capita Income in Round Valley is $27,014, while median incomes of families and households are $46,667 and $50,313 respectively.
| Characteristic | Number | Measure |
| Per Capita Income | 739 | $27,014 |
| Median Family Income | 84 | $46,667 |
| Mean Family Income | 84 | $105,188 |
| Median Household Income | 154 | $50,313 |
| Mean Household Income | 154 | $93,101 |
| Income Deficit | 84 | $0 |
| Wage / Income Gap (%) | 739 | 1.29% |
| Wage / Income Gap ($) | 739 | 98.71¢ per $1 |
| Gini / Inequality Index | 739 | 0.50 |
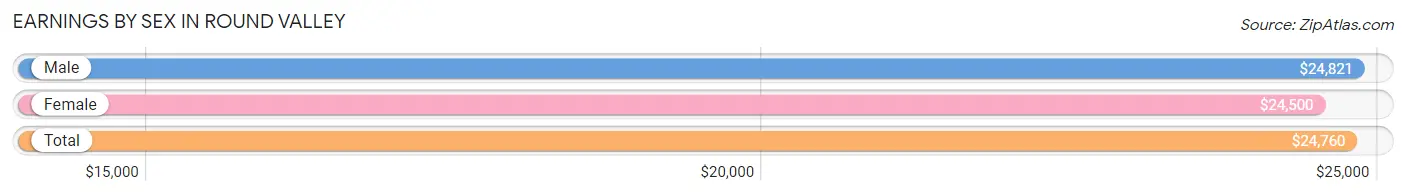
Earnings by Sex in Round Valley
Average Earnings in Round Valley are $24,760, $24,821 for men and $24,500 for women, a difference of 1.3%.
| Sex | Number | Average Earnings |
| Male | 301 (82.0%) | $24,821 |
| Female | 66 (18.0%) | $24,500 |
| Total | 367 (100.0%) | $24,760 |
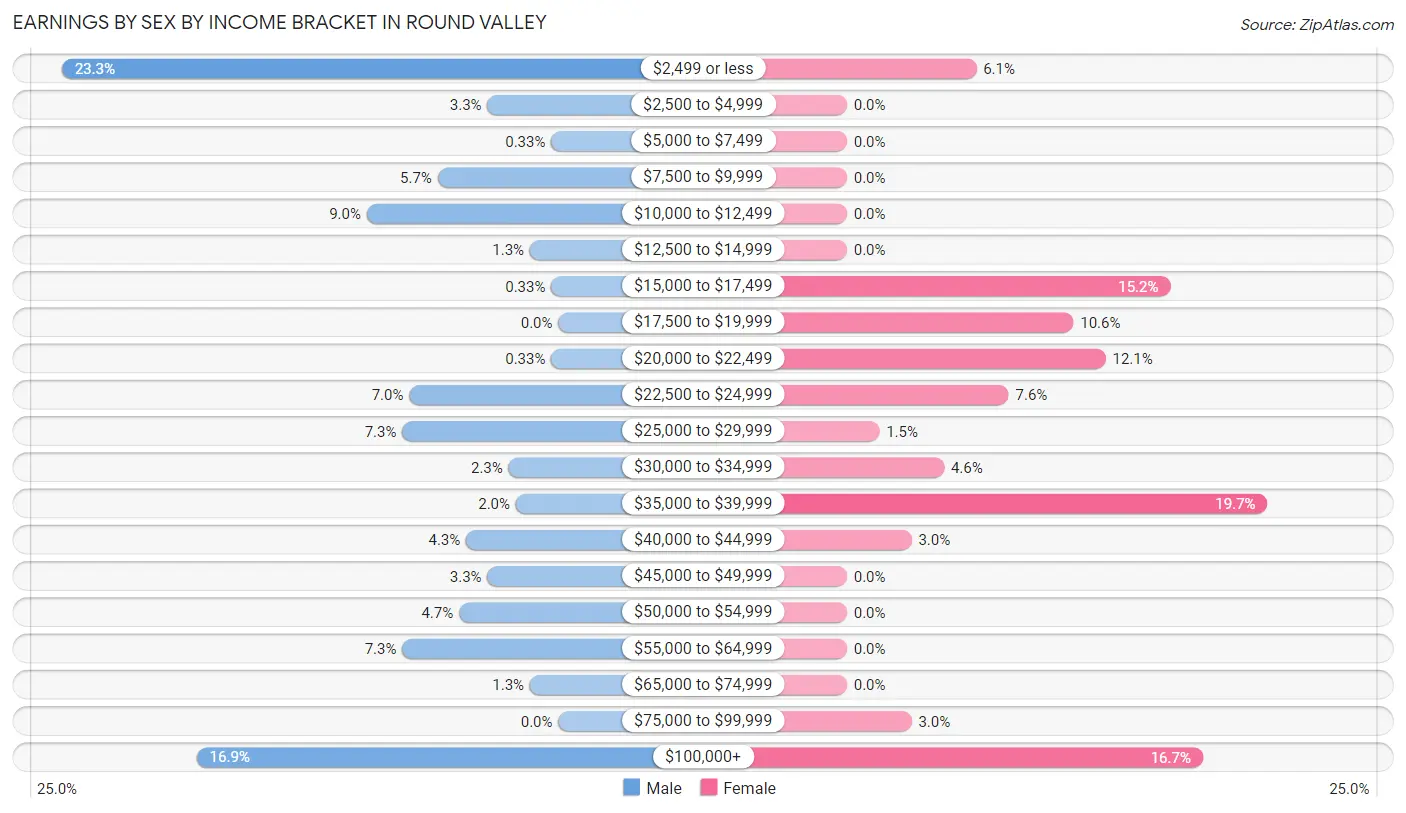
Earnings by Sex by Income Bracket in Round Valley
The most common earnings brackets in Round Valley are $2,499 or less for men (70 | 23.3%) and $35,000 to $39,999 for women (13 | 19.7%).
| Income | Male | Female |
| $2,499 or less | 70 (23.3%) | 4 (6.1%) |
| $2,500 to $4,999 | 10 (3.3%) | 0 (0.0%) |
| $5,000 to $7,499 | 1 (0.3%) | 0 (0.0%) |
| $7,500 to $9,999 | 17 (5.7%) | 0 (0.0%) |
| $10,000 to $12,499 | 27 (9.0%) | 0 (0.0%) |
| $12,500 to $14,999 | 4 (1.3%) | 0 (0.0%) |
| $15,000 to $17,499 | 1 (0.3%) | 10 (15.1%) |
| $17,500 to $19,999 | 0 (0.0%) | 7 (10.6%) |
| $20,000 to $22,499 | 1 (0.3%) | 8 (12.1%) |
| $22,500 to $24,999 | 21 (7.0%) | 5 (7.6%) |
| $25,000 to $29,999 | 22 (7.3%) | 1 (1.5%) |
| $30,000 to $34,999 | 7 (2.3%) | 3 (4.5%) |
| $35,000 to $39,999 | 6 (2.0%) | 13 (19.7%) |
| $40,000 to $44,999 | 13 (4.3%) | 2 (3.0%) |
| $45,000 to $49,999 | 10 (3.3%) | 0 (0.0%) |
| $50,000 to $54,999 | 14 (4.6%) | 0 (0.0%) |
| $55,000 to $64,999 | 22 (7.3%) | 0 (0.0%) |
| $65,000 to $74,999 | 4 (1.3%) | 0 (0.0%) |
| $75,000 to $99,999 | 0 (0.0%) | 2 (3.0%) |
| $100,000+ | 51 (16.9%) | 11 (16.7%) |
| Total | 301 (100.0%) | 66 (100.0%) |
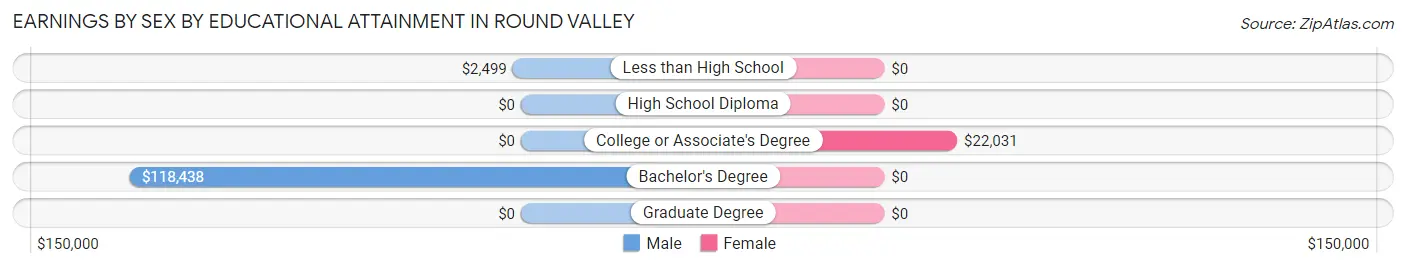
Earnings by Sex by Educational Attainment in Round Valley
Average earnings in Round Valley are $26,518 for men and $24,500 for women, a difference of 7.6%. Men with an educational attainment of bachelor's degree enjoy the highest average annual earnings of $118,438, while those with less than high school education earn the least with $2,499. Women with an educational attainment of college or associate's degree earn the most with the average annual earnings of $22,031, while those with college or associate's degree education have the smallest earnings of $22,031.
| Educational Attainment | Male Income | Female Income |
| Less than High School | $2,499 | $0 |
| High School Diploma | - | - |
| College or Associate's Degree | - | - |
| Bachelor's Degree | $118,438 | $0 |
| Graduate Degree | - | - |
| Total | $26,518 | $24,500 |
Family Income in Round Valley
Family Income Brackets in Round Valley
According to the Round Valley family income data, there are 19 families falling into the $50,000 to $74,999 income range, which is the most common income bracket and makes up 22.6% of all families.
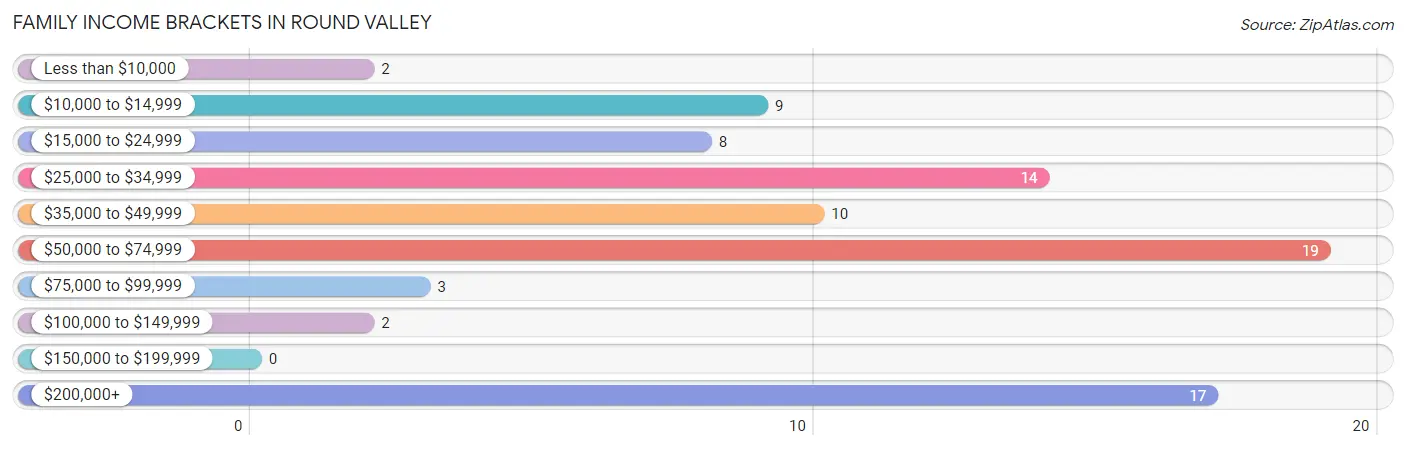
| Income Bracket | # Families | % Families |
| Less than $10,000 | 2 | 2.4% |
| $10,000 to $14,999 | 9 | 10.7% |
| $15,000 to $24,999 | 8 | 9.5% |
| $25,000 to $34,999 | 14 | 16.7% |
| $35,000 to $49,999 | 10 | 11.9% |
| $50,000 to $74,999 | 19 | 22.6% |
| $75,000 to $99,999 | 3 | 3.6% |
| $100,000 to $149,999 | 2 | 2.4% |
| $150,000 to $199,999 | 0 | 0.0% |
| $200,000+ | 17 | 20.2% |
Family Income by Famaliy Size in Round Valley
5-person families (13 | 15.5%) account for the highest median family income in Round Valley with $61,607 per family, while 2-person families (45 | 53.6%) have the highest median income of $15,982 per family member.
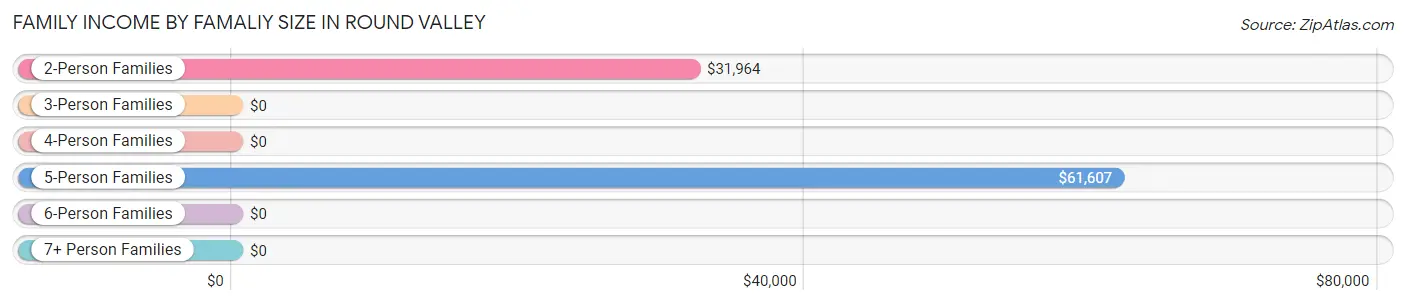
| Income Bracket | # Families | Median Income |
| 2-Person Families | 45 (53.6%) | $31,964 |
| 3-Person Families | 18 (21.4%) | $0 |
| 4-Person Families | 0 (0.0%) | $0 |
| 5-Person Families | 13 (15.5%) | $61,607 |
| 6-Person Families | 0 (0.0%) | $0 |
| 7+ Person Families | 8 (9.5%) | $0 |
| Total | 84 (100.0%) | $46,667 |
Family Income by Number of Earners in Round Valley
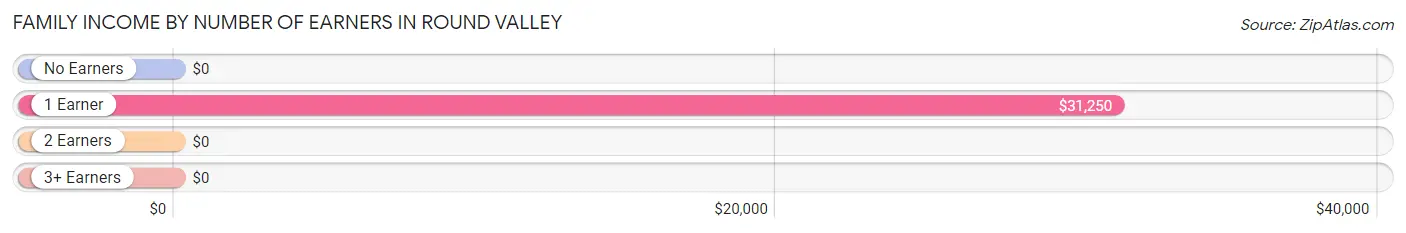
| Number of Earners | # Families | Median Income |
| No Earners | 3 (3.6%) | $0 |
| 1 Earner | 45 (53.6%) | $31,250 |
| 2 Earners | 36 (42.9%) | $0 |
| 3+ Earners | 0 (0.0%) | $0 |
| Total | 84 (100.0%) | $46,667 |
Household Income in Round Valley
Household Income Brackets in Round Valley
With 39 households falling in the category, the $35,000 to $49,999 income range is the most frequent in Round Valley, accounting for 25.3% of all households.
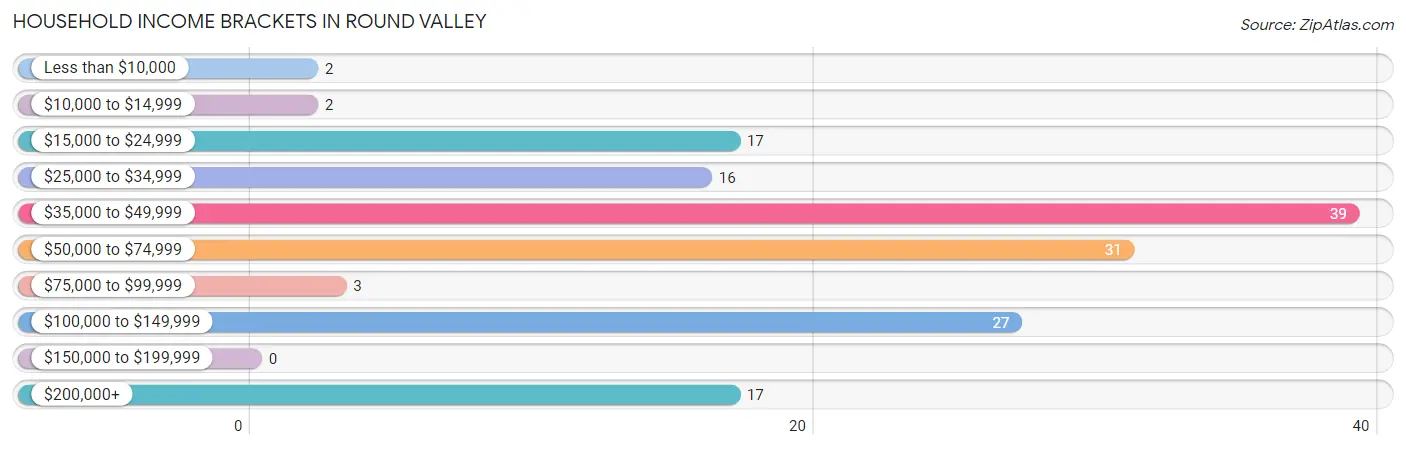
| Income Bracket | # Households | % Households |
| Less than $10,000 | 2 | 1.3% |
| $10,000 to $14,999 | 2 | 1.3% |
| $15,000 to $24,999 | 17 | 11.0% |
| $25,000 to $34,999 | 16 | 10.4% |
| $35,000 to $49,999 | 39 | 25.3% |
| $50,000 to $74,999 | 31 | 20.1% |
| $75,000 to $99,999 | 3 | 1.9% |
| $100,000 to $149,999 | 27 | 17.5% |
| $150,000 to $199,999 | 0 | 0.0% |
| $200,000+ | 17 | 11.0% |
Household Income by Householder Age in Round Valley
The median household income in Round Valley is $50,313, with the highest median household income of $53,750 found in the 25 to 44 years age bracket for the primary householder. A total of 46 households (29.9%) fall into this category.
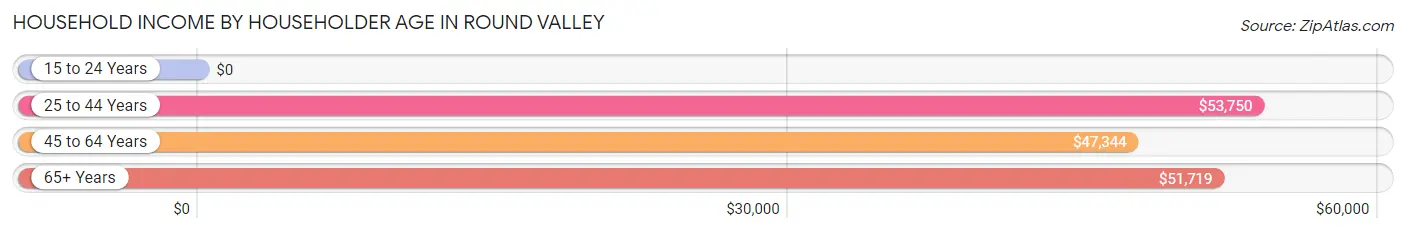
| Income Bracket | # Households | Median Income |
| 15 to 24 Years | 0 (0.0%) | $0 |
| 25 to 44 Years | 46 (29.9%) | $53,750 |
| 45 to 64 Years | 73 (47.4%) | $47,344 |
| 65+ Years | 35 (22.7%) | $51,719 |
| Total | 154 (100.0%) | $50,313 |
Poverty in Round Valley
Income Below Poverty by Sex and Age in Round Valley
With 19.5% poverty level for males and 18.1% for females among the residents of Round Valley, under 5 year old males and under 5 year old females are the most vulnerable to poverty, with 34 males (70.8%) and 34 females (46.6%) in their respective age groups living below the poverty level.
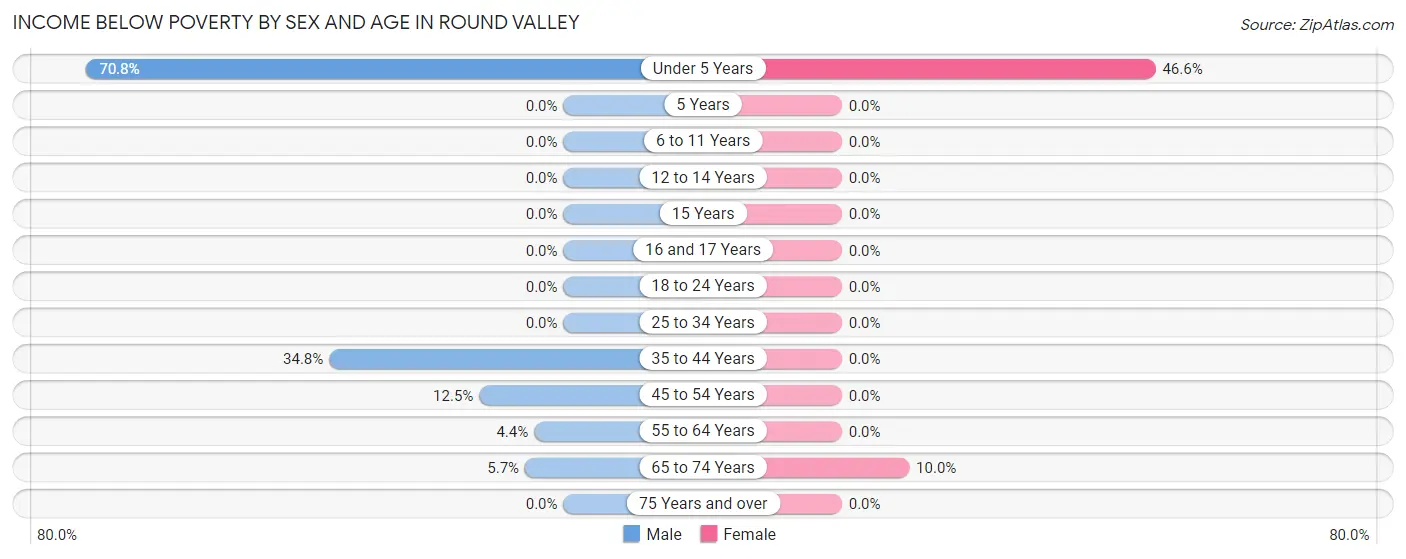
| Age Bracket | Male | Female |
| Under 5 Years | 34 (70.8%) | 34 (46.6%) |
| 5 Years | 0 (0.0%) | 0 (0.0%) |
| 6 to 11 Years | 0 (0.0%) | 0 (0.0%) |
| 12 to 14 Years | 0 (0.0%) | 0 (0.0%) |
| 15 Years | 0 (0.0%) | 0 (0.0%) |
| 16 and 17 Years | 0 (0.0%) | 0 (0.0%) |
| 18 to 24 Years | 0 (0.0%) | 0 (0.0%) |
| 25 to 34 Years | 0 (0.0%) | 0 (0.0%) |
| 35 to 44 Years | 24 (34.8%) | 0 (0.0%) |
| 45 to 54 Years | 4 (12.5%) | 0 (0.0%) |
| 55 to 64 Years | 2 (4.3%) | 0 (0.0%) |
| 65 to 74 Years | 2 (5.7%) | 2 (10.0%) |
| 75 Years and over | 0 (0.0%) | 0 (0.0%) |
| Total | 66 (19.5%) | 36 (18.1%) |
Income Above Poverty by Sex and Age in Round Valley
According to the poverty statistics in Round Valley, males aged 6 to 11 years and females aged 5 years are the age groups that are most secure financially, with 100.0% of males and 100.0% of females in these age groups living above the poverty line.
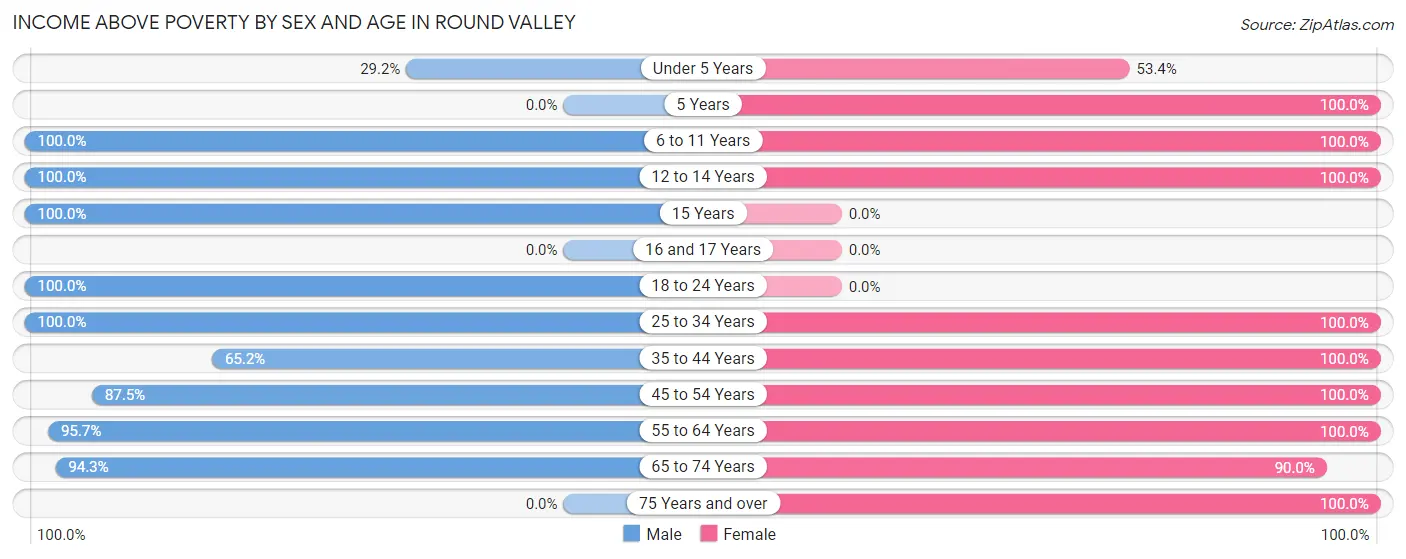
| Age Bracket | Male | Female |
| Under 5 Years | 14 (29.2%) | 39 (53.4%) |
| 5 Years | 0 (0.0%) | 13 (100.0%) |
| 6 to 11 Years | 22 (100.0%) | 13 (100.0%) |
| 12 to 14 Years | 18 (100.0%) | 3 (100.0%) |
| 15 Years | 20 (100.0%) | 0 (0.0%) |
| 16 and 17 Years | 0 (0.0%) | 0 (0.0%) |
| 18 to 24 Years | 26 (100.0%) | 0 (0.0%) |
| 25 to 34 Years | 22 (100.0%) | 15 (100.0%) |
| 35 to 44 Years | 45 (65.2%) | 14 (100.0%) |
| 45 to 54 Years | 28 (87.5%) | 23 (100.0%) |
| 55 to 64 Years | 44 (95.7%) | 23 (100.0%) |
| 65 to 74 Years | 33 (94.3%) | 18 (90.0%) |
| 75 Years and over | 0 (0.0%) | 2 (100.0%) |
| Total | 272 (80.5%) | 163 (81.9%) |
Income Below Poverty Among Married-Couple Families in Round Valley
The poverty statistics for married-couple families in Round Valley show that 3.1% or 2 of the total 65 families live below the poverty line. Families with no children have the highest poverty rate of 5.1%, comprising of 2 families. On the other hand, families with 1 or 2 children have the lowest poverty rate of 0.0%, which includes 0 families.
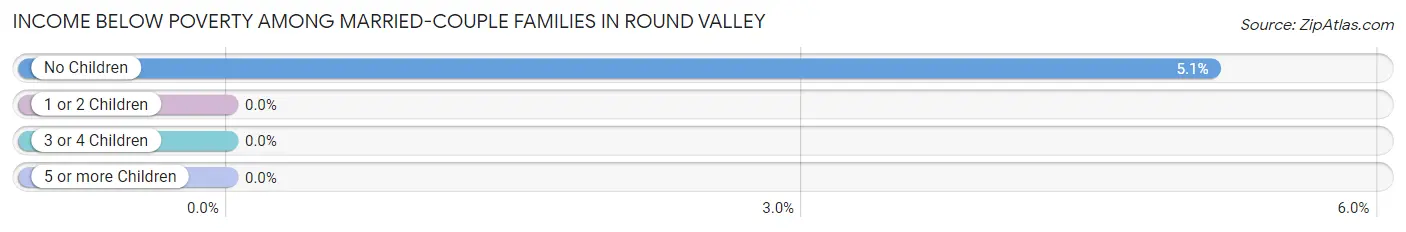
| Children | Above Poverty | Below Poverty |
| No Children | 37 (94.9%) | 2 (5.1%) |
| 1 or 2 Children | 7 (100.0%) | 0 (0.0%) |
| 3 or 4 Children | 19 (100.0%) | 0 (0.0%) |
| 5 or more Children | 0 (0.0%) | 0 (0.0%) |
| Total | 63 (96.9%) | 2 (3.1%) |
Income Below Poverty Among Single-Parent Households in Round Valley
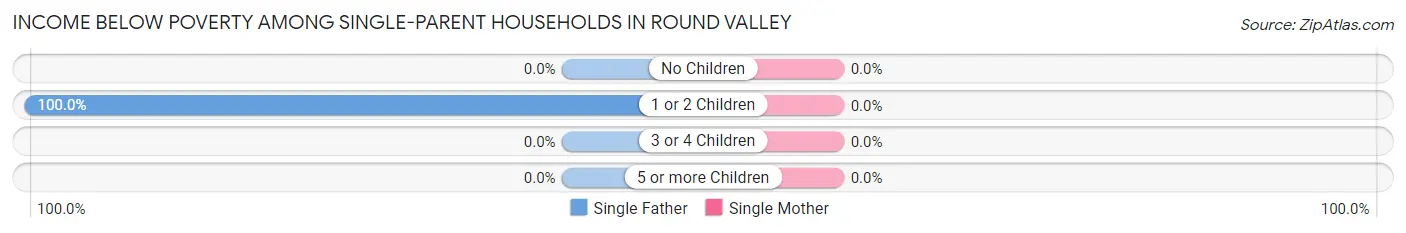
| Children | Single Father | Single Mother |
| No Children | 0 (0.0%) | 0 (0.0%) |
| 1 or 2 Children | 9 (100.0%) | 0 (0.0%) |
| 3 or 4 Children | 0 (0.0%) | 0 (0.0%) |
| 5 or more Children | 0 (0.0%) | 0 (0.0%) |
| Total | 9 (100.0%) | 0 (0.0%) |
Income Below Poverty Among Married-Couple vs Single-Parent Households in Round Valley
The poverty data for Round Valley shows that 2 of the married-couple family households (3.1%) and 9 of the single-parent households (47.4%) are living below the poverty level. Within the married-couple family households, those with no children have the highest poverty rate, with 2 households (5.1%) falling below the poverty line. Among the single-parent households, those with 1 or 2 children have the highest poverty rate, with 9 household (100.0%) living below poverty.
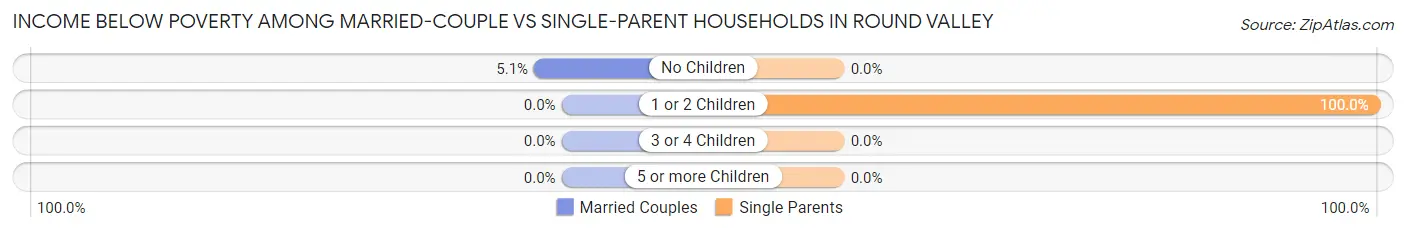
| Children | Married-Couple Families | Single-Parent Households |
| No Children | 2 (5.1%) | 0 (0.0%) |
| 1 or 2 Children | 0 (0.0%) | 9 (100.0%) |
| 3 or 4 Children | 0 (0.0%) | 0 (0.0%) |
| 5 or more Children | 0 (0.0%) | 0 (0.0%) |
| Total | 2 (3.1%) | 9 (47.4%) |
Race in Round Valley
The most populous races in Round Valley are White / Caucasian (454 | 61.4%), Hispanic or Latino (267 | 36.1%), and Two or more Races (122 | 16.5%).
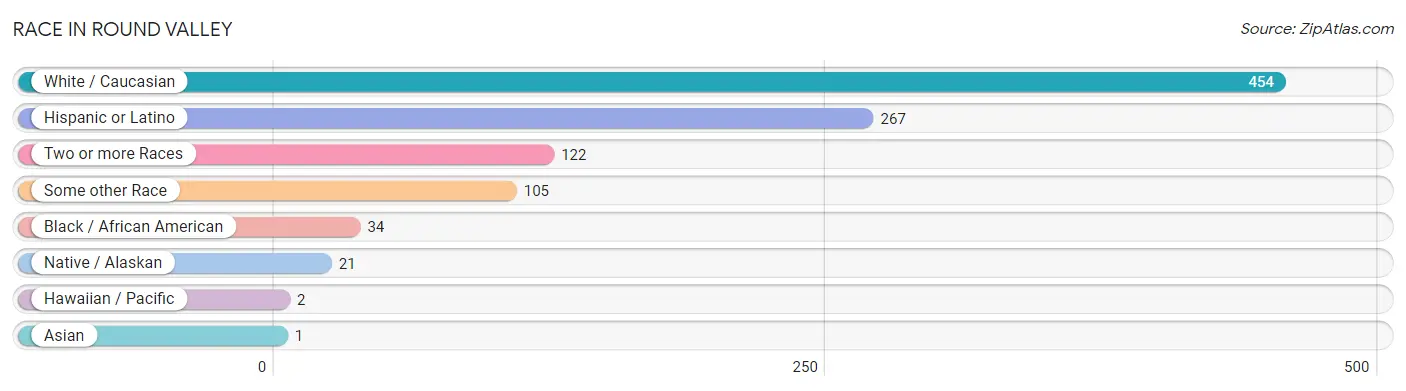
| Race | # Population | % Population |
| Asian | 1 | 0.1% |
| Black / African American | 34 | 4.6% |
| Hawaiian / Pacific | 2 | 0.3% |
| Hispanic or Latino | 267 | 36.1% |
| Native / Alaskan | 21 | 2.8% |
| White / Caucasian | 454 | 61.4% |
| Two or more Races | 122 | 16.5% |
| Some other Race | 105 | 14.2% |
| Total | 739 | 100.0% |
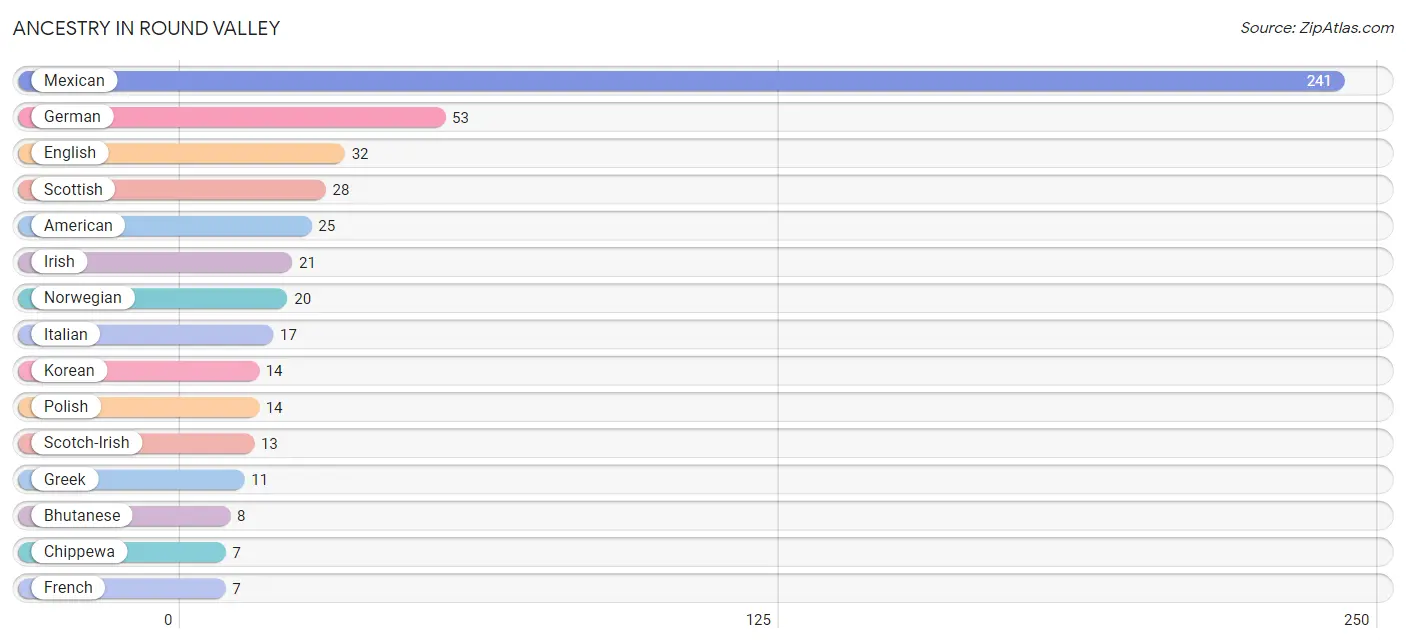
Ancestry in Round Valley
The most populous ancestries reported in Round Valley are Mexican (241 | 32.6%), German (53 | 7.2%), English (32 | 4.3%), Scottish (28 | 3.8%), and American (25 | 3.4%), together accounting for 51.3% of all Round Valley residents.
| Ancestry | # Population | % Population |
| African | 1 | 0.1% |
| American | 25 | 3.4% |
| Apache | 1 | 0.1% |
| Arab | 5 | 0.7% |
| Bhutanese | 8 | 1.1% |
| Central American | 3 | 0.4% |
| Cherokee | 5 | 0.7% |
| Chippewa | 7 | 0.9% |
| Dutch | 2 | 0.3% |
| English | 32 | 4.3% |
| European | 6 | 0.8% |
| Finnish | 2 | 0.3% |
| French | 7 | 0.9% |
| German | 53 | 7.2% |
| Greek | 11 | 1.5% |
| Irish | 21 | 2.8% |
| Italian | 17 | 2.3% |
| Korean | 14 | 1.9% |
| Mexican | 241 | 32.6% |
| Navajo | 3 | 0.4% |
| Norwegian | 20 | 2.7% |
| Paiute | 5 | 0.7% |
| Polish | 14 | 1.9% |
| Potawatomi | 5 | 0.7% |
| Russian | 3 | 0.4% |
| Salvadoran | 3 | 0.4% |
| Scandinavian | 2 | 0.3% |
| Scotch-Irish | 13 | 1.8% |
| Scottish | 28 | 3.8% |
| Slovak | 1 | 0.1% |
| Spaniard | 1 | 0.1% |
| Spanish | 5 | 0.7% |
| Subsaharan African | 1 | 0.1% |
| Swedish | 6 | 0.8% |
| Welsh | 5 | 0.7% | View All 35 Rows |
Immigrants in Round Valley
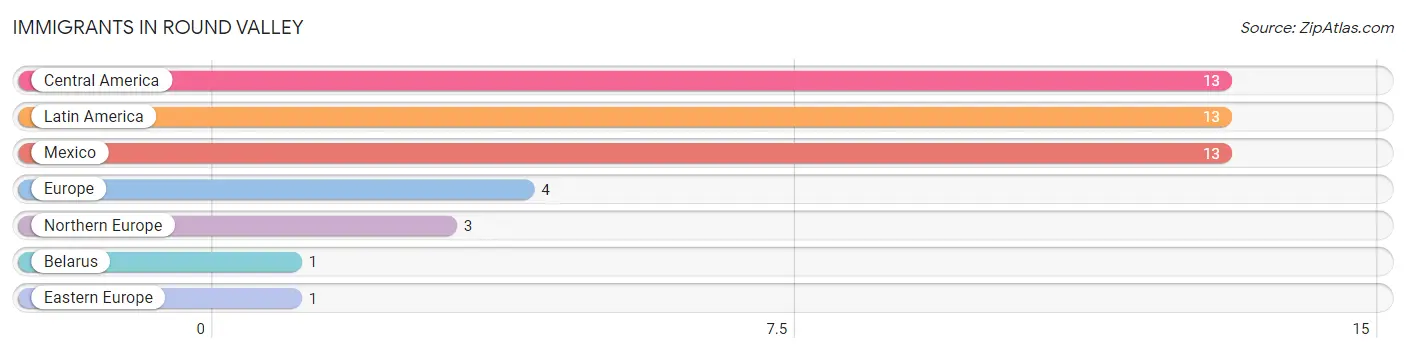
The most numerous immigrant groups reported in Round Valley came from Central America (13 | 1.8%), Latin America (13 | 1.8%), Mexico (13 | 1.8%), Europe (4 | 0.5%), and Northern Europe (3 | 0.4%), together accounting for 6.2% of all Round Valley residents.
| Immigration Origin | # Population | % Population |
| Belarus | 1 | 0.1% |
| Central America | 13 | 1.8% |
| Eastern Europe | 1 | 0.1% |
| Europe | 4 | 0.5% |
| Latin America | 13 | 1.8% |
| Mexico | 13 | 1.8% |
| Northern Europe | 3 | 0.4% | View All 7 Rows |
Sex and Age in Round Valley
Sex and Age in Round Valley
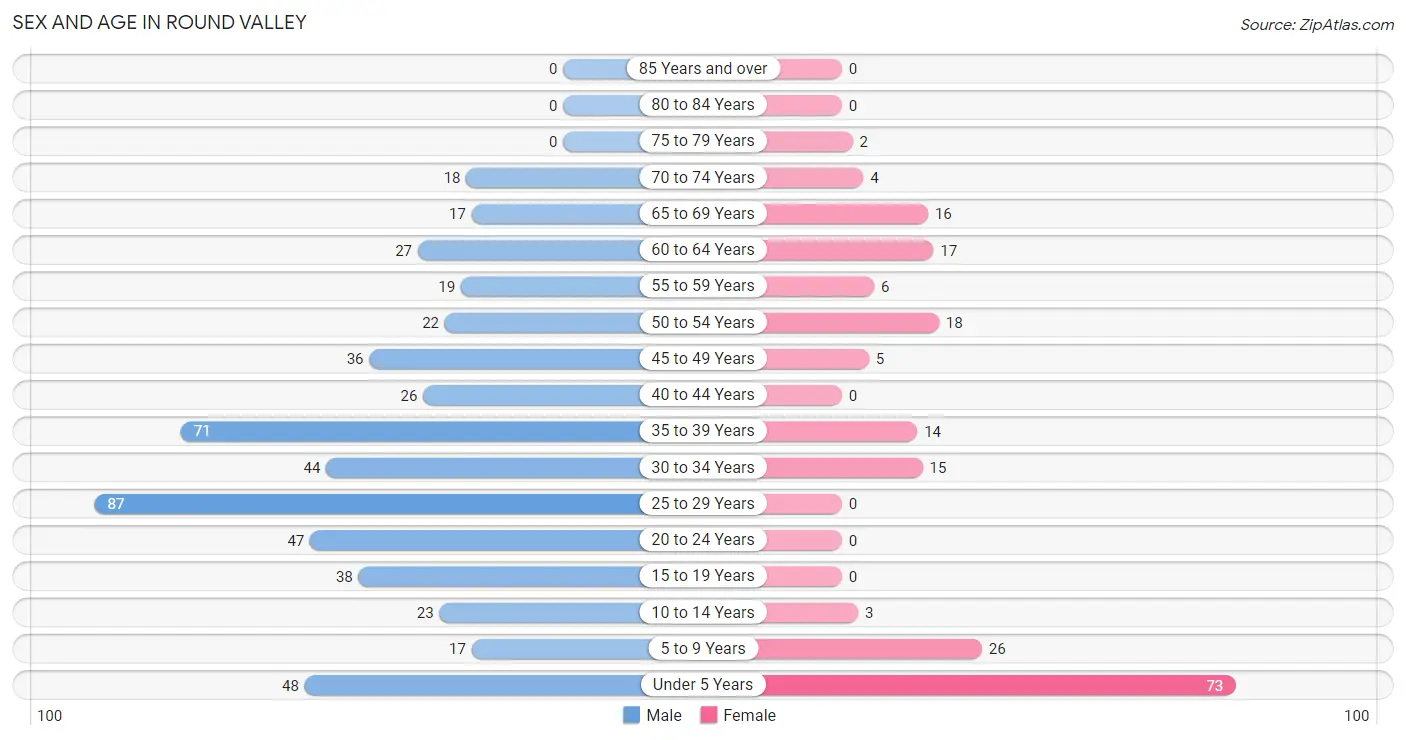
The most populous age groups in Round Valley are 25 to 29 Years (87 | 16.1%) for men and Under 5 Years (73 | 36.7%) for women.
| Age Bracket | Male | Female |
| Under 5 Years | 48 (8.9%) | 73 (36.7%) |
| 5 to 9 Years | 17 (3.2%) | 26 (13.1%) |
| 10 to 14 Years | 23 (4.3%) | 3 (1.5%) |
| 15 to 19 Years | 38 (7.0%) | 0 (0.0%) |
| 20 to 24 Years | 47 (8.7%) | 0 (0.0%) |
| 25 to 29 Years | 87 (16.1%) | 0 (0.0%) |
| 30 to 34 Years | 44 (8.2%) | 15 (7.5%) |
| 35 to 39 Years | 71 (13.2%) | 14 (7.0%) |
| 40 to 44 Years | 26 (4.8%) | 0 (0.0%) |
| 45 to 49 Years | 36 (6.7%) | 5 (2.5%) |
| 50 to 54 Years | 22 (4.1%) | 18 (9.0%) |
| 55 to 59 Years | 19 (3.5%) | 6 (3.0%) |
| 60 to 64 Years | 27 (5.0%) | 17 (8.5%) |
| 65 to 69 Years | 17 (3.2%) | 16 (8.0%) |
| 70 to 74 Years | 18 (3.3%) | 4 (2.0%) |
| 75 to 79 Years | 0 (0.0%) | 2 (1.0%) |
| 80 to 84 Years | 0 (0.0%) | 0 (0.0%) |
| 85 Years and over | 0 (0.0%) | 0 (0.0%) |
| Total | 540 (100.0%) | 199 (100.0%) |
Families and Households in Round Valley
Median Family Size in Round Valley
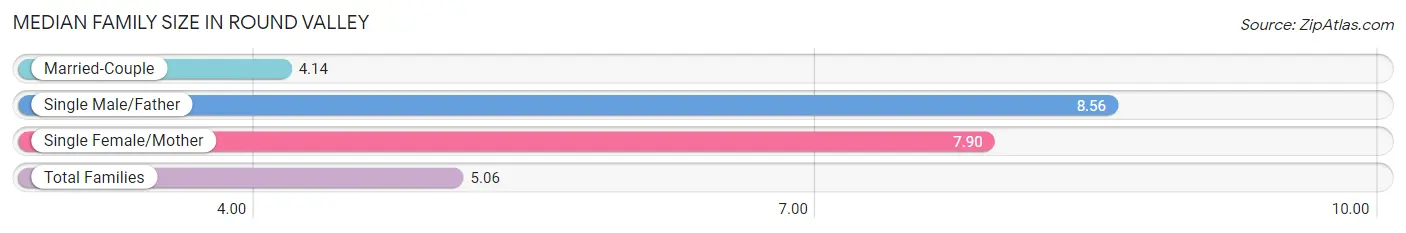
The median family size in Round Valley is 5.06 persons per family, with single male/father families (9 | 10.7%) accounting for the largest median family size of 8.56 persons per family. On the other hand, married-couple families (65 | 77.4%) represent the smallest median family size with 4.14 persons per family.
| Family Type | # Families | Family Size |
| Married-Couple | 65 (77.4%) | 4.14 |
| Single Male/Father | 9 (10.7%) | 8.56 |
| Single Female/Mother | 10 (11.9%) | 7.90 |
| Total Families | 84 (100.0%) | 5.06 |
Median Household Size in Round Valley
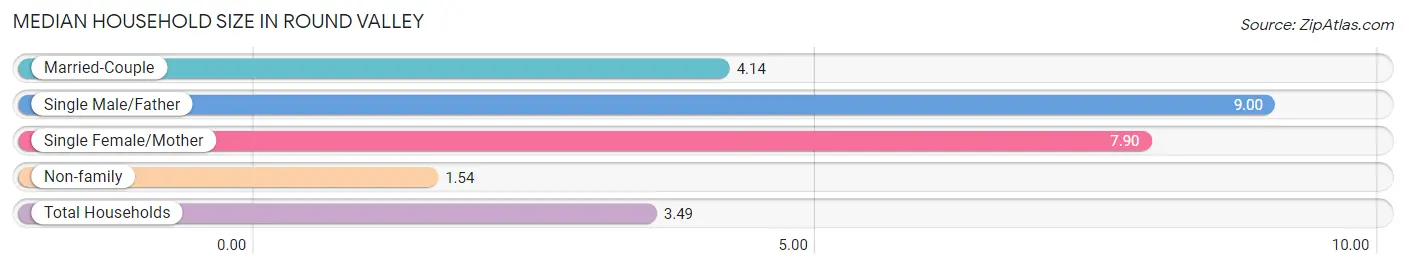
The median household size in Round Valley is 3.49 persons per household, with single male/father households (9 | 5.8%) accounting for the largest median household size of 9 persons per household. non-family households (70 | 45.5%) represent the smallest median household size with 1.54 persons per household.
| Household Type | # Households | Household Size |
| Married-Couple | 65 (42.2%) | 4.14 |
| Single Male/Father | 9 (5.8%) | 9.00 |
| Single Female/Mother | 10 (6.5%) | 7.90 |
| Non-family | 70 (45.5%) | 1.54 |
| Total Households | 154 (100.0%) | 3.49 |
Household Size by Marriage Status in Round Valley
Out of a total of 154 households in Round Valley, 84 (54.5%) are family households, while 70 (45.5%) are nonfamily households. The most numerous type of family households are 2-person households, comprising 45, and the most common type of nonfamily households are 1-person households, comprising 42.
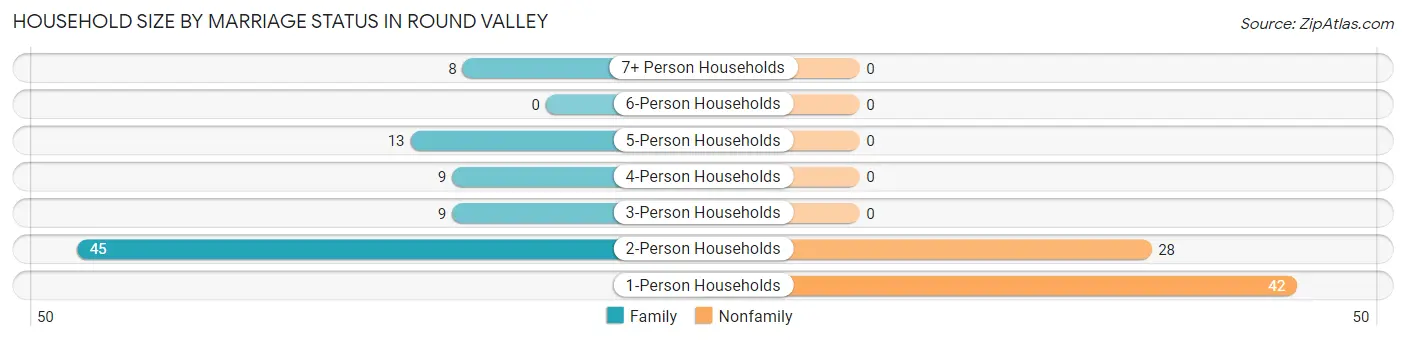
| Household Size | Family Households | Nonfamily Households |
| 1-Person Households | - | 42 (27.3%) |
| 2-Person Households | 45 (29.2%) | 28 (18.2%) |
| 3-Person Households | 9 (5.8%) | 0 (0.0%) |
| 4-Person Households | 9 (5.8%) | 0 (0.0%) |
| 5-Person Households | 13 (8.4%) | 0 (0.0%) |
| 6-Person Households | 0 (0.0%) | 0 (0.0%) |
| 7+ Person Households | 8 (5.2%) | 0 (0.0%) |
| Total | 84 (54.5%) | 70 (45.5%) |
Female Fertility in Round Valley
Fertility by Age in Round Valley
Average fertility rate in Round Valley is 206.0 births per 1,000 women. Women in the age bracket of 35 to 50 years have the highest fertility rate with 263.0 births per 1,000 women. Women in the age bracket of 35 to 50 years acount for 71.4% of all women with births.
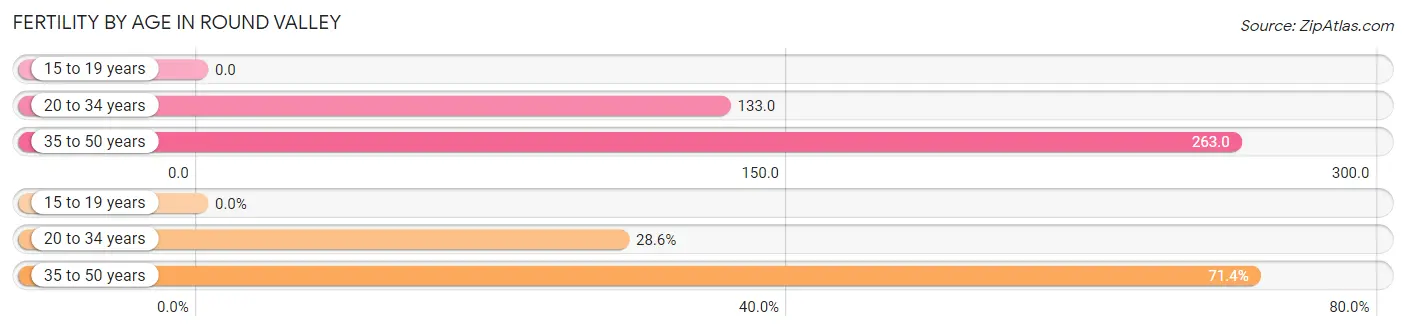
| Age Bracket | Women with Births | Births / 1,000 Women |
| 15 to 19 years | 0 (0.0%) | 0.0 |
| 20 to 34 years | 2 (28.6%) | 133.0 |
| 35 to 50 years | 5 (71.4%) | 263.0 |
| Total | 7 (100.0%) | 206.0 |
Fertility by Age by Marriage Status in Round Valley
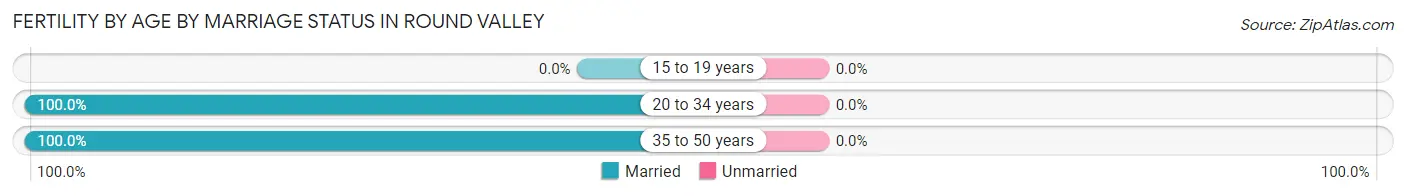
| Age Bracket | Married | Unmarried |
| 15 to 19 years | 0 (0.0%) | 0 (0.0%) |
| 20 to 34 years | 2 (100.0%) | 0 (0.0%) |
| 35 to 50 years | 5 (100.0%) | 0 (0.0%) |
| Total | 7 (100.0%) | 0 (0.0%) |
Fertility by Education in Round Valley
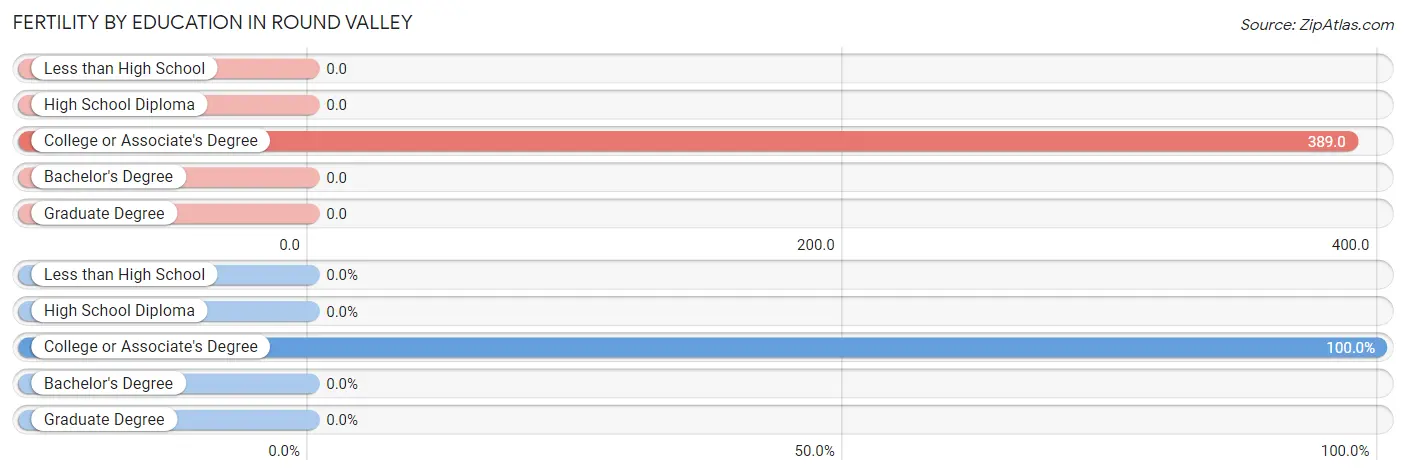
| Educational Attainment | Women with Births | Births / 1,000 Women |
| Less than High School | 0 (0.0%) | 0.0 |
| High School Diploma | 0 (0.0%) | 0.0 |
| College or Associate's Degree | 7 (100.0%) | 389.0 |
| Bachelor's Degree | 0 (0.0%) | 0.0 |
| Graduate Degree | 0 (0.0%) | 0.0 |
| Total | 7 (100.0%) | 206.0 |
Fertility by Education by Marriage Status in Round Valley
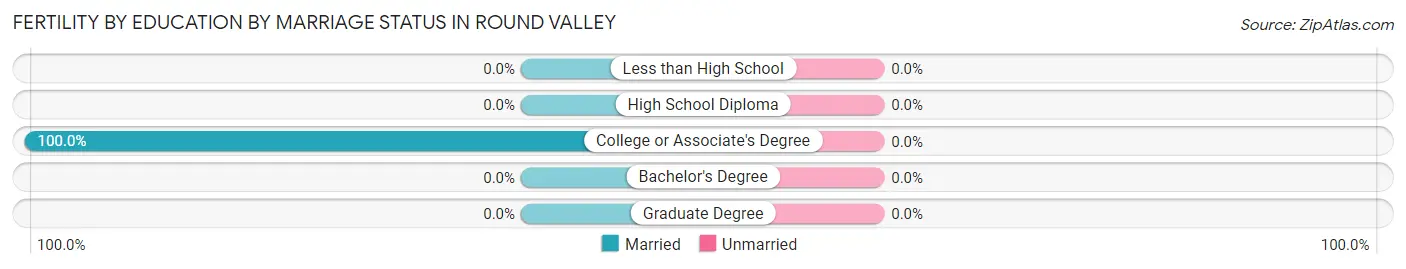
| Educational Attainment | Married | Unmarried |
| Less than High School | 0 (0.0%) | 0 (0.0%) |
| High School Diploma | 0 (0.0%) | 0 (0.0%) |
| College or Associate's Degree | 7 (100.0%) | 0 (0.0%) |
| Bachelor's Degree | 0 (0.0%) | 0 (0.0%) |
| Graduate Degree | 0 (0.0%) | 0 (0.0%) |
| Total | 7 (100.0%) | 0 (0.0%) |
Employment Characteristics in Round Valley
Employment by Class of Employer in Round Valley
Among the 160 employed individuals in Round Valley, private company employees (72 | 45.0%), self-employed (not incorporated) (44 | 27.5%), and local government employees (22 | 13.8%) make up the most common classes of employment.
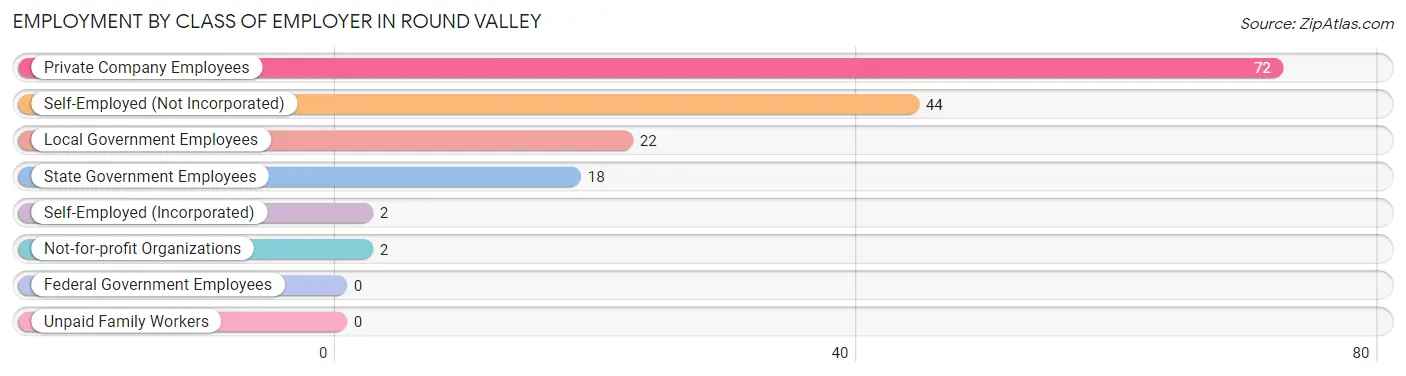
| Employer Class | # Employees | % Employees |
| Private Company Employees | 72 | 45.0% |
| Self-Employed (Incorporated) | 2 | 1.3% |
| Self-Employed (Not Incorporated) | 44 | 27.5% |
| Not-for-profit Organizations | 2 | 1.3% |
| Local Government Employees | 22 | 13.8% |
| State Government Employees | 18 | 11.3% |
| Federal Government Employees | 0 | 0.0% |
| Unpaid Family Workers | 0 | 0.0% |
| Total | 160 | 100.0% |
Employment Status by Age in Round Valley
According to the labor force statistics for Round Valley, out of the total population over 16 years of age (529), 31.9% or 169 individuals are in the labor force, with 5.3% or 9 of them unemployed. The age group with the highest labor force participation rate is 55 to 59 years, with 88.0% or 22 individuals in the labor force. Within the labor force, the 35 to 44 years age range has the highest percentage of unemployed individuals, with 19.6% or 9 of them being unemployed.
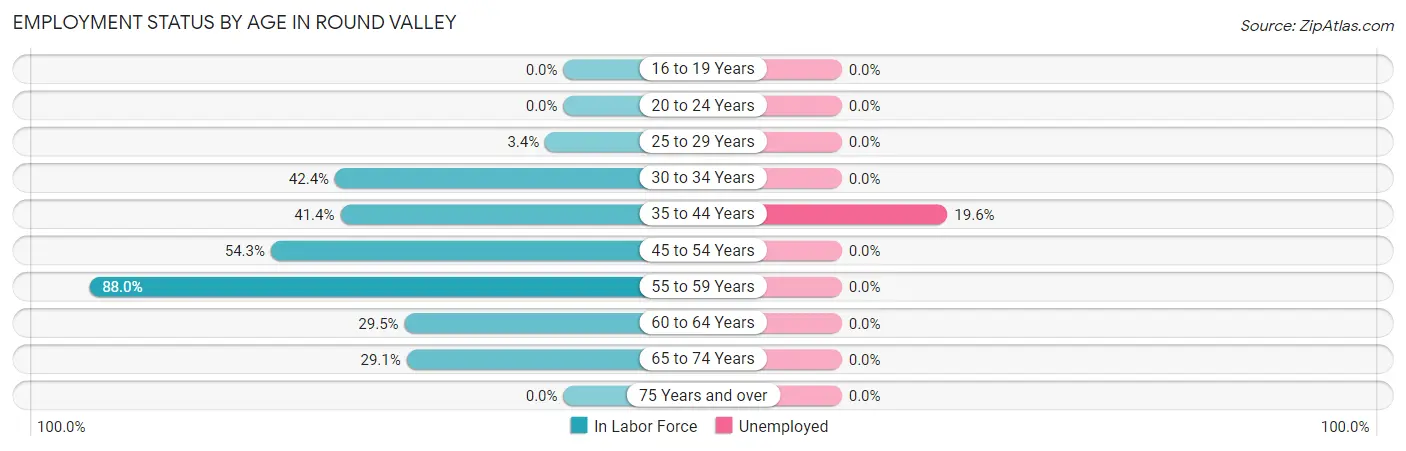
| Age Bracket | In Labor Force | Unemployed |
| 16 to 19 Years | 0 (0.0%) | 0 (0.0%) |
| 20 to 24 Years | 0 (0.0%) | 0 (0.0%) |
| 25 to 29 Years | 3 (3.4%) | 0 (0.0%) |
| 30 to 34 Years | 25 (42.4%) | 0 (0.0%) |
| 35 to 44 Years | 46 (41.4%) | 9 (19.6%) |
| 45 to 54 Years | 44 (54.3%) | 0 (0.0%) |
| 55 to 59 Years | 22 (88.0%) | 0 (0.0%) |
| 60 to 64 Years | 13 (29.5%) | 0 (0.0%) |
| 65 to 74 Years | 16 (29.1%) | 0 (0.0%) |
| 75 Years and over | 0 (0.0%) | 0 (0.0%) |
| Total | 169 (31.9%) | 9 (5.3%) |
Employment Status by Educational Attainment in Round Valley
According to labor force statistics for Round Valley, 37.6% of individuals (153) out of the total population between 25 and 64 years of age (407) are in the labor force, with 5.9% or 9 of them being unemployed. The group with the highest labor force participation rate are those with the educational attainment of bachelor's degree or higher, with 58.7% or 44 individuals in the labor force. Within the labor force, individuals with high school diploma education have the highest percentage of unemployment, with 50.0% or 9 of them being unemployed.
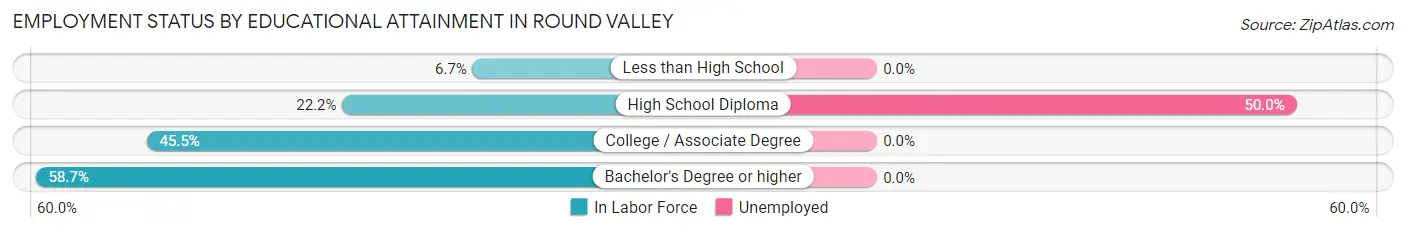
| Educational Attainment | In Labor Force | Unemployed |
| Less than High School | 4 (6.7%) | 0 (0.0%) |
| High School Diploma | 18 (22.2%) | 40 (50.0%) |
| College / Associate Degree | 87 (45.5%) | 0 (0.0%) |
| Bachelor's Degree or higher | 44 (58.7%) | 0 (0.0%) |
| Total | 153 (37.6%) | 24 (5.9%) |
Employment Occupations by Sex in Round Valley
Management, Business, Science and Arts Occupations
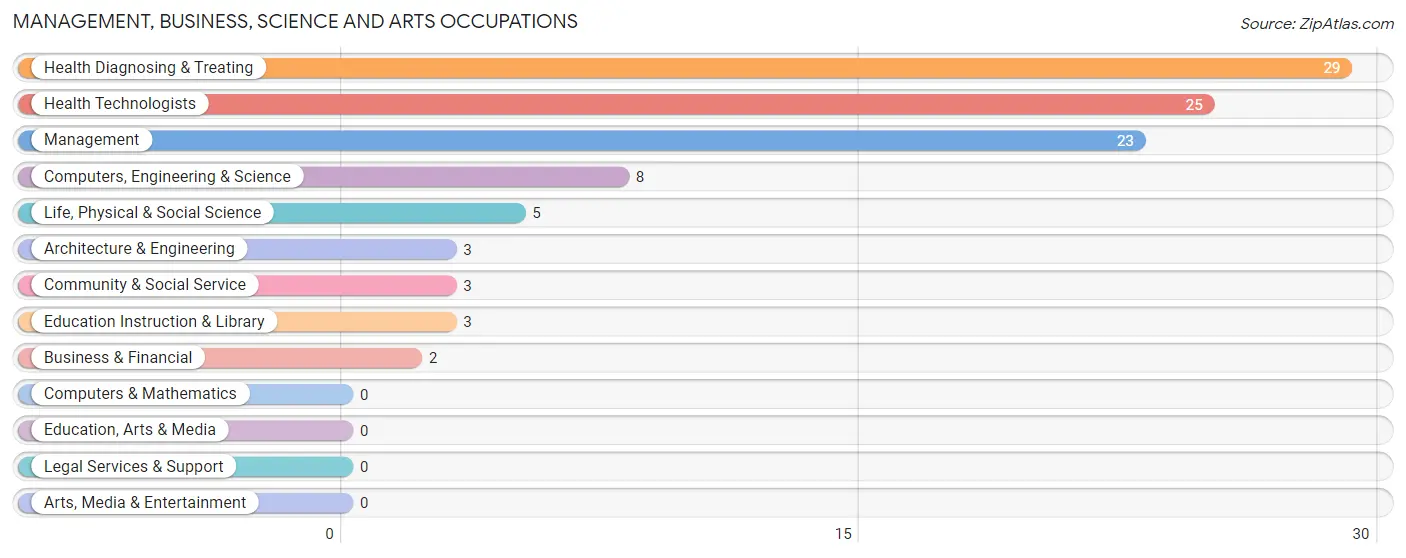
The most common Management, Business, Science and Arts occupations in Round Valley are Health Diagnosing & Treating (29 | 18.1%), Health Technologists (25 | 15.6%), Management (23 | 14.4%), Computers, Engineering & Science (8 | 5.0%), and Life, Physical & Social Science (5 | 3.1%).
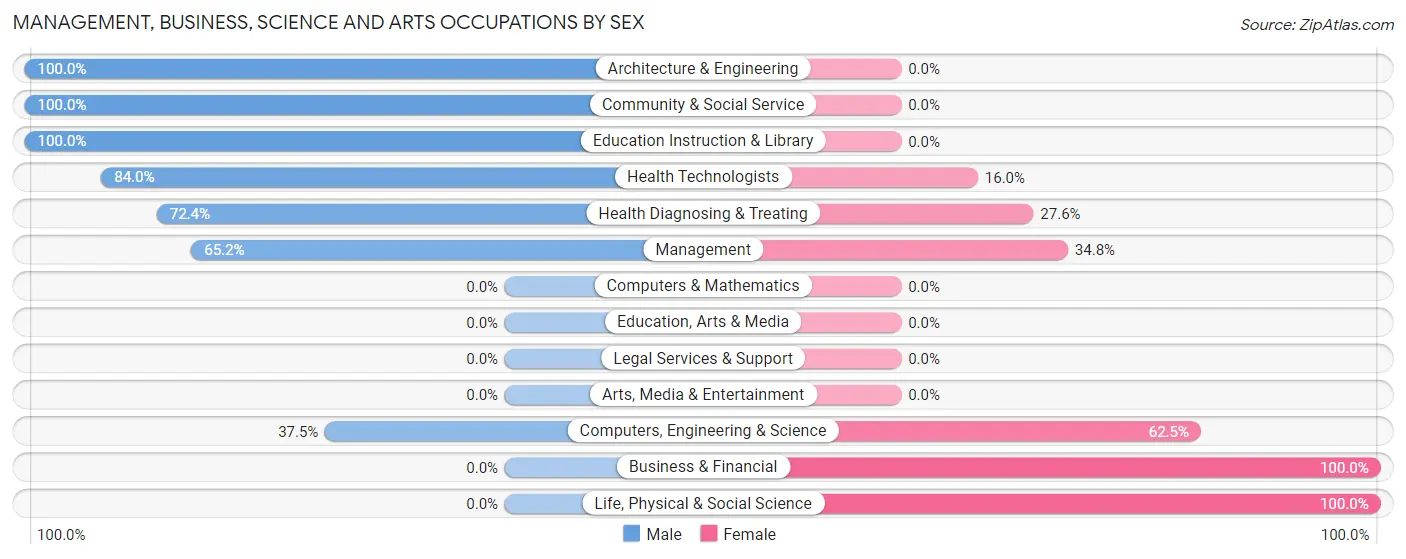
Management, Business, Science and Arts Occupations by Sex
Within the Management, Business, Science and Arts occupations in Round Valley, the most male-oriented occupations are Architecture & Engineering (100.0%), Community & Social Service (100.0%), and Education Instruction & Library (100.0%), while the most female-oriented occupations are Business & Financial (100.0%), Life, Physical & Social Science (100.0%), and Computers, Engineering & Science (62.5%).
| Occupation | Male | Female |
| Management | 15 (65.2%) | 8 (34.8%) |
| Business & Financial | 0 (0.0%) | 2 (100.0%) |
| Computers, Engineering & Science | 3 (37.5%) | 5 (62.5%) |
| Computers & Mathematics | 0 (0.0%) | 0 (0.0%) |
| Architecture & Engineering | 3 (100.0%) | 0 (0.0%) |
| Life, Physical & Social Science | 0 (0.0%) | 5 (100.0%) |
| Community & Social Service | 3 (100.0%) | 0 (0.0%) |
| Education, Arts & Media | 0 (0.0%) | 0 (0.0%) |
| Legal Services & Support | 0 (0.0%) | 0 (0.0%) |
| Education Instruction & Library | 3 (100.0%) | 0 (0.0%) |
| Arts, Media & Entertainment | 0 (0.0%) | 0 (0.0%) |
| Health Diagnosing & Treating | 21 (72.4%) | 8 (27.6%) |
| Health Technologists | 21 (84.0%) | 4 (16.0%) |
| Total (Category) | 42 (64.6%) | 23 (35.4%) |
| Total (Overall) | 110 (68.8%) | 50 (31.2%) |
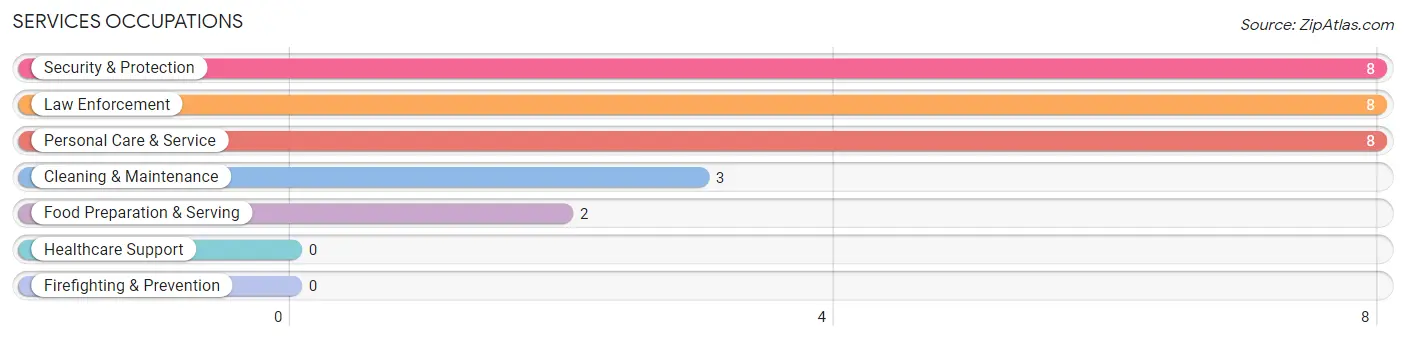
Services Occupations
The most common Services occupations in Round Valley are Security & Protection (8 | 5.0%), Law Enforcement (8 | 5.0%), Personal Care & Service (8 | 5.0%), Cleaning & Maintenance (3 | 1.9%), and Food Preparation & Serving (2 | 1.3%).
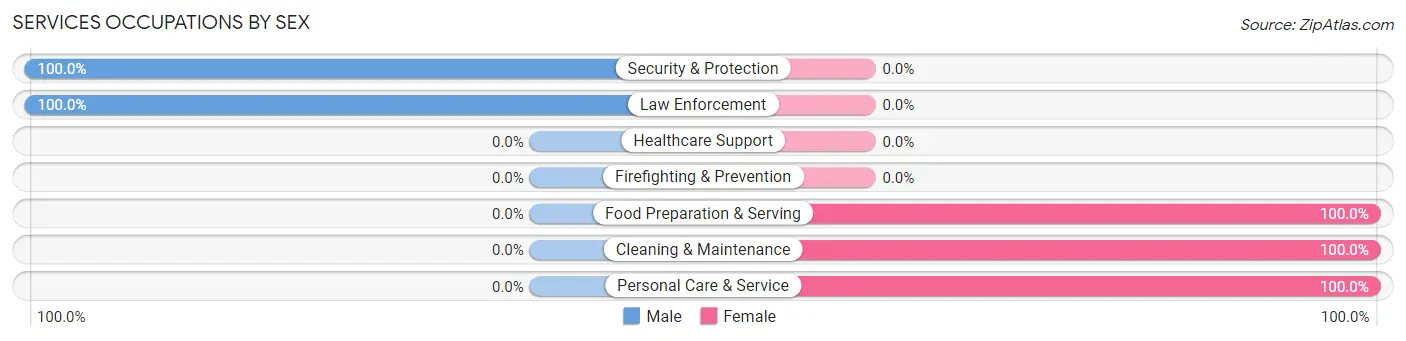
Services Occupations by Sex
Within the Services occupations in Round Valley, the most male-oriented occupations are Security & Protection (100.0%), and Law Enforcement (100.0%), while the most female-oriented occupations are Food Preparation & Serving (100.0%), Cleaning & Maintenance (100.0%), and Personal Care & Service (100.0%).
| Occupation | Male | Female |
| Healthcare Support | 0 (0.0%) | 0 (0.0%) |
| Security & Protection | 8 (100.0%) | 0 (0.0%) |
| Firefighting & Prevention | 0 (0.0%) | 0 (0.0%) |
| Law Enforcement | 8 (100.0%) | 0 (0.0%) |
| Food Preparation & Serving | 0 (0.0%) | 2 (100.0%) |
| Cleaning & Maintenance | 0 (0.0%) | 3 (100.0%) |
| Personal Care & Service | 0 (0.0%) | 8 (100.0%) |
| Total (Category) | 8 (38.1%) | 13 (61.9%) |
| Total (Overall) | 110 (68.8%) | 50 (31.2%) |
Sales and Office Occupations
The most common Sales and Office occupations in Round Valley are Office & Administration (20 | 12.5%), and Sales & Related (11 | 6.9%).
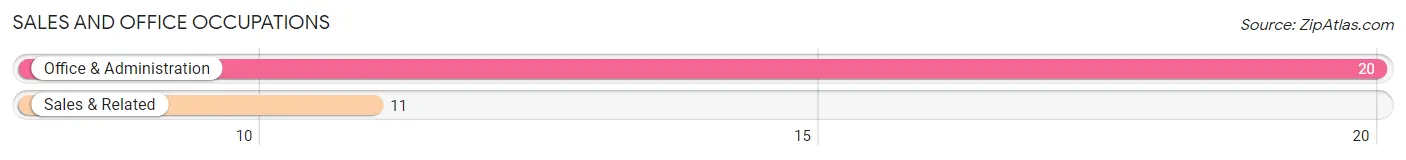
Sales and Office Occupations by Sex
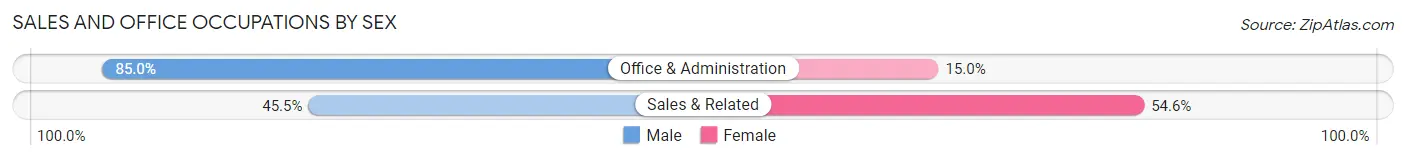
| Occupation | Male | Female |
| Sales & Related | 5 (45.5%) | 6 (54.5%) |
| Office & Administration | 17 (85.0%) | 3 (15.0%) |
| Total (Category) | 22 (71.0%) | 9 (29.0%) |
| Total (Overall) | 110 (68.8%) | 50 (31.2%) |
Natural Resources, Construction and Maintenance Occupations
The most common Natural Resources, Construction and Maintenance occupations in Round Valley are Construction & Extraction (31 | 19.4%), and Installation, Maintenance & Repair (7 | 4.4%).
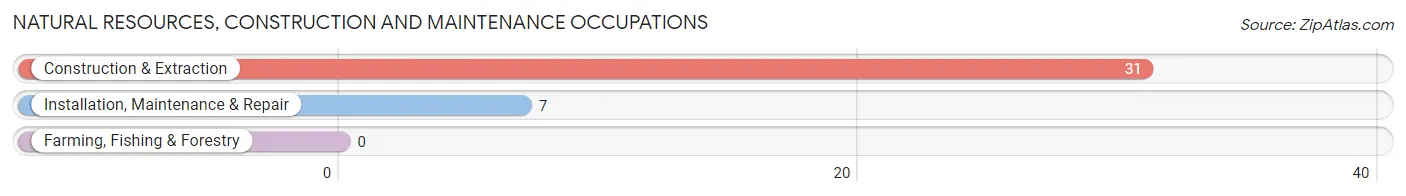
Natural Resources, Construction and Maintenance Occupations by Sex
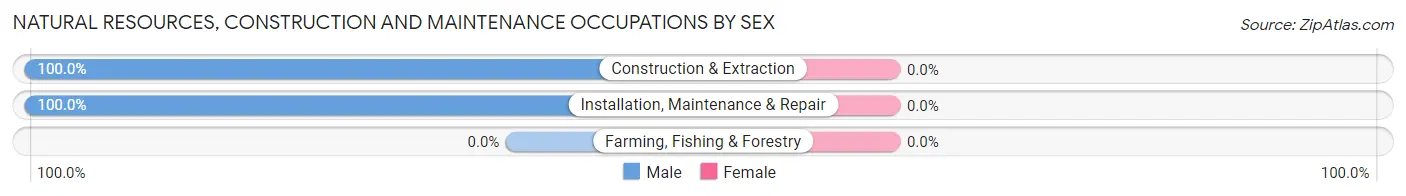
| Occupation | Male | Female |
| Farming, Fishing & Forestry | 0 (0.0%) | 0 (0.0%) |
| Construction & Extraction | 31 (100.0%) | 0 (0.0%) |
| Installation, Maintenance & Repair | 7 (100.0%) | 0 (0.0%) |
| Total (Category) | 38 (100.0%) | 0 (0.0%) |
| Total (Overall) | 110 (68.8%) | 50 (31.2%) |
Production, Transportation and Moving Occupations
The most common Production, Transportation and Moving occupations in Round Valley are , and Production (5 | 3.1%).
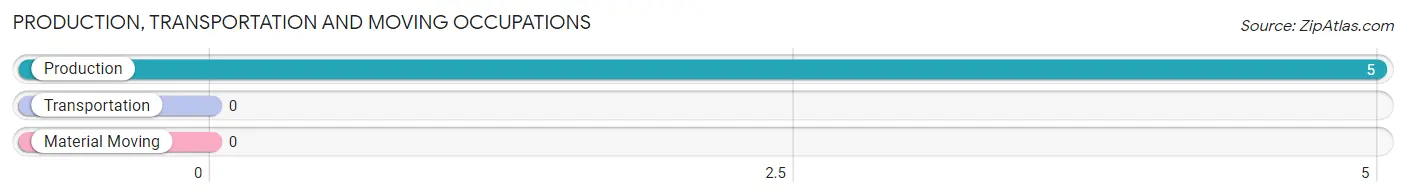
Production, Transportation and Moving Occupations by Sex
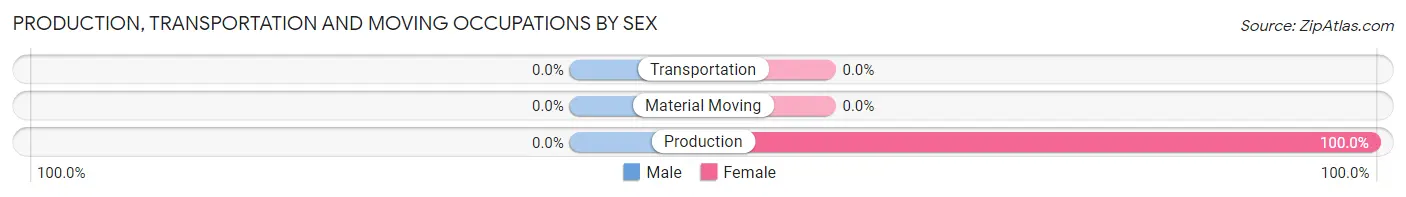
| Occupation | Male | Female |
| Production | 0 (0.0%) | 5 (100.0%) |
| Transportation | 0 (0.0%) | 0 (0.0%) |
| Material Moving | 0 (0.0%) | 0 (0.0%) |
| Total (Category) | 0 (0.0%) | 5 (100.0%) |
| Total (Overall) | 110 (68.8%) | 50 (31.2%) |
Employment Industries by Sex in Round Valley
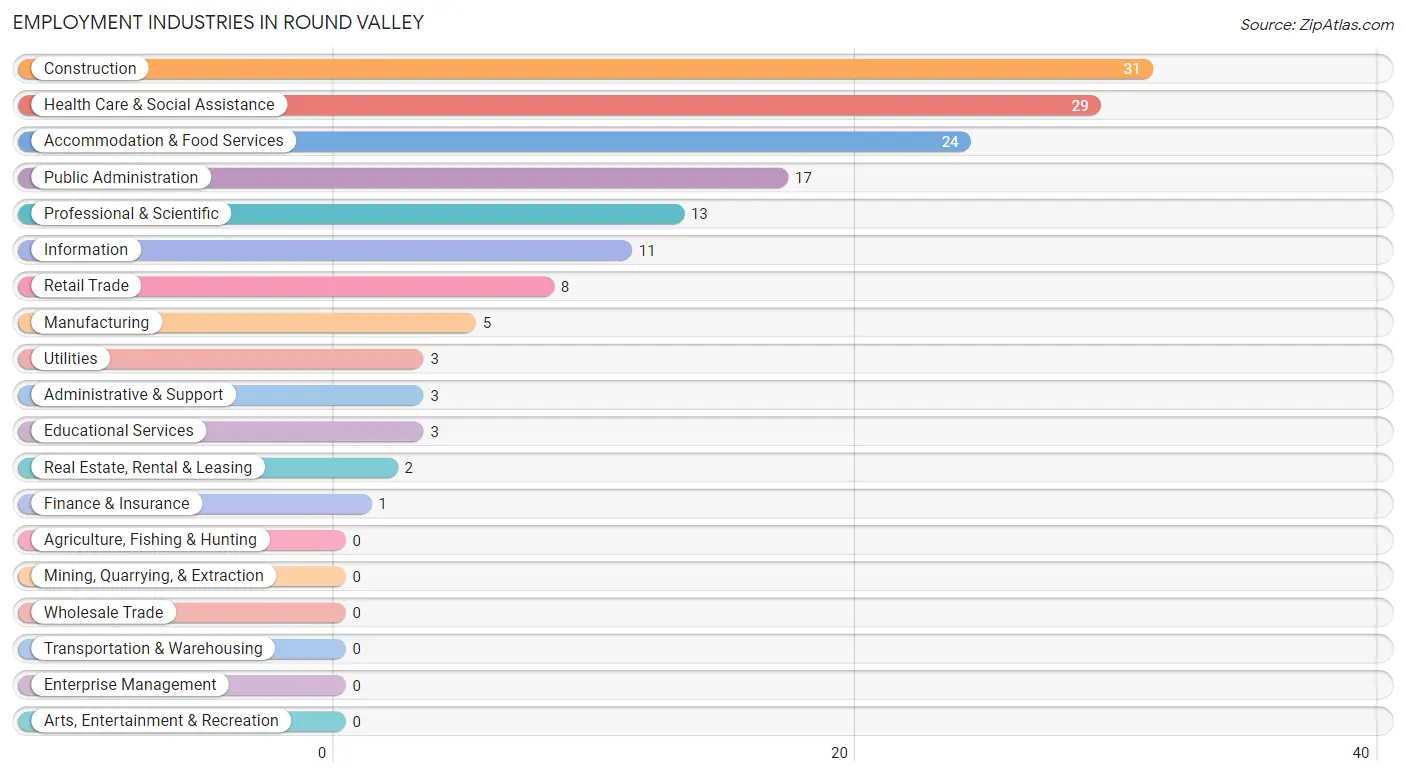
Employment Industries in Round Valley
The major employment industries in Round Valley include Construction (31 | 19.4%), Health Care & Social Assistance (29 | 18.1%), Accommodation & Food Services (24 | 15.0%), Public Administration (17 | 10.6%), and Professional & Scientific (13 | 8.1%).
Employment Industries by Sex in Round Valley
The Round Valley industries that see more men than women are Construction (100.0%), Retail Trade (100.0%), and Utilities (100.0%), whereas the industries that tend to have a higher number of women are Manufacturing (100.0%), Finance & Insurance (100.0%), and Real Estate, Rental & Leasing (100.0%).
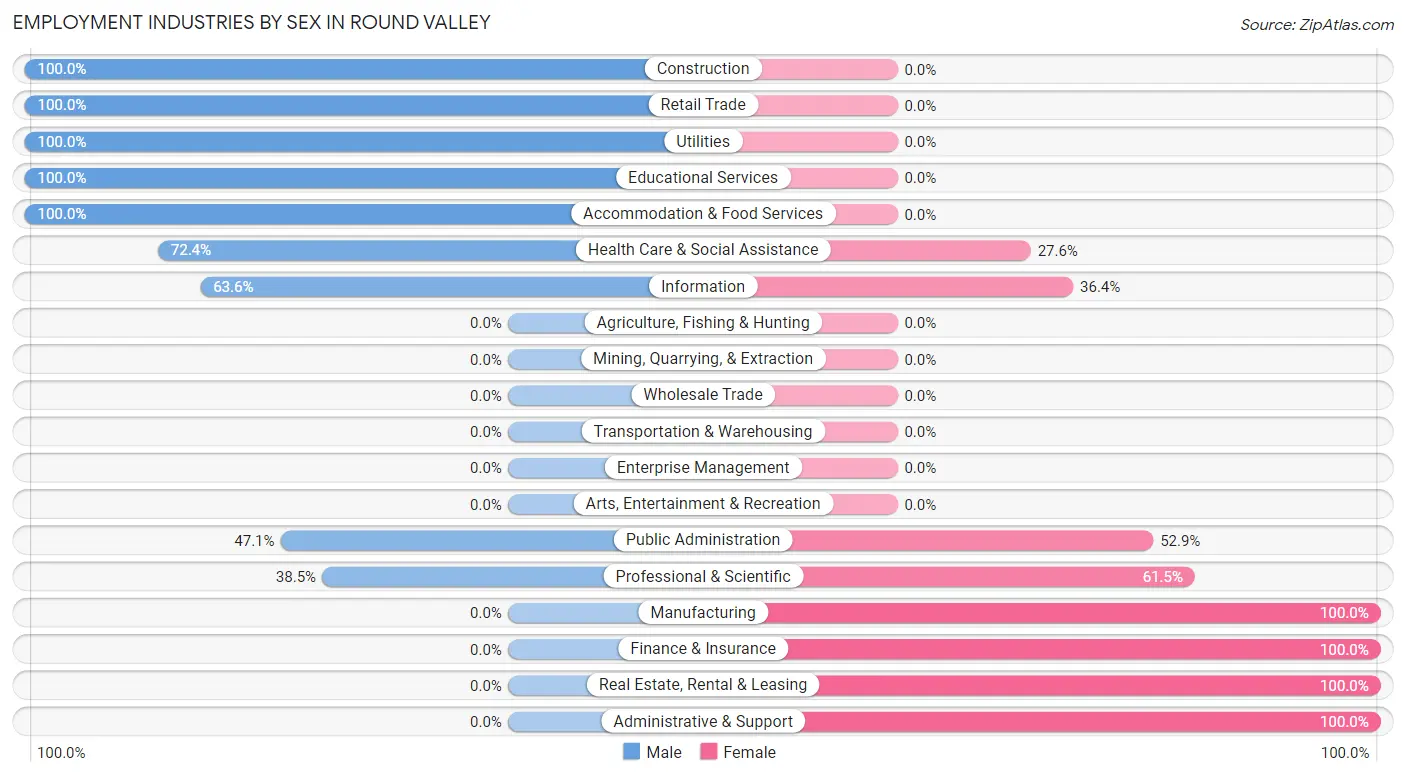
| Industry | Male | Female |
| Agriculture, Fishing & Hunting | 0 (0.0%) | 0 (0.0%) |
| Mining, Quarrying, & Extraction | 0 (0.0%) | 0 (0.0%) |
| Construction | 31 (100.0%) | 0 (0.0%) |
| Manufacturing | 0 (0.0%) | 5 (100.0%) |
| Wholesale Trade | 0 (0.0%) | 0 (0.0%) |
| Retail Trade | 8 (100.0%) | 0 (0.0%) |
| Transportation & Warehousing | 0 (0.0%) | 0 (0.0%) |
| Utilities | 3 (100.0%) | 0 (0.0%) |
| Information | 7 (63.6%) | 4 (36.4%) |
| Finance & Insurance | 0 (0.0%) | 1 (100.0%) |
| Real Estate, Rental & Leasing | 0 (0.0%) | 2 (100.0%) |
| Professional & Scientific | 5 (38.5%) | 8 (61.5%) |
| Enterprise Management | 0 (0.0%) | 0 (0.0%) |
| Administrative & Support | 0 (0.0%) | 3 (100.0%) |
| Educational Services | 3 (100.0%) | 0 (0.0%) |
| Health Care & Social Assistance | 21 (72.4%) | 8 (27.6%) |
| Arts, Entertainment & Recreation | 0 (0.0%) | 0 (0.0%) |
| Accommodation & Food Services | 24 (100.0%) | 0 (0.0%) |
| Public Administration | 8 (47.1%) | 9 (52.9%) |
| Total | 110 (68.8%) | 50 (31.2%) |
Education in Round Valley
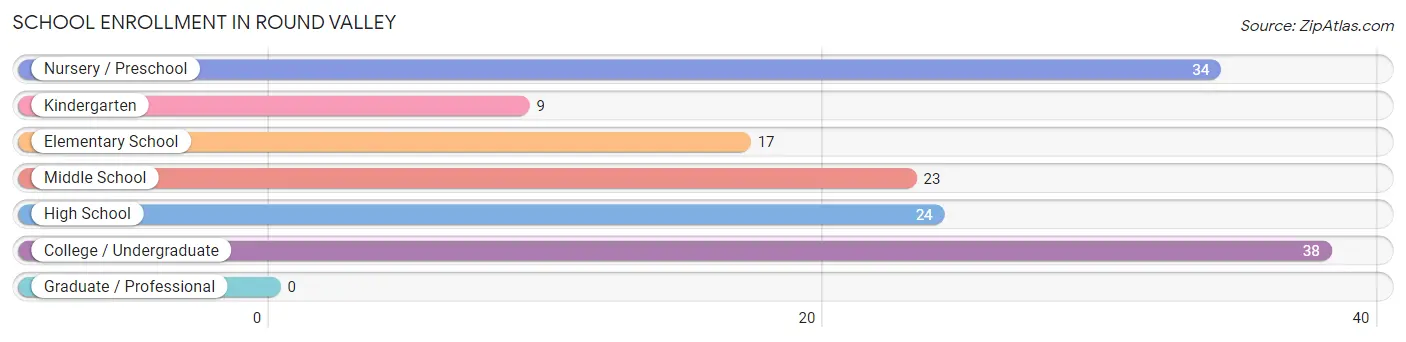
School Enrollment in Round Valley
The most common levels of schooling among the 145 students in Round Valley are college / undergraduate (38 | 26.2%), nursery / preschool (34 | 23.4%), and high school (24 | 16.6%).
| School Level | # Students | % Students |
| Nursery / Preschool | 34 | 23.4% |
| Kindergarten | 9 | 6.2% |
| Elementary School | 17 | 11.7% |
| Middle School | 23 | 15.9% |
| High School | 24 | 16.6% |
| College / Undergraduate | 38 | 26.2% |
| Graduate / Professional | 0 | 0.0% |
| Total | 145 | 100.0% |
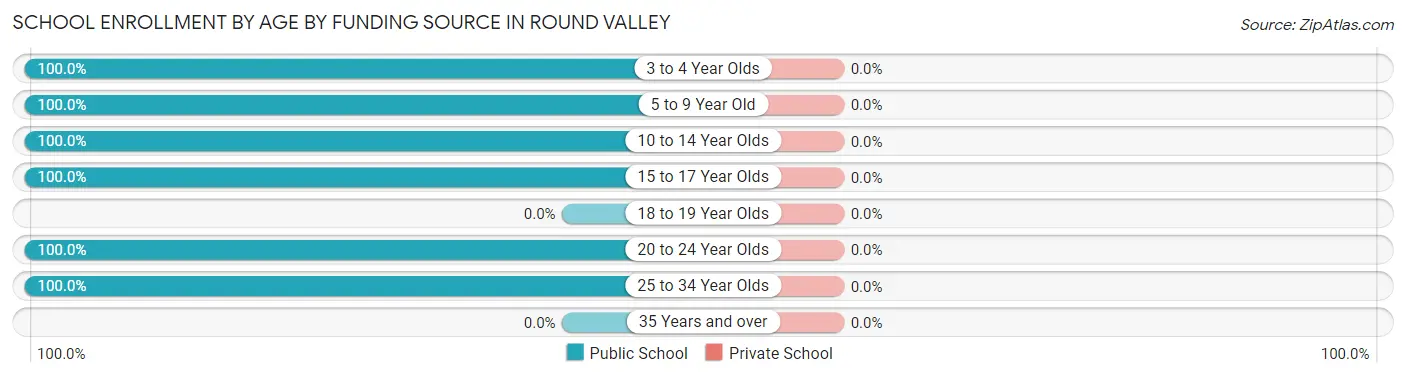
School Enrollment by Age by Funding Source in Round Valley
| Age Bracket | Public School | Private School |
| 3 to 4 Year Olds | 34 (100.0%) | 0 (0.0%) |
| 5 to 9 Year Old | 26 (100.0%) | 0 (0.0%) |
| 10 to 14 Year Olds | 26 (100.0%) | 0 (0.0%) |
| 15 to 17 Year Olds | 20 (100.0%) | 0 (0.0%) |
| 18 to 19 Year Olds | 0 (0.0%) | 0 (0.0%) |
| 20 to 24 Year Olds | 2 (100.0%) | 0 (0.0%) |
| 25 to 34 Year Olds | 37 (100.0%) | 0 (0.0%) |
| 35 Years and over | 0 (0.0%) | 0 (0.0%) |
| Total | 145 (100.0%) | 0 (0.0%) |
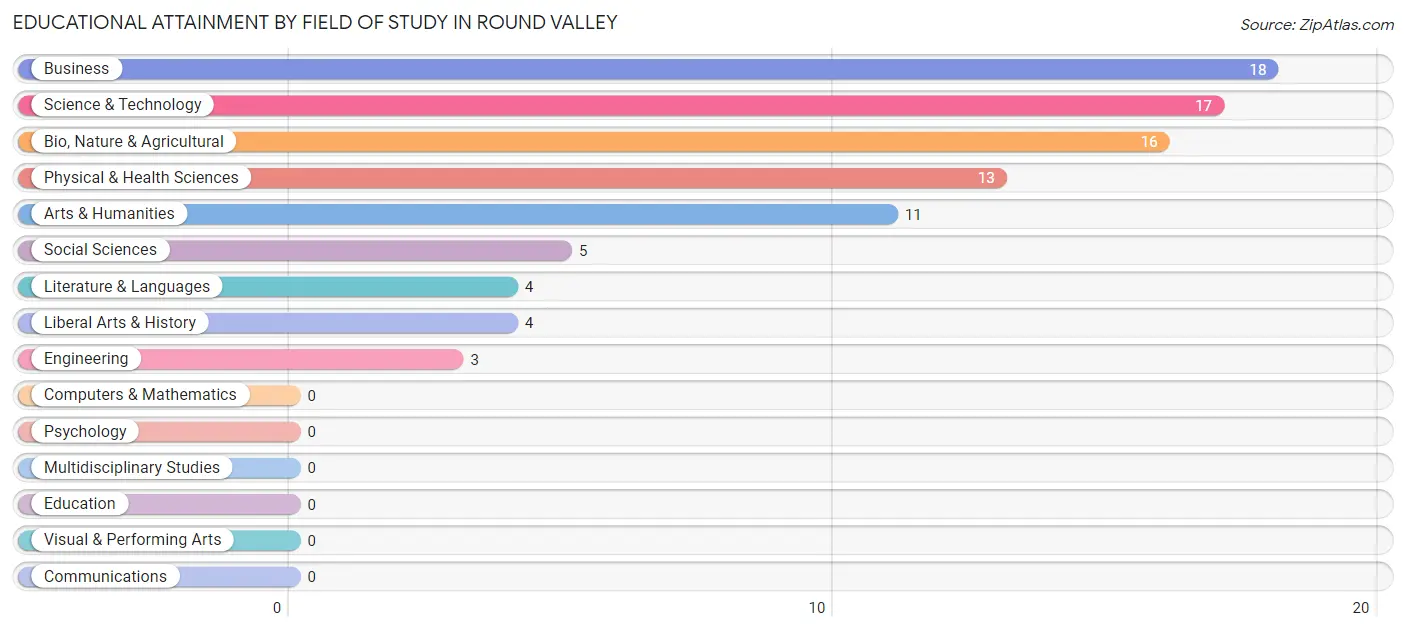
Educational Attainment by Field of Study in Round Valley
Business (18 | 19.8%), science & technology (17 | 18.7%), bio, nature & agricultural (16 | 17.6%), physical & health sciences (13 | 14.3%), and arts & humanities (11 | 12.1%) are the most common fields of study among 91 individuals in Round Valley who have obtained a bachelor's degree or higher.
| Field of Study | # Graduates | % Graduates |
| Computers & Mathematics | 0 | 0.0% |
| Bio, Nature & Agricultural | 16 | 17.6% |
| Physical & Health Sciences | 13 | 14.3% |
| Psychology | 0 | 0.0% |
| Social Sciences | 5 | 5.5% |
| Engineering | 3 | 3.3% |
| Multidisciplinary Studies | 0 | 0.0% |
| Science & Technology | 17 | 18.7% |
| Business | 18 | 19.8% |
| Education | 0 | 0.0% |
| Literature & Languages | 4 | 4.4% |
| Liberal Arts & History | 4 | 4.4% |
| Visual & Performing Arts | 0 | 0.0% |
| Communications | 0 | 0.0% |
| Arts & Humanities | 11 | 12.1% |
| Total | 91 | 100.0% |
Transportation & Commute in Round Valley
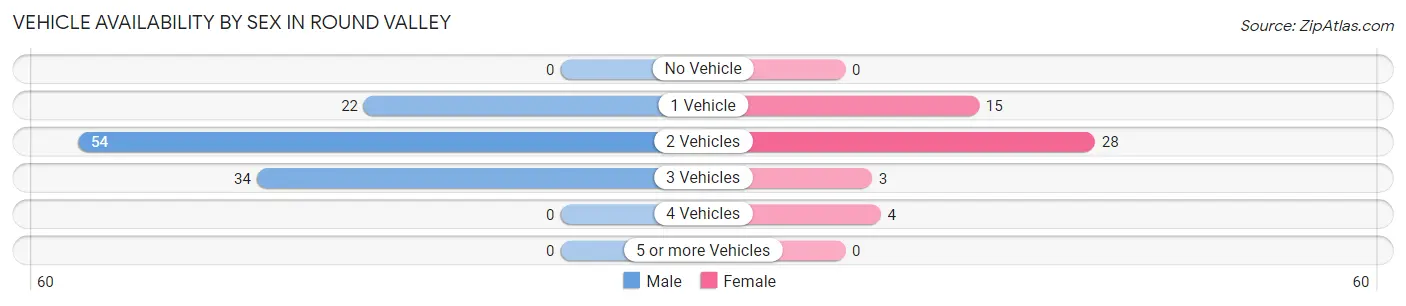
Vehicle Availability by Sex in Round Valley
The most prevalent vehicle ownership categories in Round Valley are males with 2 vehicles (54, accounting for 49.1%) and females with 2 vehicles (28, making up 108.0%).
| Vehicles Available | Male | Female |
| No Vehicle | 0 (0.0%) | 0 (0.0%) |
| 1 Vehicle | 22 (20.0%) | 15 (30.0%) |
| 2 Vehicles | 54 (49.1%) | 28 (56.0%) |
| 3 Vehicles | 34 (30.9%) | 3 (6.0%) |
| 4 Vehicles | 0 (0.0%) | 4 (8.0%) |
| 5 or more Vehicles | 0 (0.0%) | 0 (0.0%) |
| Total | 110 (100.0%) | 50 (100.0%) |
Commute Time in Round Valley
The most frequently occuring commute durations in Round Valley are 15 to 19 minutes (41 commuters, 27.7%), 30 to 34 minutes (25 commuters, 16.9%), and 45 to 59 minutes (24 commuters, 16.2%).
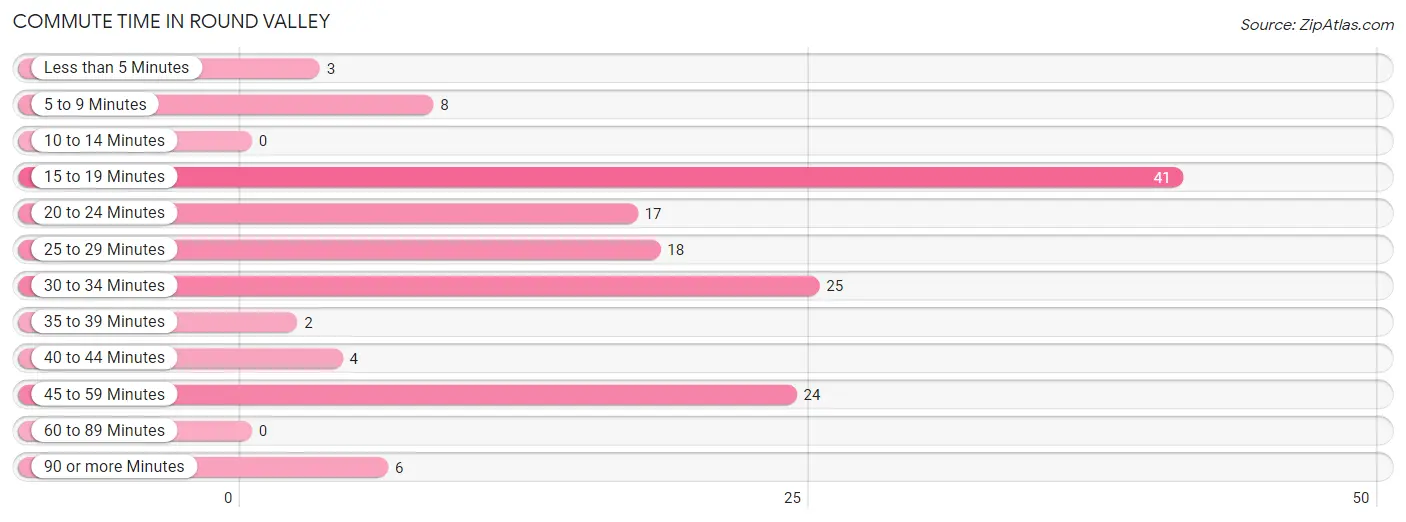
| Commute Time | # Commuters | % Commuters |
| Less than 5 Minutes | 3 | 2.0% |
| 5 to 9 Minutes | 8 | 5.4% |
| 10 to 14 Minutes | 0 | 0.0% |
| 15 to 19 Minutes | 41 | 27.7% |
| 20 to 24 Minutes | 17 | 11.5% |
| 25 to 29 Minutes | 18 | 12.2% |
| 30 to 34 Minutes | 25 | 16.9% |
| 35 to 39 Minutes | 2 | 1.3% |
| 40 to 44 Minutes | 4 | 2.7% |
| 45 to 59 Minutes | 24 | 16.2% |
| 60 to 89 Minutes | 0 | 0.0% |
| 90 or more Minutes | 6 | 4.1% |
Commute Time by Sex in Round Valley
The most common commute times in Round Valley are 15 to 19 minutes (32 commuters, 30.2%) for males and 20 to 24 minutes (13 commuters, 30.9%) for females.
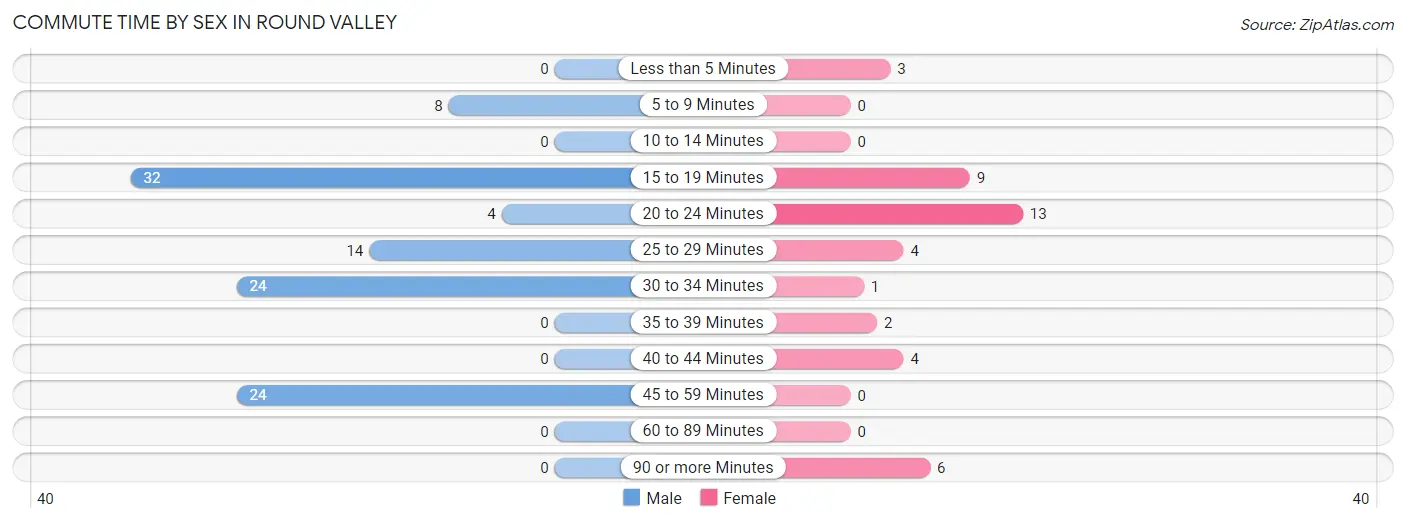
| Commute Time | Male | Female |
| Less than 5 Minutes | 0 (0.0%) | 3 (7.1%) |
| 5 to 9 Minutes | 8 (7.5%) | 0 (0.0%) |
| 10 to 14 Minutes | 0 (0.0%) | 0 (0.0%) |
| 15 to 19 Minutes | 32 (30.2%) | 9 (21.4%) |
| 20 to 24 Minutes | 4 (3.8%) | 13 (30.9%) |
| 25 to 29 Minutes | 14 (13.2%) | 4 (9.5%) |
| 30 to 34 Minutes | 24 (22.6%) | 1 (2.4%) |
| 35 to 39 Minutes | 0 (0.0%) | 2 (4.8%) |
| 40 to 44 Minutes | 0 (0.0%) | 4 (9.5%) |
| 45 to 59 Minutes | 24 (22.6%) | 0 (0.0%) |
| 60 to 89 Minutes | 0 (0.0%) | 0 (0.0%) |
| 90 or more Minutes | 0 (0.0%) | 6 (14.3%) |
Time of Departure to Work by Sex in Round Valley
The most frequent times of departure to work in Round Valley are 5:30 AM to 5:59 AM (31, 29.2%) for males and 9:00 AM to 9:59 AM (12, 28.6%) for females.
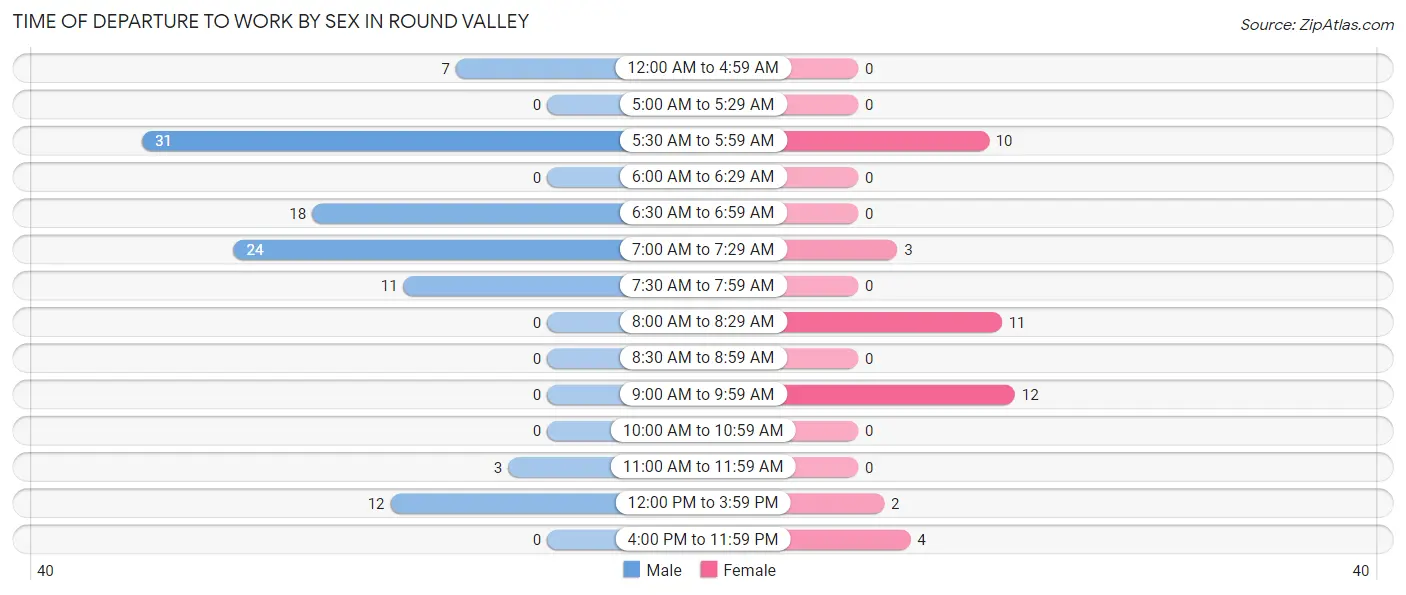
| Time of Departure | Male | Female |
| 12:00 AM to 4:59 AM | 7 (6.6%) | 0 (0.0%) |
| 5:00 AM to 5:29 AM | 0 (0.0%) | 0 (0.0%) |
| 5:30 AM to 5:59 AM | 31 (29.2%) | 10 (23.8%) |
| 6:00 AM to 6:29 AM | 0 (0.0%) | 0 (0.0%) |
| 6:30 AM to 6:59 AM | 18 (17.0%) | 0 (0.0%) |
| 7:00 AM to 7:29 AM | 24 (22.6%) | 3 (7.1%) |
| 7:30 AM to 7:59 AM | 11 (10.4%) | 0 (0.0%) |
| 8:00 AM to 8:29 AM | 0 (0.0%) | 11 (26.2%) |
| 8:30 AM to 8:59 AM | 0 (0.0%) | 0 (0.0%) |
| 9:00 AM to 9:59 AM | 0 (0.0%) | 12 (28.6%) |
| 10:00 AM to 10:59 AM | 0 (0.0%) | 0 (0.0%) |
| 11:00 AM to 11:59 AM | 3 (2.8%) | 0 (0.0%) |
| 12:00 PM to 3:59 PM | 12 (11.3%) | 2 (4.8%) |
| 4:00 PM to 11:59 PM | 0 (0.0%) | 4 (9.5%) |
| Total | 106 (100.0%) | 42 (100.0%) |
Housing Occupancy in Round Valley
Occupancy by Ownership in Round Valley
Of the total 154 dwellings in Round Valley, owner-occupied units account for 63 (40.9%), while renter-occupied units make up 91 (59.1%).
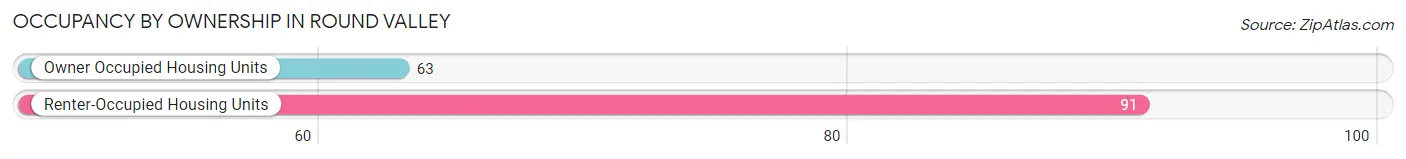
| Occupancy | # Housing Units | % Housing Units |
| Owner Occupied Housing Units | 63 | 40.9% |
| Renter-Occupied Housing Units | 91 | 59.1% |
| Total Occupied Housing Units | 154 | 100.0% |
Occupancy by Household Size in Round Valley
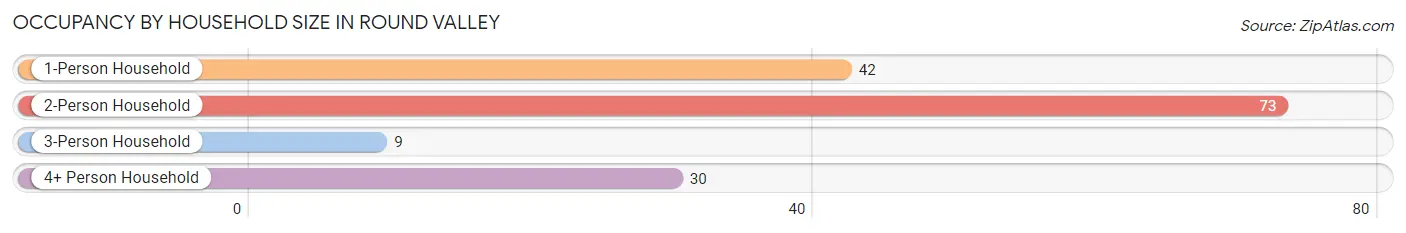
| Household Size | # Housing Units | % Housing Units |
| 1-Person Household | 42 | 27.3% |
| 2-Person Household | 73 | 47.4% |
| 3-Person Household | 9 | 5.8% |
| 4+ Person Household | 30 | 19.5% |
| Total Housing Units | 154 | 100.0% |
Occupancy by Ownership by Household Size in Round Valley
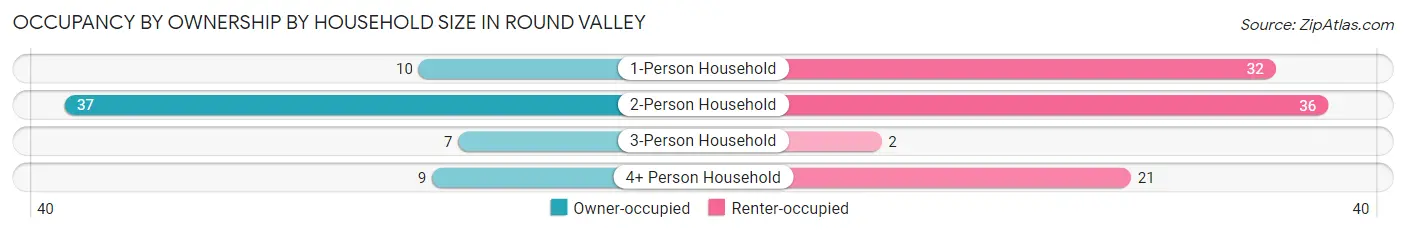
| Household Size | Owner-occupied | Renter-occupied |
| 1-Person Household | 10 (23.8%) | 32 (76.2%) |
| 2-Person Household | 37 (50.7%) | 36 (49.3%) |
| 3-Person Household | 7 (77.8%) | 2 (22.2%) |
| 4+ Person Household | 9 (30.0%) | 21 (70.0%) |
| Total Housing Units | 63 (40.9%) | 91 (59.1%) |
Occupancy by Educational Attainment in Round Valley
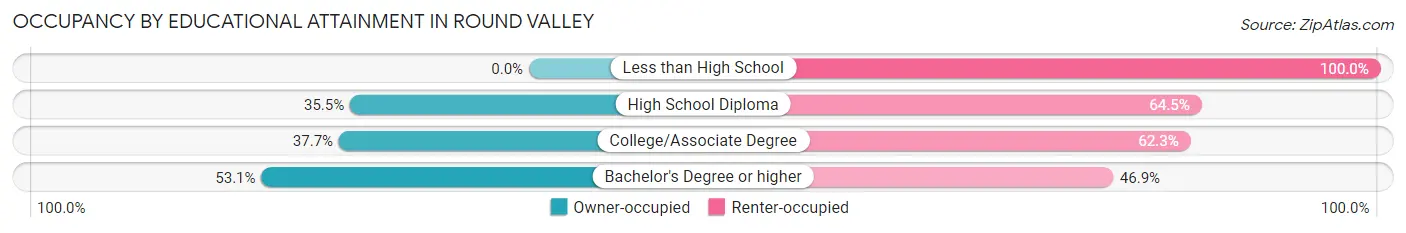
| Household Size | Owner-occupied | Renter-occupied |
| Less than High School | 0 (0.0%) | 5 (100.0%) |
| High School Diploma | 11 (35.5%) | 20 (64.5%) |
| College/Associate Degree | 26 (37.7%) | 43 (62.3%) |
| Bachelor's Degree or higher | 26 (53.1%) | 23 (46.9%) |
Occupancy by Age of Householder in Round Valley
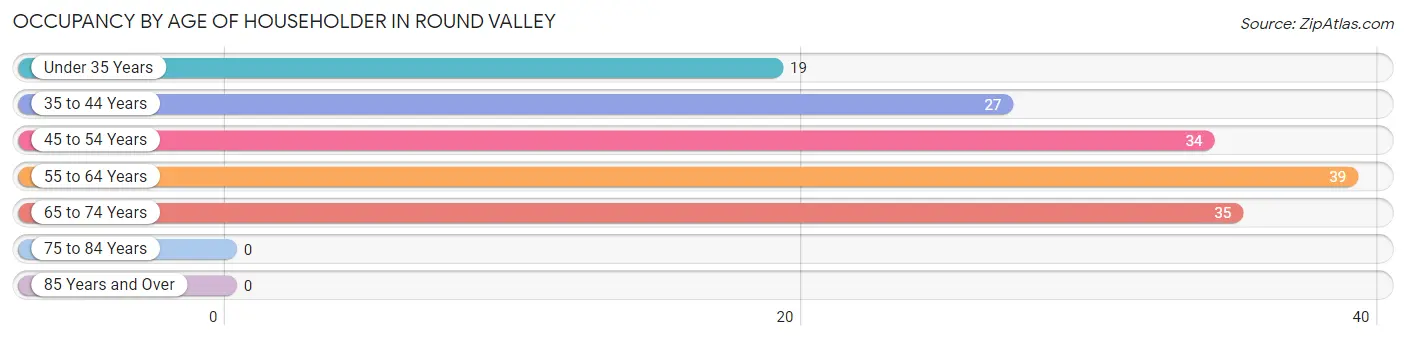
| Age Bracket | # Households | % Households |
| Under 35 Years | 19 | 12.3% |
| 35 to 44 Years | 27 | 17.5% |
| 45 to 54 Years | 34 | 22.1% |
| 55 to 64 Years | 39 | 25.3% |
| 65 to 74 Years | 35 | 22.7% |
| 75 to 84 Years | 0 | 0.0% |
| 85 Years and Over | 0 | 0.0% |
| Total | 154 | 100.0% |
Housing Finances in Round Valley
Median Income by Occupancy in Round Valley
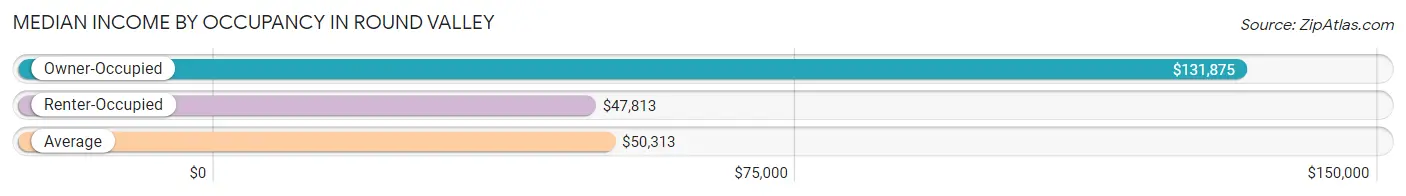
| Occupancy Type | # Households | Median Income |
| Owner-Occupied | 63 (40.9%) | $131,875 |
| Renter-Occupied | 91 (59.1%) | $47,813 |
| Average | 154 (100.0%) | $50,313 |
Occupancy by Householder Income Bracket in Round Valley
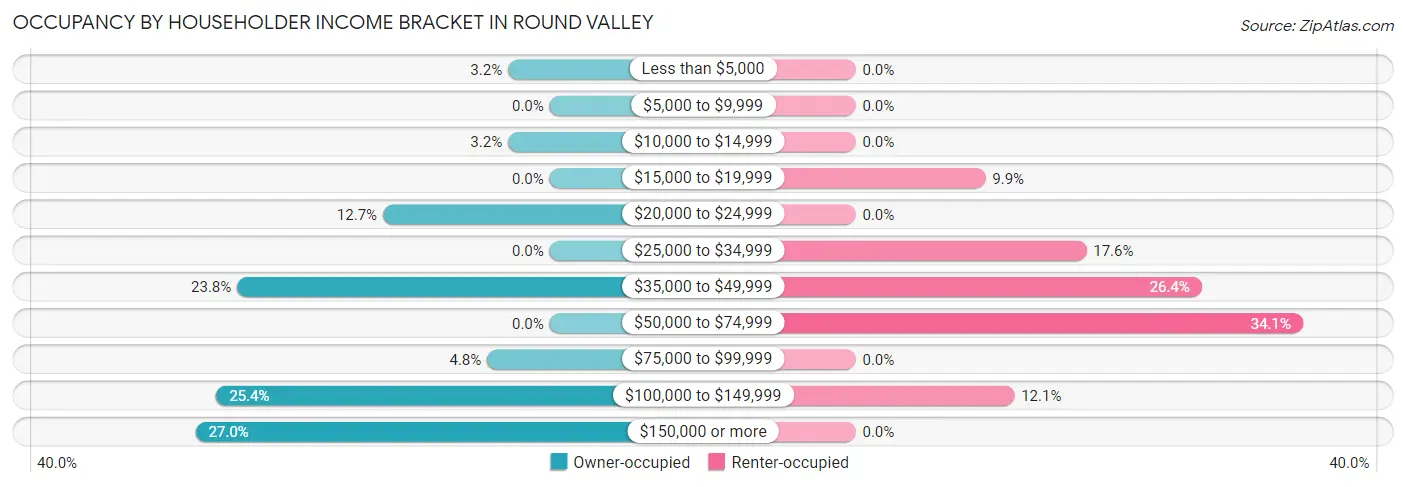
| Income Bracket | Owner-occupied | Renter-occupied |
| Less than $5,000 | 2 (3.2%) | 0 (0.0%) |
| $5,000 to $9,999 | 0 (0.0%) | 0 (0.0%) |
| $10,000 to $14,999 | 2 (3.2%) | 0 (0.0%) |
| $15,000 to $19,999 | 0 (0.0%) | 9 (9.9%) |
| $20,000 to $24,999 | 8 (12.7%) | 0 (0.0%) |
| $25,000 to $34,999 | 0 (0.0%) | 16 (17.6%) |
| $35,000 to $49,999 | 15 (23.8%) | 24 (26.4%) |
| $50,000 to $74,999 | 0 (0.0%) | 31 (34.1%) |
| $75,000 to $99,999 | 3 (4.8%) | 0 (0.0%) |
| $100,000 to $149,999 | 16 (25.4%) | 11 (12.1%) |
| $150,000 or more | 17 (27.0%) | 0 (0.0%) |
| Total | 63 (100.0%) | 91 (100.0%) |
Monthly Housing Cost Tiers in Round Valley
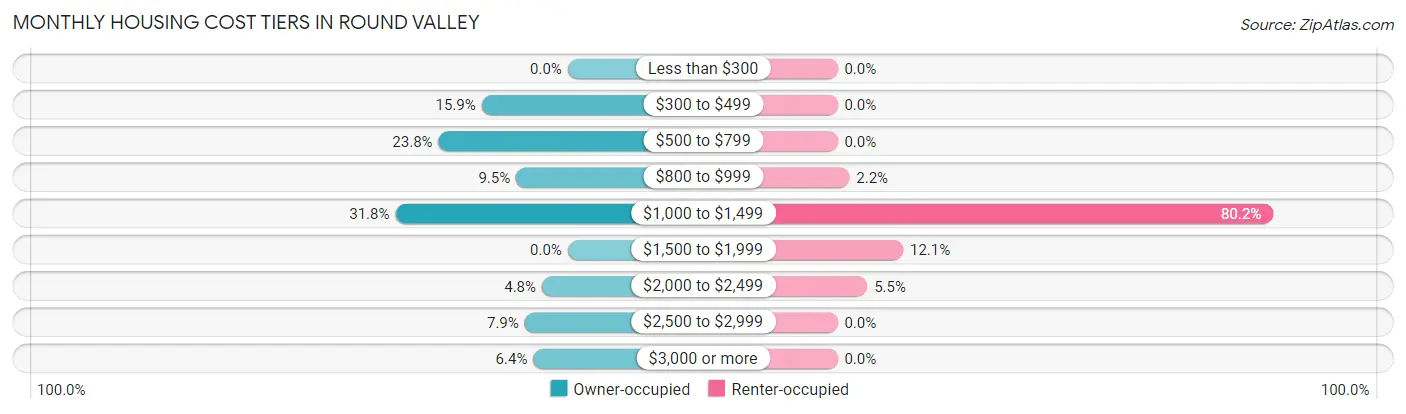
| Monthly Cost | Owner-occupied | Renter-occupied |
| Less than $300 | 0 (0.0%) | 0 (0.0%) |
| $300 to $499 | 10 (15.9%) | 0 (0.0%) |
| $500 to $799 | 15 (23.8%) | 0 (0.0%) |
| $800 to $999 | 6 (9.5%) | 2 (2.2%) |
| $1,000 to $1,499 | 20 (31.8%) | 73 (80.2%) |
| $1,500 to $1,999 | 0 (0.0%) | 11 (12.1%) |
| $2,000 to $2,499 | 3 (4.8%) | 5 (5.5%) |
| $2,500 to $2,999 | 5 (7.9%) | 0 (0.0%) |
| $3,000 or more | 4 (6.4%) | 0 (0.0%) |
| Total | 63 (100.0%) | 91 (100.0%) |
Physical Housing Characteristics in Round Valley
Housing Structures in Round Valley
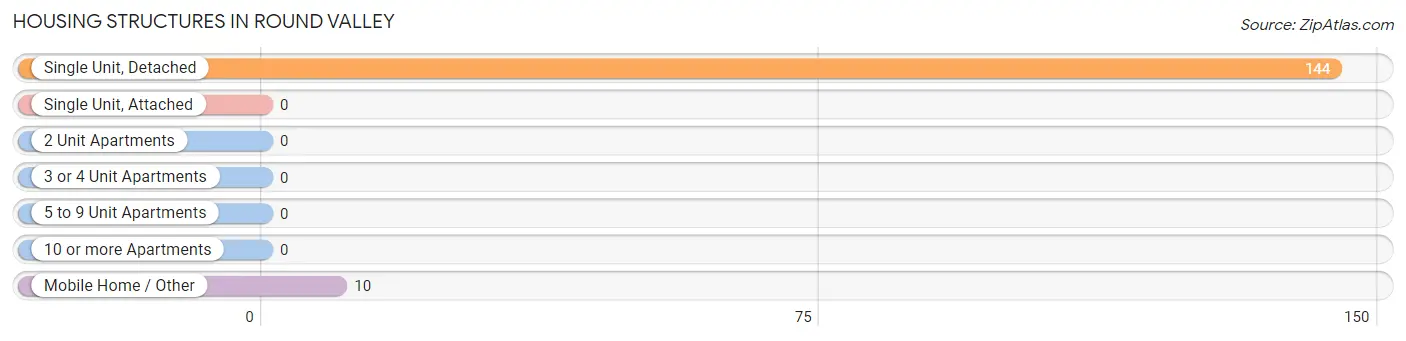
| Structure Type | # Housing Units | % Housing Units |
| Single Unit, Detached | 144 | 93.5% |
| Single Unit, Attached | 0 | 0.0% |
| 2 Unit Apartments | 0 | 0.0% |
| 3 or 4 Unit Apartments | 0 | 0.0% |
| 5 to 9 Unit Apartments | 0 | 0.0% |
| 10 or more Apartments | 0 | 0.0% |
| Mobile Home / Other | 10 | 6.5% |
| Total | 154 | 100.0% |
Housing Structures by Occupancy in Round Valley
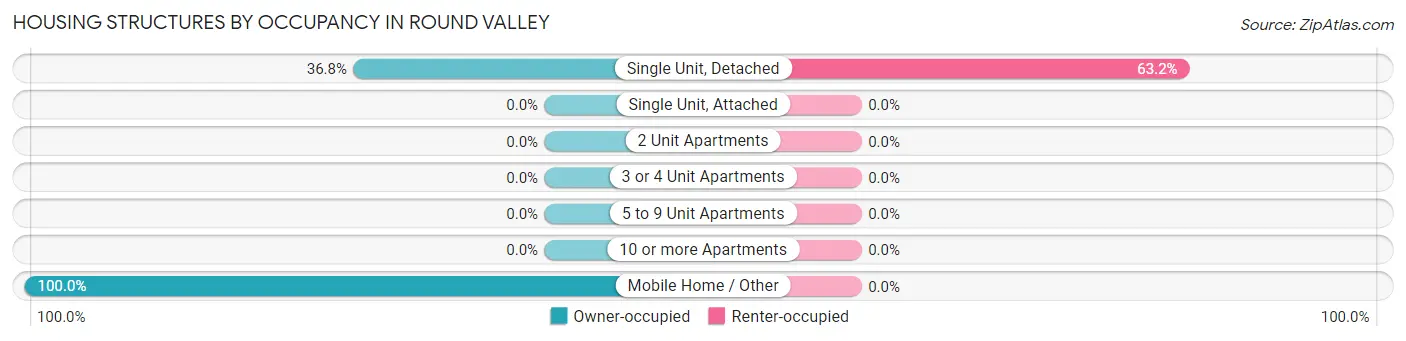
| Structure Type | Owner-occupied | Renter-occupied |
| Single Unit, Detached | 53 (36.8%) | 91 (63.2%) |
| Single Unit, Attached | 0 (0.0%) | 0 (0.0%) |
| 2 Unit Apartments | 0 (0.0%) | 0 (0.0%) |
| 3 or 4 Unit Apartments | 0 (0.0%) | 0 (0.0%) |
| 5 to 9 Unit Apartments | 0 (0.0%) | 0 (0.0%) |
| 10 or more Apartments | 0 (0.0%) | 0 (0.0%) |
| Mobile Home / Other | 10 (100.0%) | 0 (0.0%) |
| Total | 63 (40.9%) | 91 (59.1%) |
Housing Structures by Number of Rooms in Round Valley
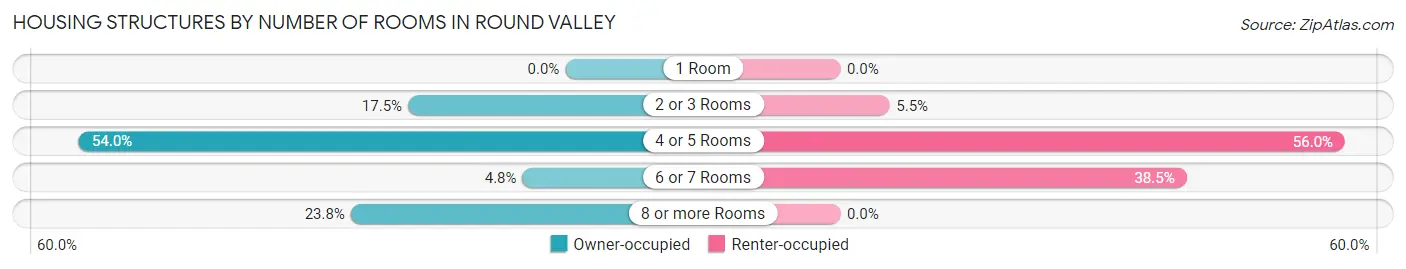
| Number of Rooms | Owner-occupied | Renter-occupied |
| 1 Room | 0 (0.0%) | 0 (0.0%) |
| 2 or 3 Rooms | 11 (17.5%) | 5 (5.5%) |
| 4 or 5 Rooms | 34 (54.0%) | 51 (56.0%) |
| 6 or 7 Rooms | 3 (4.8%) | 35 (38.5%) |
| 8 or more Rooms | 15 (23.8%) | 0 (0.0%) |
| Total | 63 (100.0%) | 91 (100.0%) |
Housing Structure by Heating Type in Round Valley
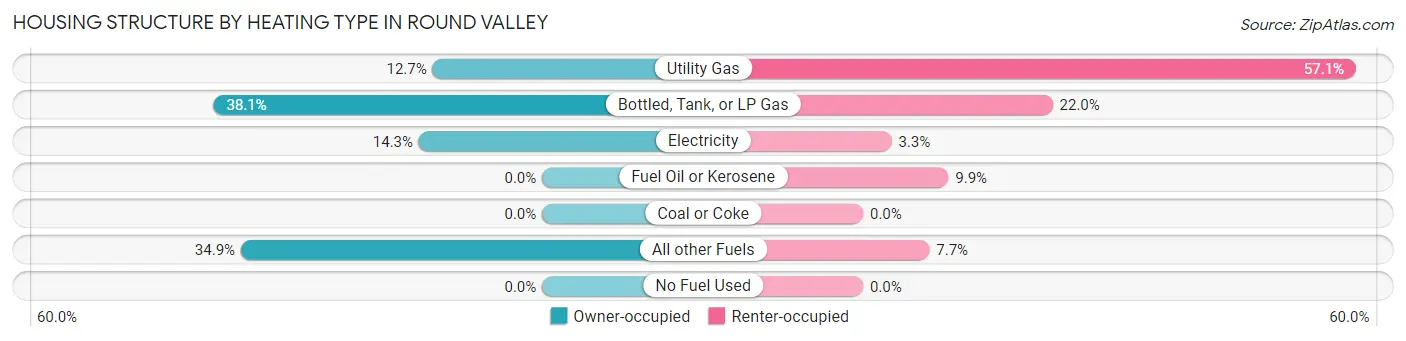
| Heating Type | Owner-occupied | Renter-occupied |
| Utility Gas | 8 (12.7%) | 52 (57.1%) |
| Bottled, Tank, or LP Gas | 24 (38.1%) | 20 (22.0%) |
| Electricity | 9 (14.3%) | 3 (3.3%) |
| Fuel Oil or Kerosene | 0 (0.0%) | 9 (9.9%) |
| Coal or Coke | 0 (0.0%) | 0 (0.0%) |
| All other Fuels | 22 (34.9%) | 7 (7.7%) |
| No Fuel Used | 0 (0.0%) | 0 (0.0%) |
| Total | 63 (100.0%) | 91 (100.0%) |
Household Vehicle Usage in Round Valley
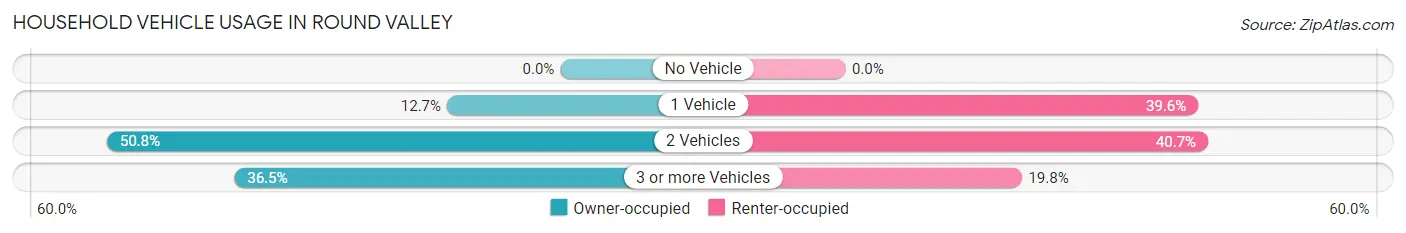
| Vehicles per Household | Owner-occupied | Renter-occupied |
| No Vehicle | 0 (0.0%) | 0 (0.0%) |
| 1 Vehicle | 8 (12.7%) | 36 (39.6%) |
| 2 Vehicles | 32 (50.8%) | 37 (40.7%) |
| 3 or more Vehicles | 23 (36.5%) | 18 (19.8%) |
| Total | 63 (100.0%) | 91 (100.0%) |
Real Estate & Mortgages in Round Valley
Real Estate and Mortgage Overview in Round Valley
| Characteristic | Without Mortgage | With Mortgage |
| Housing Units | 29 | 34 |
| Median Property Value | $648,800 | $0 |
| Median Household Income | $45,521 | $15 |
| Monthly Housing Costs | $842 | $4 |
| Real Estate Taxes | $3,654 | $0 |
Property Value by Mortgage Status in Round Valley
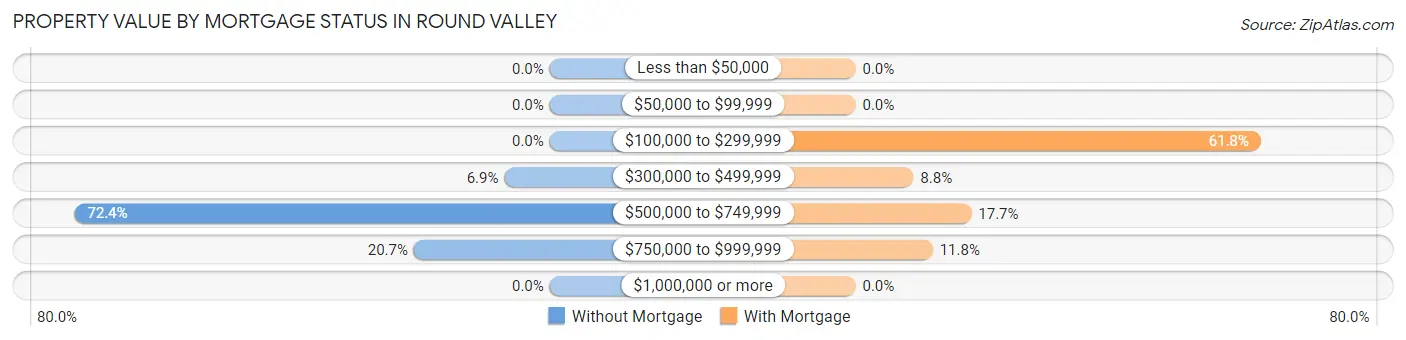
| Property Value | Without Mortgage | With Mortgage |
| Less than $50,000 | 0 (0.0%) | 0 (0.0%) |
| $50,000 to $99,999 | 0 (0.0%) | 0 (0.0%) |
| $100,000 to $299,999 | 0 (0.0%) | 21 (61.8%) |
| $300,000 to $499,999 | 2 (6.9%) | 3 (8.8%) |
| $500,000 to $749,999 | 21 (72.4%) | 6 (17.6%) |
| $750,000 to $999,999 | 6 (20.7%) | 4 (11.8%) |
| $1,000,000 or more | 0 (0.0%) | 0 (0.0%) |
| Total | 29 (100.0%) | 34 (100.0%) |
Household Income by Mortgage Status in Round Valley
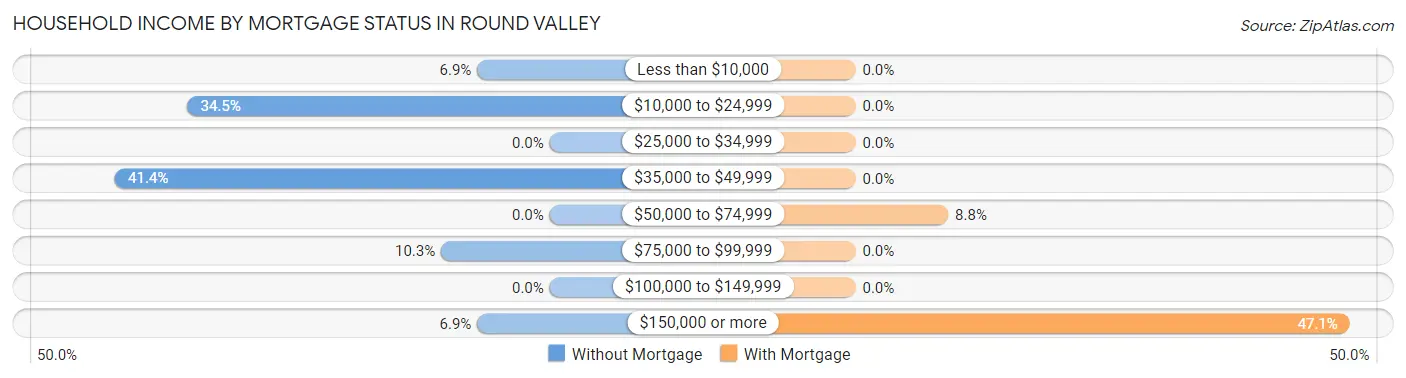
| Household Income | Without Mortgage | With Mortgage |
| Less than $10,000 | 2 (6.9%) | 0 (0.0%) |
| $10,000 to $24,999 | 10 (34.5%) | 0 (0.0%) |
| $25,000 to $34,999 | 0 (0.0%) | 0 (0.0%) |
| $35,000 to $49,999 | 12 (41.4%) | 0 (0.0%) |
| $50,000 to $74,999 | 0 (0.0%) | 3 (8.8%) |
| $75,000 to $99,999 | 3 (10.3%) | 0 (0.0%) |
| $100,000 to $149,999 | 0 (0.0%) | 0 (0.0%) |
| $150,000 or more | 2 (6.9%) | 16 (47.1%) |
| Total | 29 (100.0%) | 34 (100.0%) |
Property Value to Household Income Ratio in Round Valley
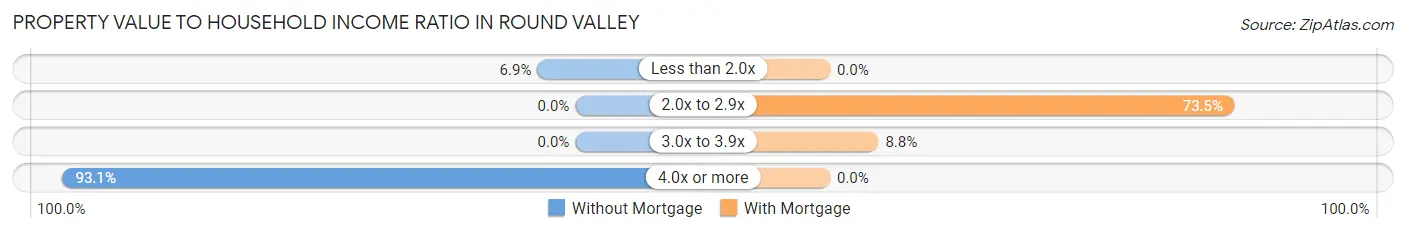
| Value-to-Income Ratio | Without Mortgage | With Mortgage |
| Less than 2.0x | 2 (6.9%) | 0 (0.0%) |
| 2.0x to 2.9x | 0 (0.0%) | 25 (73.5%) |
| 3.0x to 3.9x | 0 (0.0%) | 3 (8.8%) |
| 4.0x or more | 27 (93.1%) | 0 (0.0%) |
| Total | 29 (100.0%) | 34 (100.0%) |
Real Estate Taxes by Mortgage Status in Round Valley
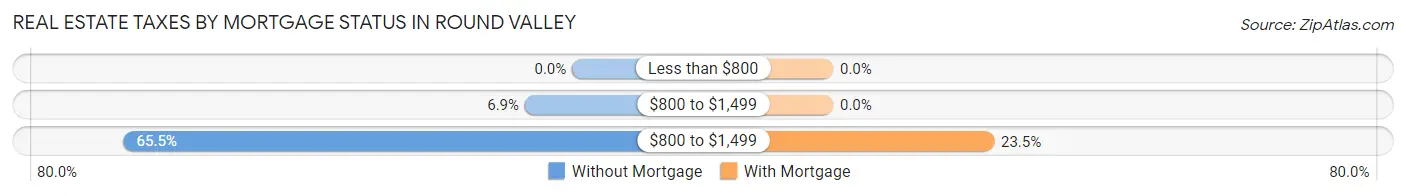
| Property Taxes | Without Mortgage | With Mortgage |
| Less than $800 | 0 (0.0%) | 0 (0.0%) |
| $800 to $1,499 | 2 (6.9%) | 0 (0.0%) |
| $800 to $1,499 | 19 (65.5%) | 8 (23.5%) |
| Total | 29 (100.0%) | 34 (100.0%) |
Health & Disability in Round Valley
Health Insurance Coverage by Age in Round Valley
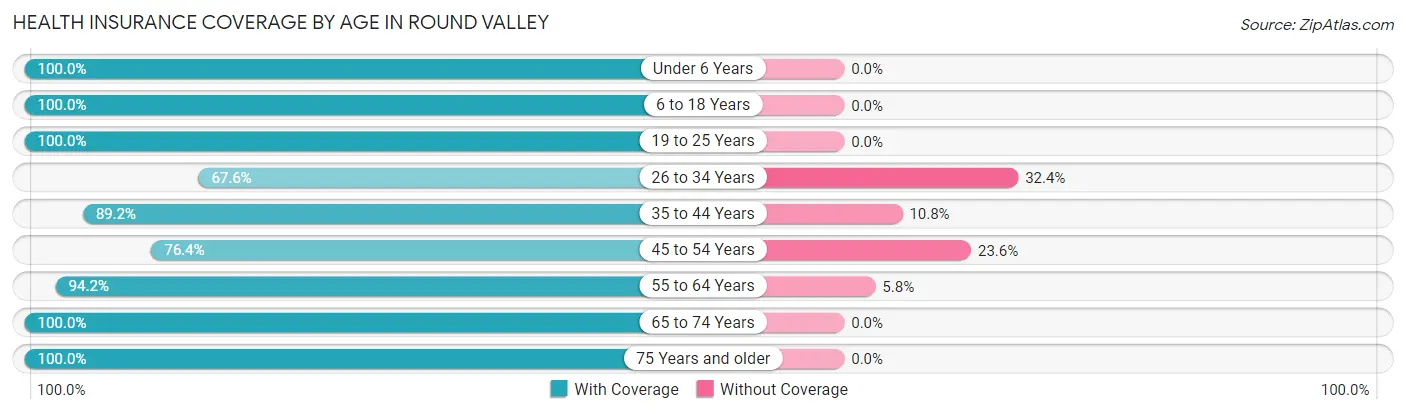
| Age Bracket | With Coverage | Without Coverage |
| Under 6 Years | 134 (100.0%) | 0 (0.0%) |
| 6 to 18 Years | 76 (100.0%) | 0 (0.0%) |
| 19 to 25 Years | 26 (100.0%) | 0 (0.0%) |
| 26 to 34 Years | 25 (67.6%) | 12 (32.4%) |
| 35 to 44 Years | 74 (89.2%) | 9 (10.8%) |
| 45 to 54 Years | 42 (76.4%) | 13 (23.6%) |
| 55 to 64 Years | 65 (94.2%) | 4 (5.8%) |
| 65 to 74 Years | 55 (100.0%) | 0 (0.0%) |
| 75 Years and older | 2 (100.0%) | 0 (0.0%) |
| Total | 499 (92.9%) | 38 (7.1%) |
Health Insurance Coverage by Citizenship Status in Round Valley
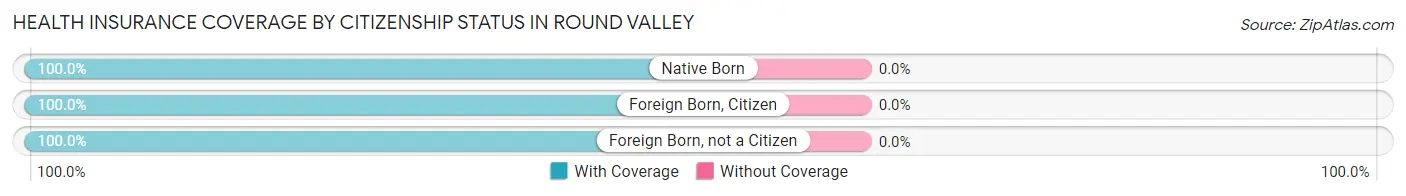
| Citizenship Status | With Coverage | Without Coverage |
| Native Born | 134 (100.0%) | 0 (0.0%) |
| Foreign Born, Citizen | 76 (100.0%) | 0 (0.0%) |
| Foreign Born, not a Citizen | 26 (100.0%) | 0 (0.0%) |
Health Insurance Coverage by Household Income in Round Valley
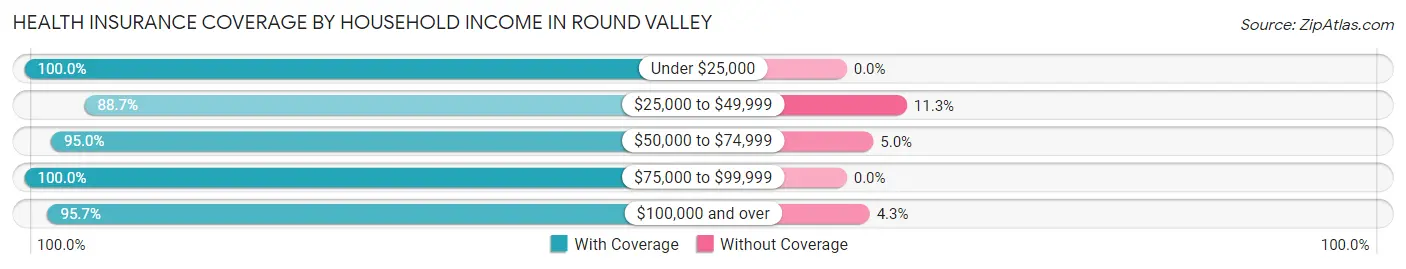
| Household Income | With Coverage | Without Coverage |
| Under $25,000 | 34 (100.0%) | 0 (0.0%) |
| $25,000 to $49,999 | 197 (88.7%) | 25 (11.3%) |
| $50,000 to $74,999 | 172 (95.0%) | 9 (5.0%) |
| $75,000 to $99,999 | 7 (100.0%) | 0 (0.0%) |
| $100,000 and over | 89 (95.7%) | 4 (4.3%) |
Public vs Private Health Insurance Coverage by Age in Round Valley
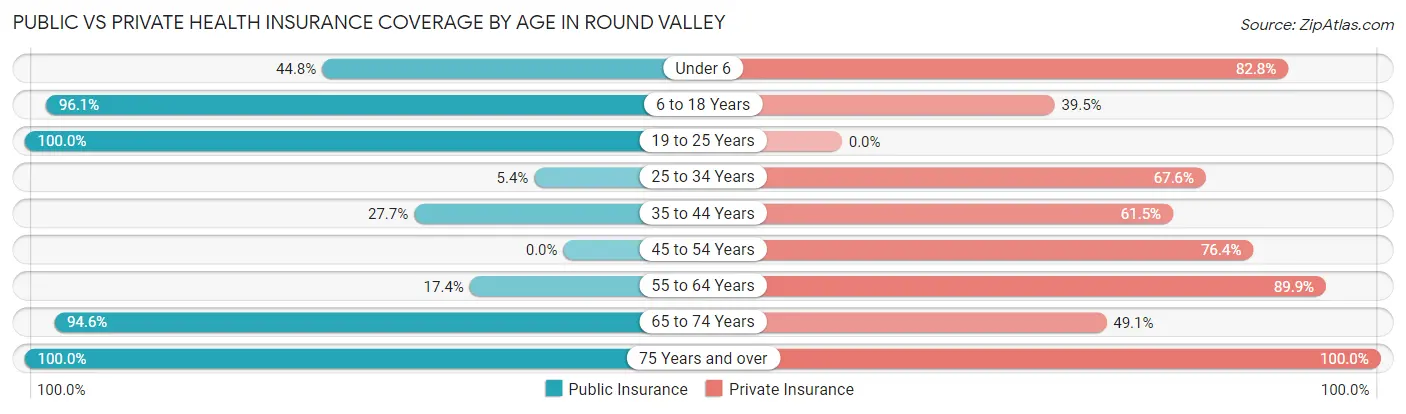
| Age Bracket | Public Insurance | Private Insurance |
| Under 6 | 60 (44.8%) | 111 (82.8%) |
| 6 to 18 Years | 73 (96.1%) | 30 (39.5%) |
| 19 to 25 Years | 26 (100.0%) | 0 (0.0%) |
| 25 to 34 Years | 2 (5.4%) | 25 (67.6%) |
| 35 to 44 Years | 23 (27.7%) | 51 (61.5%) |
| 45 to 54 Years | 0 (0.0%) | 42 (76.4%) |
| 55 to 64 Years | 12 (17.4%) | 62 (89.9%) |
| 65 to 74 Years | 52 (94.6%) | 27 (49.1%) |
| 75 Years and over | 2 (100.0%) | 2 (100.0%) |
| Total | 250 (46.6%) | 350 (65.2%) |
Disability Status by Sex by Age in Round Valley
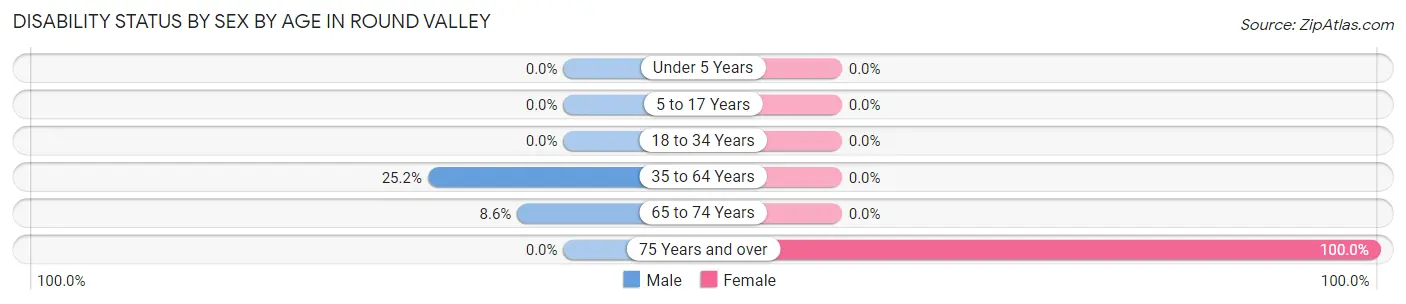
| Age Bracket | Male | Female |
| Under 5 Years | 0 (0.0%) | 0 (0.0%) |
| 5 to 17 Years | 0 (0.0%) | 0 (0.0%) |
| 18 to 34 Years | 0 (0.0%) | 0 (0.0%) |
| 35 to 64 Years | 37 (25.2%) | 0 (0.0%) |
| 65 to 74 Years | 3 (8.6%) | 0 (0.0%) |
| 75 Years and over | 0 (0.0%) | 2 (100.0%) |
Disability Class by Sex by Age in Round Valley
Disability Class: Hearing Difficulty
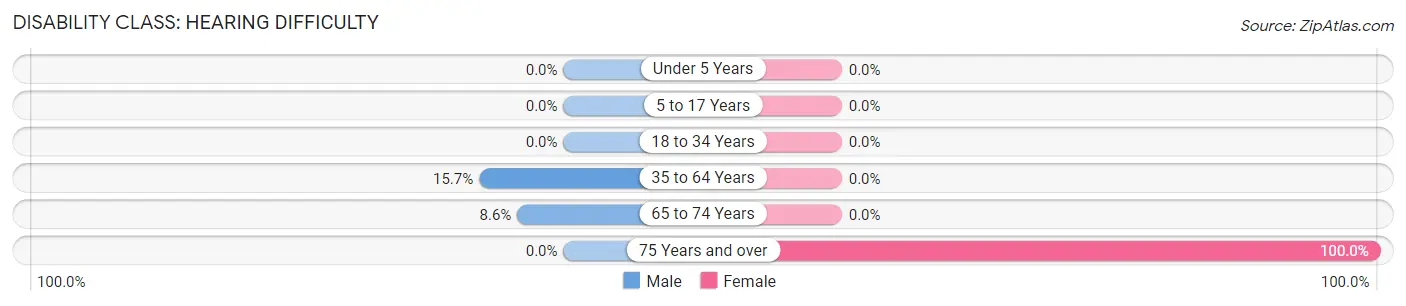
| Age Bracket | Male | Female |
| Under 5 Years | 0 (0.0%) | 0 (0.0%) |
| 5 to 17 Years | 0 (0.0%) | 0 (0.0%) |
| 18 to 34 Years | 0 (0.0%) | 0 (0.0%) |
| 35 to 64 Years | 23 (15.7%) | 0 (0.0%) |
| 65 to 74 Years | 3 (8.6%) | 0 (0.0%) |
| 75 Years and over | 0 (0.0%) | 2 (100.0%) |
Disability Class: Vision Difficulty
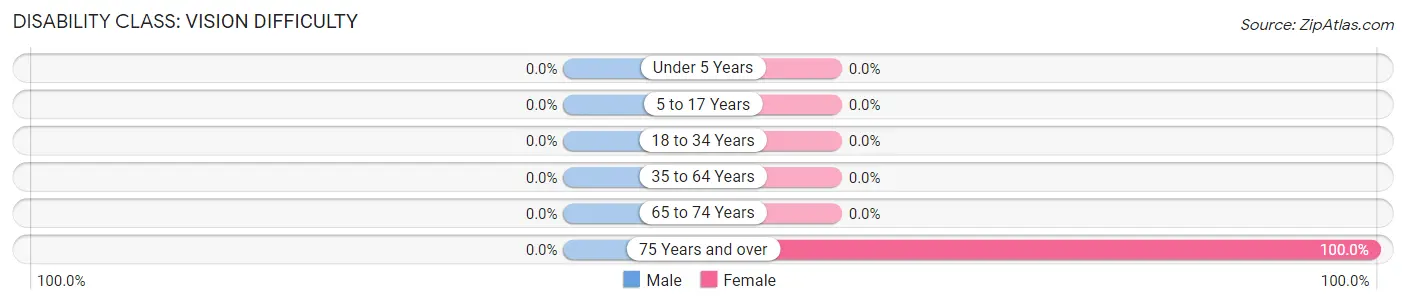
| Age Bracket | Male | Female |
| Under 5 Years | 0 (0.0%) | 0 (0.0%) |
| 5 to 17 Years | 0 (0.0%) | 0 (0.0%) |
| 18 to 34 Years | 0 (0.0%) | 0 (0.0%) |
| 35 to 64 Years | 0 (0.0%) | 0 (0.0%) |
| 65 to 74 Years | 0 (0.0%) | 0 (0.0%) |
| 75 Years and over | 0 (0.0%) | 2 (100.0%) |
Disability Class: Cognitive Difficulty
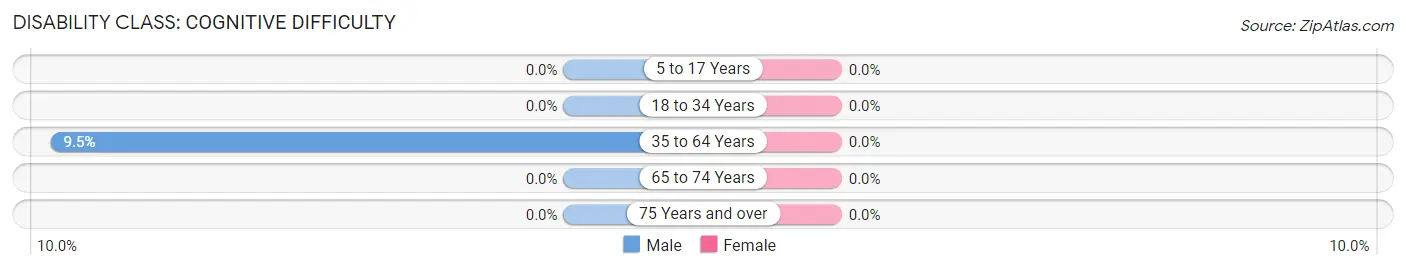
| Age Bracket | Male | Female |
| 5 to 17 Years | 0 (0.0%) | 0 (0.0%) |
| 18 to 34 Years | 0 (0.0%) | 0 (0.0%) |
| 35 to 64 Years | 14 (9.5%) | 0 (0.0%) |
| 65 to 74 Years | 0 (0.0%) | 0 (0.0%) |
| 75 Years and over | 0 (0.0%) | 0 (0.0%) |
Disability Class: Ambulatory Difficulty
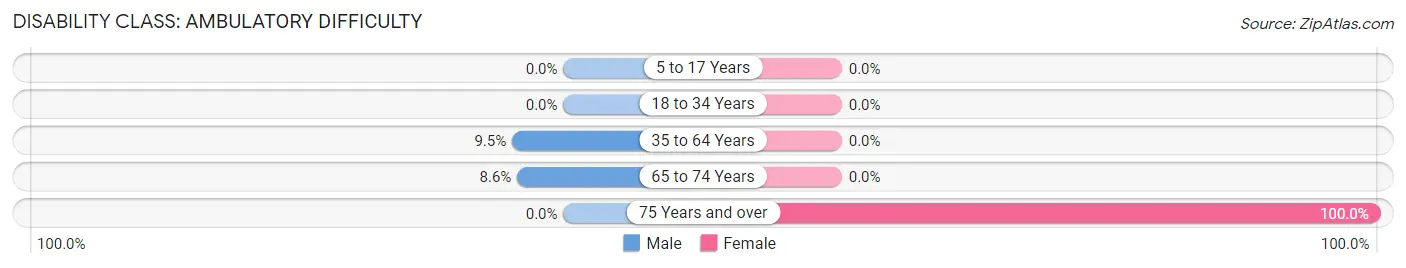
| Age Bracket | Male | Female |
| 5 to 17 Years | 0 (0.0%) | 0 (0.0%) |
| 18 to 34 Years | 0 (0.0%) | 0 (0.0%) |
| 35 to 64 Years | 14 (9.5%) | 0 (0.0%) |
| 65 to 74 Years | 3 (8.6%) | 0 (0.0%) |
| 75 Years and over | 0 (0.0%) | 2 (100.0%) |
Disability Class: Self-Care Difficulty
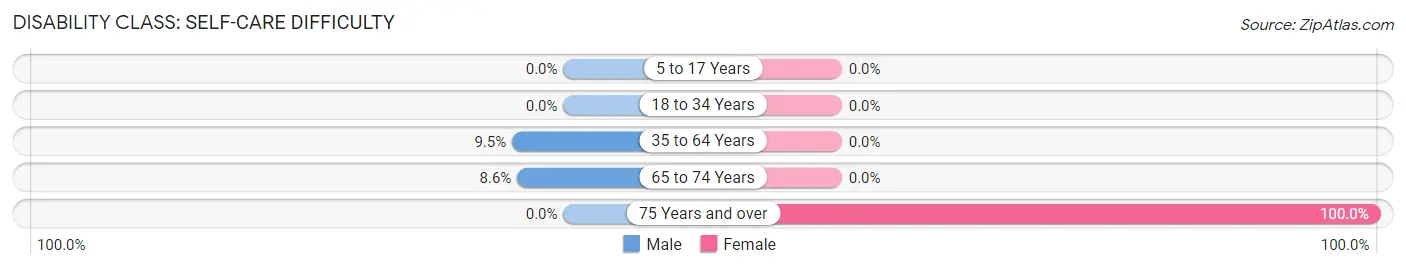
| Age Bracket | Male | Female |
| 5 to 17 Years | 0 (0.0%) | 0 (0.0%) |
| 18 to 34 Years | 0 (0.0%) | 0 (0.0%) |
| 35 to 64 Years | 14 (9.5%) | 0 (0.0%) |
| 65 to 74 Years | 3 (8.6%) | 0 (0.0%) |
| 75 Years and over | 0 (0.0%) | 2 (100.0%) |
Technology Access in Round Valley
Computing Device Access in Round Valley
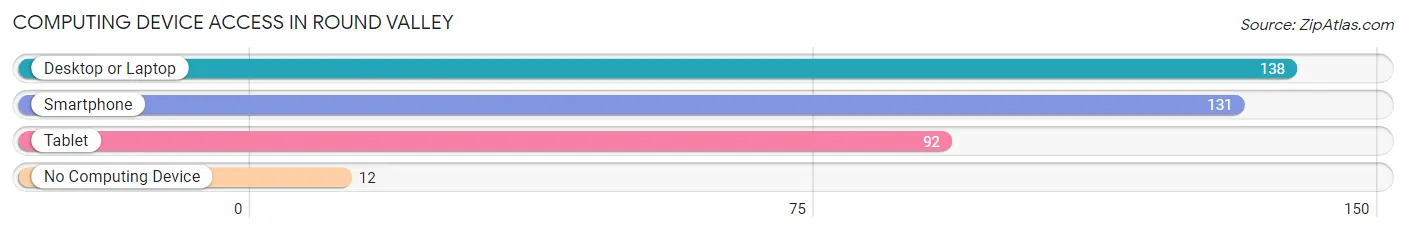
| Device Type | # Households | % Households |
| Desktop or Laptop | 138 | 89.6% |
| Smartphone | 131 | 85.1% |
| Tablet | 92 | 59.7% |
| No Computing Device | 12 | 7.8% |
| Total | 154 | 100.0% |
Internet Access in Round Valley
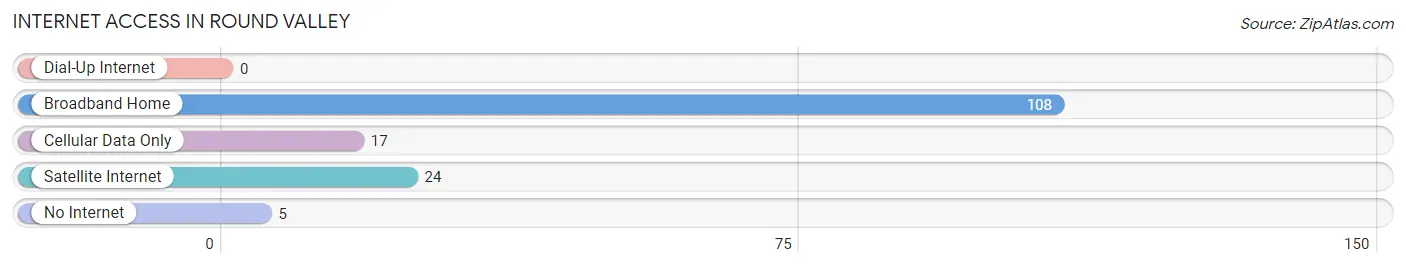
| Internet Type | # Households | % Households |
| Dial-Up Internet | 0 | 0.0% |
| Broadband Home | 108 | 70.1% |
| Cellular Data Only | 17 | 11.0% |
| Satellite Internet | 24 | 15.6% |
| No Internet | 5 | 3.3% |
| Total | 154 | 100.0% |
Round Valley Summary
Valley History
The Round Valley of California is located in Mendocino County, and is a large, flat valley surrounded by mountains. The valley is home to the Round Valley Indian Tribes, a federally recognized tribe of Native Americans. The Round Valley Indian Tribes are comprised of the Concow, Little Lake, Nomlaki, Pit River, and Wailaki tribes. The Round Valley Indian Tribes have lived in the valley for thousands of years, and their ancestors are believed to have been the first inhabitants of the area.
The first non-Native American settlers arrived in the Round Valley in the 1850s. These settlers were primarily ranchers and farmers, and they established small towns and settlements throughout the valley. The first post office in the valley was established in 1858, and the first school was built in 1864.
The Round Valley was also home to a large population of Chinese immigrants who worked in the area’s mines and on the railroads. The Chinese immigrants were an important part of the valley’s economy, and their presence in the area is still evident today.
In the late 19th century, the Round Valley was a popular destination for tourists, and the area was known for its natural beauty and abundant wildlife. The valley was also home to a thriving logging industry, and the timber harvested from the area was used to build homes and other structures throughout the region.
In the early 20th century, the Round Valley was the site of a large-scale irrigation project. The project was designed to bring water to the valley’s farms and ranches, and it was completed in the 1930s.
Geography
The Round Valley is located in the northern part of Mendocino County, California. It is a large, flat valley surrounded by mountains. The valley is approximately 25 miles long and 10 miles wide, and it is located at an elevation of 1,500 feet.
The valley is home to several rivers, including the Eel River, the Russian River, and the Navarro River. The valley is also home to several lakes, including Lake Pillsbury, Lake Mendocino, and Lake Sonoma.
The climate in the Round Valley is mild and temperate, with hot summers and cool winters. The average annual temperature is around 60 degrees Fahrenheit, and the average annual precipitation is around 20 inches.
Economy
The economy of the Round Valley is largely based on agriculture and tourism. The valley is home to several farms and ranches, and the area produces a variety of crops, including apples, pears, grapes, and walnuts. The valley is also home to several wineries, and the area is known for its high-quality wines.
Tourism is also an important part of the valley’s economy. The area is home to several state parks, including Lake Pillsbury State Park and Round Valley State Park. The valley is also home to several recreational activities, including fishing, camping, and hiking.
Demographics
As of the 2010 census, the population of the Round Valley was 8,945. The population is primarily white (77.3%), with smaller percentages of Native American (14.2%), Hispanic (4.2%), and Asian (2.3%) residents. The median household income in the valley is $45,000, and the median home value is $220,000.
Conclusion
The Round Valley of California is a large, flat valley surrounded by mountains. The valley is home to the Round Valley Indian Tribes, a federally recognized tribe of Native Americans. The valley is also home to a variety of farms and ranches, and the area is known for its high-quality wines. Tourism is also an important part of the valley’s economy, and the area is home to several state parks and recreational activities. The population of the Round Valley is primarily white, with smaller percentages of Native American, Hispanic, and Asian residents.
Common Questions
What is Per Capita Income in Round Valley?
Per Capita income in Round Valley is $27,014.
What is the Median Family Income in Round Valley?
Median Family Income in Round Valley is $46,667.
What is the Median Household income in Round Valley?
Median Household Income in Round Valley is $50,313.
What is Income or Wage Gap in Round Valley?
Income or Wage Gap in Round Valley is 1.3%.
Women in Round Valley earn 98.7 cents for every dollar earned by a man.
What is Inequality or Gini Index in Round Valley?
Inequality or Gini Index in Round Valley is 0.50.
What is the Total Population of Round Valley?
Total Population of Round Valley is 739.
What is the Total Male Population of Round Valley?
Total Male Population of Round Valley is 540.
What is the Total Female Population of Round Valley?
Total Female Population of Round Valley is 199.
What is the Ratio of Males per 100 Females in Round Valley?
There are 271.36 Males per 100 Females in Round Valley.
What is the Ratio of Females per 100 Males in Round Valley?
There are 36.85 Females per 100 Males in Round Valley.
What is the Median Population Age in Round Valley?
Median Population Age in Round Valley is 31.3 Years.
What is the Average Family Size in Round Valley
Average Family Size in Round Valley is 5.1 People.
What is the Average Household Size in Round Valley
Average Household Size in Round Valley is 3.5 People.
How Large is the Labor Force in Round Valley?
There are 169 People in the Labor Forcein in Round Valley.
What is the Percentage of People in the Labor Force in Round Valley?
31.9% of People are in the Labor Force in Round Valley.
What is the Unemployment Rate in Round Valley?
Unemployment Rate in Round Valley is 5.3%.