Cities with the Highest Percentage of Population Employed in Health Diagnosing & Treating in Colorado
RELATED REPORTS & OPTIONS
Health Diagnosing & Treating
Colorado
Compare Cities
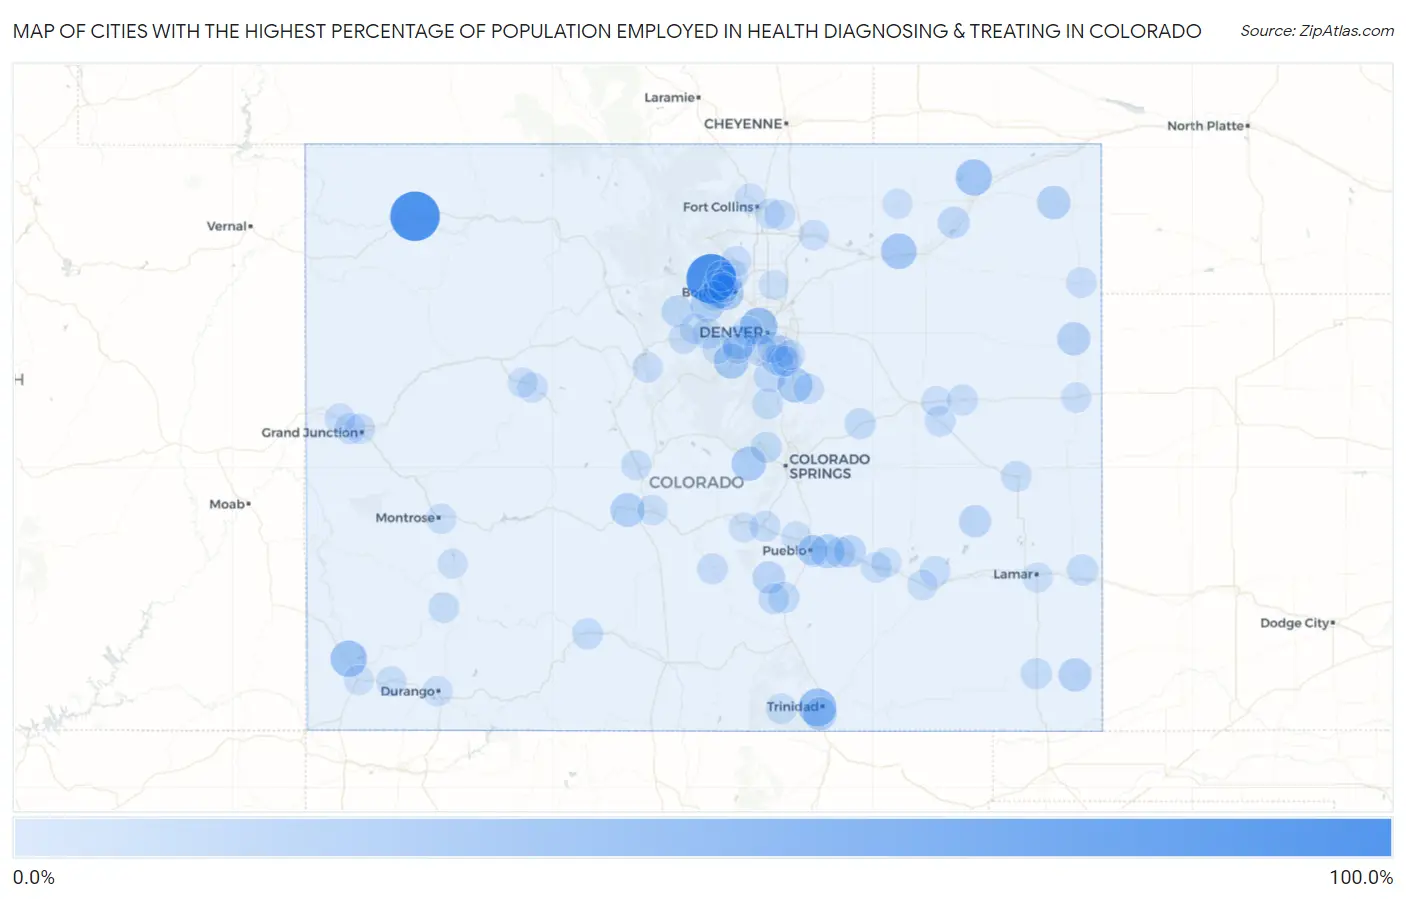
Map of Cities with the Highest Percentage of Population Employed in Health Diagnosing & Treating in Colorado
0.0%
100.0%
Cities with the Highest Percentage of Population Employed in Health Diagnosing & Treating in Colorado
| City | % Employed | vs State | vs National | |
| 1. | Hidden Lake | 100.0% | 5.8%(+94.2)#1 | 6.2%(+93.8)#14 |
| 2. | Maybell | 100.0% | 5.8%(+94.2)#2 | 6.2%(+93.8)#18 |
| 3. | Jansen | 42.9% | 5.8%(+37.0)#3 | 6.2%(+36.6)#119 |
| 4. | Arapahoe | 41.7% | 5.8%(+35.9)#4 | 6.2%(+35.4)#134 |
| 5. | Lakeside | 40.0% | 5.8%(+34.2)#5 | 6.2%(+33.8)#145 |
| 6. | Lewis | 36.1% | 5.8%(+30.3)#6 | 6.2%(+29.8)#180 |
| 7. | Padroni | 35.7% | 5.8%(+29.9)#7 | 6.2%(+29.5)#190 |
| 8. | Lazear | 32.6% | 5.8%(+26.8)#8 | 6.2%(+26.4)#250 |
| 9. | Morgan Heights | 32.2% | 5.8%(+26.4)#9 | 6.2%(+26.0)#262 |
| 10. | Tall Timber | 29.8% | 5.8%(+24.0)#10 | 6.2%(+23.6)#310 |
| 11. | Franktown | 28.8% | 5.8%(+23.0)#11 | 6.2%(+22.6)#321 |
| 12. | Aspen Park | 28.5% | 5.8%(+22.7)#12 | 6.2%(+22.2)#340 |
| 13. | Midland | 26.9% | 5.8%(+21.1)#13 | 6.2%(+20.6)#377 |
| 14. | Sugarloaf | 26.8% | 5.8%(+21.0)#14 | 6.2%(+20.5)#380 |
| 15. | Echo Hills | 25.9% | 5.8%(+20.1)#15 | 6.2%(+19.6)#415 |
| 16. | Maysville | 24.8% | 5.8%(+18.9)#16 | 6.2%(+18.5)#458 |
| 17. | Vineland | 24.4% | 5.8%(+18.5)#17 | 6.2%(+18.1)#474 |
| 18. | Rollinsville | 23.7% | 5.8%(+17.9)#18 | 6.2%(+17.5)#506 |
| 19. | Idledale | 22.8% | 5.8%(+17.0)#19 | 6.2%(+16.6)#559 |
| 20. | Starkville | 22.2% | 5.8%(+16.4)#20 | 6.2%(+16.0)#587 |
| 21. | Paoli | 22.2% | 5.8%(+16.4)#21 | 6.2%(+16.0)#591 |
| 22. | Idalia | 21.4% | 5.8%(+15.6)#22 | 6.2%(+15.2)#633 |
| 23. | Walsh | 21.1% | 5.8%(+15.3)#23 | 6.2%(+14.9)#651 |
| 24. | Beulah Valley | 18.1% | 5.8%(+12.3)#24 | 6.2%(+11.9)#944 |
| 25. | Haswell | 16.7% | 5.8%(+10.9)#25 | 6.2%(+10.4)#1,156 |
| 26. | Boone | 16.0% | 5.8%(+10.2)#26 | 6.2%(+9.80)#1,277 |
| 27. | Sedalia | 15.8% | 5.8%(+9.98)#27 | 6.2%(+9.54)#1,333 |
| 28. | Merino | 15.6% | 5.8%(+9.76)#28 | 6.2%(+9.32)#1,380 |
| 29. | Winter Park | 14.6% | 5.8%(+8.82)#29 | 6.2%(+8.38)#1,607 |
| 30. | Bow Mar | 14.4% | 5.8%(+8.62)#30 | 6.2%(+8.19)#1,669 |
| 31. | Colorado City | 13.1% | 5.8%(+7.33)#31 | 6.2%(+6.89)#2,125 |
| 32. | Meridian | 13.1% | 5.8%(+7.27)#32 | 6.2%(+6.83)#2,147 |
| 33. | Blende | 12.7% | 5.8%(+6.93)#33 | 6.2%(+6.49)#2,313 |
| 34. | Hartman | 12.5% | 5.8%(+6.69)#34 | 6.2%(+6.26)#2,447 |
| 35. | Springfield | 12.3% | 5.8%(+6.44)#35 | 6.2%(+6.01)#2,557 |
| 36. | Cherry Creek | 11.9% | 5.8%(+6.11)#36 | 6.2%(+5.67)#2,713 |
| 37. | Ramah | 11.8% | 5.8%(+5.96)#37 | 6.2%(+5.52)#2,802 |
| 38. | Gerrard | 11.7% | 5.8%(+5.92)#38 | 6.2%(+5.48)#2,814 |
| 39. | Cascade Chipita Park | 11.7% | 5.8%(+5.91)#39 | 6.2%(+5.48)#2,818 |
| 40. | Avondale | 11.3% | 5.8%(+5.45)#40 | 6.2%(+5.01)#3,147 |
| 41. | Arriba | 11.0% | 5.8%(+5.19)#41 | 6.2%(+4.76)#3,327 |
| 42. | Penrose | 10.9% | 5.8%(+5.08)#42 | 6.2%(+4.65)#3,392 |
| 43. | Kit Carson | 10.9% | 5.8%(+5.06)#43 | 6.2%(+4.62)#3,406 |
| 44. | Altona | 10.6% | 5.8%(+4.75)#44 | 6.2%(+4.31)#3,678 |
| 45. | Acres Green | 10.5% | 5.8%(+4.69)#45 | 6.2%(+4.26)#3,739 |
| 46. | Westcliffe | 10.4% | 5.8%(+4.60)#46 | 6.2%(+4.16)#3,813 |
| 47. | Ophir | 10.3% | 5.8%(+4.51)#47 | 6.2%(+4.07)#3,898 |
| 48. | Perry Park | 10.2% | 5.8%(+4.40)#48 | 6.2%(+3.97)#4,002 |
| 49. | Cheraw | 10.0% | 5.8%(+4.19)#49 | 6.2%(+3.76)#4,210 |
| 50. | Weston | 10.0% | 5.8%(+4.19)#50 | 6.2%(+3.76)#4,223 |
| 51. | Redlands | 9.9% | 5.8%(+4.09)#51 | 6.2%(+3.65)#4,319 |
| 52. | Rye | 9.8% | 5.8%(+3.95)#52 | 6.2%(+3.51)#4,485 |
| 53. | Hugo | 9.7% | 5.8%(+3.90)#53 | 6.2%(+3.46)#4,533 |
| 54. | Severance | 9.7% | 5.8%(+3.88)#54 | 6.2%(+3.44)#4,552 |
| 55. | Downieville Lawson Dumont | 9.6% | 5.8%(+3.81)#55 | 6.2%(+3.37)#4,628 |
| 56. | Wray | 9.4% | 5.8%(+3.59)#56 | 6.2%(+3.15)#4,893 |
| 57. | Cherry Hills Village | 9.3% | 5.8%(+3.47)#57 | 6.2%(+3.03)#5,058 |
| 58. | Four Square Mile | 9.3% | 5.8%(+3.47)#58 | 6.2%(+3.03)#5,063 |
| 59. | Fruita | 9.2% | 5.8%(+3.38)#59 | 6.2%(+2.95)#5,136 |
| 60. | Gold Hill | 9.1% | 5.8%(+3.33)#60 | 6.2%(+2.89)#5,218 |
| 61. | Kersey | 9.0% | 5.8%(+3.23)#61 | 6.2%(+2.79)#5,361 |
| 62. | Sterling Ranch | 9.0% | 5.8%(+3.21)#62 | 6.2%(+2.78)#5,385 |
| 63. | Stepping Stone | 9.0% | 5.8%(+3.20)#63 | 6.2%(+2.76)#5,419 |
| 64. | Lazy Acres | 8.8% | 5.8%(+3.03)#64 | 6.2%(+2.60)#5,644 |
| 65. | Fowler | 8.8% | 5.8%(+3.00)#65 | 6.2%(+2.56)#5,685 |
| 66. | Silver Plume | 8.8% | 5.8%(+2.98)#66 | 6.2%(+2.55)#5,714 |
| 67. | Swink | 8.7% | 5.8%(+2.94)#67 | 6.2%(+2.51)#5,778 |
| 68. | Laporte | 8.7% | 5.8%(+2.89)#68 | 6.2%(+2.45)#5,845 |
| 69. | Lyons | 8.6% | 5.8%(+2.83)#69 | 6.2%(+2.39)#5,947 |
| 70. | Salida | 8.6% | 5.8%(+2.79)#70 | 6.2%(+2.35)#6,012 |
| 71. | Elizabeth | 8.6% | 5.8%(+2.77)#71 | 6.2%(+2.34)#6,039 |
| 72. | Idaho Springs | 8.5% | 5.8%(+2.71)#72 | 6.2%(+2.27)#6,146 |
| 73. | Basalt | 8.4% | 5.8%(+2.62)#73 | 6.2%(+2.18)#6,282 |
| 74. | Grand Junction | 8.4% | 5.8%(+2.61)#74 | 6.2%(+2.17)#6,302 |
| 75. | Grand View Estates | 8.4% | 5.8%(+2.60)#75 | 6.2%(+2.16)#6,311 |
| 76. | Breckenridge | 8.2% | 5.8%(+2.42)#76 | 6.2%(+1.98)#6,603 |
| 77. | Upper Bear Creek | 8.2% | 5.8%(+2.40)#77 | 6.2%(+1.96)#6,633 |
| 78. | Montrose | 8.2% | 5.8%(+2.38)#78 | 6.2%(+1.94)#6,671 |
| 79. | Burlington | 8.2% | 5.8%(+2.36)#79 | 6.2%(+1.93)#6,695 |
| 80. | Foxfield | 8.1% | 5.8%(+2.32)#80 | 6.2%(+1.89)#6,756 |
| 81. | Mancos | 8.1% | 5.8%(+2.30)#81 | 6.2%(+1.86)#6,812 |
| 82. | Buena Vista | 8.1% | 5.8%(+2.29)#82 | 6.2%(+1.85)#6,814 |
| 83. | Genoa | 8.1% | 5.8%(+2.26)#83 | 6.2%(+1.82)#6,880 |
| 84. | Timnath | 7.9% | 5.8%(+2.13)#84 | 6.2%(+1.69)#7,114 |
| 85. | St Ann Highlands | 7.9% | 5.8%(+2.11)#85 | 6.2%(+1.68)#7,139 |
| 86. | Dacono | 7.9% | 5.8%(+2.10)#86 | 6.2%(+1.66)#7,168 |
| 87. | Jamestown | 7.8% | 5.8%(+2.03)#87 | 6.2%(+1.59)#7,312 |
| 88. | Pueblo West | 7.8% | 5.8%(+1.98)#88 | 6.2%(+1.54)#7,406 |
| 89. | Durango | 7.7% | 5.8%(+1.89)#89 | 6.2%(+1.45)#7,551 |
| 90. | Olney Springs | 7.6% | 5.8%(+1.83)#90 | 6.2%(+1.39)#7,706 |
| 91. | Ridgway | 7.6% | 5.8%(+1.78)#91 | 6.2%(+1.34)#7,826 |
| 92. | Applewood | 7.5% | 5.8%(+1.70)#92 | 6.2%(+1.26)#7,997 |
| 93. | Indian Hills | 7.5% | 5.8%(+1.69)#93 | 6.2%(+1.26)#8,006 |
| 94. | Lamar | 7.4% | 5.8%(+1.62)#94 | 6.2%(+1.18)#8,163 |
| 95. | Raymer New Raymer | 7.4% | 5.8%(+1.60)#95 | 6.2%(+1.16)#8,221 |
| 96. | Crisman | 7.4% | 5.8%(+1.57)#96 | 6.2%(+1.14)#8,275 |
| 97. | Cortez | 7.4% | 5.8%(+1.57)#97 | 6.2%(+1.14)#8,277 |
| 98. | Brookside | 7.3% | 5.8%(+1.53)#98 | 6.2%(+1.09)#8,384 |
| 99. | Catherine | 7.3% | 5.8%(+1.53)#99 | 6.2%(+1.09)#8,386 |
| 100. | Pueblo | 7.3% | 5.8%(+1.50)#100 | 6.2%(+1.06)#8,469 |
Common Questions
What are the Top 10 Cities with the Highest Percentage of Population Employed in Health Diagnosing & Treating in Colorado?
Top 10 Cities with the Highest Percentage of Population Employed in Health Diagnosing & Treating in Colorado are:
#1
100.0%
#2
100.0%
#3
42.9%
#4
40.0%
#5
36.1%
#6
35.7%
#7
32.2%
#8
29.8%
#9
28.8%
#10
28.5%
What city has the Highest Percentage of Population Employed in Health Diagnosing & Treating in Colorado?
Hidden Lake has the Highest Percentage of Population Employed in Health Diagnosing & Treating in Colorado with 100.0%.
What is the Percentage of Population Employed in Health Diagnosing & Treating in the State of Colorado?
Percentage of Population Employed in Health Diagnosing & Treating in Colorado is 5.8%.
What is the Percentage of Population Employed in Health Diagnosing & Treating in the United States?
Percentage of Population Employed in Health Diagnosing & Treating in the United States is 6.2%.