Loma Linda, CA Map & Demographics
Loma Linda Map
Loma Linda Overview
$37,841
PER CAPITA INCOME
$89,014
AVG FAMILY INCOME
$70,685
AVG HOUSEHOLD INCOME
11.7%
WAGE / INCOME GAP [ % ]
88.3¢/ $1
WAGE / INCOME GAP [ $ ]
0.48
INEQUALITY / GINI INDEX
24,883
TOTAL POPULATION
11,399
MALE POPULATION
13,484
FEMALE POPULATION
84.54
MALES / 100 FEMALES
118.29
FEMALES / 100 MALES
37.8
MEDIAN AGE
3.2
AVG FAMILY SIZE
2.6
AVG HOUSEHOLD SIZE
12,157
LABOR FORCE [ PEOPLE ]
58.6%
PERCENT IN LABOR FORCE
7.2%
UNEMPLOYMENT RATE
Loma Linda Area Codes
Income in Loma Linda
Income Overview in Loma Linda
Per Capita Income in Loma Linda is $37,841, while median incomes of families and households are $89,014 and $70,685 respectively.
| Characteristic | Number | Measure |
| Per Capita Income | 24,883 | $37,841 |
| Median Family Income | 5,989 | $89,014 |
| Mean Family Income | 5,989 | $114,542 |
| Median Household Income | 9,138 | $70,685 |
| Mean Household Income | 9,138 | $99,095 |
| Income Deficit | 5,989 | $0 |
| Wage / Income Gap (%) | 24,883 | 11.66% |
| Wage / Income Gap ($) | 24,883 | 88.34¢ per $1 |
| Gini / Inequality Index | 24,883 | 0.48 |
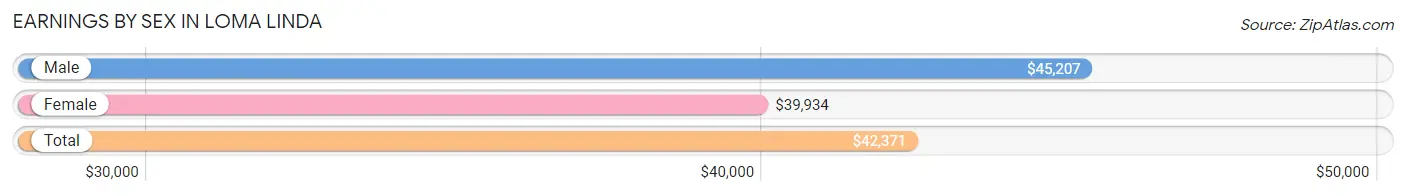
Earnings by Sex in Loma Linda
Average Earnings in Loma Linda are $42,371, $45,207 for men and $39,934 for women, a difference of 11.7%.
| Sex | Number | Average Earnings |
| Male | 6,033 (49.3%) | $45,207 |
| Female | 6,192 (50.6%) | $39,934 |
| Total | 12,225 (100.0%) | $42,371 |
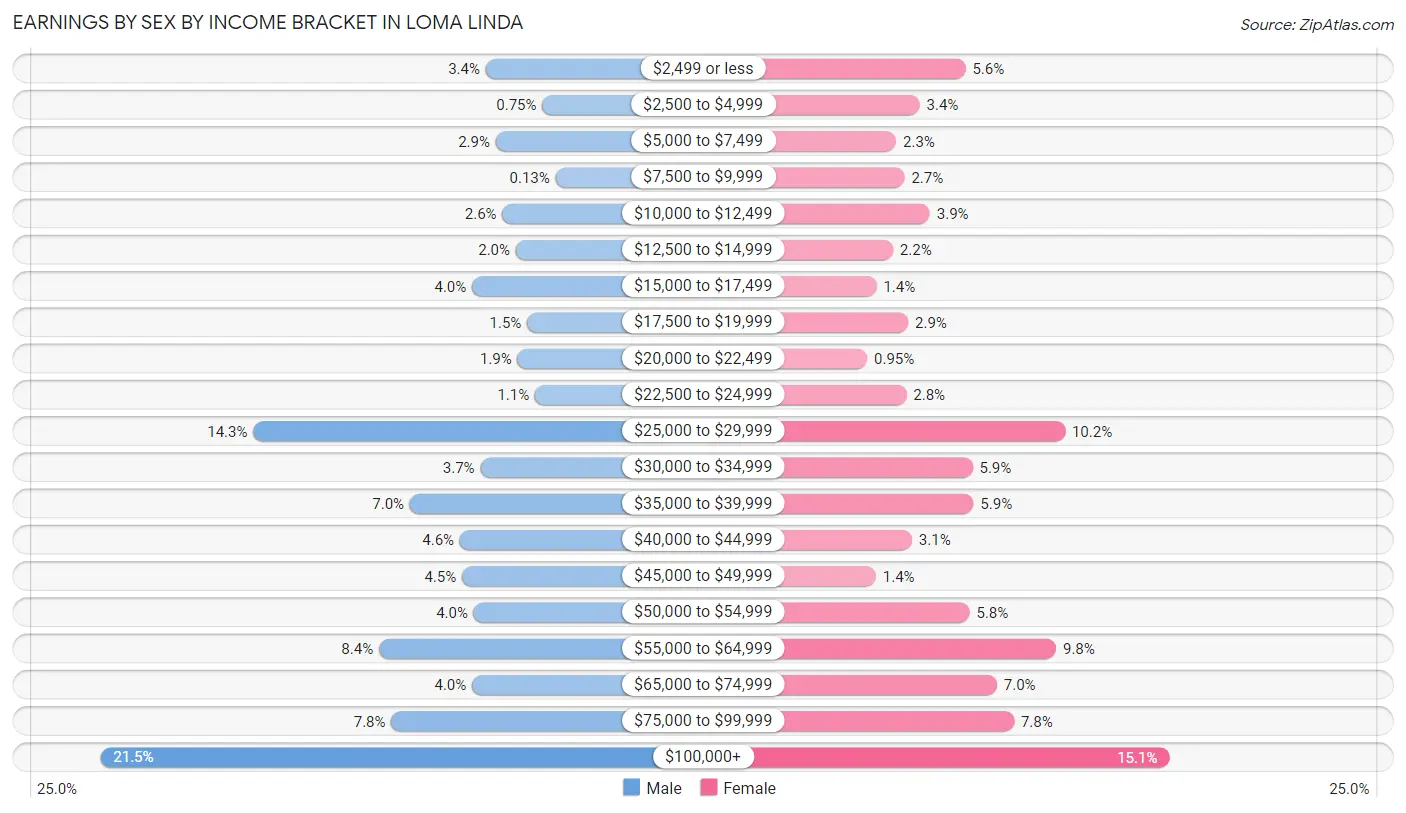
Earnings by Sex by Income Bracket in Loma Linda
The most common earnings brackets in Loma Linda are $100,000+ for men (1,294 | 21.4%) and $100,000+ for women (935 | 15.1%).
| Income | Male | Female |
| $2,499 or less | 205 (3.4%) | 344 (5.6%) |
| $2,500 to $4,999 | 45 (0.7%) | 211 (3.4%) |
| $5,000 to $7,499 | 177 (2.9%) | 143 (2.3%) |
| $7,500 to $9,999 | 8 (0.1%) | 167 (2.7%) |
| $10,000 to $12,499 | 158 (2.6%) | 241 (3.9%) |
| $12,500 to $14,999 | 120 (2.0%) | 134 (2.2%) |
| $15,000 to $17,499 | 244 (4.0%) | 86 (1.4%) |
| $17,500 to $19,999 | 88 (1.5%) | 178 (2.9%) |
| $20,000 to $22,499 | 115 (1.9%) | 59 (0.9%) |
| $22,500 to $24,999 | 66 (1.1%) | 173 (2.8%) |
| $25,000 to $29,999 | 862 (14.3%) | 633 (10.2%) |
| $30,000 to $34,999 | 220 (3.6%) | 365 (5.9%) |
| $35,000 to $39,999 | 419 (7.0%) | 367 (5.9%) |
| $40,000 to $44,999 | 278 (4.6%) | 189 (3.0%) |
| $45,000 to $49,999 | 272 (4.5%) | 84 (1.4%) |
| $50,000 to $54,999 | 239 (4.0%) | 356 (5.8%) |
| $55,000 to $64,999 | 507 (8.4%) | 607 (9.8%) |
| $65,000 to $74,999 | 244 (4.0%) | 435 (7.0%) |
| $75,000 to $99,999 | 472 (7.8%) | 485 (7.8%) |
| $100,000+ | 1,294 (21.4%) | 935 (15.1%) |
| Total | 6,033 (100.0%) | 6,192 (100.0%) |
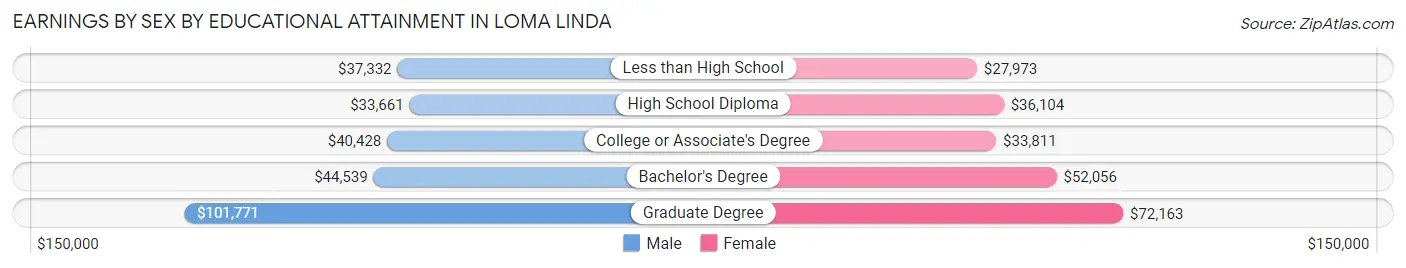
Earnings by Sex by Educational Attainment in Loma Linda
Average earnings in Loma Linda are $48,882 for men and $51,548 for women, a difference of 5.2%. Men with an educational attainment of graduate degree enjoy the highest average annual earnings of $101,771, while those with high school diploma education earn the least with $33,661. Women with an educational attainment of graduate degree earn the most with the average annual earnings of $72,163, while those with less than high school education have the smallest earnings of $27,973.
| Educational Attainment | Male Income | Female Income |
| Less than High School | $37,332 | $27,973 |
| High School Diploma | $33,661 | $36,104 |
| College or Associate's Degree | $40,428 | $33,811 |
| Bachelor's Degree | $44,539 | $52,056 |
| Graduate Degree | $101,771 | $72,163 |
| Total | $48,882 | $51,548 |
Family Income in Loma Linda
Family Income Brackets in Loma Linda
According to the Loma Linda family income data, there are 1,312 families falling into the $100,000 to $149,999 income range, which is the most common income bracket and makes up 21.9% of all families. Conversely, the $10,000 to $14,999 income bracket is the least frequent group with only 96 families (1.6%) belonging to this category.
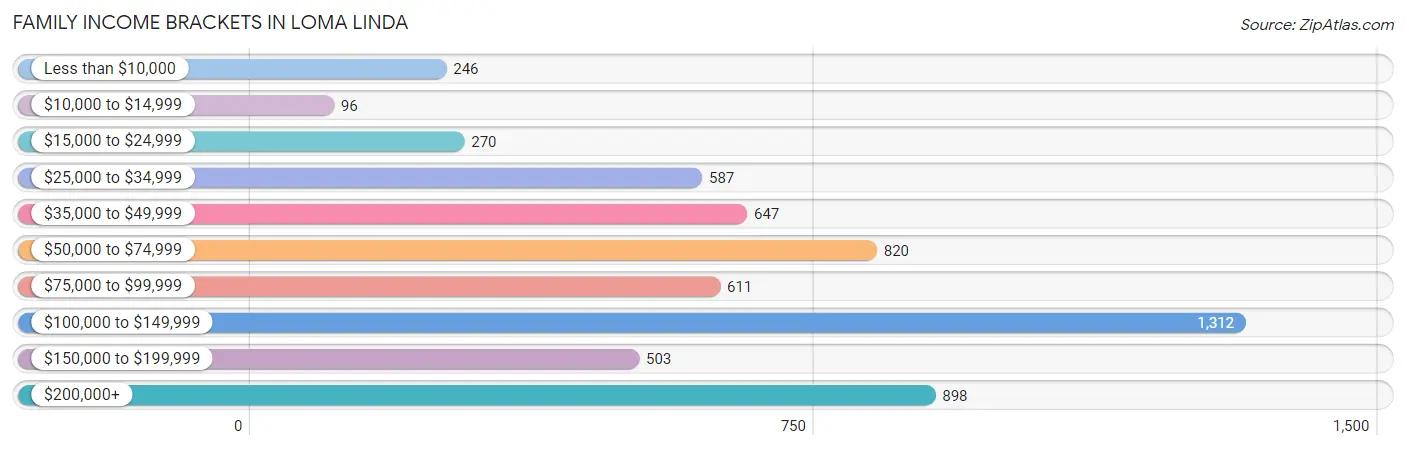
| Income Bracket | # Families | % Families |
| Less than $10,000 | 246 | 4.1% |
| $10,000 to $14,999 | 96 | 1.6% |
| $15,000 to $24,999 | 270 | 4.5% |
| $25,000 to $34,999 | 587 | 9.8% |
| $35,000 to $49,999 | 647 | 10.8% |
| $50,000 to $74,999 | 820 | 13.7% |
| $75,000 to $99,999 | 611 | 10.2% |
| $100,000 to $149,999 | 1,312 | 21.9% |
| $150,000 to $199,999 | 503 | 8.4% |
| $200,000+ | 898 | 15.0% |
Family Income by Famaliy Size in Loma Linda
7+ person families (157 | 2.6%) account for the highest median family income in Loma Linda with $161,063 per family, while 3-person families (1,412 | 23.6%) have the highest median income of $33,333 per family member.
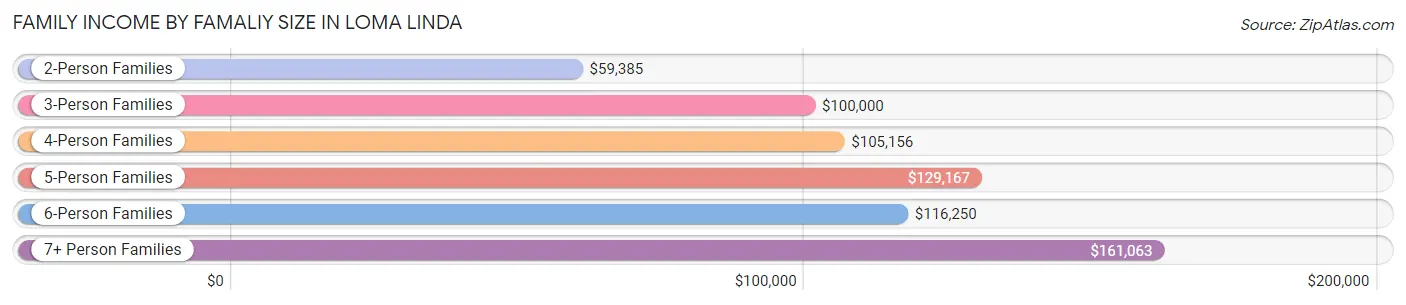
| Income Bracket | # Families | Median Income |
| 2-Person Families | 2,757 (46.0%) | $59,385 |
| 3-Person Families | 1,412 (23.6%) | $100,000 |
| 4-Person Families | 1,196 (20.0%) | $105,156 |
| 5-Person Families | 232 (3.9%) | $129,167 |
| 6-Person Families | 235 (3.9%) | $116,250 |
| 7+ Person Families | 157 (2.6%) | $161,063 |
| Total | 5,989 (100.0%) | $89,014 |
Family Income by Number of Earners in Loma Linda
The median family income in Loma Linda is $89,014, with families comprising 3+ earners (668) having the highest median family income of $131,111, while families with no earners (1,149) have the lowest median family income of $35,673, accounting for 11.2% and 19.2% of families, respectively.
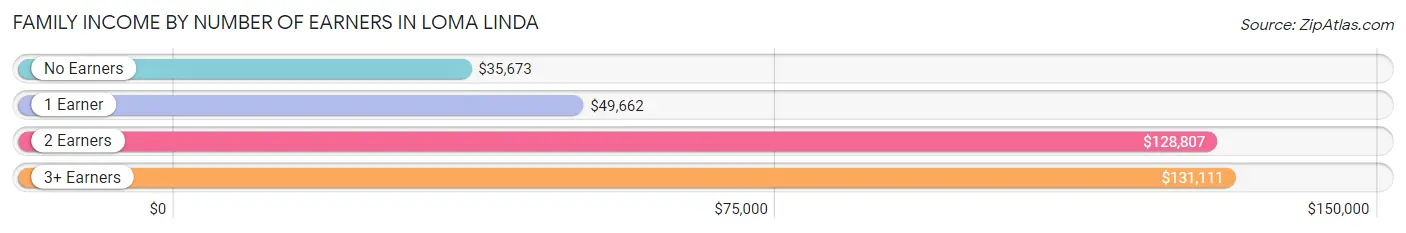
| Number of Earners | # Families | Median Income |
| No Earners | 1,149 (19.2%) | $35,673 |
| 1 Earner | 2,024 (33.8%) | $49,662 |
| 2 Earners | 2,148 (35.9%) | $128,807 |
| 3+ Earners | 668 (11.2%) | $131,111 |
| Total | 5,989 (100.0%) | $89,014 |
Household Income in Loma Linda
Household Income Brackets in Loma Linda
With 1,608 households falling in the category, the $50,000 to $74,999 income range is the most frequent in Loma Linda, accounting for 17.6% of all households. In contrast, only 356 households (3.9%) fall into the $10,000 to $14,999 income bracket, making it the least populous group.
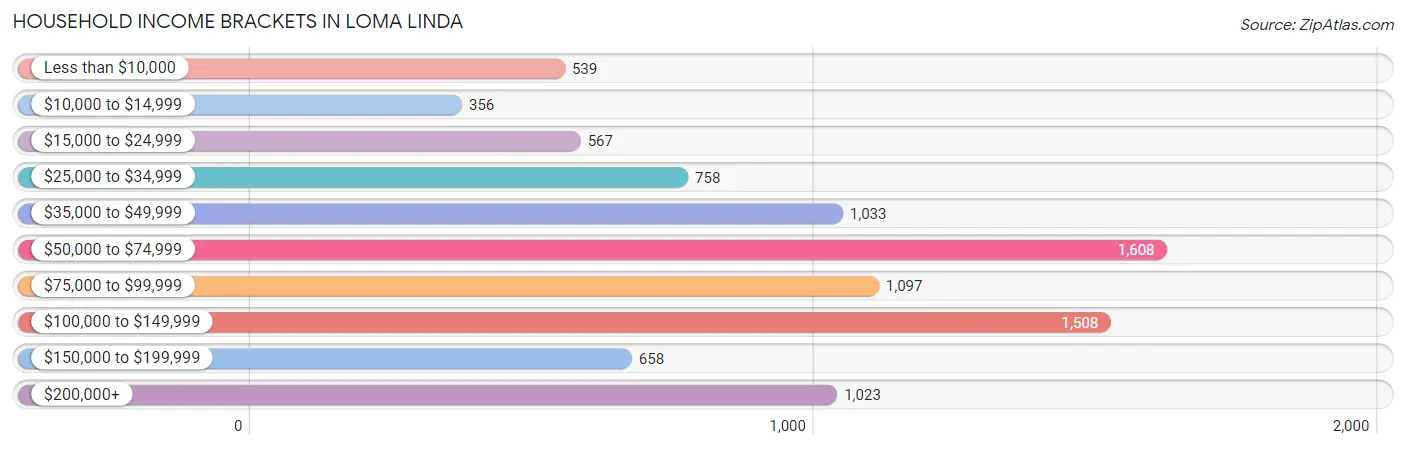
| Income Bracket | # Households | % Households |
| Less than $10,000 | 539 | 5.9% |
| $10,000 to $14,999 | 356 | 3.9% |
| $15,000 to $24,999 | 567 | 6.2% |
| $25,000 to $34,999 | 758 | 8.3% |
| $35,000 to $49,999 | 1,033 | 11.3% |
| $50,000 to $74,999 | 1,608 | 17.6% |
| $75,000 to $99,999 | 1,097 | 12.0% |
| $100,000 to $149,999 | 1,508 | 16.5% |
| $150,000 to $199,999 | 658 | 7.2% |
| $200,000+ | 1,023 | 11.2% |
Household Income by Householder Age in Loma Linda
The median household income in Loma Linda is $70,685, with the highest median household income of $91,605 found in the 45 to 64 years age bracket for the primary householder. A total of 3,111 households (34.0%) fall into this category. Meanwhile, the 65+ years age bracket for the primary householder has the lowest median household income of $44,926, with 2,451 households (26.8%) in this group.
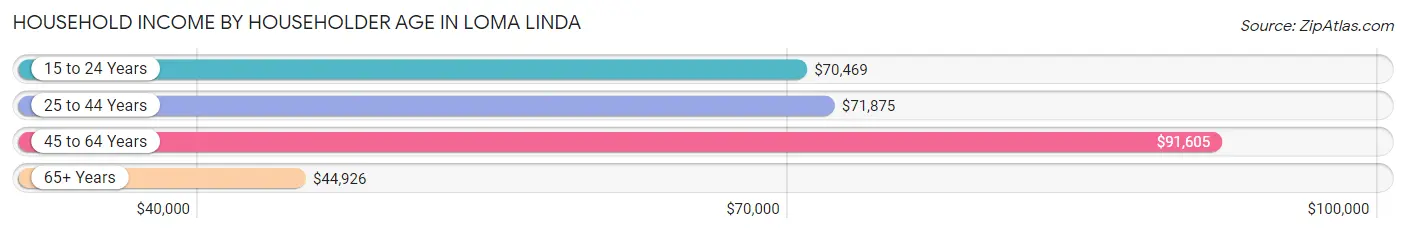
| Income Bracket | # Households | Median Income |
| 15 to 24 Years | 211 (2.3%) | $70,469 |
| 25 to 44 Years | 3,365 (36.8%) | $71,875 |
| 45 to 64 Years | 3,111 (34.0%) | $91,605 |
| 65+ Years | 2,451 (26.8%) | $44,926 |
| Total | 9,138 (100.0%) | $70,685 |
Poverty in Loma Linda
Income Below Poverty by Sex and Age in Loma Linda
With 11.1% poverty level for males and 14.2% for females among the residents of Loma Linda, 5 year old males and 15 year old females are the most vulnerable to poverty, with 31 males (36.9%) and 69 females (31.5%) in their respective age groups living below the poverty level.
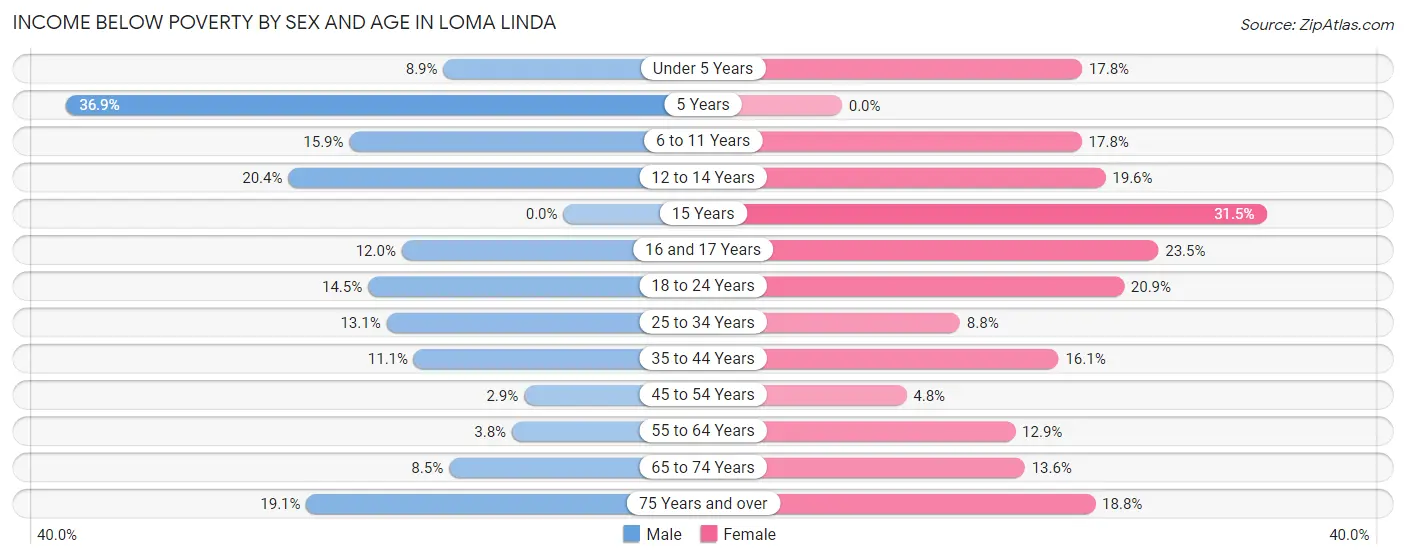
| Age Bracket | Male | Female |
| Under 5 Years | 68 (8.9%) | 79 (17.8%) |
| 5 Years | 31 (36.9%) | 0 (0.0%) |
| 6 to 11 Years | 123 (15.9%) | 140 (17.8%) |
| 12 to 14 Years | 88 (20.4%) | 81 (19.6%) |
| 15 Years | 0 (0.0%) | 69 (31.5%) |
| 16 and 17 Years | 33 (12.0%) | 82 (23.5%) |
| 18 to 24 Years | 105 (14.5%) | 232 (20.9%) |
| 25 to 34 Years | 300 (13.1%) | 196 (8.8%) |
| 35 to 44 Years | 141 (11.1%) | 267 (16.1%) |
| 45 to 54 Years | 27 (2.9%) | 69 (4.8%) |
| 55 to 64 Years | 55 (3.8%) | 250 (12.9%) |
| 65 to 74 Years | 109 (8.5%) | 151 (13.6%) |
| 75 Years and over | 149 (19.1%) | 233 (18.8%) |
| Total | 1,229 (11.1%) | 1,849 (14.2%) |
Income Above Poverty by Sex and Age in Loma Linda
According to the poverty statistics in Loma Linda, males aged 15 years and females aged 5 years are the age groups that are most secure financially, with 100.0% of males and 100.0% of females in these age groups living above the poverty line.
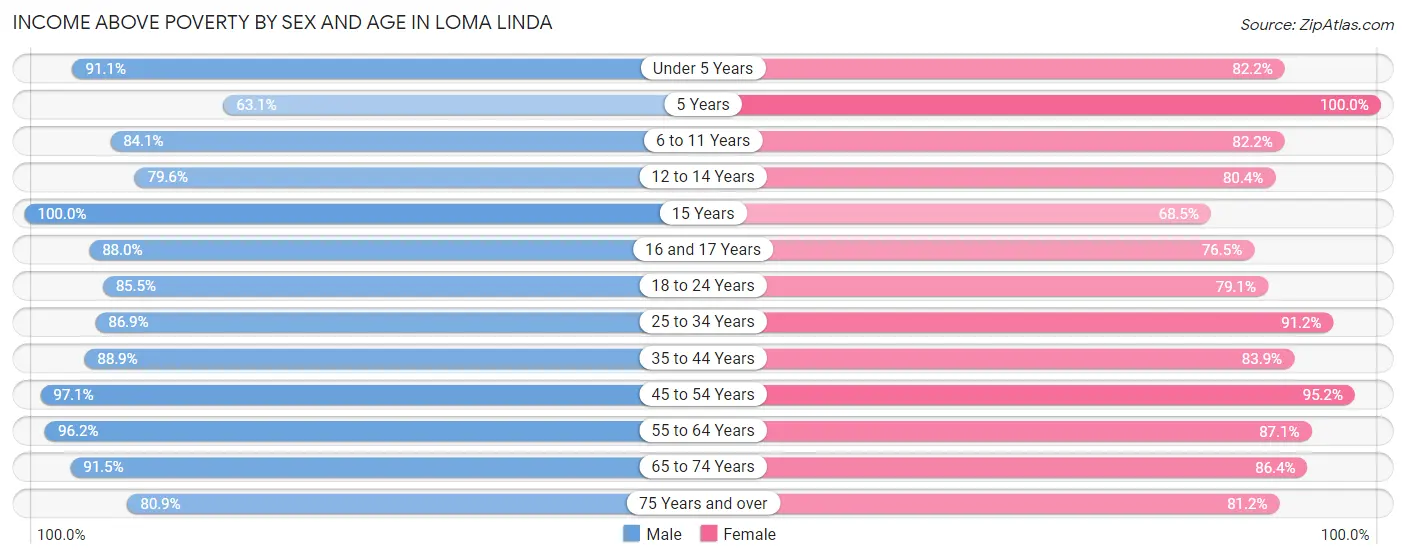
| Age Bracket | Male | Female |
| Under 5 Years | 695 (91.1%) | 364 (82.2%) |
| 5 Years | 53 (63.1%) | 69 (100.0%) |
| 6 to 11 Years | 651 (84.1%) | 646 (82.2%) |
| 12 to 14 Years | 343 (79.6%) | 333 (80.4%) |
| 15 Years | 42 (100.0%) | 150 (68.5%) |
| 16 and 17 Years | 242 (88.0%) | 267 (76.5%) |
| 18 to 24 Years | 619 (85.5%) | 876 (79.1%) |
| 25 to 34 Years | 1,985 (86.9%) | 2,039 (91.2%) |
| 35 to 44 Years | 1,129 (88.9%) | 1,392 (83.9%) |
| 45 to 54 Years | 897 (97.1%) | 1,373 (95.2%) |
| 55 to 64 Years | 1,384 (96.2%) | 1,692 (87.1%) |
| 65 to 74 Years | 1,175 (91.5%) | 961 (86.4%) |
| 75 Years and over | 632 (80.9%) | 1,006 (81.2%) |
| Total | 9,847 (88.9%) | 11,168 (85.8%) |
Income Below Poverty Among Married-Couple Families in Loma Linda
The poverty statistics for married-couple families in Loma Linda show that 5.3% or 233 of the total 4,365 families live below the poverty line. Families with 3 or 4 children have the highest poverty rate of 35.9%, comprising of 94 families. On the other hand, families with 5 or more children have the lowest poverty rate of 0.0%, which includes 0 families.
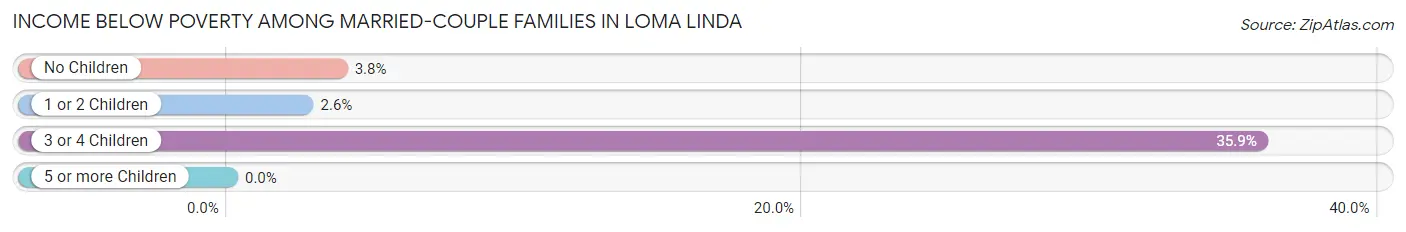
| Children | Above Poverty | Below Poverty |
| No Children | 2,540 (96.2%) | 101 (3.8%) |
| 1 or 2 Children | 1,408 (97.4%) | 38 (2.6%) |
| 3 or 4 Children | 168 (64.1%) | 94 (35.9%) |
| 5 or more Children | 16 (100.0%) | 0 (0.0%) |
| Total | 4,132 (94.7%) | 233 (5.3%) |
Income Below Poverty Among Single-Parent Households in Loma Linda
According to the poverty data in Loma Linda, 20.9% or 71 single-father households and 13.6% or 175 single-mother households are living below the poverty line. Among single-father households, those with 1 or 2 children have the highest poverty rate, with 71 households (46.1%) experiencing poverty. Likewise, among single-mother households, those with 3 or 4 children have the highest poverty rate, with 15 households (48.4%) falling below the poverty line.
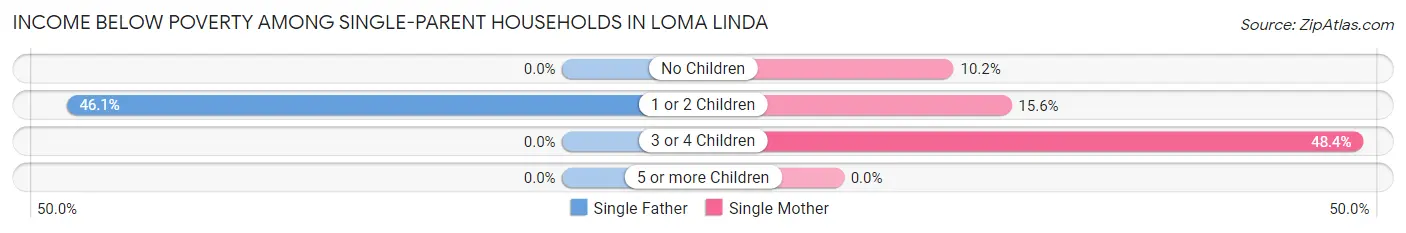
| Children | Single Father | Single Mother |
| No Children | 0 (0.0%) | 68 (10.2%) |
| 1 or 2 Children | 71 (46.1%) | 92 (15.6%) |
| 3 or 4 Children | 0 (0.0%) | 15 (48.4%) |
| 5 or more Children | 0 (0.0%) | 0 (0.0%) |
| Total | 71 (20.9%) | 175 (13.6%) |
Income Below Poverty Among Married-Couple vs Single-Parent Households in Loma Linda
The poverty data for Loma Linda shows that 233 of the married-couple family households (5.3%) and 246 of the single-parent households (15.1%) are living below the poverty level. Within the married-couple family households, those with 3 or 4 children have the highest poverty rate, with 94 households (35.9%) falling below the poverty line. Among the single-parent households, those with 3 or 4 children have the highest poverty rate, with 15 household (48.4%) living below poverty.
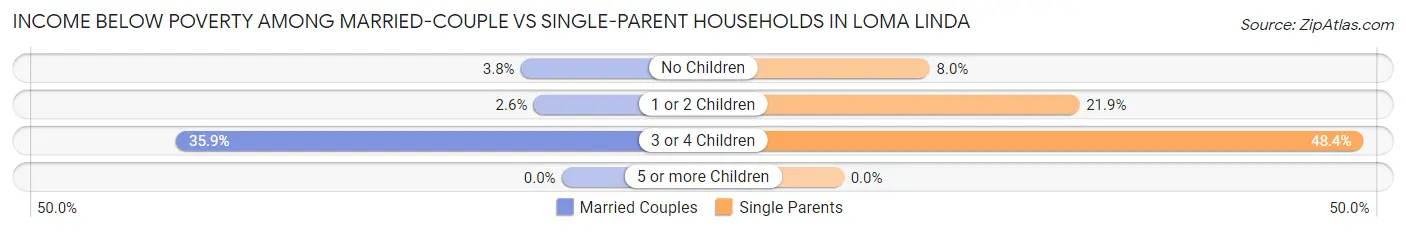
| Children | Married-Couple Families | Single-Parent Households |
| No Children | 101 (3.8%) | 68 (8.0%) |
| 1 or 2 Children | 38 (2.6%) | 163 (21.9%) |
| 3 or 4 Children | 94 (35.9%) | 15 (48.4%) |
| 5 or more Children | 0 (0.0%) | 0 (0.0%) |
| Total | 233 (5.3%) | 246 (15.1%) |
Race in Loma Linda
The most populous races in Loma Linda are White / Caucasian (10,938 | 44.0%), Hispanic or Latino (6,917 | 27.8%), and Asian (6,581 | 26.5%).
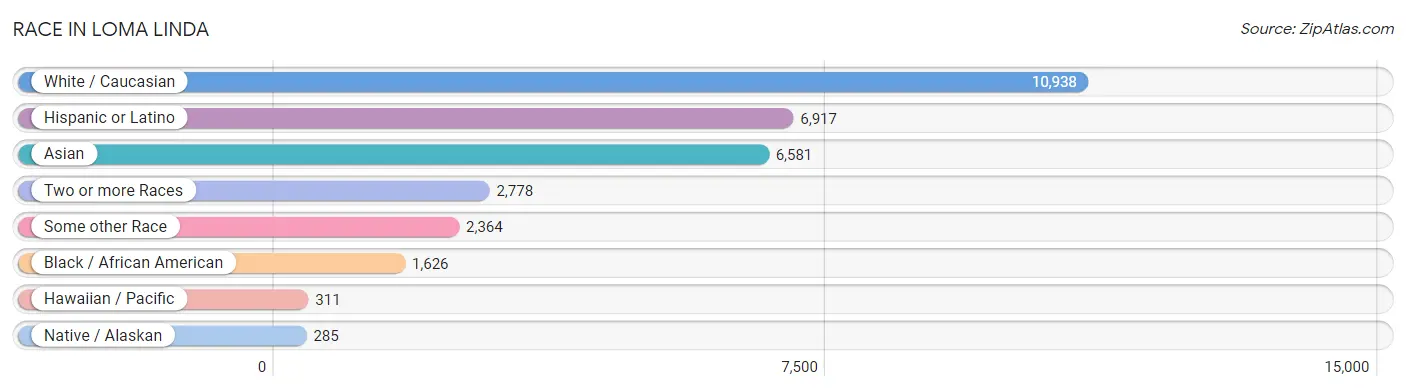
| Race | # Population | % Population |
| Asian | 6,581 | 26.5% |
| Black / African American | 1,626 | 6.5% |
| Hawaiian / Pacific | 311 | 1.3% |
| Hispanic or Latino | 6,917 | 27.8% |
| Native / Alaskan | 285 | 1.1% |
| White / Caucasian | 10,938 | 44.0% |
| Two or more Races | 2,778 | 11.2% |
| Some other Race | 2,364 | 9.5% |
| Total | 24,883 | 100.0% |
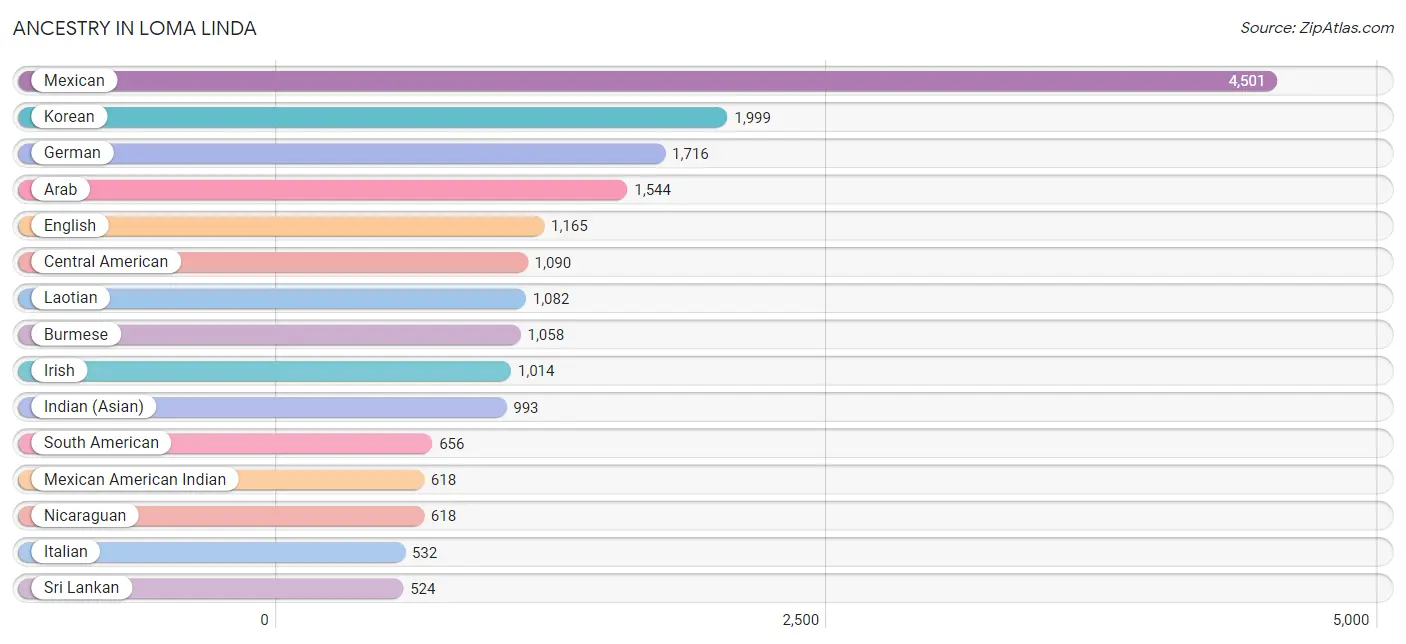
Ancestry in Loma Linda
The most populous ancestries reported in Loma Linda are Mexican (4,501 | 18.1%), Korean (1,999 | 8.0%), German (1,716 | 6.9%), Arab (1,544 | 6.2%), and English (1,165 | 4.7%), together accounting for 43.9% of all Loma Linda residents.
| Ancestry | # Population | % Population |
| Afghan | 14 | 0.1% |
| American | 345 | 1.4% |
| Apache | 15 | 0.1% |
| Arab | 1,544 | 6.2% |
| Argentinean | 99 | 0.4% |
| Armenian | 117 | 0.5% |
| Australian | 16 | 0.1% |
| Barbadian | 53 | 0.2% |
| Bermudan | 7 | 0.0% |
| Bhutanese | 280 | 1.1% |
| Bolivian | 48 | 0.2% |
| Brazilian | 83 | 0.3% |
| British | 120 | 0.5% |
| Bulgarian | 26 | 0.1% |
| Burmese | 1,058 | 4.3% |
| Canadian | 15 | 0.1% |
| Central American | 1,090 | 4.4% |
| Central American Indian | 243 | 1.0% |
| Cherokee | 6 | 0.0% |
| Colombian | 73 | 0.3% |
| Costa Rican | 33 | 0.1% |
| Cuban | 157 | 0.6% |
| Czech | 34 | 0.1% |
| Danish | 30 | 0.1% |
| Dominican | 17 | 0.1% |
| Dutch | 203 | 0.8% |
| Eastern European | 14 | 0.1% |
| Ecuadorian | 60 | 0.2% |
| Egyptian | 473 | 1.9% |
| English | 1,165 | 4.7% |
| Ethiopian | 24 | 0.1% |
| European | 281 | 1.1% |
| Filipino | 87 | 0.4% |
| Finnish | 9 | 0.0% |
| French | 385 | 1.5% |
| French Canadian | 64 | 0.3% |
| German | 1,716 | 6.9% |
| Greek | 25 | 0.1% |
| Guamanian / Chamorro | 270 | 1.1% |
| Guatemalan | 82 | 0.3% |
| Haitian | 40 | 0.2% |
| Honduran | 51 | 0.2% |
| Hungarian | 196 | 0.8% |
| Indian (Asian) | 993 | 4.0% |
| Indonesian | 6 | 0.0% |
| Iranian | 23 | 0.1% |
| Iraqi | 12 | 0.1% |
| Irish | 1,014 | 4.1% |
| Israeli | 140 | 0.6% |
| Italian | 532 | 2.1% |
| Jamaican | 62 | 0.3% |
| Japanese | 130 | 0.5% |
| Jordanian | 346 | 1.4% |
| Korean | 1,999 | 8.0% |
| Laotian | 1,082 | 4.3% |
| Lebanese | 488 | 2.0% |
| Mexican | 4,501 | 18.1% |
| Mexican American Indian | 618 | 2.5% |
| Mongolian | 32 | 0.1% |
| Native Hawaiian | 108 | 0.4% |
| Nicaraguan | 618 | 2.5% |
| Nigerian | 75 | 0.3% |
| Northern European | 16 | 0.1% |
| Norwegian | 190 | 0.8% |
| Okinawan | 36 | 0.1% |
| Osage | 6 | 0.0% |
| Pakistani | 340 | 1.4% |
| Pennsylvania German | 7 | 0.0% |
| Peruvian | 358 | 1.4% |
| Polish | 73 | 0.3% |
| Portuguese | 6 | 0.0% |
| Potawatomi | 15 | 0.1% |
| Puerto Rican | 134 | 0.5% |
| Romanian | 194 | 0.8% |
| Russian | 257 | 1.0% |
| Salvadoran | 306 | 1.2% |
| Scandinavian | 45 | 0.2% |
| Scotch-Irish | 70 | 0.3% |
| Scottish | 139 | 0.6% |
| Slovak | 21 | 0.1% |
| South American | 656 | 2.6% |
| Spaniard | 198 | 0.8% |
| Spanish | 60 | 0.2% |
| Sri Lankan | 524 | 2.1% |
| Subsaharan African | 133 | 0.5% |
| Swedish | 246 | 1.0% |
| Swiss | 68 | 0.3% |
| Syrian | 77 | 0.3% |
| Thai | 508 | 2.0% |
| Trinidadian and Tobagonian | 114 | 0.5% |
| Ukrainian | 163 | 0.7% |
| Venezuelan | 18 | 0.1% |
| Vietnamese | 39 | 0.2% |
| Zimbabwean | 16 | 0.1% | View All 94 Rows |
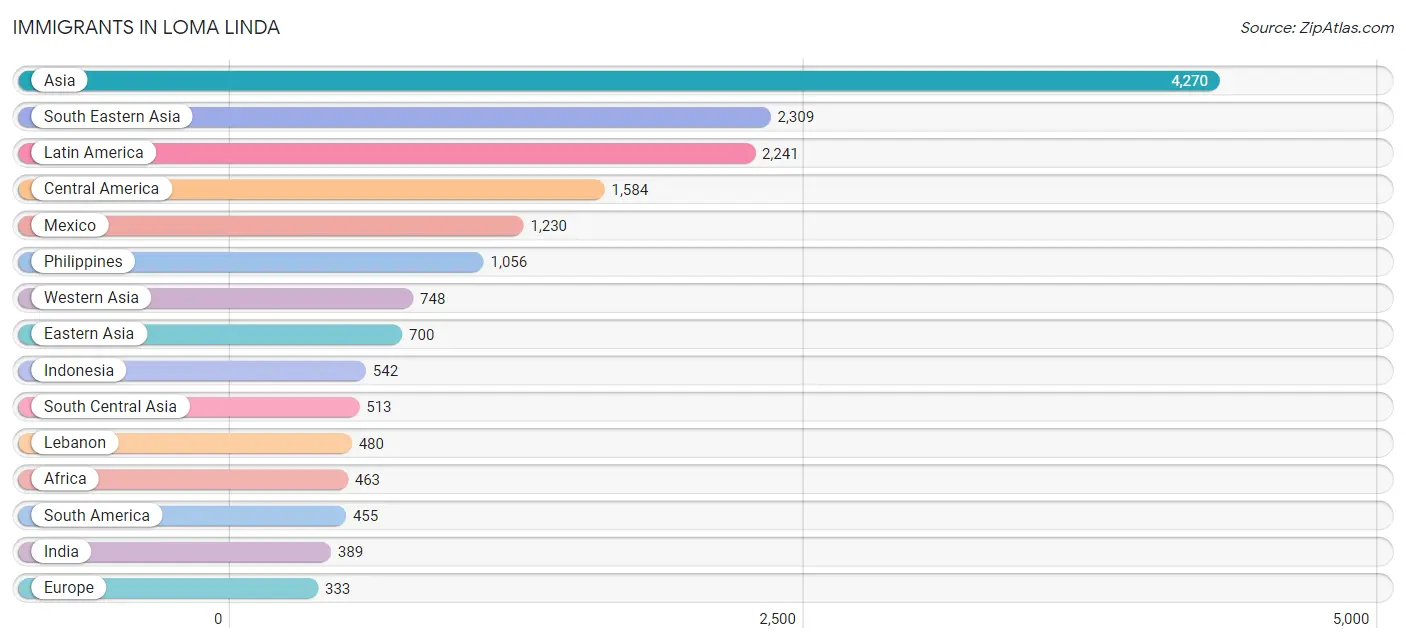
Immigrants in Loma Linda
The most numerous immigrant groups reported in Loma Linda came from Asia (4,270 | 17.2%), South Eastern Asia (2,309 | 9.3%), Latin America (2,241 | 9.0%), Central America (1,584 | 6.4%), and Mexico (1,230 | 4.9%), together accounting for 46.8% of all Loma Linda residents.
| Immigration Origin | # Population | % Population |
| Africa | 463 | 1.9% |
| Argentina | 57 | 0.2% |
| Armenia | 5 | 0.0% |
| Asia | 4,270 | 17.2% |
| Australia | 30 | 0.1% |
| Bangladesh | 27 | 0.1% |
| Barbados | 11 | 0.0% |
| Bolivia | 26 | 0.1% |
| Brazil | 38 | 0.2% |
| Bulgaria | 20 | 0.1% |
| Cambodia | 69 | 0.3% |
| Canada | 171 | 0.7% |
| Caribbean | 202 | 0.8% |
| Central America | 1,584 | 6.4% |
| China | 285 | 1.1% |
| Colombia | 45 | 0.2% |
| Costa Rica | 33 | 0.1% |
| Cuba | 58 | 0.2% |
| Dominican Republic | 17 | 0.1% |
| Eastern Africa | 114 | 0.5% |
| Eastern Asia | 700 | 2.8% |
| Eastern Europe | 230 | 0.9% |
| Ecuador | 38 | 0.2% |
| Egypt | 228 | 0.9% |
| El Salvador | 205 | 0.8% |
| Eritrea | 24 | 0.1% |
| Europe | 333 | 1.3% |
| Hong Kong | 13 | 0.1% |
| Hungary | 5 | 0.0% |
| India | 389 | 1.6% |
| Indonesia | 542 | 2.2% |
| Iran | 61 | 0.3% |
| Iraq | 69 | 0.3% |
| Italy | 6 | 0.0% |
| Jamaica | 26 | 0.1% |
| Japan | 91 | 0.4% |
| Jordan | 132 | 0.5% |
| Korea | 324 | 1.3% |
| Latin America | 2,241 | 9.0% |
| Lebanon | 480 | 1.9% |
| Malaysia | 91 | 0.4% |
| Mexico | 1,230 | 4.9% |
| Nicaragua | 87 | 0.4% |
| Nigeria | 121 | 0.5% |
| Northern Africa | 228 | 0.9% |
| Northern Europe | 85 | 0.3% |
| Norway | 31 | 0.1% |
| Oceania | 63 | 0.3% |
| Pakistan | 36 | 0.1% |
| Panama | 29 | 0.1% |
| Peru | 227 | 0.9% |
| Philippines | 1,056 | 4.2% |
| Poland | 61 | 0.3% |
| Romania | 144 | 0.6% |
| Singapore | 18 | 0.1% |
| South America | 455 | 1.8% |
| South Central Asia | 513 | 2.1% |
| South Eastern Asia | 2,309 | 9.3% |
| Southern Europe | 6 | 0.0% |
| Switzerland | 12 | 0.1% |
| Syria | 44 | 0.2% |
| Taiwan | 93 | 0.4% |
| Thailand | 224 | 0.9% |
| Trinidad and Tobago | 90 | 0.4% |
| Turkey | 18 | 0.1% |
| Vietnam | 309 | 1.2% |
| Western Africa | 121 | 0.5% |
| Western Asia | 748 | 3.0% |
| Western Europe | 12 | 0.1% |
| Zimbabwe | 16 | 0.1% | View All 70 Rows |
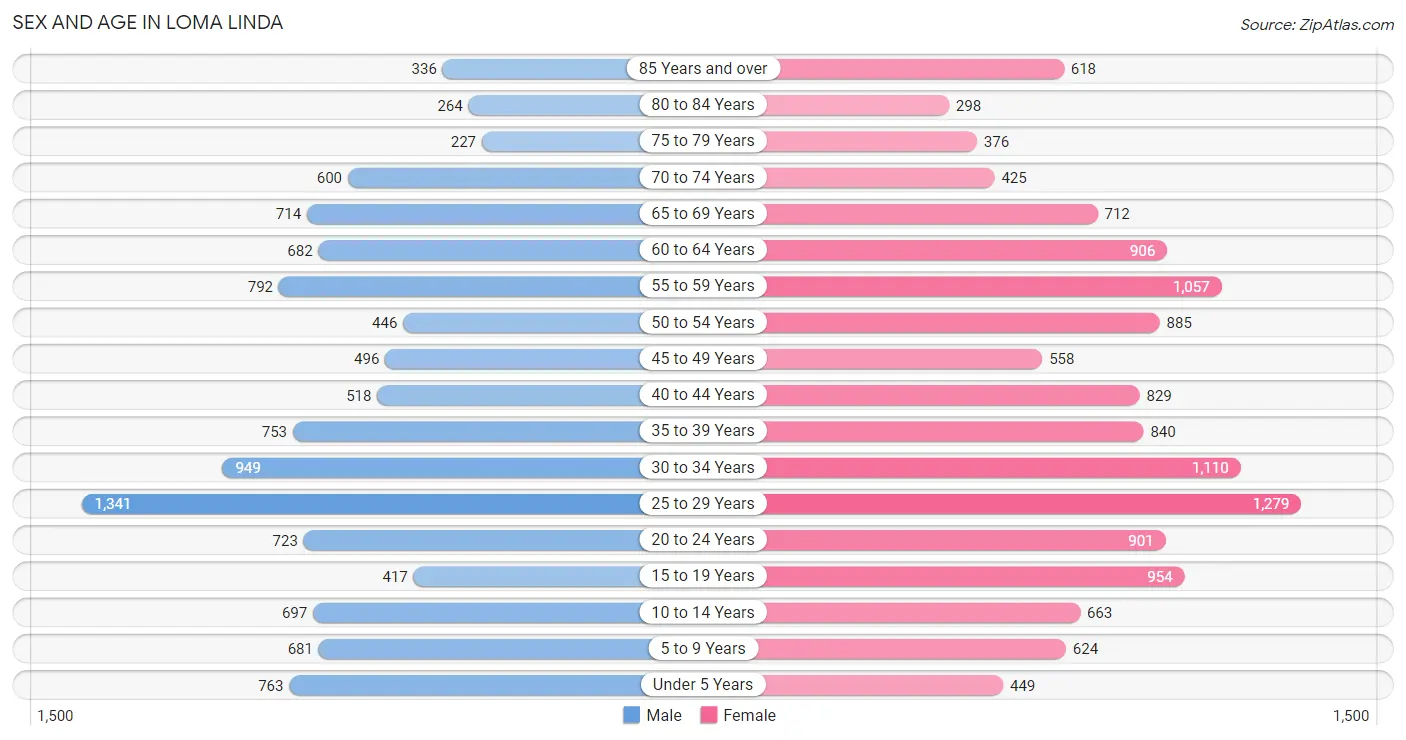
Sex and Age in Loma Linda
Sex and Age in Loma Linda
The most populous age groups in Loma Linda are 25 to 29 Years (1,341 | 11.8%) for men and 25 to 29 Years (1,279 | 9.5%) for women.
| Age Bracket | Male | Female |
| Under 5 Years | 763 (6.7%) | 449 (3.3%) |
| 5 to 9 Years | 681 (6.0%) | 624 (4.6%) |
| 10 to 14 Years | 697 (6.1%) | 663 (4.9%) |
| 15 to 19 Years | 417 (3.7%) | 954 (7.1%) |
| 20 to 24 Years | 723 (6.3%) | 901 (6.7%) |
| 25 to 29 Years | 1,341 (11.8%) | 1,279 (9.5%) |
| 30 to 34 Years | 949 (8.3%) | 1,110 (8.2%) |
| 35 to 39 Years | 753 (6.6%) | 840 (6.2%) |
| 40 to 44 Years | 518 (4.5%) | 829 (6.1%) |
| 45 to 49 Years | 496 (4.3%) | 558 (4.1%) |
| 50 to 54 Years | 446 (3.9%) | 885 (6.6%) |
| 55 to 59 Years | 792 (7.0%) | 1,057 (7.8%) |
| 60 to 64 Years | 682 (6.0%) | 906 (6.7%) |
| 65 to 69 Years | 714 (6.3%) | 712 (5.3%) |
| 70 to 74 Years | 600 (5.3%) | 425 (3.2%) |
| 75 to 79 Years | 227 (2.0%) | 376 (2.8%) |
| 80 to 84 Years | 264 (2.3%) | 298 (2.2%) |
| 85 Years and over | 336 (2.9%) | 618 (4.6%) |
| Total | 11,399 (100.0%) | 13,484 (100.0%) |
Families and Households in Loma Linda
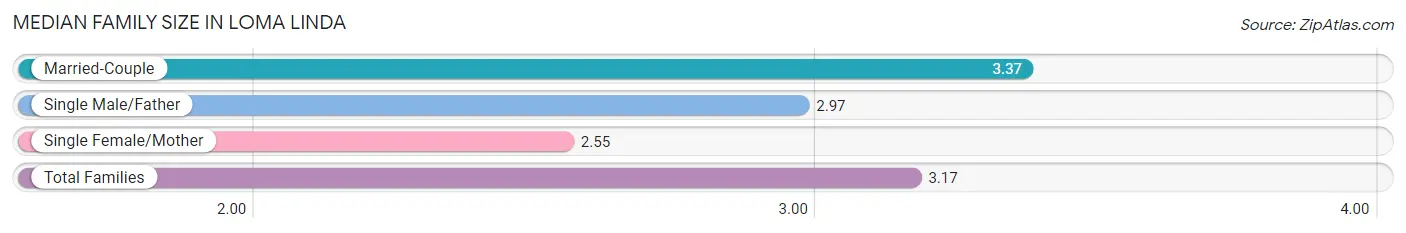
Median Family Size in Loma Linda
The median family size in Loma Linda is 3.17 persons per family, with married-couple families (4,365 | 72.9%) accounting for the largest median family size of 3.37 persons per family. On the other hand, single female/mother families (1,285 | 21.5%) represent the smallest median family size with 2.55 persons per family.
| Family Type | # Families | Family Size |
| Married-Couple | 4,365 (72.9%) | 3.37 |
| Single Male/Father | 339 (5.7%) | 2.97 |
| Single Female/Mother | 1,285 (21.5%) | 2.55 |
| Total Families | 5,989 (100.0%) | 3.17 |
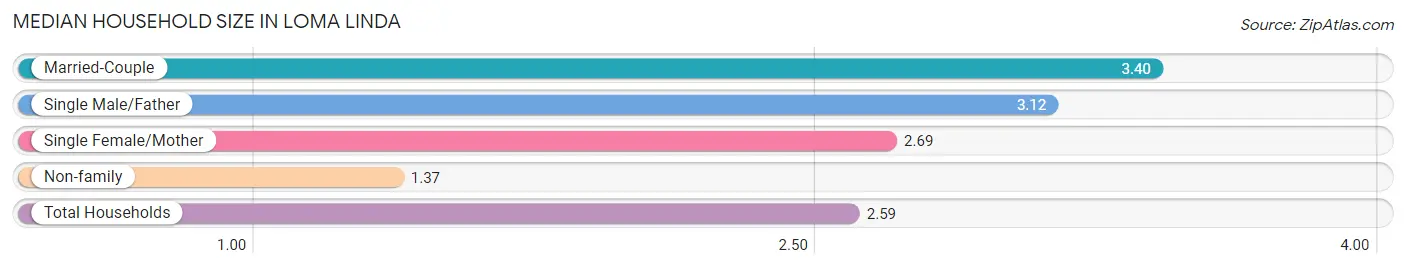
Median Household Size in Loma Linda
The median household size in Loma Linda is 2.59 persons per household, with married-couple households (4,365 | 47.8%) accounting for the largest median household size of 3.4 persons per household. non-family households (3,149 | 34.5%) represent the smallest median household size with 1.37 persons per household.
| Household Type | # Households | Household Size |
| Married-Couple | 4,365 (47.8%) | 3.40 |
| Single Male/Father | 339 (3.7%) | 3.12 |
| Single Female/Mother | 1,285 (14.1%) | 2.69 |
| Non-family | 3,149 (34.5%) | 1.37 |
| Total Households | 9,138 (100.0%) | 2.59 |
Household Size by Marriage Status in Loma Linda
Out of a total of 9,138 households in Loma Linda, 5,989 (65.5%) are family households, while 3,149 (34.5%) are nonfamily households. The most numerous type of family households are 2-person households, comprising 2,602, and the most common type of nonfamily households are 1-person households, comprising 2,306.
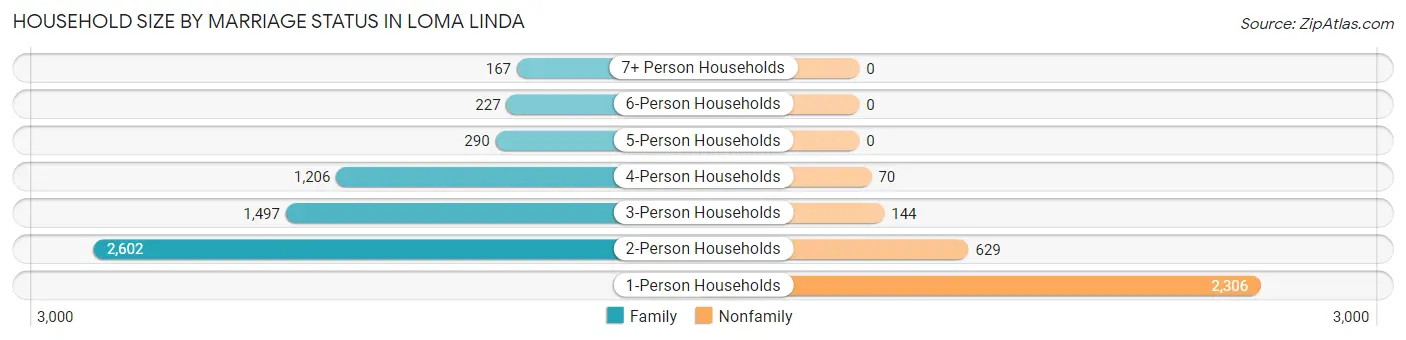
| Household Size | Family Households | Nonfamily Households |
| 1-Person Households | - | 2,306 (25.2%) |
| 2-Person Households | 2,602 (28.5%) | 629 (6.9%) |
| 3-Person Households | 1,497 (16.4%) | 144 (1.6%) |
| 4-Person Households | 1,206 (13.2%) | 70 (0.8%) |
| 5-Person Households | 290 (3.2%) | 0 (0.0%) |
| 6-Person Households | 227 (2.5%) | 0 (0.0%) |
| 7+ Person Households | 167 (1.8%) | 0 (0.0%) |
| Total | 5,989 (65.5%) | 3,149 (34.5%) |
Female Fertility in Loma Linda
Fertility by Age in Loma Linda
Average fertility rate in Loma Linda is 30.0 births per 1,000 women. Women in the age bracket of 20 to 34 years have the highest fertility rate with 57.0 births per 1,000 women. Women in the age bracket of 20 to 34 years acount for 93.5% of all women with births.
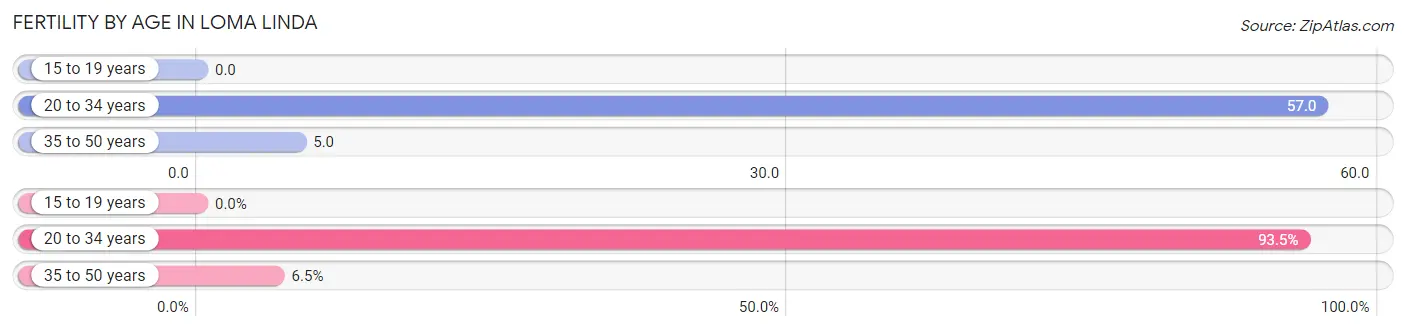
| Age Bracket | Women with Births | Births / 1,000 Women |
| 15 to 19 years | 0 (0.0%) | 0.0 |
| 20 to 34 years | 187 (93.5%) | 57.0 |
| 35 to 50 years | 13 (6.5%) | 5.0 |
| Total | 200 (100.0%) | 30.0 |
Fertility by Age by Marriage Status in Loma Linda
68.5% of women with births (200) in Loma Linda are married. The highest percentage of unmarried women with births falls into 20 to 34 years age bracket with 33.7% of them unmarried at the time of birth, while the lowest percentage of unmarried women with births belong to 35 to 50 years age bracket with 0.0% of them unmarried.
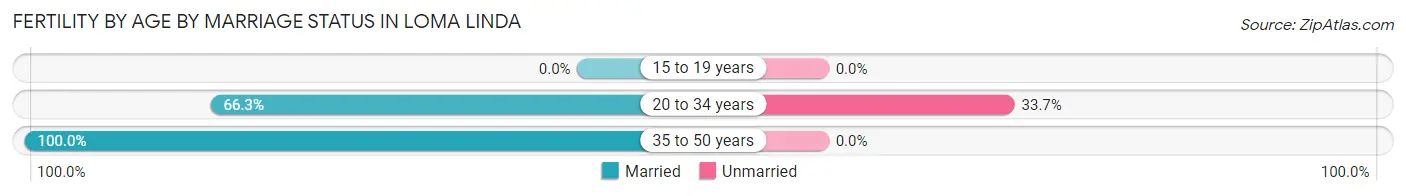
| Age Bracket | Married | Unmarried |
| 15 to 19 years | 0 (0.0%) | 0 (0.0%) |
| 20 to 34 years | 124 (66.3%) | 63 (33.7%) |
| 35 to 50 years | 13 (100.0%) | 0 (0.0%) |
| Total | 137 (68.5%) | 63 (31.5%) |
Fertility by Education in Loma Linda
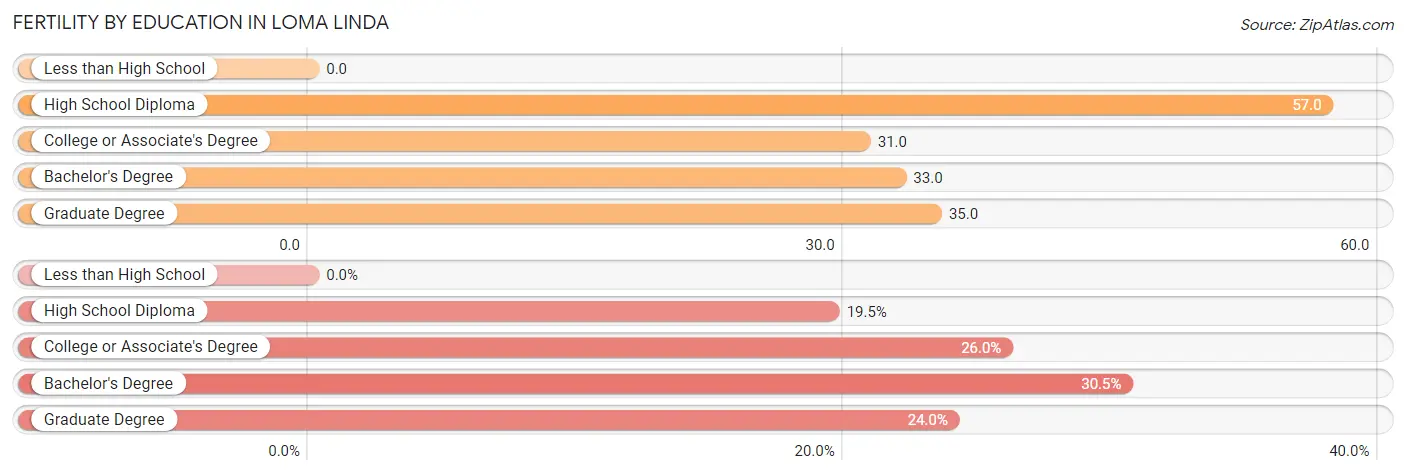
| Educational Attainment | Women with Births | Births / 1,000 Women |
| Less than High School | 0 (0.0%) | 0.0 |
| High School Diploma | 39 (19.5%) | 57.0 |
| College or Associate's Degree | 52 (26.0%) | 31.0 |
| Bachelor's Degree | 61 (30.5%) | 33.0 |
| Graduate Degree | 48 (24.0%) | 35.0 |
| Total | 200 (100.0%) | 30.0 |
Fertility by Education by Marriage Status in Loma Linda
31.5% of women with births in Loma Linda are unmarried. Women with the educational attainment of high school diploma are most likely to be married with 100.0% of them married at childbirth, while women with the educational attainment of college or associate's degree are least likely to be married with 92.3% of them unmarried at childbirth.
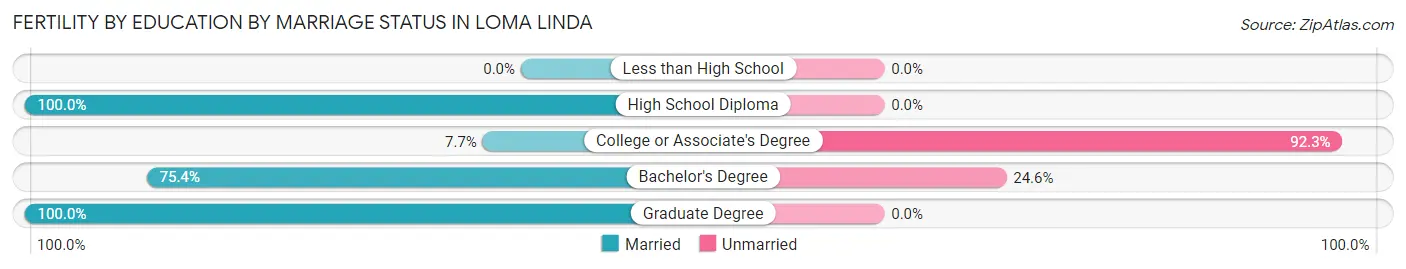
| Educational Attainment | Married | Unmarried |
| Less than High School | 0 (0.0%) | 0 (0.0%) |
| High School Diploma | 39 (100.0%) | 0 (0.0%) |
| College or Associate's Degree | 4 (7.7%) | 48 (92.3%) |
| Bachelor's Degree | 46 (75.4%) | 15 (24.6%) |
| Graduate Degree | 48 (100.0%) | 0 (0.0%) |
| Total | 137 (68.5%) | 63 (31.5%) |
Employment Characteristics in Loma Linda
Employment by Class of Employer in Loma Linda
Among the 10,994 employed individuals in Loma Linda, private company employees (6,186 | 56.3%), not-for-profit organizations (1,719 | 15.6%), and local government employees (951 | 8.6%) make up the most common classes of employment.
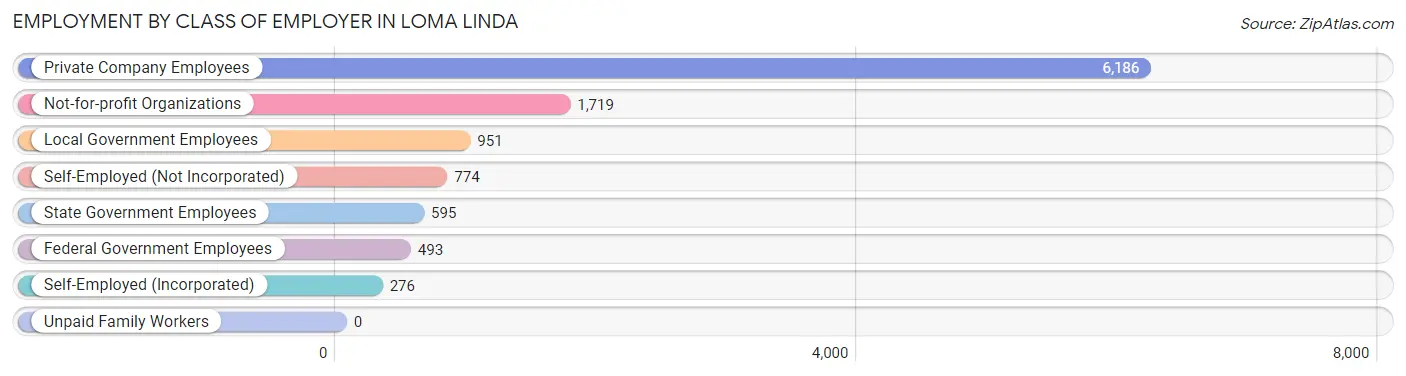
| Employer Class | # Employees | % Employees |
| Private Company Employees | 6,186 | 56.3% |
| Self-Employed (Incorporated) | 276 | 2.5% |
| Self-Employed (Not Incorporated) | 774 | 7.0% |
| Not-for-profit Organizations | 1,719 | 15.6% |
| Local Government Employees | 951 | 8.6% |
| State Government Employees | 595 | 5.4% |
| Federal Government Employees | 493 | 4.5% |
| Unpaid Family Workers | 0 | 0.0% |
| Total | 10,994 | 100.0% |
Employment Status by Age in Loma Linda
According to the labor force statistics for Loma Linda, out of the total population over 16 years of age (20,745), 58.6% or 12,157 individuals are in the labor force, with 7.2% or 875 of them unemployed. The age group with the highest labor force participation rate is 30 to 34 years, with 84.1% or 1,732 individuals in the labor force. Within the labor force, the 55 to 59 years age range has the highest percentage of unemployed individuals, with 20.5% or 311 of them being unemployed.
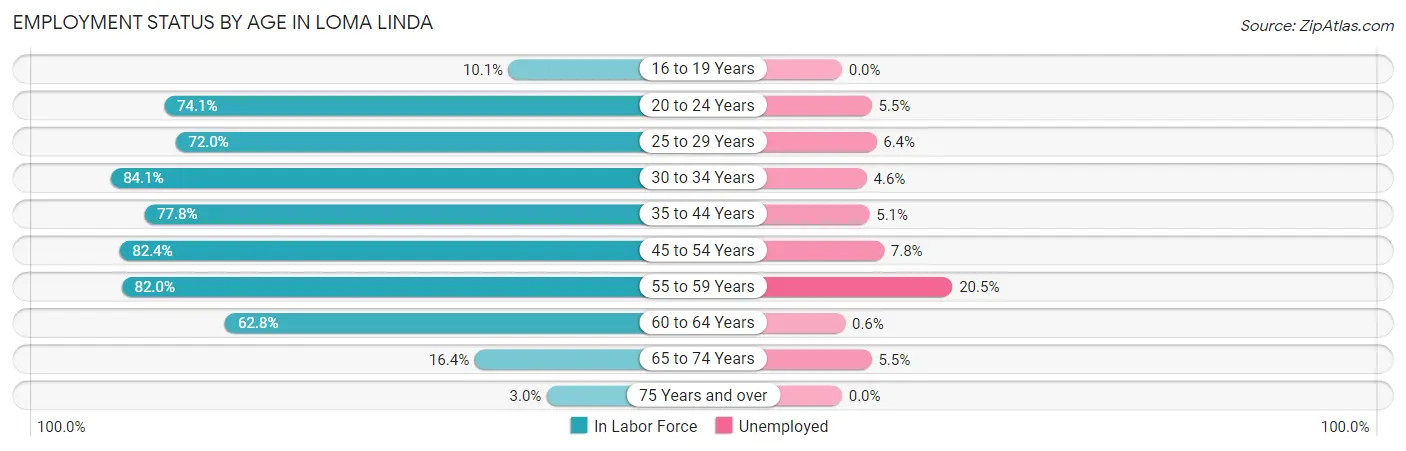
| Age Bracket | In Labor Force | Unemployed |
| 16 to 19 Years | 112 (10.1%) | 0 (0.0%) |
| 20 to 24 Years | 1,203 (74.1%) | 66 (5.5%) |
| 25 to 29 Years | 1,886 (72.0%) | 121 (6.4%) |
| 30 to 34 Years | 1,732 (84.1%) | 80 (4.6%) |
| 35 to 44 Years | 2,287 (77.8%) | 117 (5.1%) |
| 45 to 54 Years | 1,965 (82.4%) | 153 (7.8%) |
| 55 to 59 Years | 1,516 (82.0%) | 311 (20.5%) |
| 60 to 64 Years | 997 (62.8%) | 6 (0.6%) |
| 65 to 74 Years | 402 (16.4%) | 22 (5.5%) |
| 75 Years and over | 64 (3.0%) | 0 (0.0%) |
| Total | 12,157 (58.6%) | 875 (7.2%) |
Employment Status by Educational Attainment in Loma Linda
According to labor force statistics for Loma Linda, 77.3% of individuals (10,390) out of the total population between 25 and 64 years of age (13,441) are in the labor force, with 7.6% or 790 of them being unemployed. The group with the highest labor force participation rate are those with the educational attainment of bachelor's degree or higher, with 82.4% or 5,522 individuals in the labor force. Within the labor force, individuals with college / associate degree education have the highest percentage of unemployment, with 14.9% or 401 of them being unemployed.
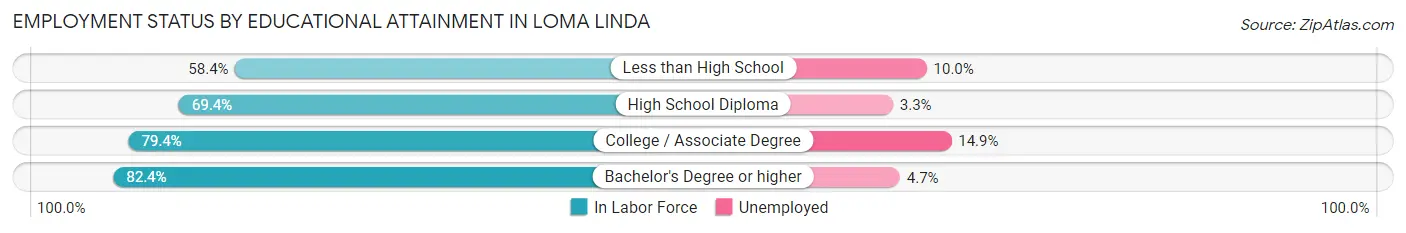
| Educational Attainment | In Labor Force | Unemployed |
| Less than High School | 832 (58.4%) | 142 (10.0%) |
| High School Diploma | 1,339 (69.4%) | 64 (3.3%) |
| College / Associate Degree | 2,688 (79.4%) | 505 (14.9%) |
| Bachelor's Degree or higher | 5,522 (82.4%) | 315 (4.7%) |
| Total | 10,390 (77.3%) | 1,022 (7.6%) |
Employment Occupations by Sex in Loma Linda
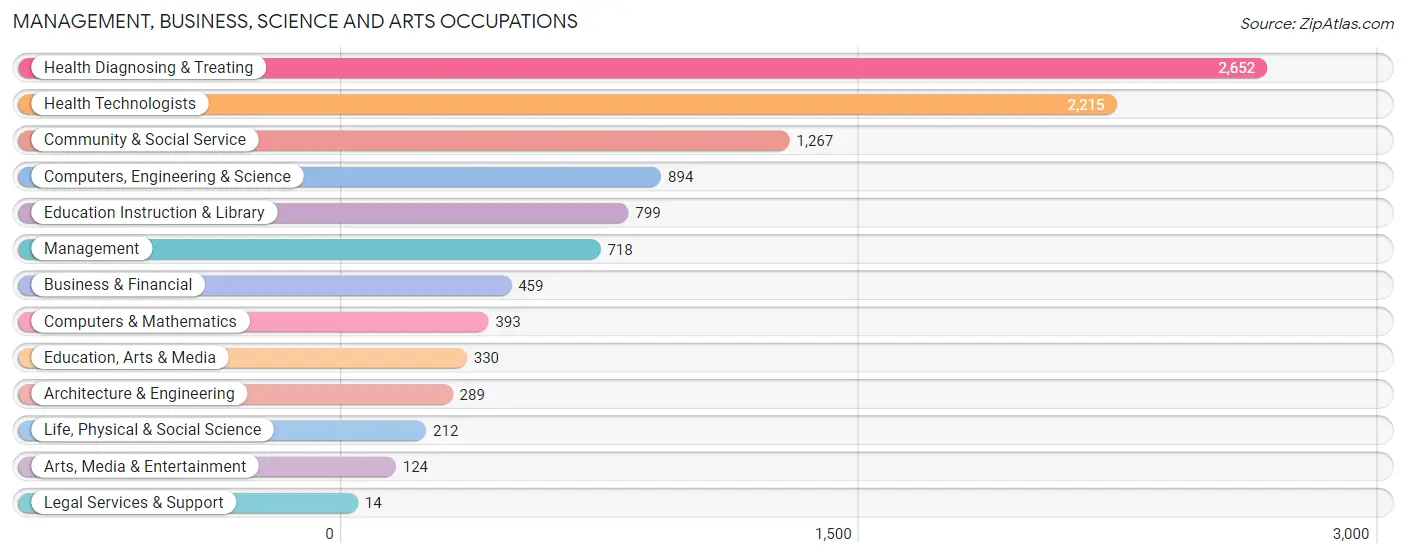
Management, Business, Science and Arts Occupations
The most common Management, Business, Science and Arts occupations in Loma Linda are Health Diagnosing & Treating (2,652 | 23.5%), Health Technologists (2,215 | 19.6%), Community & Social Service (1,267 | 11.2%), Computers, Engineering & Science (894 | 7.9%), and Education Instruction & Library (799 | 7.1%).
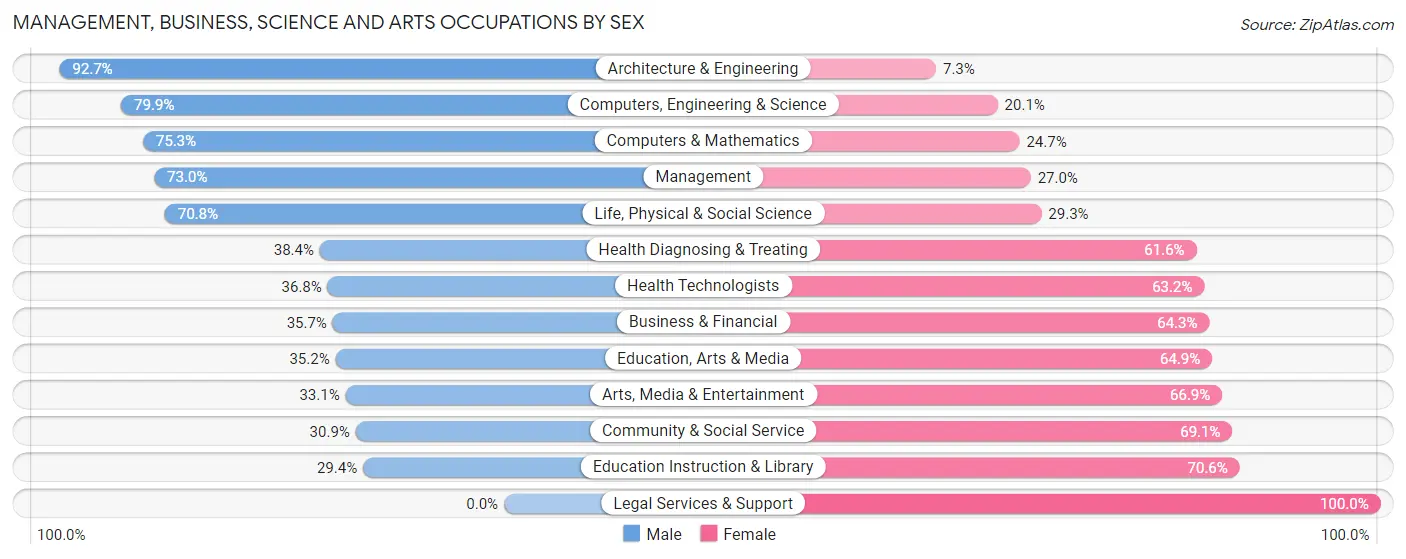
Management, Business, Science and Arts Occupations by Sex
Within the Management, Business, Science and Arts occupations in Loma Linda, the most male-oriented occupations are Architecture & Engineering (92.7%), Computers, Engineering & Science (79.9%), and Computers & Mathematics (75.3%), while the most female-oriented occupations are Legal Services & Support (100.0%), Education Instruction & Library (70.6%), and Community & Social Service (69.1%).
| Occupation | Male | Female |
| Management | 524 (73.0%) | 194 (27.0%) |
| Business & Financial | 164 (35.7%) | 295 (64.3%) |
| Computers, Engineering & Science | 714 (79.9%) | 180 (20.1%) |
| Computers & Mathematics | 296 (75.3%) | 97 (24.7%) |
| Architecture & Engineering | 268 (92.7%) | 21 (7.3%) |
| Life, Physical & Social Science | 150 (70.8%) | 62 (29.2%) |
| Community & Social Service | 392 (30.9%) | 875 (69.1%) |
| Education, Arts & Media | 116 (35.1%) | 214 (64.8%) |
| Legal Services & Support | 0 (0.0%) | 14 (100.0%) |
| Education Instruction & Library | 235 (29.4%) | 564 (70.6%) |
| Arts, Media & Entertainment | 41 (33.1%) | 83 (66.9%) |
| Health Diagnosing & Treating | 1,019 (38.4%) | 1,633 (61.6%) |
| Health Technologists | 815 (36.8%) | 1,400 (63.2%) |
| Total (Category) | 2,813 (47.0%) | 3,177 (53.0%) |
| Total (Overall) | 5,507 (48.8%) | 5,786 (51.2%) |
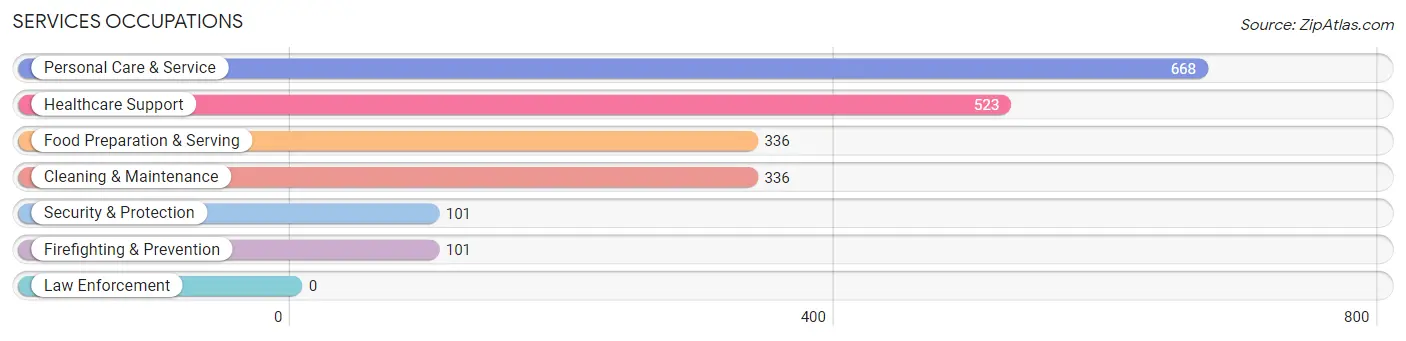
Services Occupations
The most common Services occupations in Loma Linda are Personal Care & Service (668 | 5.9%), Healthcare Support (523 | 4.6%), Food Preparation & Serving (336 | 3.0%), Cleaning & Maintenance (336 | 3.0%), and Security & Protection (101 | 0.9%).
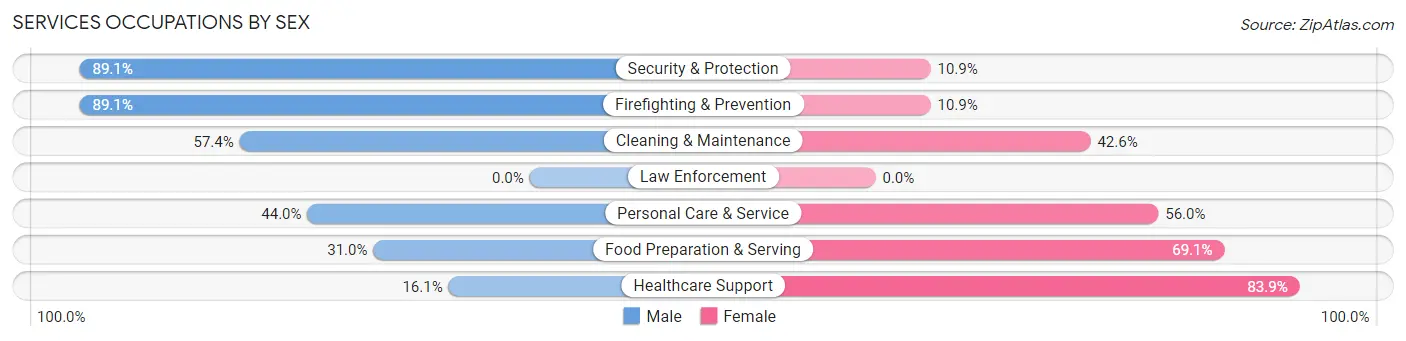
Services Occupations by Sex
Within the Services occupations in Loma Linda, the most male-oriented occupations are Security & Protection (89.1%), Firefighting & Prevention (89.1%), and Cleaning & Maintenance (57.4%), while the most female-oriented occupations are Healthcare Support (83.9%), Food Preparation & Serving (69.1%), and Personal Care & Service (56.0%).
| Occupation | Male | Female |
| Healthcare Support | 84 (16.1%) | 439 (83.9%) |
| Security & Protection | 90 (89.1%) | 11 (10.9%) |
| Firefighting & Prevention | 90 (89.1%) | 11 (10.9%) |
| Law Enforcement | 0 (0.0%) | 0 (0.0%) |
| Food Preparation & Serving | 104 (30.9%) | 232 (69.1%) |
| Cleaning & Maintenance | 193 (57.4%) | 143 (42.6%) |
| Personal Care & Service | 294 (44.0%) | 374 (56.0%) |
| Total (Category) | 765 (39.0%) | 1,199 (61.1%) |
| Total (Overall) | 5,507 (48.8%) | 5,786 (51.2%) |
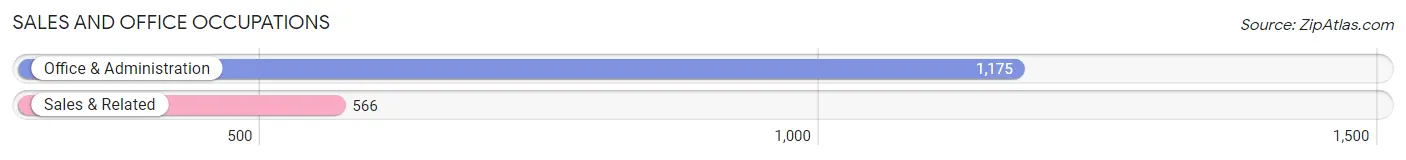
Sales and Office Occupations
The most common Sales and Office occupations in Loma Linda are Office & Administration (1,175 | 10.4%), and Sales & Related (566 | 5.0%).
Sales and Office Occupations by Sex
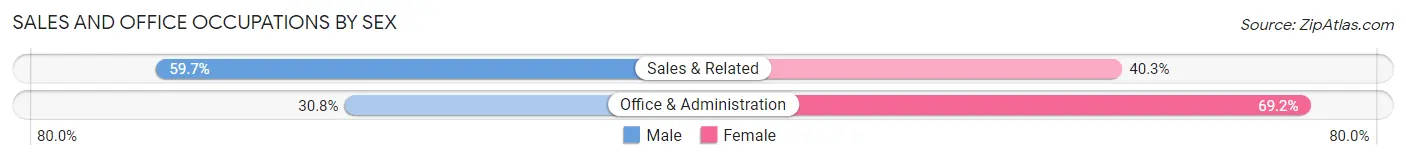
| Occupation | Male | Female |
| Sales & Related | 338 (59.7%) | 228 (40.3%) |
| Office & Administration | 362 (30.8%) | 813 (69.2%) |
| Total (Category) | 700 (40.2%) | 1,041 (59.8%) |
| Total (Overall) | 5,507 (48.8%) | 5,786 (51.2%) |
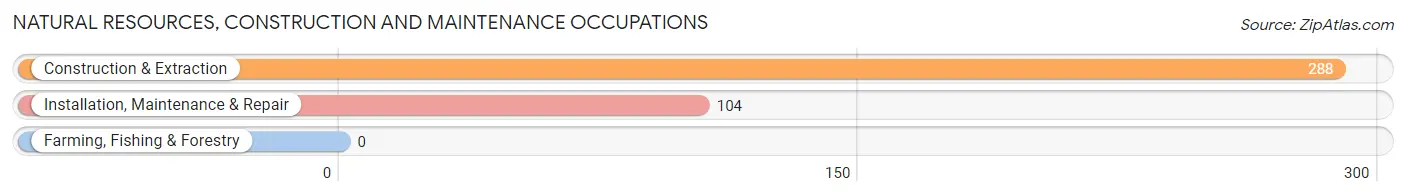
Natural Resources, Construction and Maintenance Occupations
The most common Natural Resources, Construction and Maintenance occupations in Loma Linda are Construction & Extraction (288 | 2.5%), and Installation, Maintenance & Repair (104 | 0.9%).
Natural Resources, Construction and Maintenance Occupations by Sex
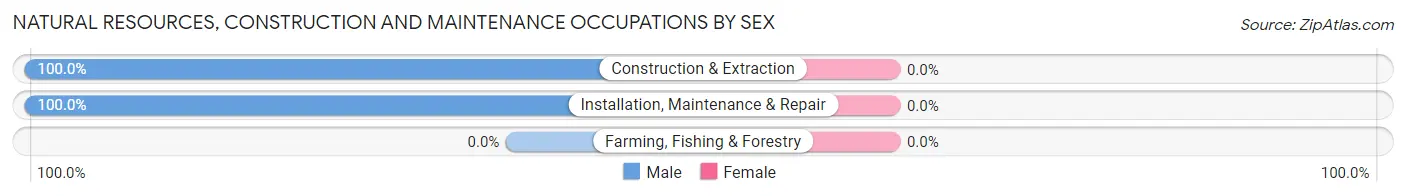
| Occupation | Male | Female |
| Farming, Fishing & Forestry | 0 (0.0%) | 0 (0.0%) |
| Construction & Extraction | 288 (100.0%) | 0 (0.0%) |
| Installation, Maintenance & Repair | 104 (100.0%) | 0 (0.0%) |
| Total (Category) | 392 (100.0%) | 0 (0.0%) |
| Total (Overall) | 5,507 (48.8%) | 5,786 (51.2%) |
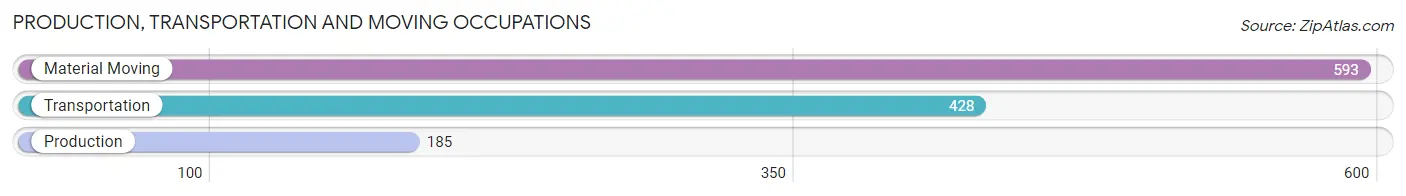
Production, Transportation and Moving Occupations
The most common Production, Transportation and Moving occupations in Loma Linda are Material Moving (593 | 5.2%), Transportation (428 | 3.8%), and Production (185 | 1.6%).
Production, Transportation and Moving Occupations by Sex
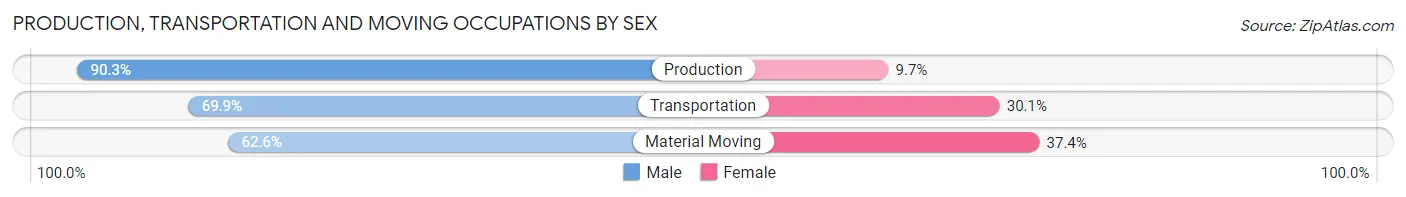
| Occupation | Male | Female |
| Production | 167 (90.3%) | 18 (9.7%) |
| Transportation | 299 (69.9%) | 129 (30.1%) |
| Material Moving | 371 (62.6%) | 222 (37.4%) |
| Total (Category) | 837 (69.4%) | 369 (30.6%) |
| Total (Overall) | 5,507 (48.8%) | 5,786 (51.2%) |
Employment Industries by Sex in Loma Linda
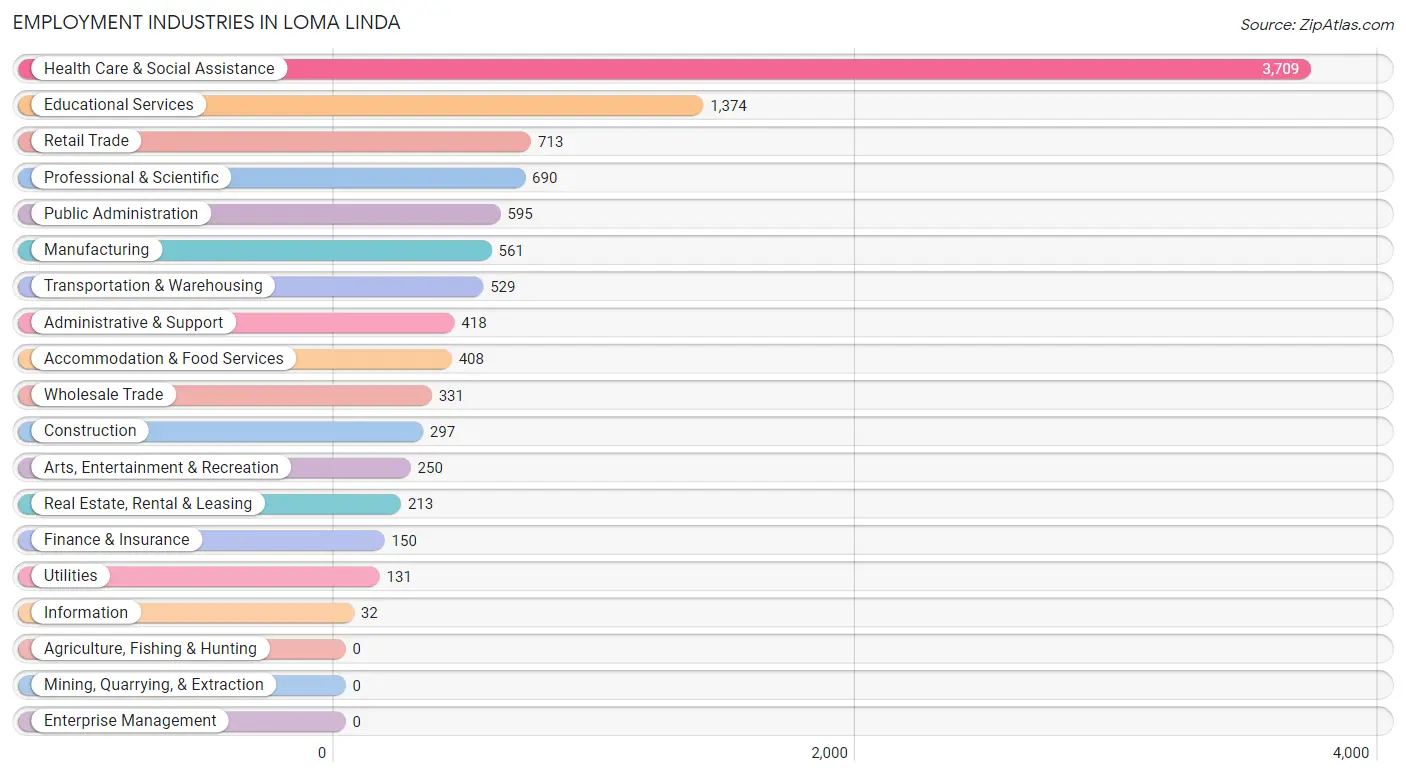
Employment Industries in Loma Linda
The major employment industries in Loma Linda include Health Care & Social Assistance (3,709 | 32.8%), Educational Services (1,374 | 12.2%), Retail Trade (713 | 6.3%), Professional & Scientific (690 | 6.1%), and Public Administration (595 | 5.3%).
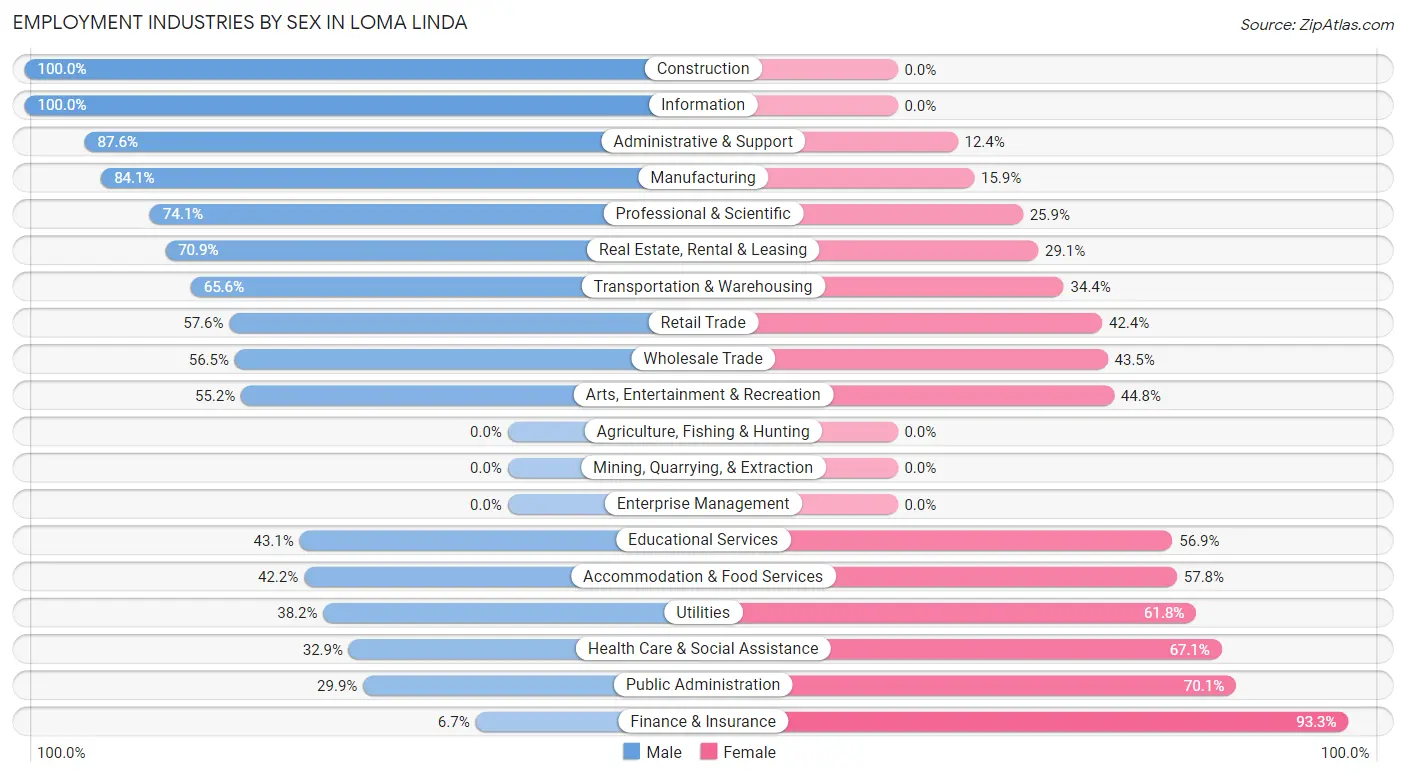
Employment Industries by Sex in Loma Linda
The Loma Linda industries that see more men than women are Construction (100.0%), Information (100.0%), and Administrative & Support (87.6%), whereas the industries that tend to have a higher number of women are Finance & Insurance (93.3%), Public Administration (70.1%), and Health Care & Social Assistance (67.1%).
| Industry | Male | Female |
| Agriculture, Fishing & Hunting | 0 (0.0%) | 0 (0.0%) |
| Mining, Quarrying, & Extraction | 0 (0.0%) | 0 (0.0%) |
| Construction | 297 (100.0%) | 0 (0.0%) |
| Manufacturing | 472 (84.1%) | 89 (15.9%) |
| Wholesale Trade | 187 (56.5%) | 144 (43.5%) |
| Retail Trade | 411 (57.6%) | 302 (42.4%) |
| Transportation & Warehousing | 347 (65.6%) | 182 (34.4%) |
| Utilities | 50 (38.2%) | 81 (61.8%) |
| Information | 32 (100.0%) | 0 (0.0%) |
| Finance & Insurance | 10 (6.7%) | 140 (93.3%) |
| Real Estate, Rental & Leasing | 151 (70.9%) | 62 (29.1%) |
| Professional & Scientific | 511 (74.1%) | 179 (25.9%) |
| Enterprise Management | 0 (0.0%) | 0 (0.0%) |
| Administrative & Support | 366 (87.6%) | 52 (12.4%) |
| Educational Services | 592 (43.1%) | 782 (56.9%) |
| Health Care & Social Assistance | 1,220 (32.9%) | 2,489 (67.1%) |
| Arts, Entertainment & Recreation | 138 (55.2%) | 112 (44.8%) |
| Accommodation & Food Services | 172 (42.2%) | 236 (57.8%) |
| Public Administration | 178 (29.9%) | 417 (70.1%) |
| Total | 5,507 (48.8%) | 5,786 (51.2%) |
Education in Loma Linda
School Enrollment in Loma Linda
The most common levels of schooling among the 6,980 students in Loma Linda are college / undergraduate (1,733 | 24.8%), graduate / professional (1,493 | 21.4%), and high school (1,180 | 16.9%).
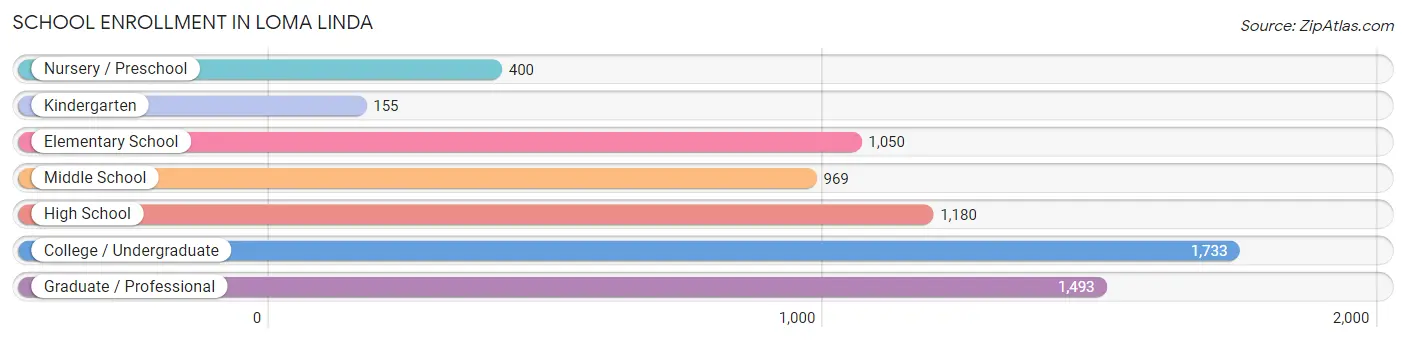
| School Level | # Students | % Students |
| Nursery / Preschool | 400 | 5.7% |
| Kindergarten | 155 | 2.2% |
| Elementary School | 1,050 | 15.0% |
| Middle School | 969 | 13.9% |
| High School | 1,180 | 16.9% |
| College / Undergraduate | 1,733 | 24.8% |
| Graduate / Professional | 1,493 | 21.4% |
| Total | 6,980 | 100.0% |
School Enrollment by Age by Funding Source in Loma Linda
Out of a total of 6,980 students who are enrolled in schools in Loma Linda, 2,520 (36.1%) attend a private institution, while the remaining 4,460 (63.9%) are enrolled in public schools. The age group of 3 to 4 year olds has the highest likelihood of being enrolled in private schools, with 249 (81.1% in the age bracket) enrolled. Conversely, the age group of 15 to 17 year olds has the lowest likelihood of being enrolled in a private school, with 728 (91.9% in the age bracket) attending a public institution.
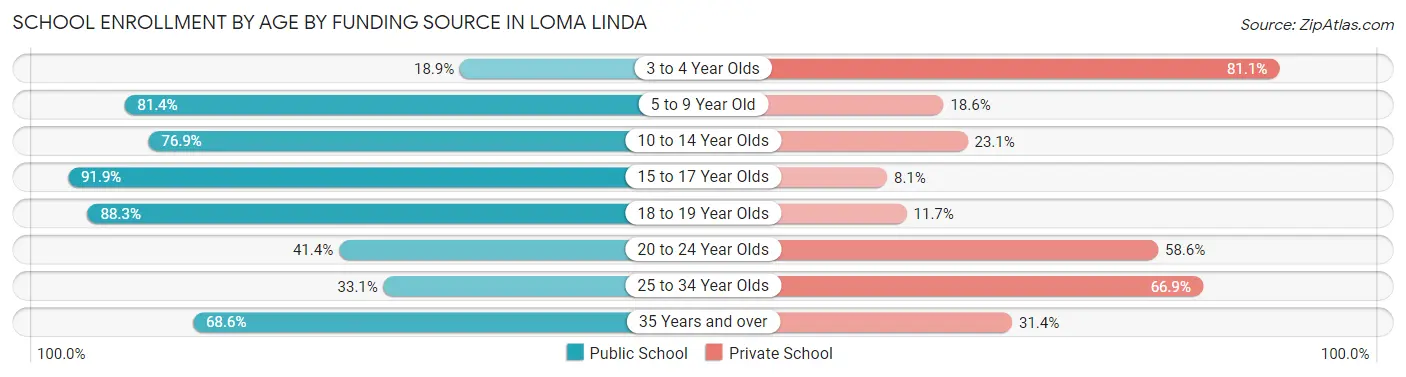
| Age Bracket | Public School | Private School |
| 3 to 4 Year Olds | 58 (18.9%) | 249 (81.1%) |
| 5 to 9 Year Old | 994 (81.4%) | 227 (18.6%) |
| 10 to 14 Year Olds | 1,027 (76.9%) | 308 (23.1%) |
| 15 to 17 Year Olds | 728 (91.9%) | 64 (8.1%) |
| 18 to 19 Year Olds | 369 (88.3%) | 49 (11.7%) |
| 20 to 24 Year Olds | 380 (41.4%) | 537 (58.6%) |
| 25 to 34 Year Olds | 429 (33.1%) | 866 (66.9%) |
| 35 Years and over | 477 (68.6%) | 218 (31.4%) |
| Total | 4,460 (63.9%) | 2,520 (36.1%) |
Educational Attainment by Field of Study in Loma Linda
Science & technology (2,034 | 21.3%), bio, nature & agricultural (1,569 | 16.5%), business (1,566 | 16.4%), education (825 | 8.6%), and engineering (594 | 6.2%) are the most common fields of study among 9,538 individuals in Loma Linda who have obtained a bachelor's degree or higher.
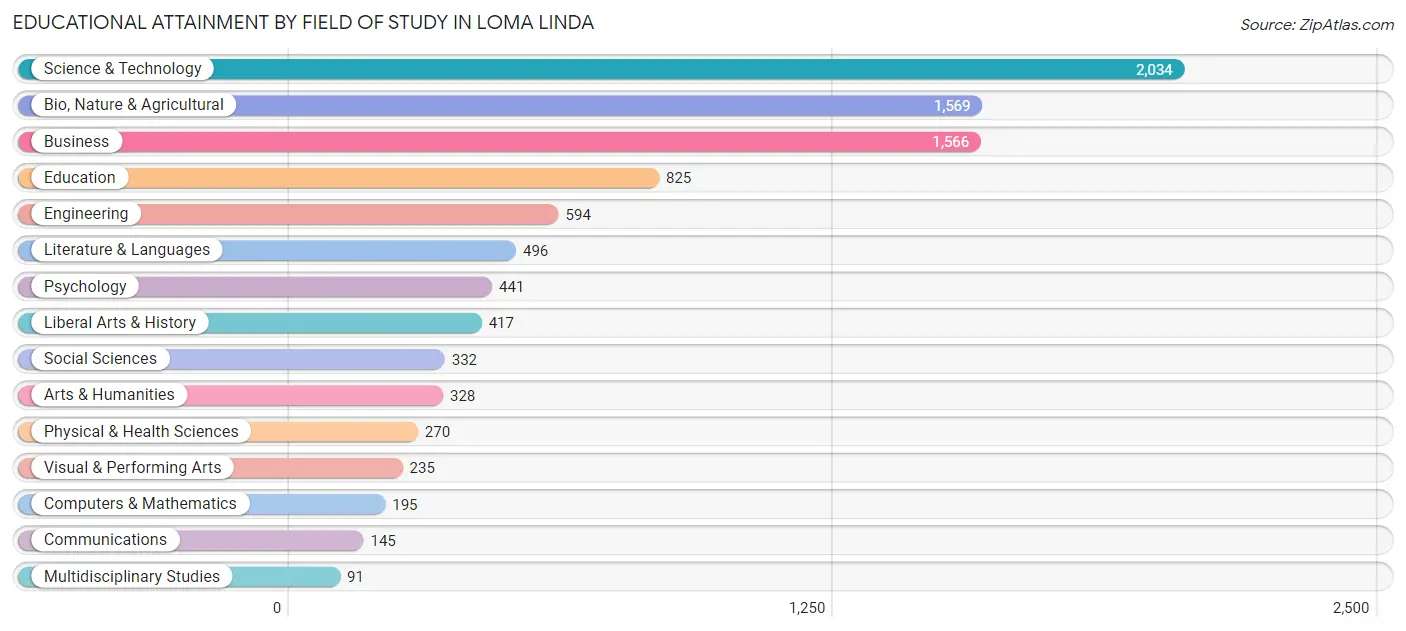
| Field of Study | # Graduates | % Graduates |
| Computers & Mathematics | 195 | 2.0% |
| Bio, Nature & Agricultural | 1,569 | 16.5% |
| Physical & Health Sciences | 270 | 2.8% |
| Psychology | 441 | 4.6% |
| Social Sciences | 332 | 3.5% |
| Engineering | 594 | 6.2% |
| Multidisciplinary Studies | 91 | 0.9% |
| Science & Technology | 2,034 | 21.3% |
| Business | 1,566 | 16.4% |
| Education | 825 | 8.6% |
| Literature & Languages | 496 | 5.2% |
| Liberal Arts & History | 417 | 4.4% |
| Visual & Performing Arts | 235 | 2.5% |
| Communications | 145 | 1.5% |
| Arts & Humanities | 328 | 3.4% |
| Total | 9,538 | 100.0% |
Transportation & Commute in Loma Linda
Vehicle Availability by Sex in Loma Linda
The most prevalent vehicle ownership categories in Loma Linda are males with 2 vehicles (2,345, accounting for 44.3%) and females with 2 vehicles (2,453, making up 42.7%).
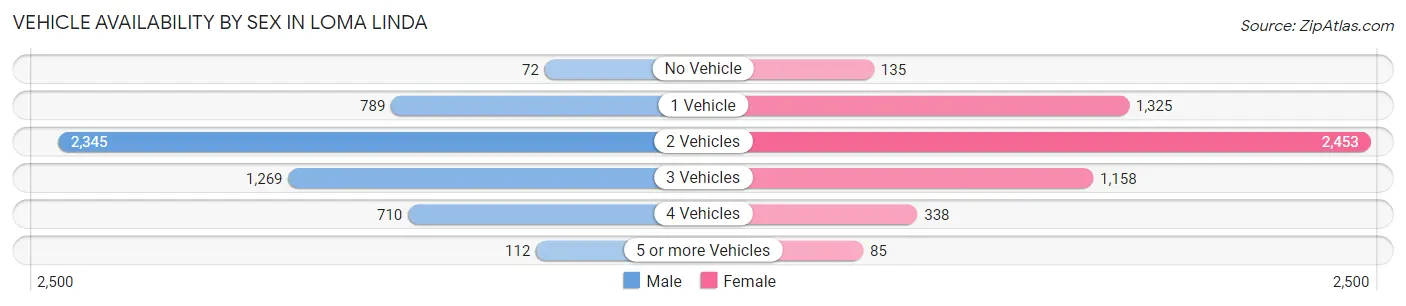
| Vehicles Available | Male | Female |
| No Vehicle | 72 (1.4%) | 135 (2.5%) |
| 1 Vehicle | 789 (14.9%) | 1,325 (24.1%) |
| 2 Vehicles | 2,345 (44.3%) | 2,453 (44.7%) |
| 3 Vehicles | 1,269 (24.0%) | 1,158 (21.1%) |
| 4 Vehicles | 710 (13.4%) | 338 (6.1%) |
| 5 or more Vehicles | 112 (2.1%) | 85 (1.5%) |
| Total | 5,297 (100.0%) | 5,494 (100.0%) |
Commute Time in Loma Linda
The most frequently occuring commute durations in Loma Linda are 10 to 14 minutes (1,893 commuters, 19.4%), 15 to 19 minutes (1,829 commuters, 18.7%), and 5 to 9 minutes (1,314 commuters, 13.5%).
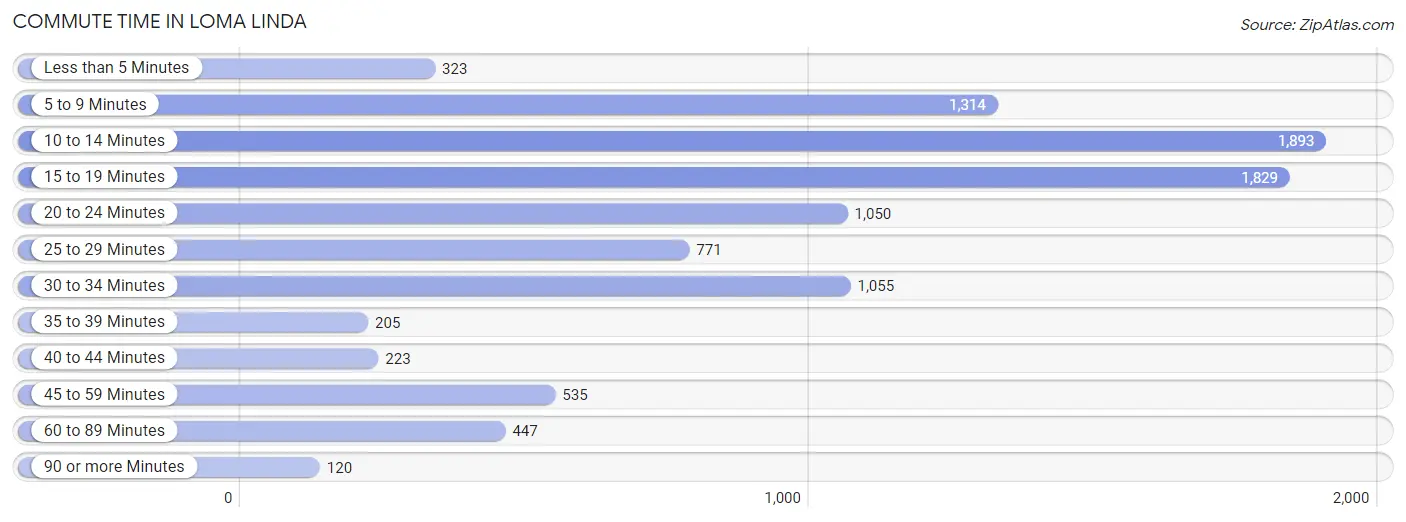
| Commute Time | # Commuters | % Commuters |
| Less than 5 Minutes | 323 | 3.3% |
| 5 to 9 Minutes | 1,314 | 13.5% |
| 10 to 14 Minutes | 1,893 | 19.4% |
| 15 to 19 Minutes | 1,829 | 18.7% |
| 20 to 24 Minutes | 1,050 | 10.7% |
| 25 to 29 Minutes | 771 | 7.9% |
| 30 to 34 Minutes | 1,055 | 10.8% |
| 35 to 39 Minutes | 205 | 2.1% |
| 40 to 44 Minutes | 223 | 2.3% |
| 45 to 59 Minutes | 535 | 5.5% |
| 60 to 89 Minutes | 447 | 4.6% |
| 90 or more Minutes | 120 | 1.2% |
Commute Time by Sex in Loma Linda
The most common commute times in Loma Linda are 15 to 19 minutes (1,038 commuters, 22.2%) for males and 10 to 14 minutes (1,157 commuters, 22.8%) for females.
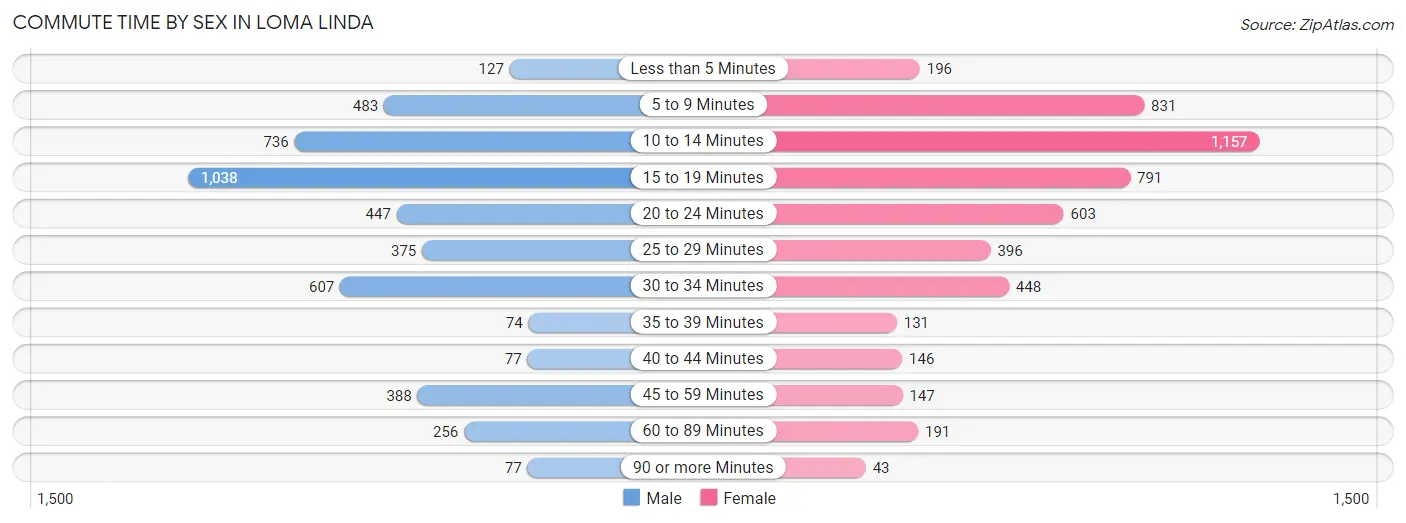
| Commute Time | Male | Female |
| Less than 5 Minutes | 127 (2.7%) | 196 (3.9%) |
| 5 to 9 Minutes | 483 (10.3%) | 831 (16.4%) |
| 10 to 14 Minutes | 736 (15.7%) | 1,157 (22.8%) |
| 15 to 19 Minutes | 1,038 (22.2%) | 791 (15.6%) |
| 20 to 24 Minutes | 447 (9.5%) | 603 (11.9%) |
| 25 to 29 Minutes | 375 (8.0%) | 396 (7.8%) |
| 30 to 34 Minutes | 607 (13.0%) | 448 (8.8%) |
| 35 to 39 Minutes | 74 (1.6%) | 131 (2.6%) |
| 40 to 44 Minutes | 77 (1.6%) | 146 (2.9%) |
| 45 to 59 Minutes | 388 (8.3%) | 147 (2.9%) |
| 60 to 89 Minutes | 256 (5.5%) | 191 (3.8%) |
| 90 or more Minutes | 77 (1.6%) | 43 (0.9%) |
Time of Departure to Work by Sex in Loma Linda
The most frequent times of departure to work in Loma Linda are 7:30 AM to 7:59 AM (695, 14.8%) for males and 7:30 AM to 7:59 AM (749, 14.7%) for females.
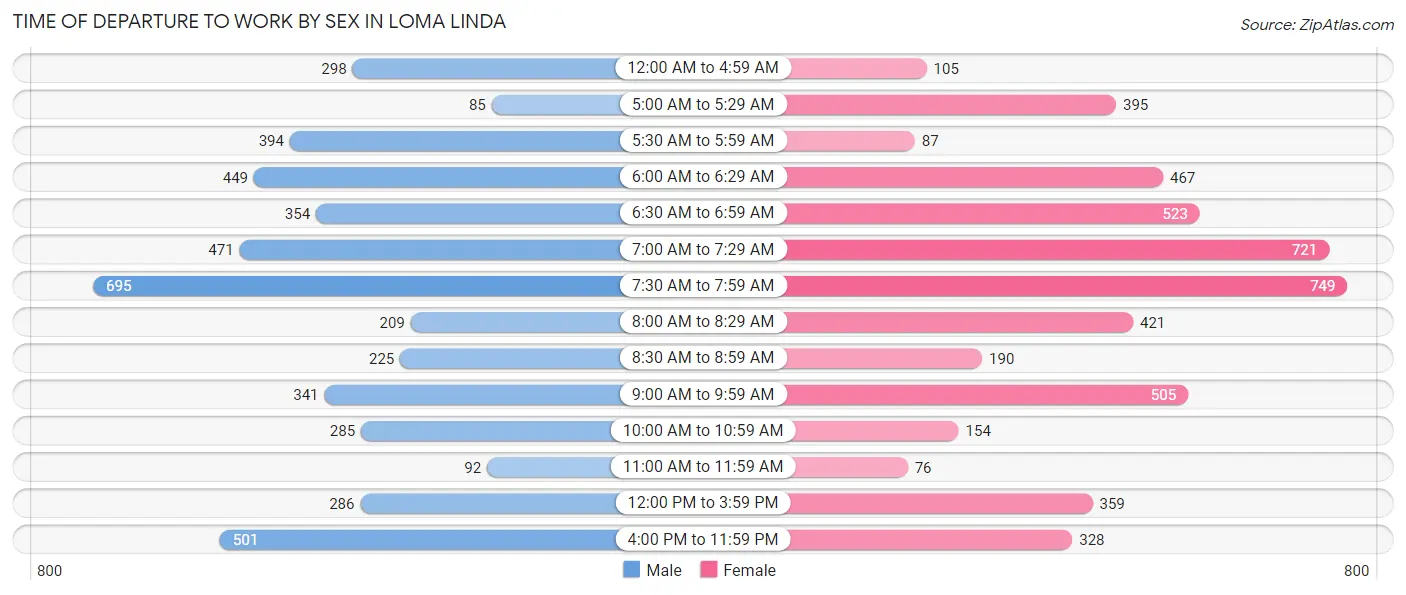
| Time of Departure | Male | Female |
| 12:00 AM to 4:59 AM | 298 (6.4%) | 105 (2.1%) |
| 5:00 AM to 5:29 AM | 85 (1.8%) | 395 (7.8%) |
| 5:30 AM to 5:59 AM | 394 (8.4%) | 87 (1.7%) |
| 6:00 AM to 6:29 AM | 449 (9.6%) | 467 (9.2%) |
| 6:30 AM to 6:59 AM | 354 (7.6%) | 523 (10.3%) |
| 7:00 AM to 7:29 AM | 471 (10.1%) | 721 (14.2%) |
| 7:30 AM to 7:59 AM | 695 (14.8%) | 749 (14.7%) |
| 8:00 AM to 8:29 AM | 209 (4.5%) | 421 (8.3%) |
| 8:30 AM to 8:59 AM | 225 (4.8%) | 190 (3.7%) |
| 9:00 AM to 9:59 AM | 341 (7.3%) | 505 (9.9%) |
| 10:00 AM to 10:59 AM | 285 (6.1%) | 154 (3.0%) |
| 11:00 AM to 11:59 AM | 92 (2.0%) | 76 (1.5%) |
| 12:00 PM to 3:59 PM | 286 (6.1%) | 359 (7.1%) |
| 4:00 PM to 11:59 PM | 501 (10.7%) | 328 (6.5%) |
| Total | 4,685 (100.0%) | 5,080 (100.0%) |
Housing Occupancy in Loma Linda
Occupancy by Ownership in Loma Linda
Of the total 9,138 dwellings in Loma Linda, owner-occupied units account for 3,526 (38.6%), while renter-occupied units make up 5,612 (61.4%).
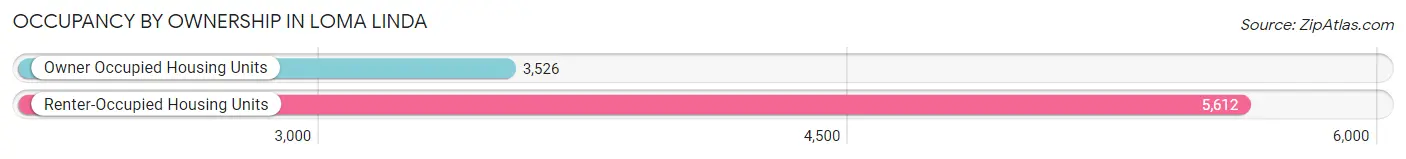
| Occupancy | # Housing Units | % Housing Units |
| Owner Occupied Housing Units | 3,526 | 38.6% |
| Renter-Occupied Housing Units | 5,612 | 61.4% |
| Total Occupied Housing Units | 9,138 | 100.0% |
Occupancy by Household Size in Loma Linda
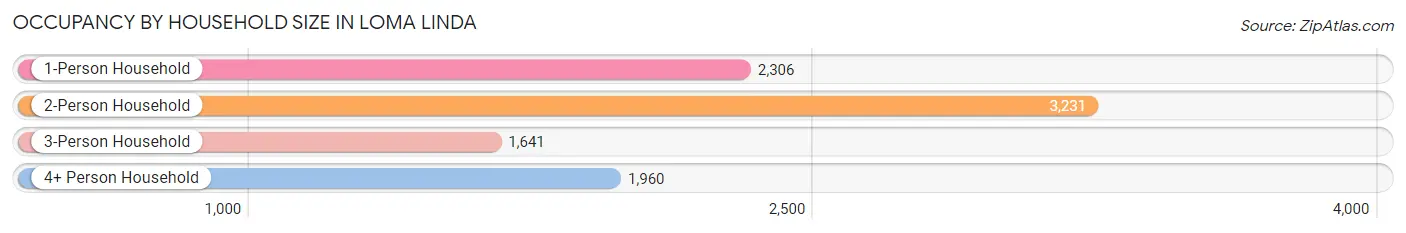
| Household Size | # Housing Units | % Housing Units |
| 1-Person Household | 2,306 | 25.2% |
| 2-Person Household | 3,231 | 35.4% |
| 3-Person Household | 1,641 | 18.0% |
| 4+ Person Household | 1,960 | 21.4% |
| Total Housing Units | 9,138 | 100.0% |
Occupancy by Ownership by Household Size in Loma Linda
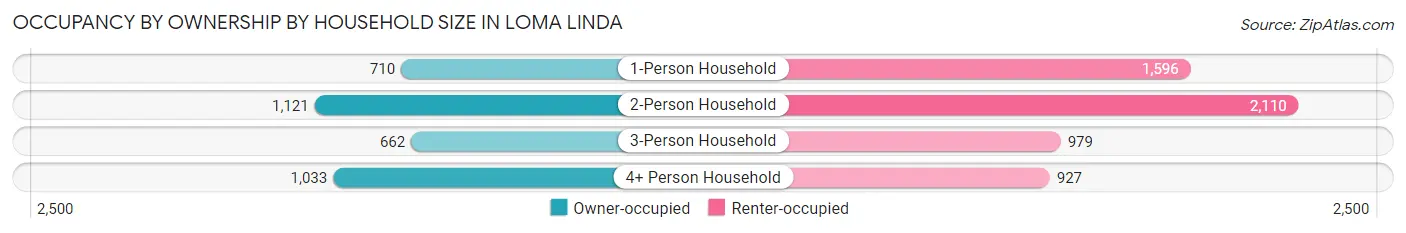
| Household Size | Owner-occupied | Renter-occupied |
| 1-Person Household | 710 (30.8%) | 1,596 (69.2%) |
| 2-Person Household | 1,121 (34.7%) | 2,110 (65.3%) |
| 3-Person Household | 662 (40.3%) | 979 (59.7%) |
| 4+ Person Household | 1,033 (52.7%) | 927 (47.3%) |
| Total Housing Units | 3,526 (38.6%) | 5,612 (61.4%) |
Occupancy by Educational Attainment in Loma Linda
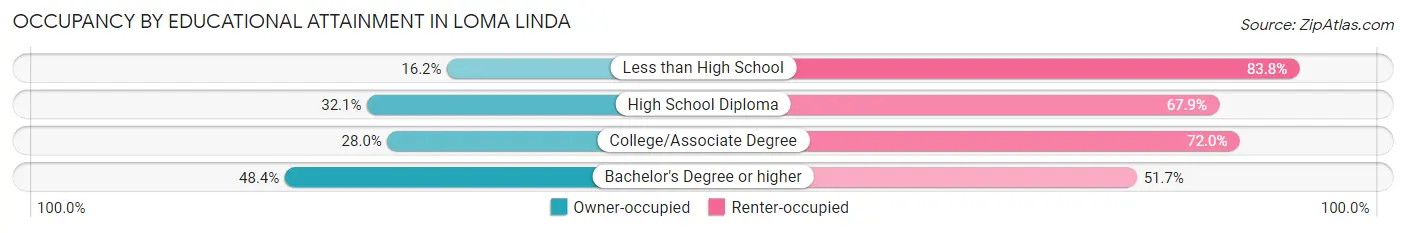
| Household Size | Owner-occupied | Renter-occupied |
| Less than High School | 121 (16.2%) | 627 (83.8%) |
| High School Diploma | 326 (32.1%) | 691 (67.9%) |
| College/Associate Degree | 669 (28.0%) | 1,719 (72.0%) |
| Bachelor's Degree or higher | 2,410 (48.3%) | 2,575 (51.6%) |
Occupancy by Age of Householder in Loma Linda
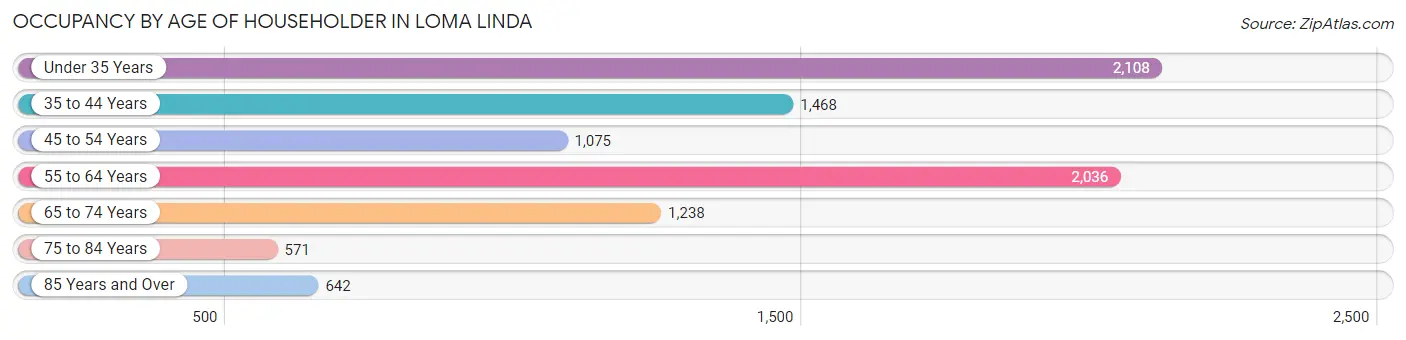
| Age Bracket | # Households | % Households |
| Under 35 Years | 2,108 | 23.1% |
| 35 to 44 Years | 1,468 | 16.1% |
| 45 to 54 Years | 1,075 | 11.8% |
| 55 to 64 Years | 2,036 | 22.3% |
| 65 to 74 Years | 1,238 | 13.6% |
| 75 to 84 Years | 571 | 6.2% |
| 85 Years and Over | 642 | 7.0% |
| Total | 9,138 | 100.0% |
Housing Finances in Loma Linda
Median Income by Occupancy in Loma Linda
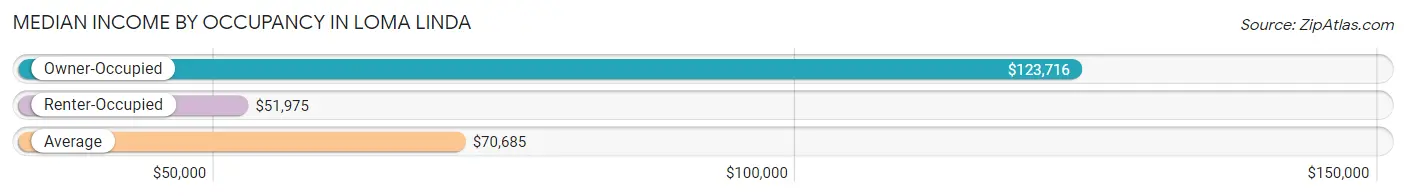
| Occupancy Type | # Households | Median Income |
| Owner-Occupied | 3,526 (38.6%) | $123,716 |
| Renter-Occupied | 5,612 (61.4%) | $51,975 |
| Average | 9,138 (100.0%) | $70,685 |
Occupancy by Householder Income Bracket in Loma Linda
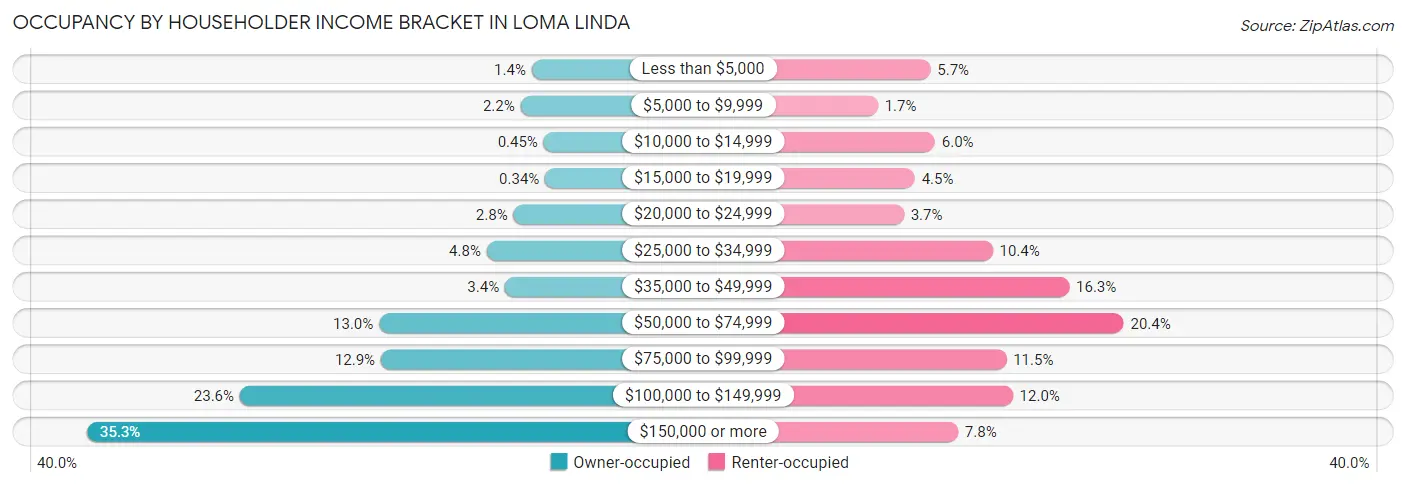
| Income Bracket | Owner-occupied | Renter-occupied |
| Less than $5,000 | 48 (1.4%) | 320 (5.7%) |
| $5,000 to $9,999 | 78 (2.2%) | 95 (1.7%) |
| $10,000 to $14,999 | 16 (0.4%) | 339 (6.0%) |
| $15,000 to $19,999 | 12 (0.3%) | 253 (4.5%) |
| $20,000 to $24,999 | 97 (2.8%) | 206 (3.7%) |
| $25,000 to $34,999 | 169 (4.8%) | 586 (10.4%) |
| $35,000 to $49,999 | 120 (3.4%) | 913 (16.3%) |
| $50,000 to $74,999 | 458 (13.0%) | 1,146 (20.4%) |
| $75,000 to $99,999 | 453 (12.9%) | 644 (11.5%) |
| $100,000 to $149,999 | 832 (23.6%) | 672 (12.0%) |
| $150,000 or more | 1,243 (35.2%) | 438 (7.8%) |
| Total | 3,526 (100.0%) | 5,612 (100.0%) |
Monthly Housing Cost Tiers in Loma Linda
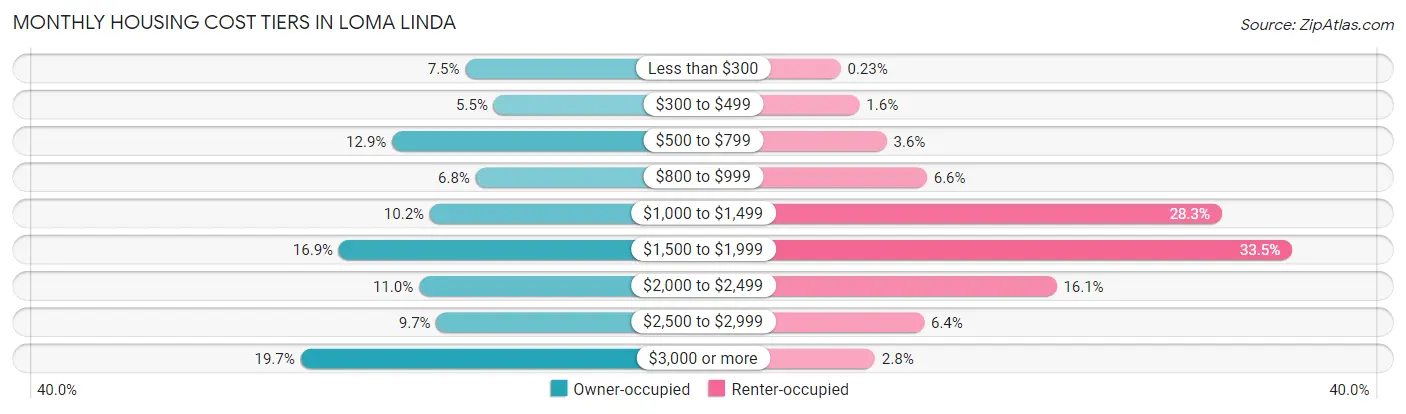
| Monthly Cost | Owner-occupied | Renter-occupied |
| Less than $300 | 266 (7.5%) | 13 (0.2%) |
| $300 to $499 | 192 (5.4%) | 91 (1.6%) |
| $500 to $799 | 456 (12.9%) | 203 (3.6%) |
| $800 to $999 | 239 (6.8%) | 369 (6.6%) |
| $1,000 to $1,499 | 358 (10.2%) | 1,588 (28.3%) |
| $1,500 to $1,999 | 594 (16.9%) | 1,879 (33.5%) |
| $2,000 to $2,499 | 386 (11.0%) | 905 (16.1%) |
| $2,500 to $2,999 | 341 (9.7%) | 358 (6.4%) |
| $3,000 or more | 694 (19.7%) | 155 (2.8%) |
| Total | 3,526 (100.0%) | 5,612 (100.0%) |
Physical Housing Characteristics in Loma Linda
Housing Structures in Loma Linda
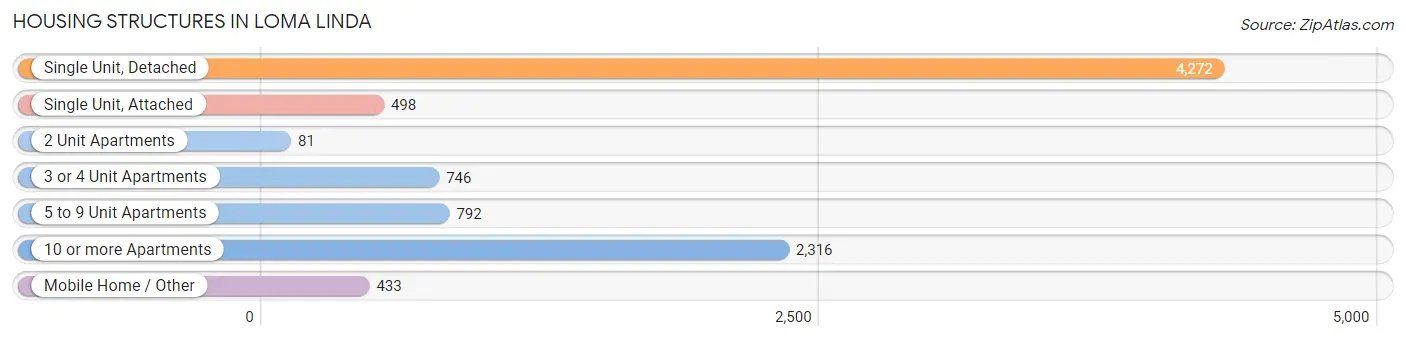
| Structure Type | # Housing Units | % Housing Units |
| Single Unit, Detached | 4,272 | 46.8% |
| Single Unit, Attached | 498 | 5.4% |
| 2 Unit Apartments | 81 | 0.9% |
| 3 or 4 Unit Apartments | 746 | 8.2% |
| 5 to 9 Unit Apartments | 792 | 8.7% |
| 10 or more Apartments | 2,316 | 25.3% |
| Mobile Home / Other | 433 | 4.7% |
| Total | 9,138 | 100.0% |
Housing Structures by Occupancy in Loma Linda
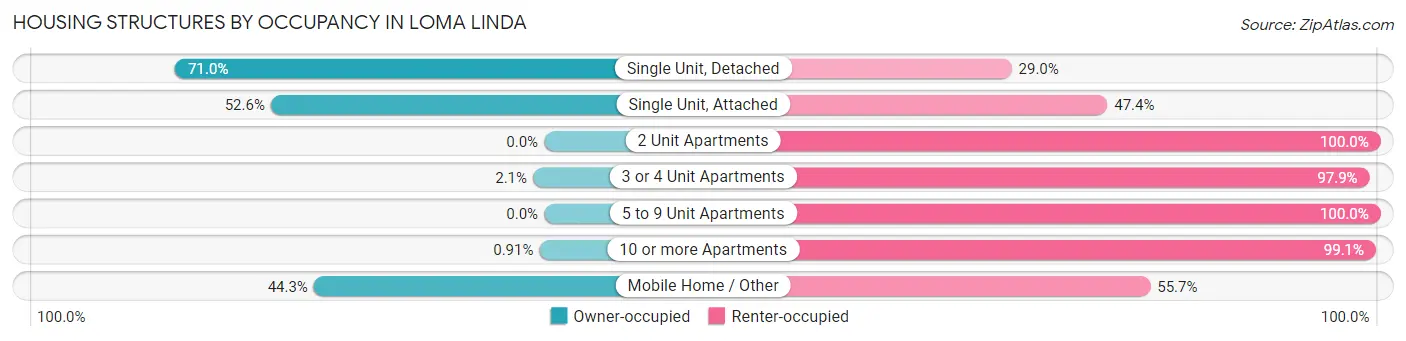
| Structure Type | Owner-occupied | Renter-occupied |
| Single Unit, Detached | 3,035 (71.0%) | 1,237 (29.0%) |
| Single Unit, Attached | 262 (52.6%) | 236 (47.4%) |
| 2 Unit Apartments | 0 (0.0%) | 81 (100.0%) |
| 3 or 4 Unit Apartments | 16 (2.1%) | 730 (97.9%) |
| 5 to 9 Unit Apartments | 0 (0.0%) | 792 (100.0%) |
| 10 or more Apartments | 21 (0.9%) | 2,295 (99.1%) |
| Mobile Home / Other | 192 (44.3%) | 241 (55.7%) |
| Total | 3,526 (38.6%) | 5,612 (61.4%) |
Housing Structures by Number of Rooms in Loma Linda
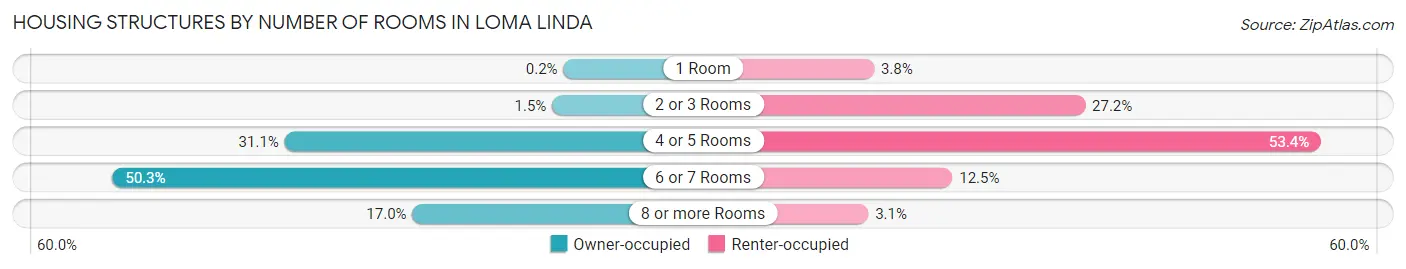
| Number of Rooms | Owner-occupied | Renter-occupied |
| 1 Room | 7 (0.2%) | 212 (3.8%) |
| 2 or 3 Rooms | 51 (1.5%) | 1,527 (27.2%) |
| 4 or 5 Rooms | 1,098 (31.1%) | 2,997 (53.4%) |
| 6 or 7 Rooms | 1,772 (50.3%) | 700 (12.5%) |
| 8 or more Rooms | 598 (17.0%) | 176 (3.1%) |
| Total | 3,526 (100.0%) | 5,612 (100.0%) |
Housing Structure by Heating Type in Loma Linda
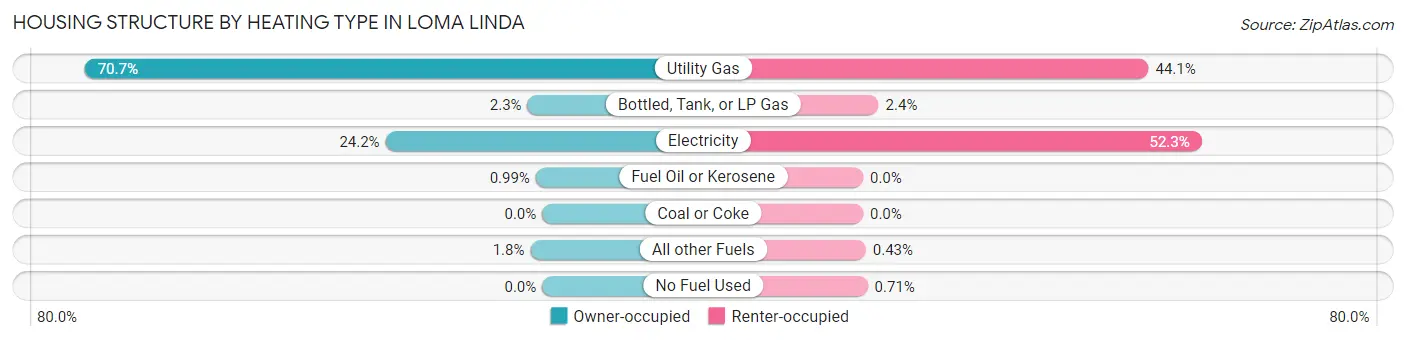
| Heating Type | Owner-occupied | Renter-occupied |
| Utility Gas | 2,493 (70.7%) | 2,477 (44.1%) |
| Bottled, Tank, or LP Gas | 80 (2.3%) | 135 (2.4%) |
| Electricity | 854 (24.2%) | 2,936 (52.3%) |
| Fuel Oil or Kerosene | 35 (1.0%) | 0 (0.0%) |
| Coal or Coke | 0 (0.0%) | 0 (0.0%) |
| All other Fuels | 64 (1.8%) | 24 (0.4%) |
| No Fuel Used | 0 (0.0%) | 40 (0.7%) |
| Total | 3,526 (100.0%) | 5,612 (100.0%) |
Household Vehicle Usage in Loma Linda
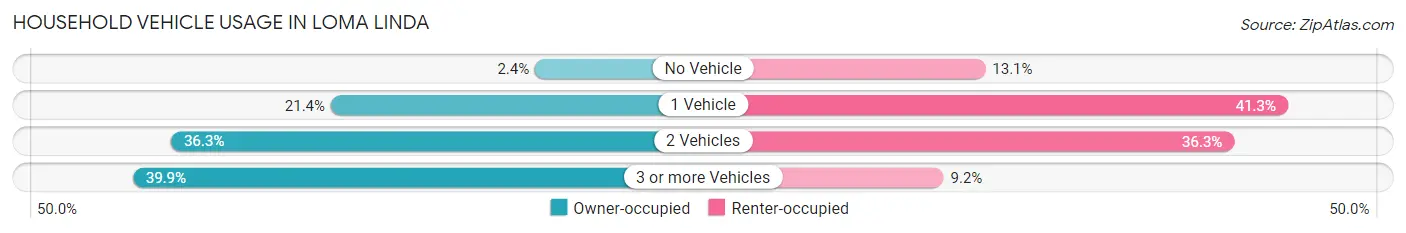
| Vehicles per Household | Owner-occupied | Renter-occupied |
| No Vehicle | 83 (2.4%) | 736 (13.1%) |
| 1 Vehicle | 755 (21.4%) | 2,320 (41.3%) |
| 2 Vehicles | 1,281 (36.3%) | 2,039 (36.3%) |
| 3 or more Vehicles | 1,407 (39.9%) | 517 (9.2%) |
| Total | 3,526 (100.0%) | 5,612 (100.0%) |
Real Estate & Mortgages in Loma Linda
Real Estate and Mortgage Overview in Loma Linda
| Characteristic | Without Mortgage | With Mortgage |
| Housing Units | 1,406 | 2,120 |
| Median Property Value | $449,200 | $519,200 |
| Median Household Income | $93,542 | $997 |
| Monthly Housing Costs | $673 | $694 |
| Real Estate Taxes | $3,793 | $39 |
Property Value by Mortgage Status in Loma Linda
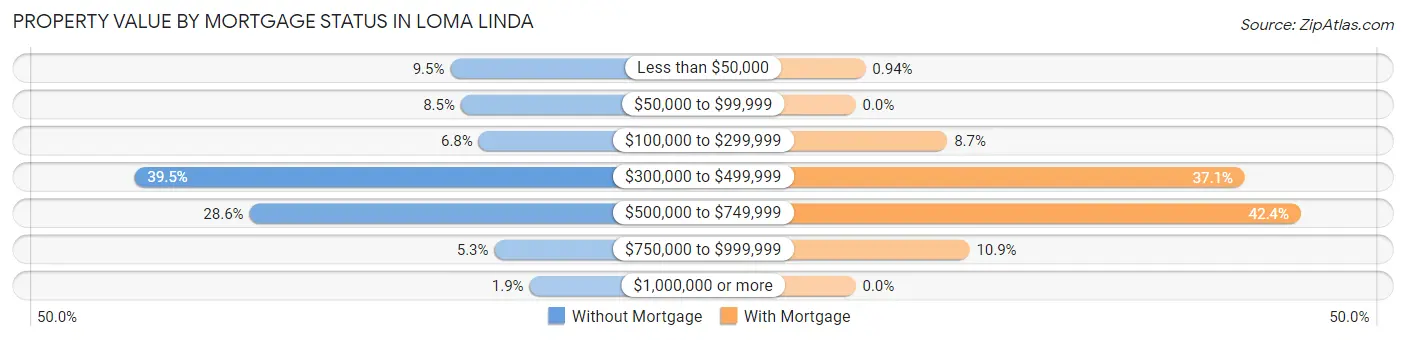
| Property Value | Without Mortgage | With Mortgage |
| Less than $50,000 | 133 (9.5%) | 20 (0.9%) |
| $50,000 to $99,999 | 119 (8.5%) | 0 (0.0%) |
| $100,000 to $299,999 | 95 (6.8%) | 185 (8.7%) |
| $300,000 to $499,999 | 556 (39.5%) | 786 (37.1%) |
| $500,000 to $749,999 | 402 (28.6%) | 899 (42.4%) |
| $750,000 to $999,999 | 74 (5.3%) | 230 (10.8%) |
| $1,000,000 or more | 27 (1.9%) | 0 (0.0%) |
| Total | 1,406 (100.0%) | 2,120 (100.0%) |
Household Income by Mortgage Status in Loma Linda
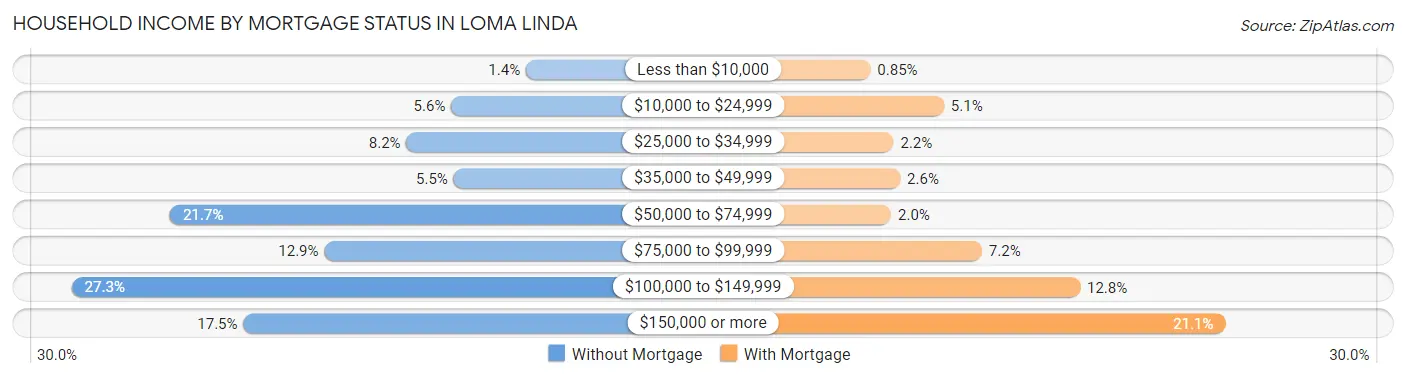
| Household Income | Without Mortgage | With Mortgage |
| Less than $10,000 | 19 (1.3%) | 18 (0.9%) |
| $10,000 to $24,999 | 79 (5.6%) | 107 (5.1%) |
| $25,000 to $34,999 | 115 (8.2%) | 46 (2.2%) |
| $35,000 to $49,999 | 77 (5.5%) | 54 (2.5%) |
| $50,000 to $74,999 | 305 (21.7%) | 43 (2.0%) |
| $75,000 to $99,999 | 181 (12.9%) | 153 (7.2%) |
| $100,000 to $149,999 | 384 (27.3%) | 272 (12.8%) |
| $150,000 or more | 246 (17.5%) | 448 (21.1%) |
| Total | 1,406 (100.0%) | 2,120 (100.0%) |
Property Value to Household Income Ratio in Loma Linda
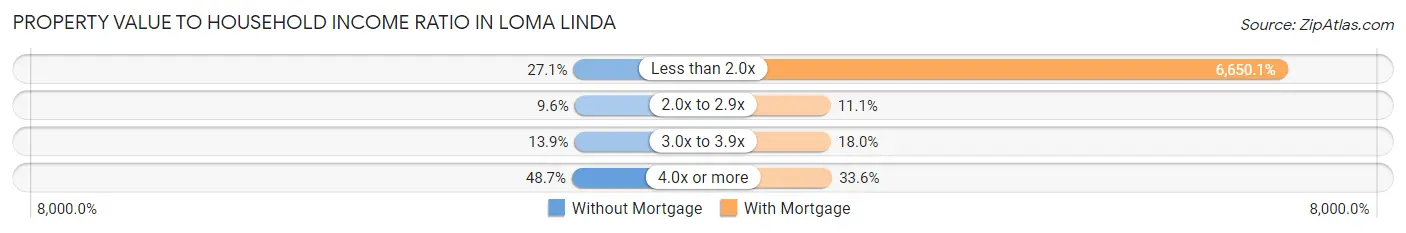
| Value-to-Income Ratio | Without Mortgage | With Mortgage |
| Less than 2.0x | 381 (27.1%) | 140,982 (6,650.1%) |
| 2.0x to 2.9x | 135 (9.6%) | 235 (11.1%) |
| 3.0x to 3.9x | 196 (13.9%) | 381 (18.0%) |
| 4.0x or more | 685 (48.7%) | 712 (33.6%) |
| Total | 1,406 (100.0%) | 2,120 (100.0%) |
Real Estate Taxes by Mortgage Status in Loma Linda
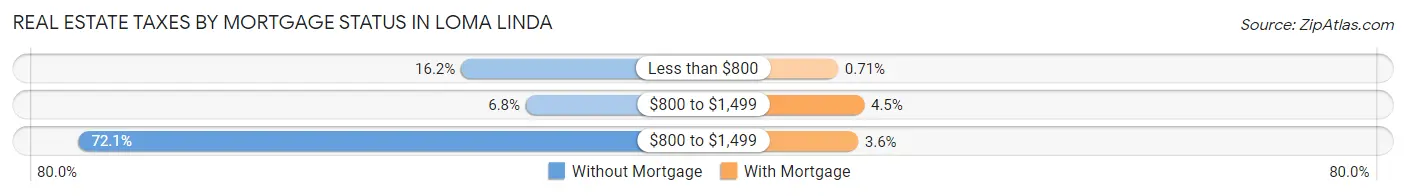
| Property Taxes | Without Mortgage | With Mortgage |
| Less than $800 | 228 (16.2%) | 15 (0.7%) |
| $800 to $1,499 | 95 (6.8%) | 96 (4.5%) |
| $800 to $1,499 | 1,014 (72.1%) | 77 (3.6%) |
| Total | 1,406 (100.0%) | 2,120 (100.0%) |
Health & Disability in Loma Linda
Health Insurance Coverage by Age in Loma Linda
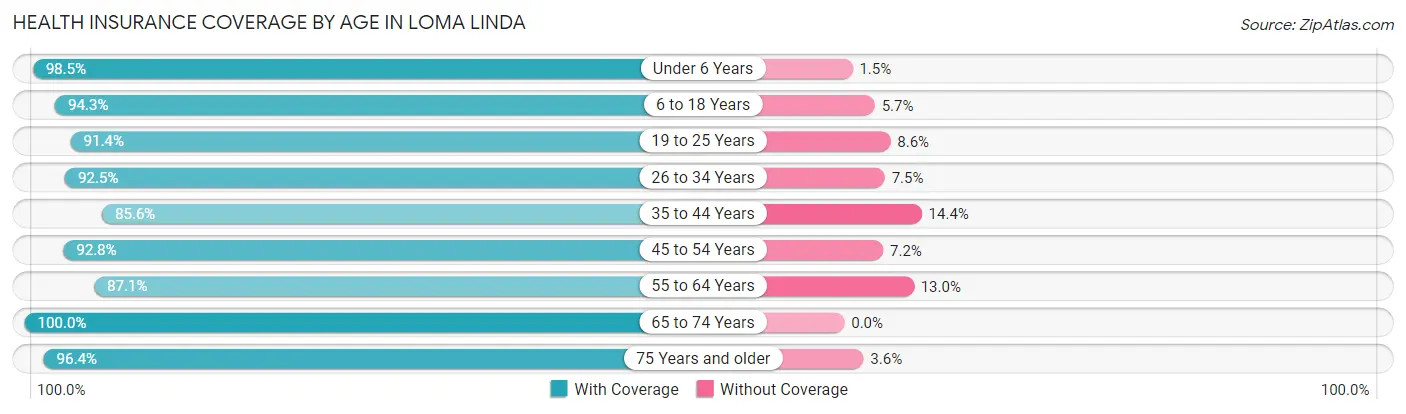
| Age Bracket | With Coverage | Without Coverage |
| Under 6 Years | 1,362 (98.5%) | 21 (1.5%) |
| 6 to 18 Years | 3,290 (94.3%) | 198 (5.7%) |
| 19 to 25 Years | 2,171 (91.4%) | 204 (8.6%) |
| 26 to 34 Years | 3,975 (92.5%) | 324 (7.5%) |
| 35 to 44 Years | 2,514 (85.6%) | 424 (14.4%) |
| 45 to 54 Years | 2,195 (92.8%) | 171 (7.2%) |
| 55 to 64 Years | 2,943 (87.1%) | 438 (13.0%) |
| 65 to 74 Years | 2,396 (100.0%) | 0 (0.0%) |
| 75 Years and older | 1,948 (96.4%) | 72 (3.6%) |
| Total | 22,794 (92.5%) | 1,852 (7.5%) |
Health Insurance Coverage by Citizenship Status in Loma Linda
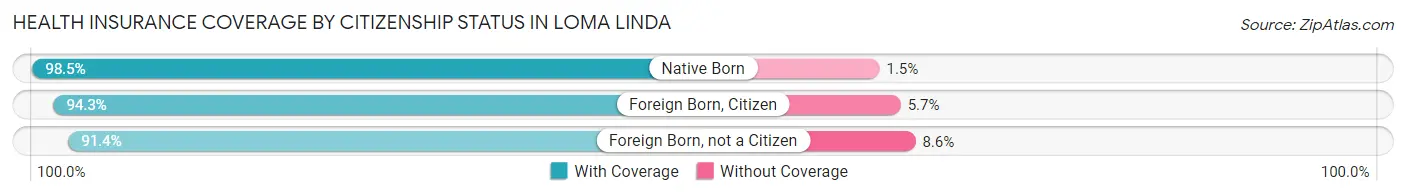
| Citizenship Status | With Coverage | Without Coverage |
| Native Born | 1,362 (98.5%) | 21 (1.5%) |
| Foreign Born, Citizen | 3,290 (94.3%) | 198 (5.7%) |
| Foreign Born, not a Citizen | 2,171 (91.4%) | 204 (8.6%) |
Health Insurance Coverage by Household Income in Loma Linda
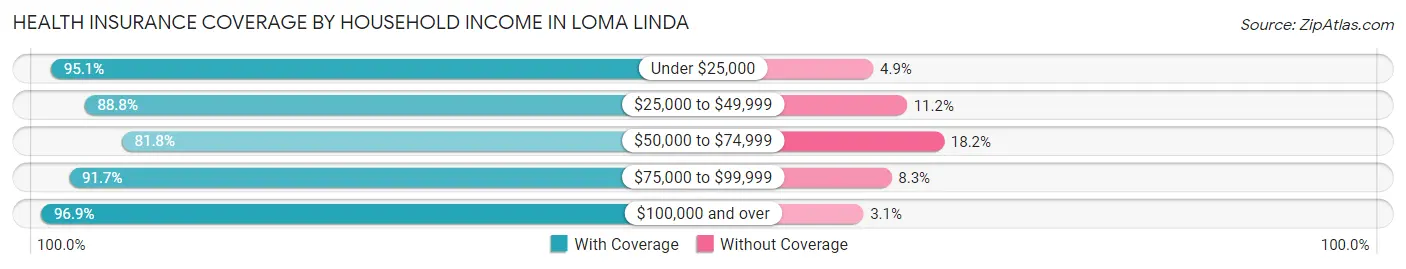
| Household Income | With Coverage | Without Coverage |
| Under $25,000 | 2,408 (95.1%) | 125 (4.9%) |
| $25,000 to $49,999 | 3,777 (88.8%) | 478 (11.2%) |
| $50,000 to $74,999 | 2,866 (81.8%) | 637 (18.2%) |
| $75,000 to $99,999 | 2,242 (91.7%) | 204 (8.3%) |
| $100,000 and over | 10,600 (96.9%) | 337 (3.1%) |
Public vs Private Health Insurance Coverage by Age in Loma Linda
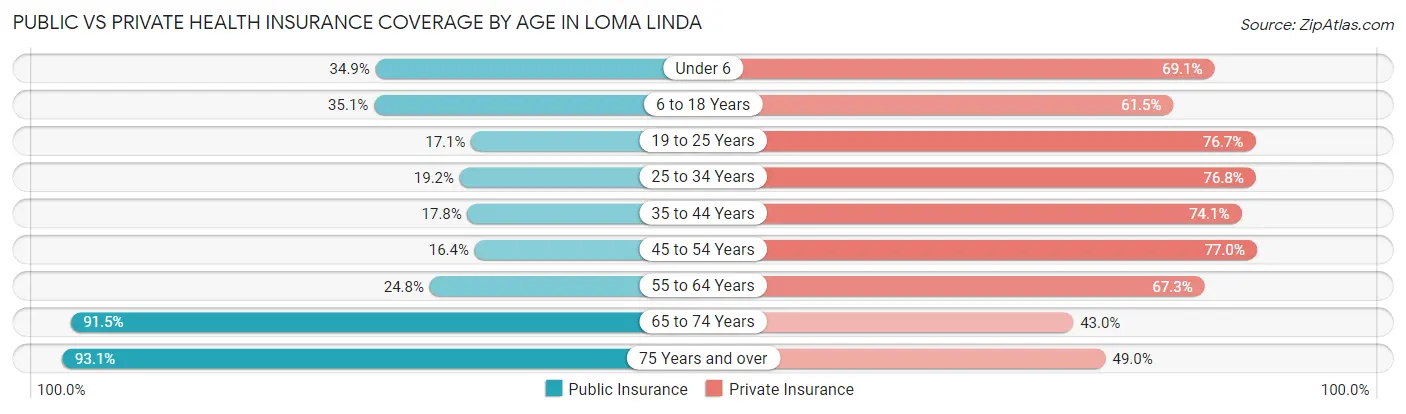
| Age Bracket | Public Insurance | Private Insurance |
| Under 6 | 482 (34.8%) | 956 (69.1%) |
| 6 to 18 Years | 1,225 (35.1%) | 2,146 (61.5%) |
| 19 to 25 Years | 406 (17.1%) | 1,822 (76.7%) |
| 25 to 34 Years | 826 (19.2%) | 3,302 (76.8%) |
| 35 to 44 Years | 522 (17.8%) | 2,178 (74.1%) |
| 45 to 54 Years | 389 (16.4%) | 1,822 (77.0%) |
| 55 to 64 Years | 838 (24.8%) | 2,276 (67.3%) |
| 65 to 74 Years | 2,193 (91.5%) | 1,029 (42.9%) |
| 75 Years and over | 1,880 (93.1%) | 989 (49.0%) |
| Total | 8,761 (35.5%) | 16,520 (67.0%) |
Disability Status by Sex by Age in Loma Linda
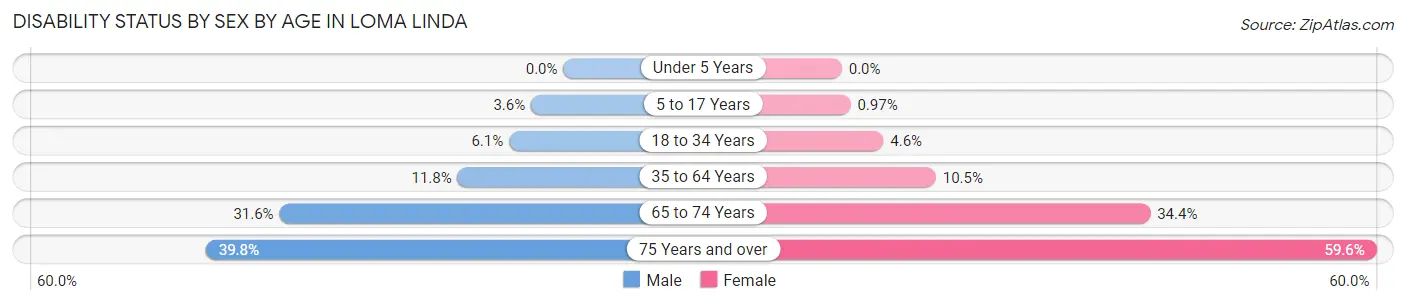
| Age Bracket | Male | Female |
| Under 5 Years | 0 (0.0%) | 0 (0.0%) |
| 5 to 17 Years | 61 (3.6%) | 18 (1.0%) |
| 18 to 34 Years | 188 (6.0%) | 170 (4.6%) |
| 35 to 64 Years | 428 (11.8%) | 529 (10.5%) |
| 65 to 74 Years | 406 (31.6%) | 382 (34.4%) |
| 75 Years and over | 311 (39.8%) | 738 (59.6%) |
Disability Class by Sex by Age in Loma Linda
Disability Class: Hearing Difficulty
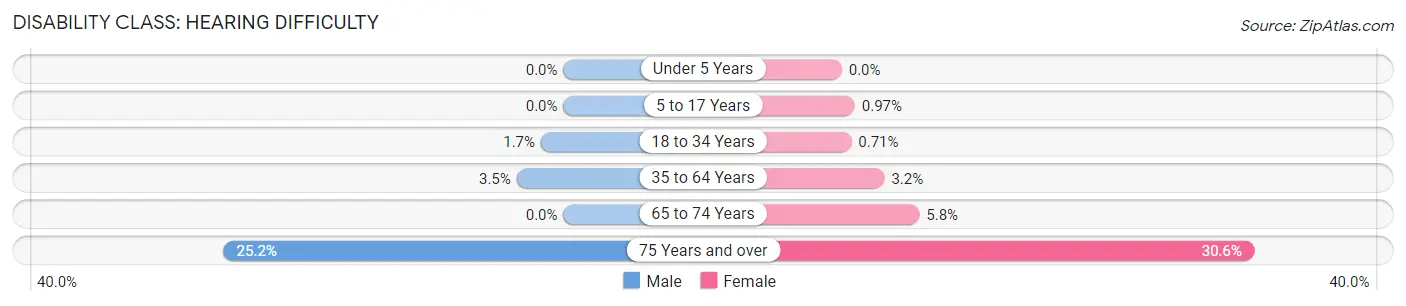
| Age Bracket | Male | Female |
| Under 5 Years | 0 (0.0%) | 0 (0.0%) |
| 5 to 17 Years | 0 (0.0%) | 18 (1.0%) |
| 18 to 34 Years | 52 (1.7%) | 26 (0.7%) |
| 35 to 64 Years | 126 (3.5%) | 160 (3.2%) |
| 65 to 74 Years | 0 (0.0%) | 64 (5.8%) |
| 75 Years and over | 197 (25.2%) | 379 (30.6%) |
Disability Class: Vision Difficulty
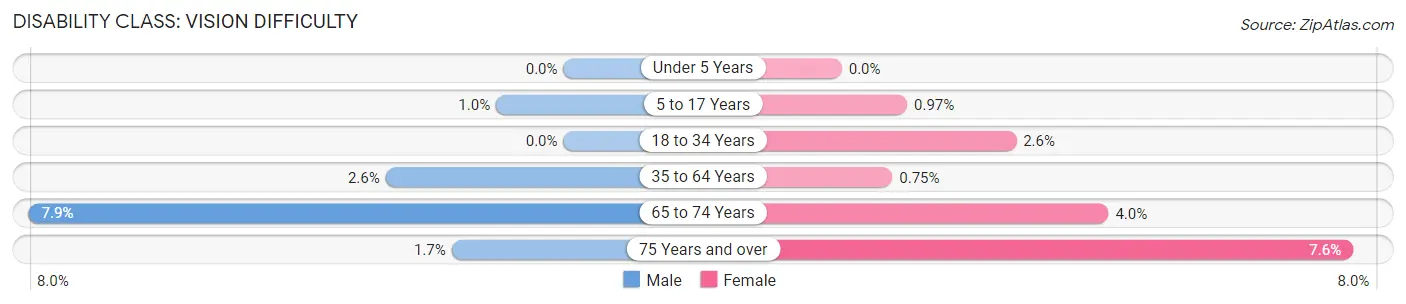
| Age Bracket | Male | Female |
| Under 5 Years | 0 (0.0%) | 0 (0.0%) |
| 5 to 17 Years | 17 (1.0%) | 18 (1.0%) |
| 18 to 34 Years | 0 (0.0%) | 95 (2.6%) |
| 35 to 64 Years | 96 (2.6%) | 38 (0.7%) |
| 65 to 74 Years | 102 (7.9%) | 44 (4.0%) |
| 75 Years and over | 13 (1.7%) | 94 (7.6%) |
Disability Class: Cognitive Difficulty
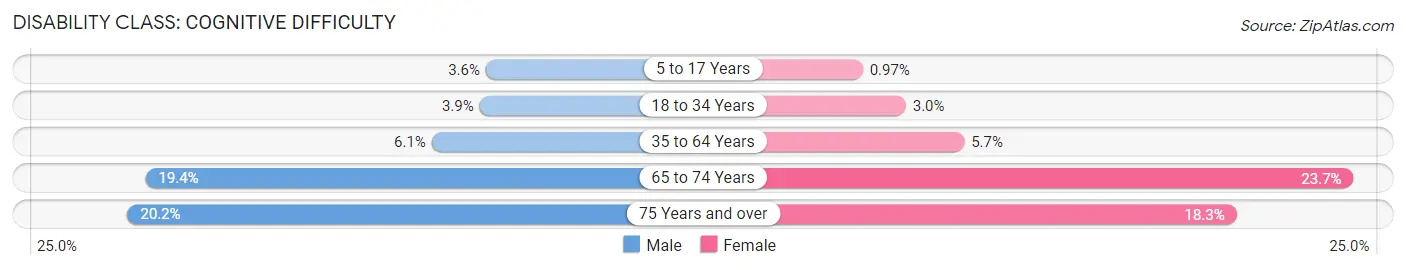
| Age Bracket | Male | Female |
| 5 to 17 Years | 61 (3.6%) | 18 (1.0%) |
| 18 to 34 Years | 121 (3.9%) | 109 (3.0%) |
| 35 to 64 Years | 222 (6.1%) | 287 (5.7%) |
| 65 to 74 Years | 249 (19.4%) | 264 (23.7%) |
| 75 Years and over | 158 (20.2%) | 227 (18.3%) |
Disability Class: Ambulatory Difficulty
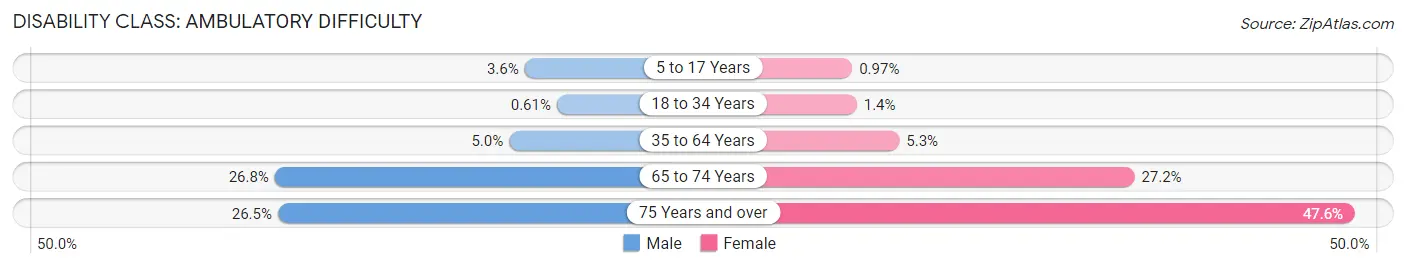
| Age Bracket | Male | Female |
| 5 to 17 Years | 61 (3.6%) | 18 (1.0%) |
| 18 to 34 Years | 19 (0.6%) | 51 (1.4%) |
| 35 to 64 Years | 183 (5.0%) | 270 (5.3%) |
| 65 to 74 Years | 344 (26.8%) | 302 (27.2%) |
| 75 Years and over | 207 (26.5%) | 590 (47.6%) |
Disability Class: Self-Care Difficulty
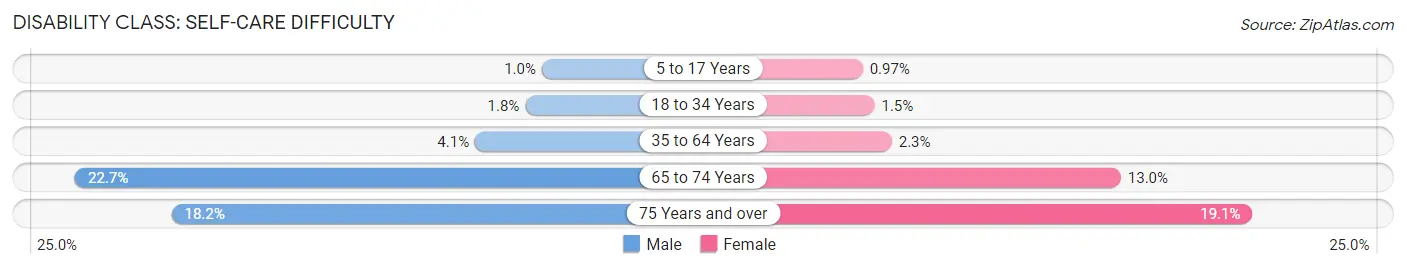
| Age Bracket | Male | Female |
| 5 to 17 Years | 17 (1.0%) | 18 (1.0%) |
| 18 to 34 Years | 55 (1.8%) | 56 (1.5%) |
| 35 to 64 Years | 149 (4.1%) | 117 (2.3%) |
| 65 to 74 Years | 291 (22.7%) | 144 (13.0%) |
| 75 Years and over | 142 (18.2%) | 236 (19.1%) |
Technology Access in Loma Linda
Computing Device Access in Loma Linda
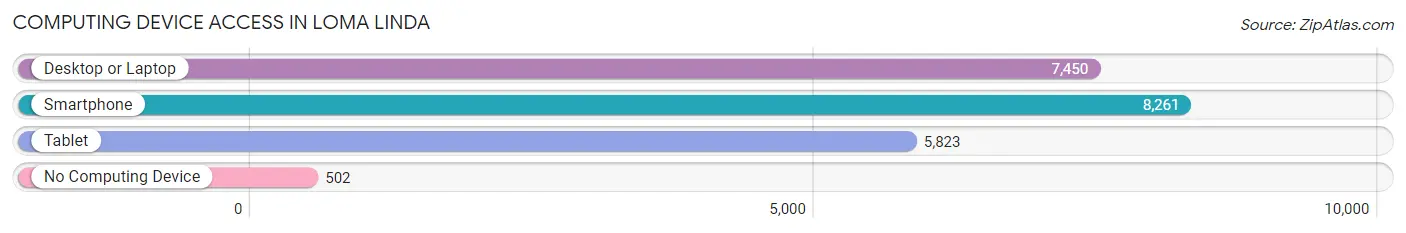
| Device Type | # Households | % Households |
| Desktop or Laptop | 7,450 | 81.5% |
| Smartphone | 8,261 | 90.4% |
| Tablet | 5,823 | 63.7% |
| No Computing Device | 502 | 5.5% |
| Total | 9,138 | 100.0% |
Internet Access in Loma Linda
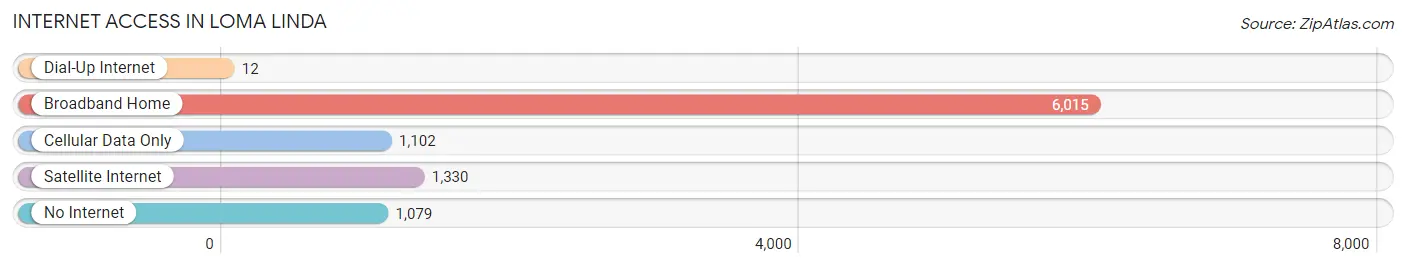
| Internet Type | # Households | % Households |
| Dial-Up Internet | 12 | 0.1% |
| Broadband Home | 6,015 | 65.8% |
| Cellular Data Only | 1,102 | 12.1% |
| Satellite Internet | 1,330 | 14.5% |
| No Internet | 1,079 | 11.8% |
| Total | 9,138 | 100.0% |
Loma Linda Summary
Loma Linda is a city located in San Bernardino County, California, United States. It is situated in the Inland Empire region of the state, and is part of the Greater Los Angeles Area. The city is known for its health care and medical research facilities, and is home to the Loma Linda University Medical Center. As of the 2010 census, the city had a population of 23,261.
History
The area that is now Loma Linda was originally inhabited by the Serrano Indians. The first Europeans to settle in the area were the Spanish, who established the Mission San Gabriel Arcangel in 1771. The area was later part of the Rancho San Bernardino land grant, and was settled by Mormon pioneers in the late 19th century. The city was incorporated in 1970, and was named after the nearby Loma Linda Hills.
Geography
Loma Linda is located in the Inland Empire region of California, about 60 miles east of Los Angeles. It is situated in the San Bernardino Valley, at the base of the San Bernardino Mountains. The city covers an area of 4.6 square miles, and has an elevation of 1,400 feet.
Climate
Loma Linda has a Mediterranean climate, with hot, dry summers and mild, wet winters. The average high temperature in the summer is around 90°F, and the average low temperature in the winter is around 40°F. The city receives an average of 15 inches of precipitation per year.
Demographics
As of the 2010 census, there were 23,261 people, 6,945 households, and 4,945 families residing in the city. The population density was 5,039.3 people per square mile. The racial makeup of the city was 63.3% White, 1.3% African American, 0.7% Native American, 8.2% Asian, 0.2% Pacific Islander, 22.3% from other races, and 4.2% from two or more races. Hispanic or Latino of any race were 37.2% of the population.
Economy
Loma Linda is home to several major medical and research facilities, including the Loma Linda University Medical Center, the Loma Linda University Children's Hospital, and the Loma Linda VA Medical Center. The city is also home to several major employers, including the San Bernardino County government, the Loma Linda University Medical Center, and the Loma Linda University School of Medicine.
The city's economy is also supported by a variety of retail and service businesses, including restaurants, grocery stores, and auto repair shops. The city is also home to several industrial parks, which provide employment opportunities in manufacturing and other industries.
Conclusion
Loma Linda is a city located in San Bernardino County, California, United States. It is situated in the Inland Empire region of the state, and is part of the Greater Los Angeles Area. The city is known for its health care and medical research facilities, and is home to the Loma Linda University Medical Center. As of the 2010 census, the city had a population of 23,261. The city has a Mediterranean climate, with hot, dry summers and mild, wet winters. The city's economy is supported by a variety of medical and research facilities, as well as retail and service businesses. The city is also home to several major employers, including the San Bernardino County government, the Loma Linda University Medical Center, and the Loma Linda University School of Medicine.
Common Questions
What is Per Capita Income in Loma Linda?
Per Capita income in Loma Linda is $37,841.
What is the Median Family Income in Loma Linda?
Median Family Income in Loma Linda is $89,014.
What is the Median Household income in Loma Linda?
Median Household Income in Loma Linda is $70,685.
What is Income or Wage Gap in Loma Linda?
Income or Wage Gap in Loma Linda is 11.7%.
Women in Loma Linda earn 88.3 cents for every dollar earned by a man.
What is Inequality or Gini Index in Loma Linda?
Inequality or Gini Index in Loma Linda is 0.48.
What is the Total Population of Loma Linda?
Total Population of Loma Linda is 24,883.
What is the Total Male Population of Loma Linda?
Total Male Population of Loma Linda is 11,399.
What is the Total Female Population of Loma Linda?
Total Female Population of Loma Linda is 13,484.
What is the Ratio of Males per 100 Females in Loma Linda?
There are 84.54 Males per 100 Females in Loma Linda.
What is the Ratio of Females per 100 Males in Loma Linda?
There are 118.29 Females per 100 Males in Loma Linda.
What is the Median Population Age in Loma Linda?
Median Population Age in Loma Linda is 37.8 Years.
What is the Average Family Size in Loma Linda
Average Family Size in Loma Linda is 3.2 People.
What is the Average Household Size in Loma Linda
Average Household Size in Loma Linda is 2.6 People.
How Large is the Labor Force in Loma Linda?
There are 12,157 People in the Labor Forcein in Loma Linda.
What is the Percentage of People in the Labor Force in Loma Linda?
58.6% of People are in the Labor Force in Loma Linda.
What is the Unemployment Rate in Loma Linda?
Unemployment Rate in Loma Linda is 7.2%.