Zip Codes with the Highest Percentage of Population Employed in Health Diagnosing & Treating in Perris, CA
RELATED REPORTS & OPTIONS
Health Diagnosing & Treating
Perris
Compare Zip Codes
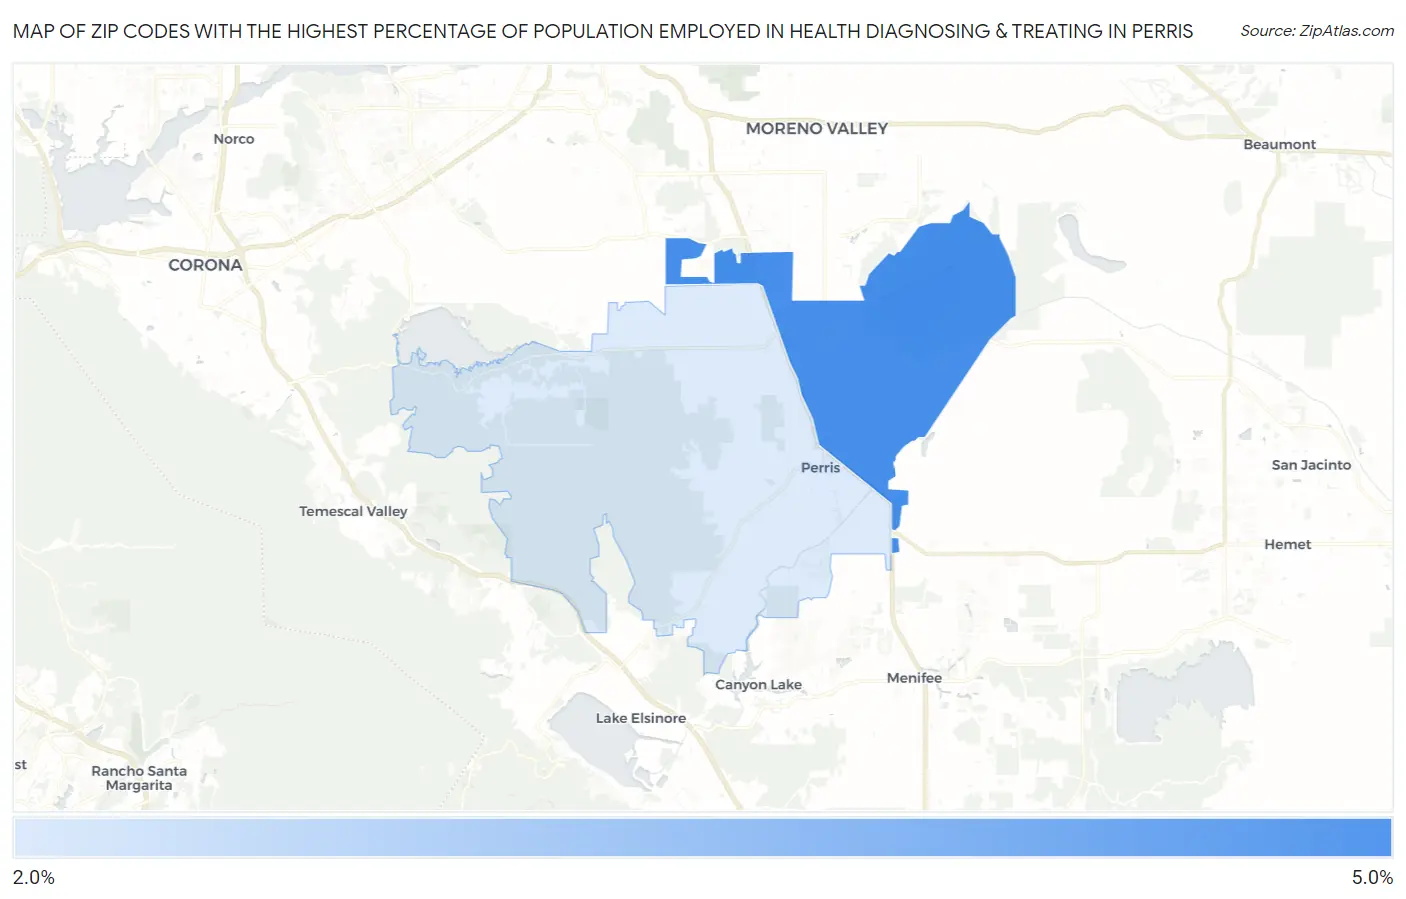
Map of Zip Codes with the Highest Percentage of Population Employed in Health Diagnosing & Treating in Perris
2.9%
4.7%
Zip Codes with the Highest Percentage of Population Employed in Health Diagnosing & Treating in Perris, CA
| Zip Code | % Employed | vs State | vs National | |
| 1. | 92571 | 4.7% | 5.3%(-0.649)#857 | 6.2%(-1.58)#19,007 |
| 2. | 92570 | 2.9% | 5.3%(-2.45)#1,222 | 6.2%(-3.38)#24,670 |
1
Common Questions
What are the Top Zip Codes with the Highest Percentage of Population Employed in Health Diagnosing & Treating in Perris, CA?
Top Zip Codes with the Highest Percentage of Population Employed in Health Diagnosing & Treating in Perris, CA are:
What zip code has the Highest Percentage of Population Employed in Health Diagnosing & Treating in Perris, CA?
92571 has the Highest Percentage of Population Employed in Health Diagnosing & Treating in Perris, CA with 4.7%.
What is the Percentage of Population Employed in Health Diagnosing & Treating in Perris, CA?
Percentage of Population Employed in Health Diagnosing & Treating in Perris is 4.0%.
What is the Percentage of Population Employed in Health Diagnosing & Treating in California?
Percentage of Population Employed in Health Diagnosing & Treating in California is 5.3%.
What is the Percentage of Population Employed in Health Diagnosing & Treating in the United States?
Percentage of Population Employed in Health Diagnosing & Treating in the United States is 6.2%.