Zip Codes with the Highest Percentage of Population Employed in Health Diagnosing & Treating in Whittier, CA
RELATED REPORTS & OPTIONS
Health Diagnosing & Treating
Whittier
Compare Zip Codes
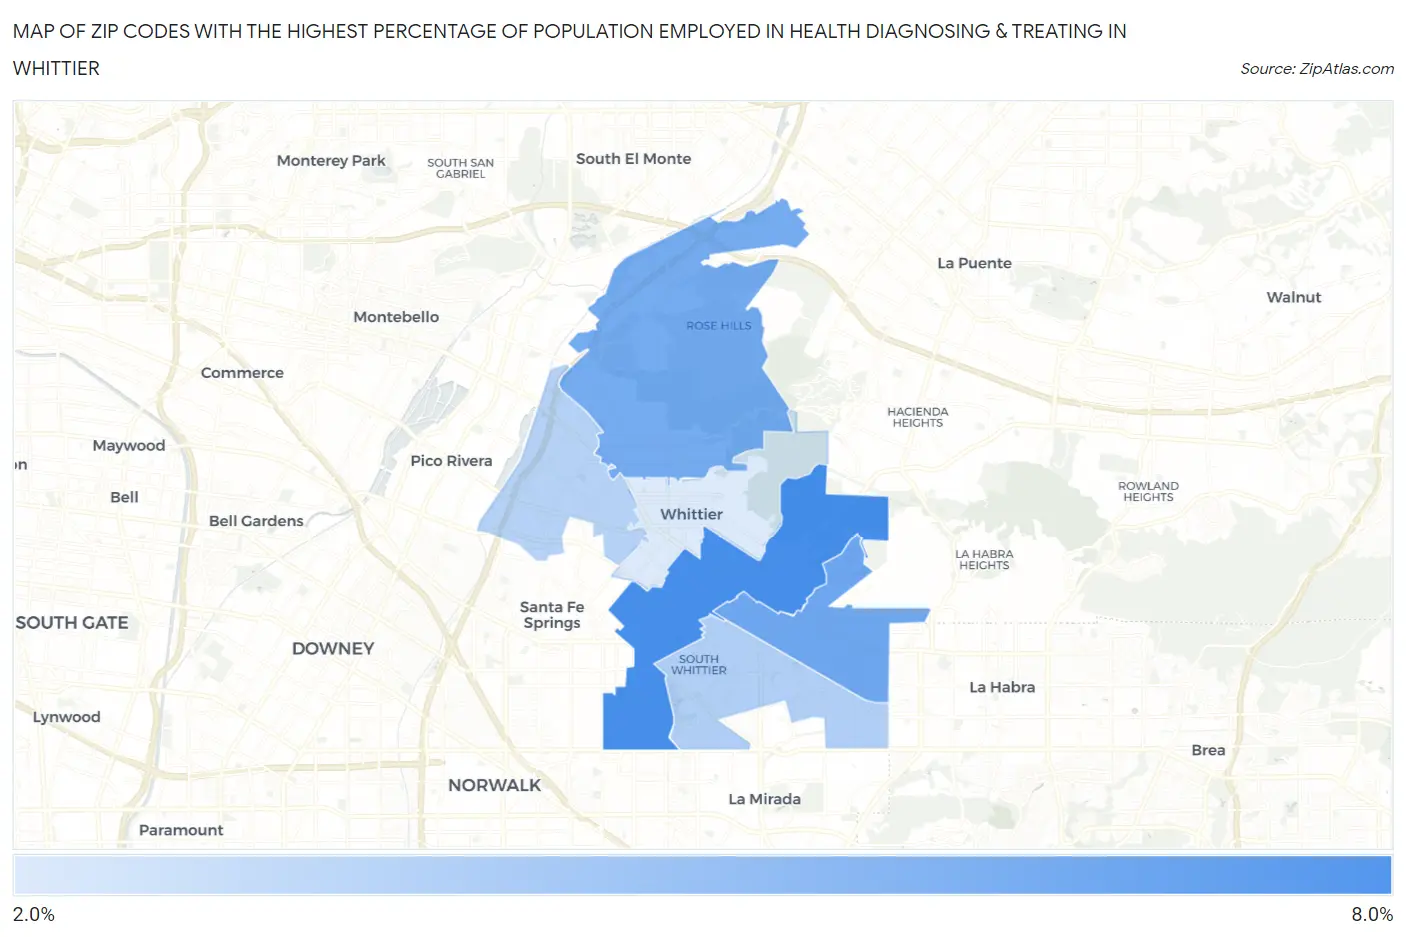
Map of Zip Codes with the Highest Percentage of Population Employed in Health Diagnosing & Treating in Whittier
2.9%
6.8%
Zip Codes with the Highest Percentage of Population Employed in Health Diagnosing & Treating in Whittier, CA
| Zip Code | % Employed | vs State | vs National | |
| 1. | 90605 | 6.8% | 5.3%(+1.45)#420 | 6.2%(+0.513)#11,130 |
| 2. | 90603 | 5.8% | 5.3%(+0.440)#620 | 6.2%(-0.494)#14,793 |
| 3. | 90601 | 5.5% | 5.3%(+0.228)#670 | 6.2%(-0.705)#15,634 |
| 4. | 90604 | 4.0% | 5.3%(-1.29)#1,010 | 6.2%(-2.22)#21,302 |
| 5. | 90606 | 3.9% | 5.3%(-1.40)#1,036 | 6.2%(-2.33)#21,649 |
| 6. | 90602 | 2.9% | 5.3%(-2.37)#1,204 | 6.2%(-3.30)#24,459 |
1
Common Questions
What are the Top 5 Zip Codes with the Highest Percentage of Population Employed in Health Diagnosing & Treating in Whittier, CA?
Top 5 Zip Codes with the Highest Percentage of Population Employed in Health Diagnosing & Treating in Whittier, CA are:
What zip code has the Highest Percentage of Population Employed in Health Diagnosing & Treating in Whittier, CA?
90605 has the Highest Percentage of Population Employed in Health Diagnosing & Treating in Whittier, CA with 6.8%.
What is the Percentage of Population Employed in Health Diagnosing & Treating in Whittier, CA?
Percentage of Population Employed in Health Diagnosing & Treating in Whittier is 4.7%.
What is the Percentage of Population Employed in Health Diagnosing & Treating in California?
Percentage of Population Employed in Health Diagnosing & Treating in California is 5.3%.
What is the Percentage of Population Employed in Health Diagnosing & Treating in the United States?
Percentage of Population Employed in Health Diagnosing & Treating in the United States is 6.2%.