Zip Codes with the Highest Percentage of Population Employed in Health Diagnosing & Treating in Los Gatos, CA
RELATED REPORTS & OPTIONS
Health Diagnosing & Treating
Los Gatos
Compare Zip Codes
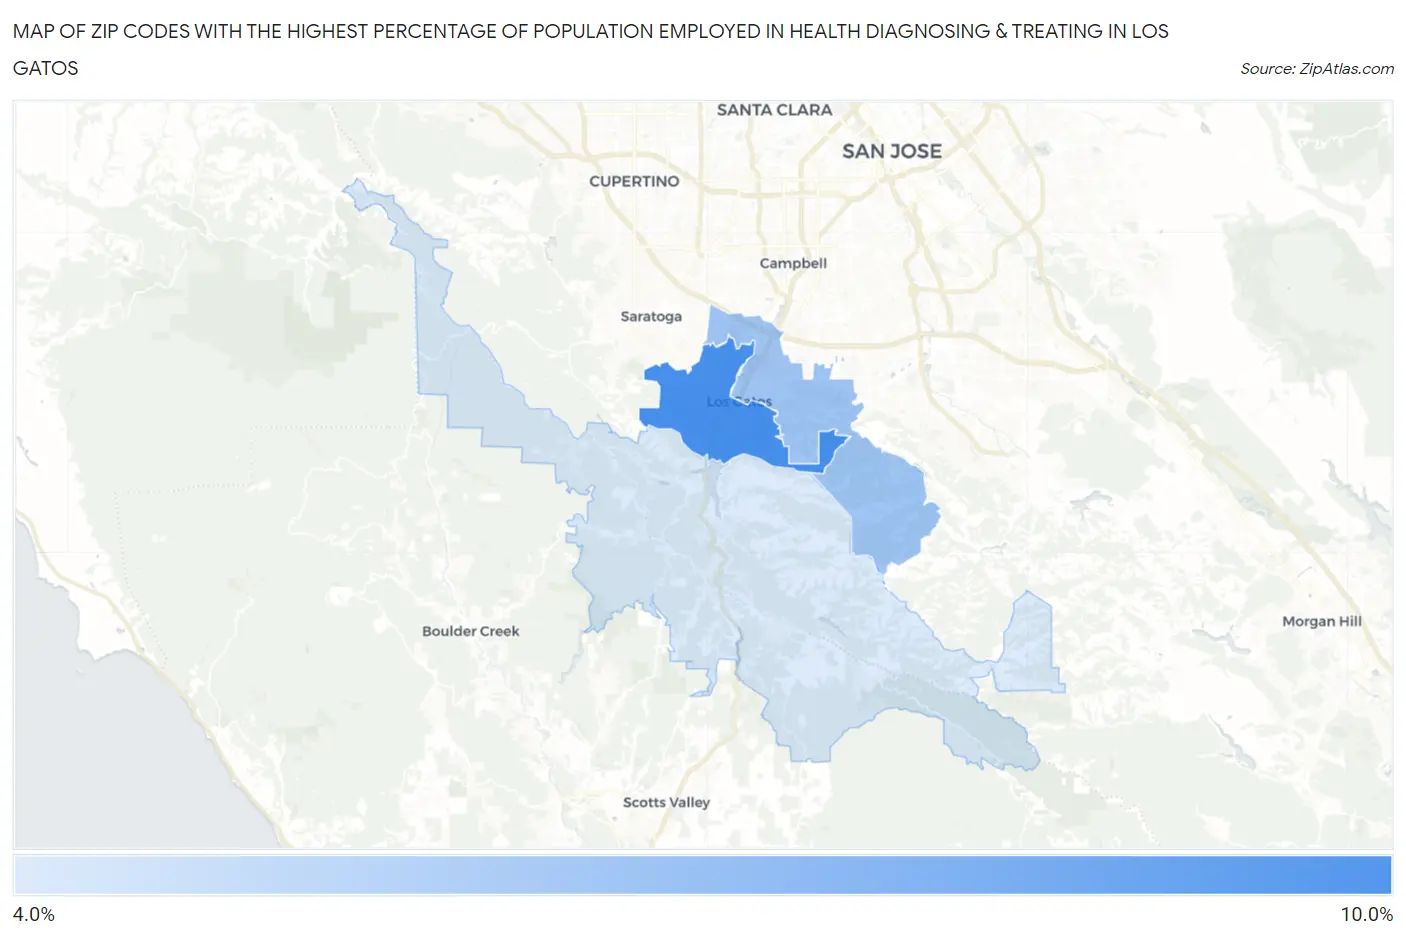
Map of Zip Codes with the Highest Percentage of Population Employed in Health Diagnosing & Treating in Los Gatos
4.7%
8.4%
Zip Codes with the Highest Percentage of Population Employed in Health Diagnosing & Treating in Los Gatos, CA
| Zip Code | % Employed | vs State | vs National | |
| 1. | 95030 | 8.4% | 5.3%(+3.07)#218 | 6.2%(+2.14)#6,562 |
| 2. | 95032 | 6.1% | 5.3%(+0.807)#545 | 6.2%(-0.126)#13,466 |
| 3. | 95033 | 4.7% | 5.3%(-0.656)#860 | 6.2%(-1.59)#19,037 |
1
Common Questions
What are the Top Zip Codes with the Highest Percentage of Population Employed in Health Diagnosing & Treating in Los Gatos, CA?
Top Zip Codes with the Highest Percentage of Population Employed in Health Diagnosing & Treating in Los Gatos, CA are:
What zip code has the Highest Percentage of Population Employed in Health Diagnosing & Treating in Los Gatos, CA?
95030 has the Highest Percentage of Population Employed in Health Diagnosing & Treating in Los Gatos, CA with 8.4%.
What is the Percentage of Population Employed in Health Diagnosing & Treating in Los Gatos, CA?
Percentage of Population Employed in Health Diagnosing & Treating in Los Gatos is 6.1%.
What is the Percentage of Population Employed in Health Diagnosing & Treating in California?
Percentage of Population Employed in Health Diagnosing & Treating in California is 5.3%.
What is the Percentage of Population Employed in Health Diagnosing & Treating in the United States?
Percentage of Population Employed in Health Diagnosing & Treating in the United States is 6.2%.