Parklawn, CA Map & Demographics
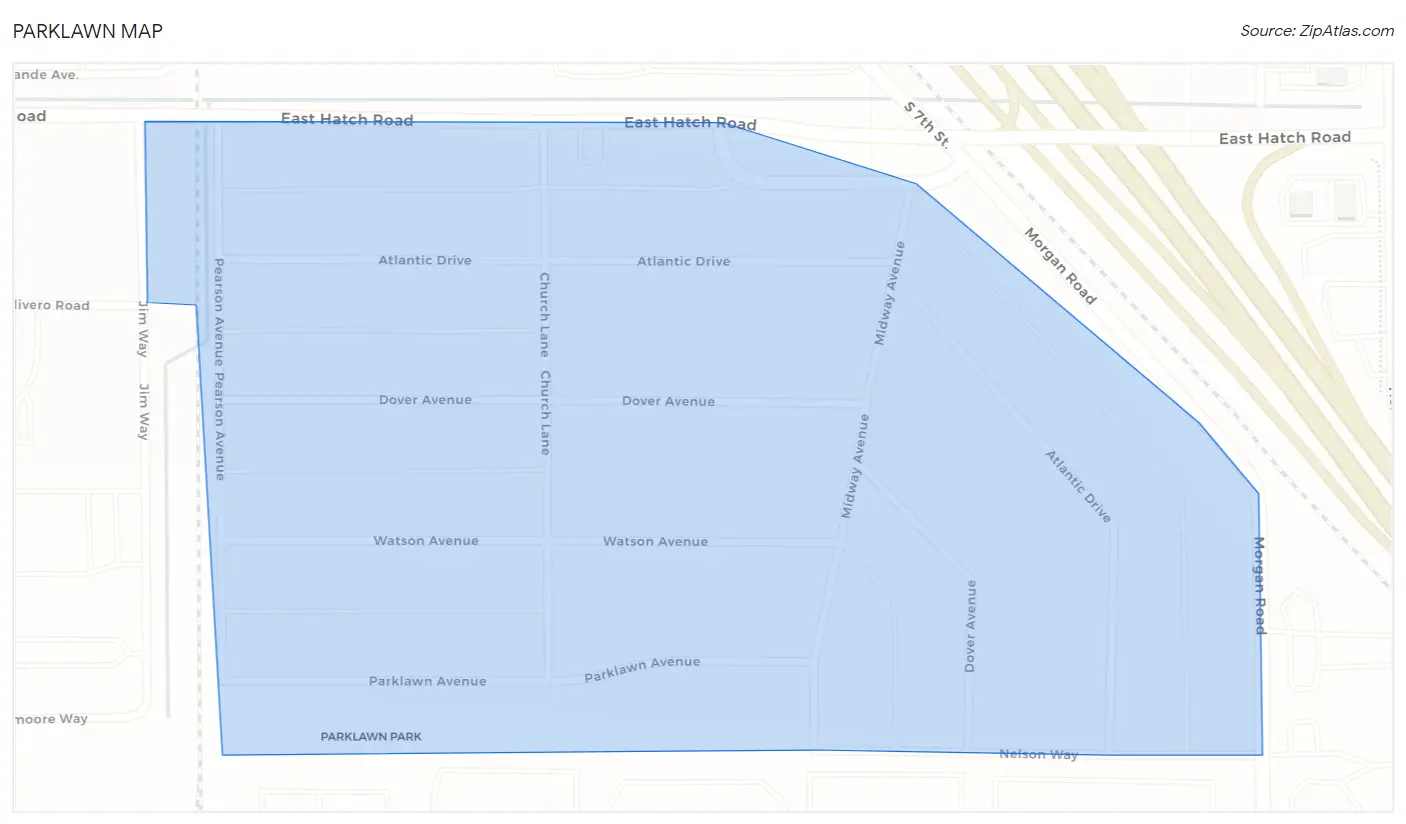
Parklawn Map
Parklawn Overview
$18,523
PER CAPITA INCOME
$68,704
AVG HOUSEHOLD INCOME
13.0%
WAGE / INCOME GAP [ % ]
87.0¢/ $1
WAGE / INCOME GAP [ $ ]
0.42
INEQUALITY / GINI INDEX
1,543
TOTAL POPULATION
723
MALE POPULATION
820
FEMALE POPULATION
88.17
MALES / 100 FEMALES
113.42
FEMALES / 100 MALES
26.9
MEDIAN AGE
5.1
AVG FAMILY SIZE
4.7
AVG HOUSEHOLD SIZE
652
LABOR FORCE [ PEOPLE ]
62.6%
PERCENT IN LABOR FORCE
3.7%
UNEMPLOYMENT RATE
Income in Parklawn
Income Overview in Parklawn
| Characteristic | Number | Measure |
| Per Capita Income | 1,543 | $18,523 |
| Median Family Income | 294 | $0 |
| Mean Family Income | 294 | $98,436 |
| Median Household Income | 328 | $68,704 |
| Mean Household Income | 328 | $90,850 |
| Income Deficit | 294 | $0 |
| Wage / Income Gap (%) | 1,543 | 12.96% |
| Wage / Income Gap ($) | 1,543 | 87.04¢ per $1 |
| Gini / Inequality Index | 1,543 | 0.42 |
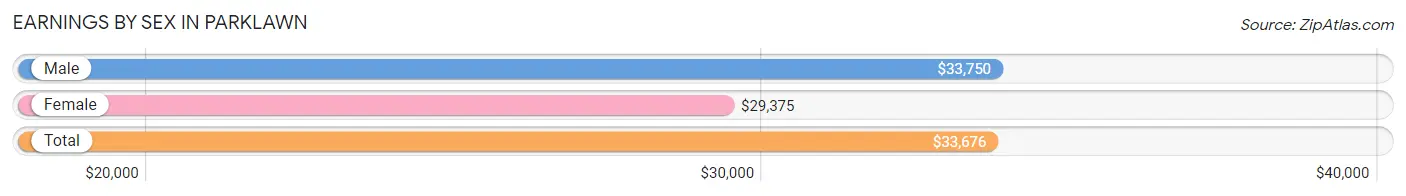
Earnings by Sex in Parklawn
Average Earnings in Parklawn are $33,676, $33,750 for men and $29,375 for women, a difference of 13.0%.
| Sex | Number | Average Earnings |
| Male | 410 (58.2%) | $33,750 |
| Female | 294 (41.8%) | $29,375 |
| Total | 704 (100.0%) | $33,676 |
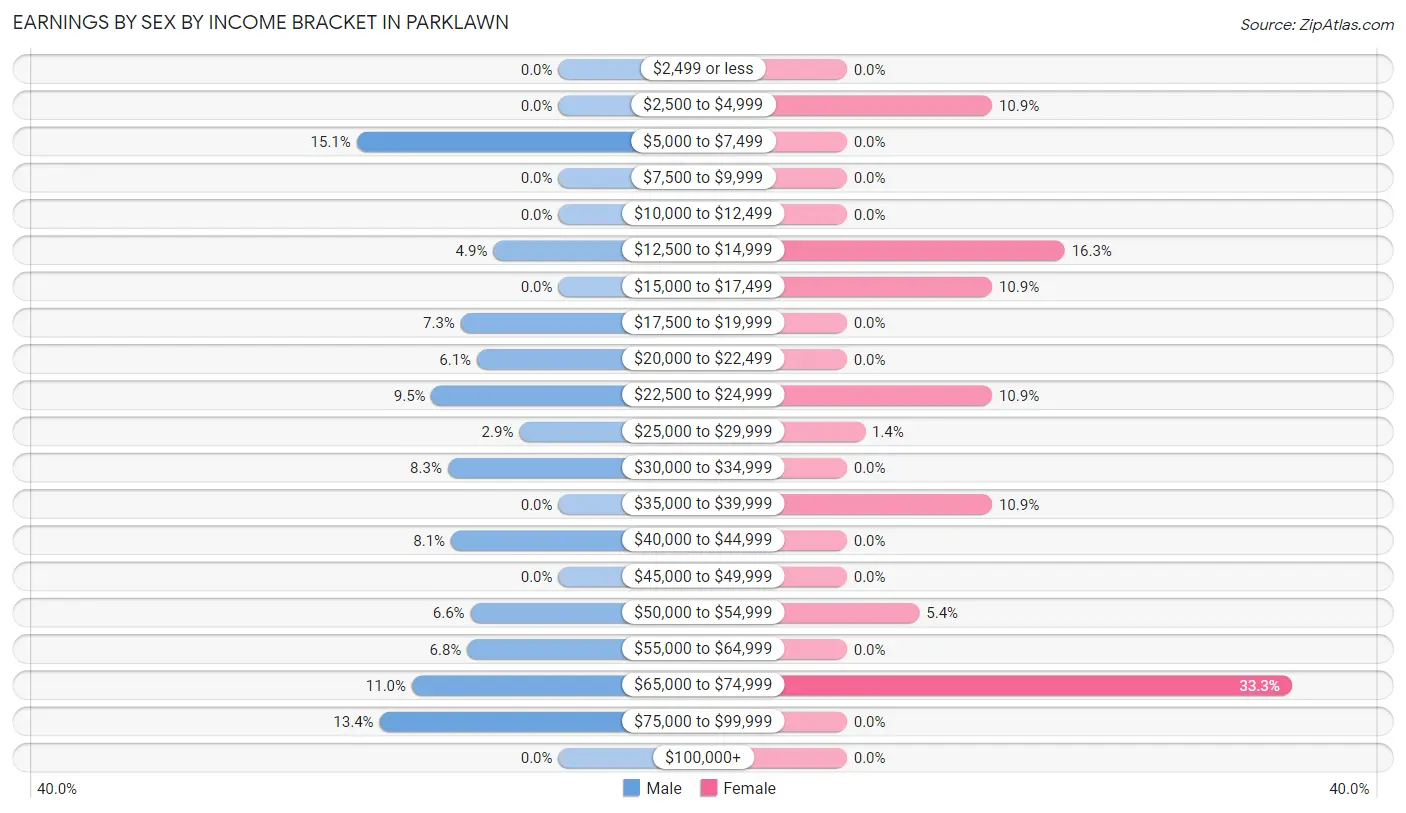
Earnings by Sex by Income Bracket in Parklawn
The most common earnings brackets in Parklawn are $5,000 to $7,499 for men (62 | 15.1%) and $65,000 to $74,999 for women (98 | 33.3%).
| Income | Male | Female |
| $2,499 or less | 0 (0.0%) | 0 (0.0%) |
| $2,500 to $4,999 | 0 (0.0%) | 32 (10.9%) |
| $5,000 to $7,499 | 62 (15.1%) | 0 (0.0%) |
| $7,500 to $9,999 | 0 (0.0%) | 0 (0.0%) |
| $10,000 to $12,499 | 0 (0.0%) | 0 (0.0%) |
| $12,500 to $14,999 | 20 (4.9%) | 48 (16.3%) |
| $15,000 to $17,499 | 0 (0.0%) | 32 (10.9%) |
| $17,500 to $19,999 | 30 (7.3%) | 0 (0.0%) |
| $20,000 to $22,499 | 25 (6.1%) | 0 (0.0%) |
| $22,500 to $24,999 | 39 (9.5%) | 32 (10.9%) |
| $25,000 to $29,999 | 12 (2.9%) | 4 (1.4%) |
| $30,000 to $34,999 | 34 (8.3%) | 0 (0.0%) |
| $35,000 to $39,999 | 0 (0.0%) | 32 (10.9%) |
| $40,000 to $44,999 | 33 (8.1%) | 0 (0.0%) |
| $45,000 to $49,999 | 0 (0.0%) | 0 (0.0%) |
| $50,000 to $54,999 | 27 (6.6%) | 16 (5.4%) |
| $55,000 to $64,999 | 28 (6.8%) | 0 (0.0%) |
| $65,000 to $74,999 | 45 (11.0%) | 98 (33.3%) |
| $75,000 to $99,999 | 55 (13.4%) | 0 (0.0%) |
| $100,000+ | 0 (0.0%) | 0 (0.0%) |
| Total | 410 (100.0%) | 294 (100.0%) |
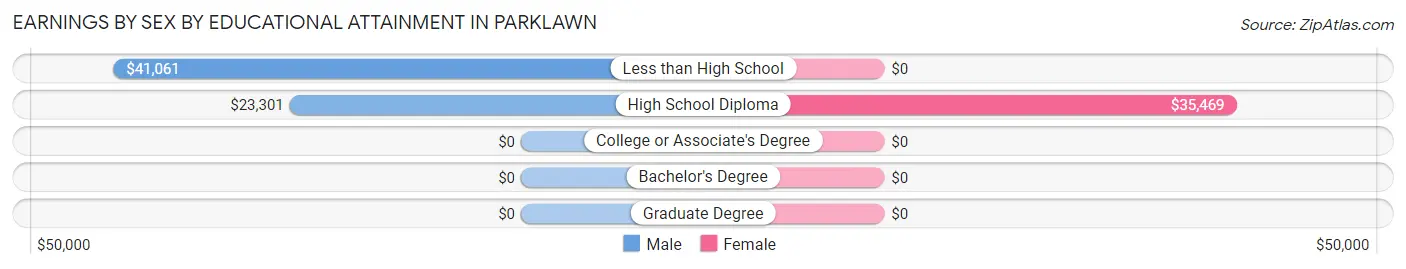
Earnings by Sex by Educational Attainment in Parklawn
Average earnings in Parklawn are $40,530 for men and $36,484 for women, a difference of 10.0%. Men with an educational attainment of less than high school enjoy the highest average annual earnings of $41,061, while those with high school diploma education earn the least with $23,301. Women with an educational attainment of high school diploma earn the most with the average annual earnings of $35,469, while those with high school diploma education have the smallest earnings of $35,469.
| Educational Attainment | Male Income | Female Income |
| Less than High School | $41,061 | $0 |
| High School Diploma | $23,301 | $35,469 |
| College or Associate's Degree | - | - |
| Bachelor's Degree | - | - |
| Graduate Degree | - | - |
| Total | $40,530 | $36,484 |
Family Income in Parklawn
Family Income Brackets in Parklawn
According to the Parklawn family income data, there are 72 families falling into the $100,000 to $149,999 income range, which is the most common income bracket and makes up 24.5% of all families.
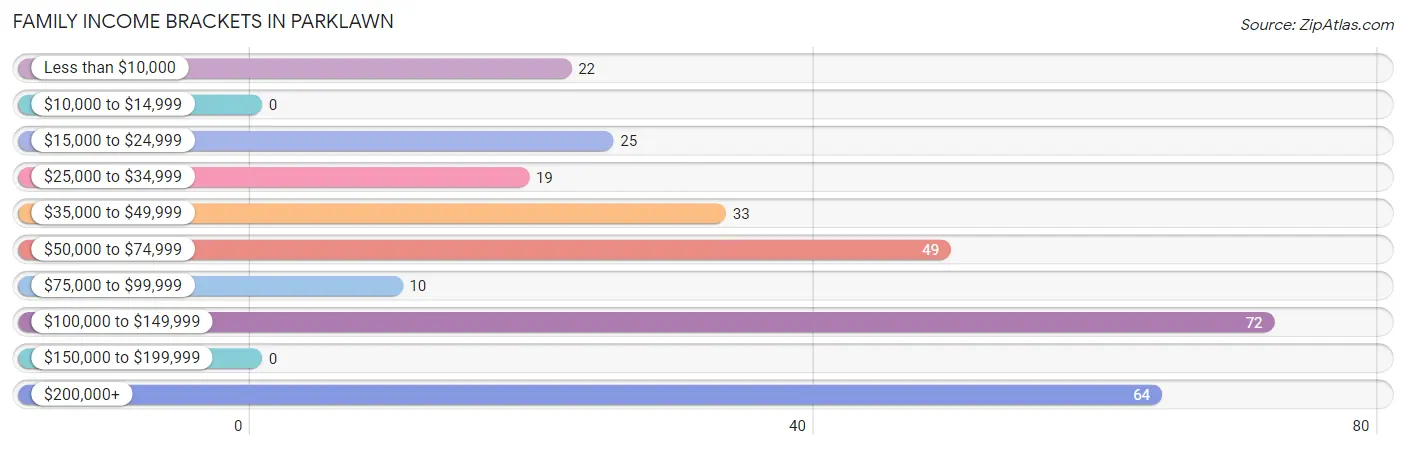
| Income Bracket | # Families | % Families |
| Less than $10,000 | 22 | 7.5% |
| $10,000 to $14,999 | 0 | 0.0% |
| $15,000 to $24,999 | 25 | 8.5% |
| $25,000 to $34,999 | 19 | 6.5% |
| $35,000 to $49,999 | 33 | 11.2% |
| $50,000 to $74,999 | 49 | 16.7% |
| $75,000 to $99,999 | 10 | 3.4% |
| $100,000 to $149,999 | 72 | 24.5% |
| $150,000 to $199,999 | 0 | 0.0% |
| $200,000+ | 64 | 21.8% |
Family Income by Famaliy Size in Parklawn
7+ person families (119 | 40.5%) account for the highest median family income in Parklawn with $200,176 per family, while 7+ person families (119 | 40.5%) have the highest median income of $28,597 per family member.
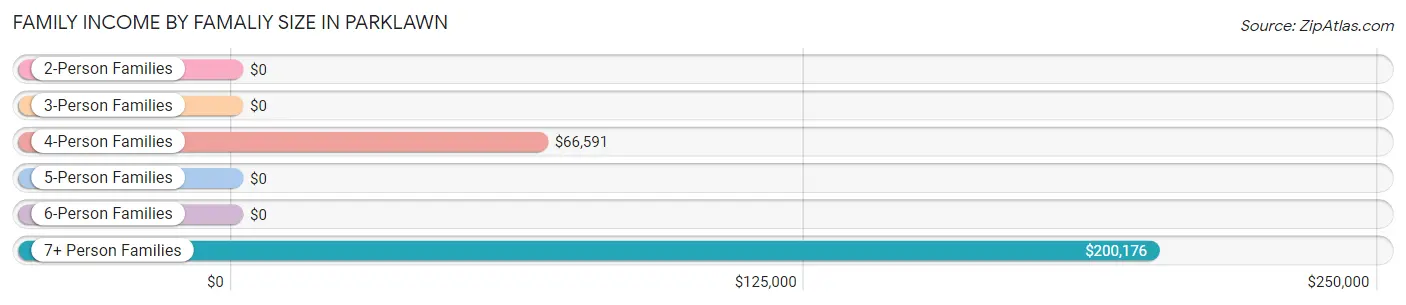
| Income Bracket | # Families | Median Income |
| 2-Person Families | 22 (7.5%) | $0 |
| 3-Person Families | 4 (1.4%) | $0 |
| 4-Person Families | 116 (39.5%) | $66,591 |
| 5-Person Families | 0 (0.0%) | $0 |
| 6-Person Families | 33 (11.2%) | $0 |
| 7+ Person Families | 119 (40.5%) | $200,176 |
| Total | 294 (100.0%) | $0 |
Family Income by Number of Earners in Parklawn
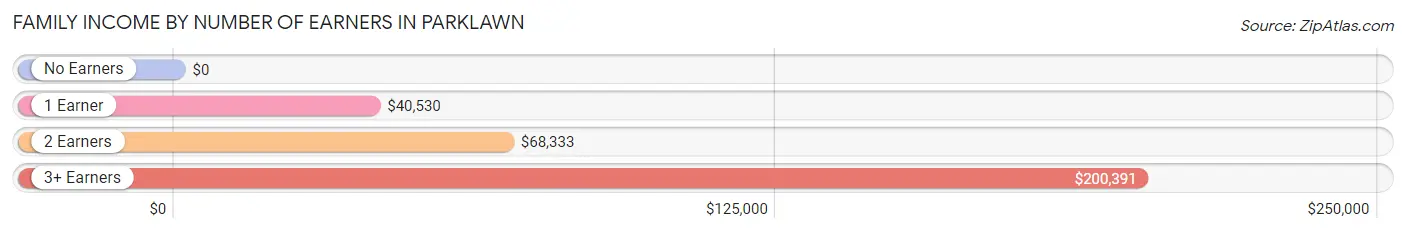
| Number of Earners | # Families | Median Income |
| No Earners | 22 (7.5%) | $0 |
| 1 Earner | 52 (17.7%) | $40,530 |
| 2 Earners | 112 (38.1%) | $68,333 |
| 3+ Earners | 108 (36.7%) | $200,391 |
| Total | 294 (100.0%) | $0 |
Household Income in Parklawn
Household Income Brackets in Parklawn
With 72 households falling in the category, the $100,000 to $149,999 income range is the most frequent in Parklawn, accounting for 22.0% of all households.
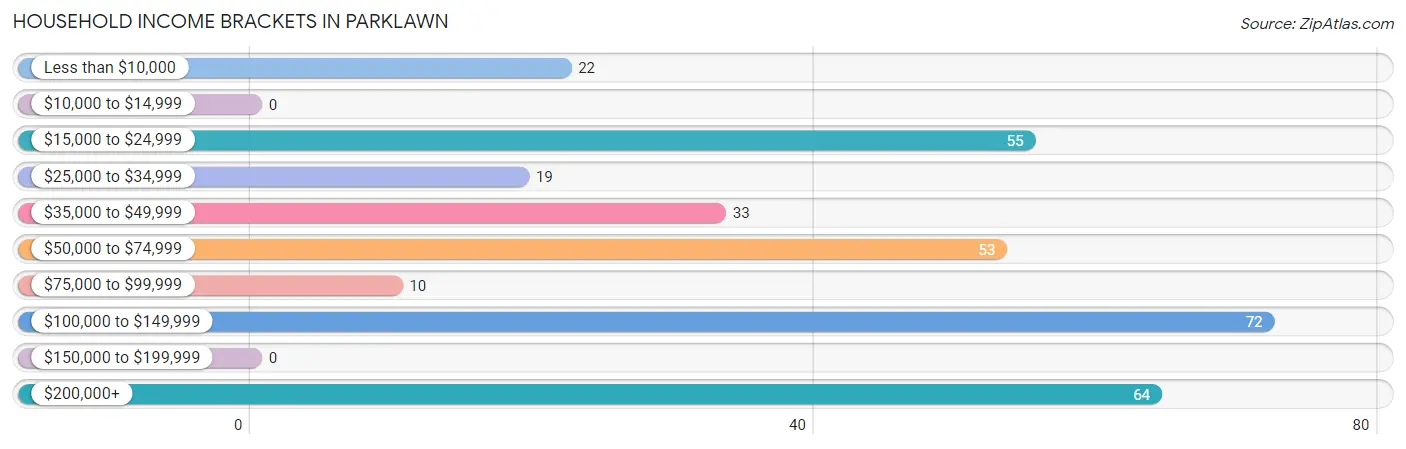
| Income Bracket | # Households | % Households |
| Less than $10,000 | 22 | 6.7% |
| $10,000 to $14,999 | 0 | 0.0% |
| $15,000 to $24,999 | 55 | 16.8% |
| $25,000 to $34,999 | 19 | 5.8% |
| $35,000 to $49,999 | 33 | 10.1% |
| $50,000 to $74,999 | 53 | 16.2% |
| $75,000 to $99,999 | 10 | 3.0% |
| $100,000 to $149,999 | 72 | 22.0% |
| $150,000 to $199,999 | 0 | 0.0% |
| $200,000+ | 64 | 19.5% |
Household Income by Householder Age in Parklawn
The median household income in Parklawn is $68,704, with the highest median household income of $66,250 found in the 45 to 64 years age bracket for the primary householder. A total of 130 households (39.6%) fall into this category.
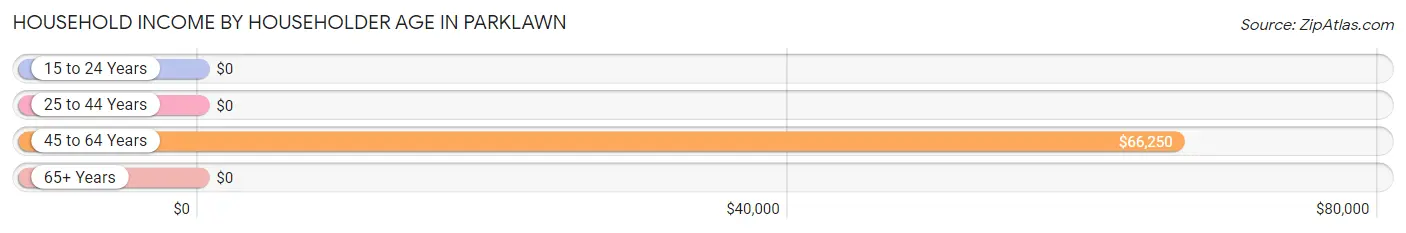
| Income Bracket | # Households | Median Income |
| 15 to 24 Years | 0 (0.0%) | $0 |
| 25 to 44 Years | 167 (50.9%) | $0 |
| 45 to 64 Years | 130 (39.6%) | $66,250 |
| 65+ Years | 31 (9.5%) | $0 |
| Total | 328 (100.0%) | $68,704 |
Poverty in Parklawn
Income Below Poverty by Sex and Age in Parklawn
With 12.2% poverty level for males and 11.8% for females among the residents of Parklawn, 35 to 44 year old males and 35 to 44 year old females are the most vulnerable to poverty, with 29 males (70.7%) and 24 females (70.6%) in their respective age groups living below the poverty level.
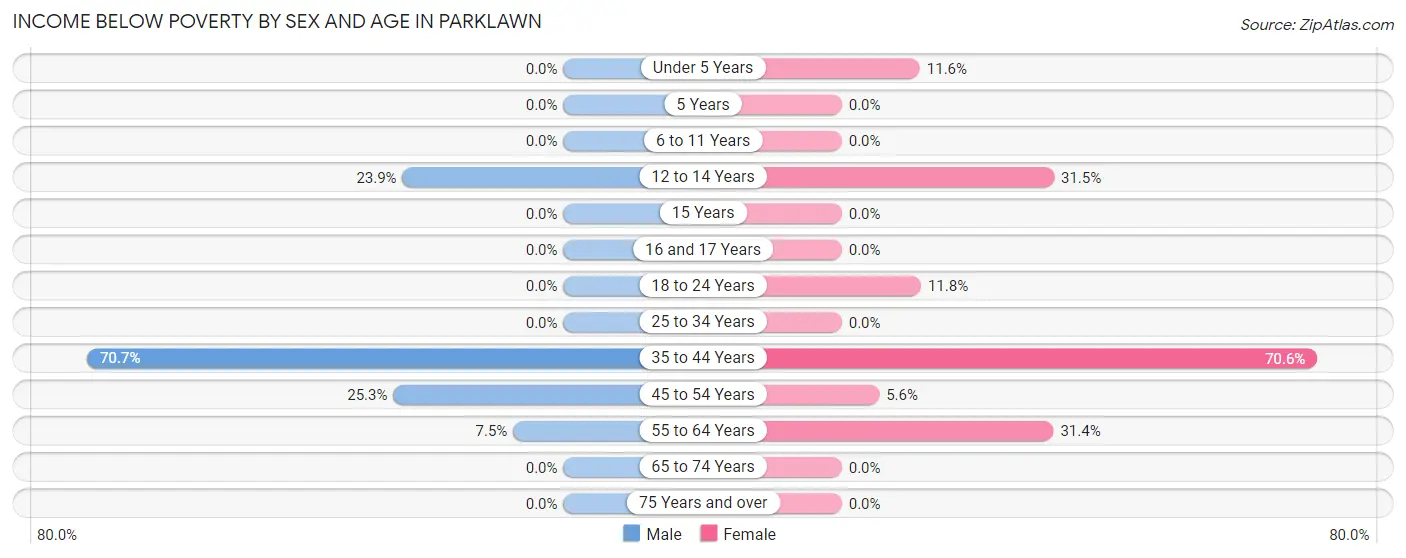
| Age Bracket | Male | Female |
| Under 5 Years | 0 (0.0%) | 8 (11.6%) |
| 5 Years | 0 (0.0%) | 0 (0.0%) |
| 6 to 11 Years | 0 (0.0%) | 0 (0.0%) |
| 12 to 14 Years | 27 (23.9%) | 29 (31.5%) |
| 15 Years | 0 (0.0%) | 0 (0.0%) |
| 16 and 17 Years | 0 (0.0%) | 0 (0.0%) |
| 18 to 24 Years | 0 (0.0%) | 8 (11.8%) |
| 25 to 34 Years | 0 (0.0%) | 0 (0.0%) |
| 35 to 44 Years | 29 (70.7%) | 24 (70.6%) |
| 45 to 54 Years | 25 (25.3%) | 6 (5.6%) |
| 55 to 64 Years | 7 (7.4%) | 22 (31.4%) |
| 65 to 74 Years | 0 (0.0%) | 0 (0.0%) |
| 75 Years and over | 0 (0.0%) | 0 (0.0%) |
| Total | 88 (12.2%) | 97 (11.8%) |
Income Above Poverty by Sex and Age in Parklawn
According to the poverty statistics in Parklawn, males aged 6 to 11 years and females aged 6 to 11 years are the age groups that are most secure financially, with 100.0% of males and 100.0% of females in these age groups living above the poverty line.
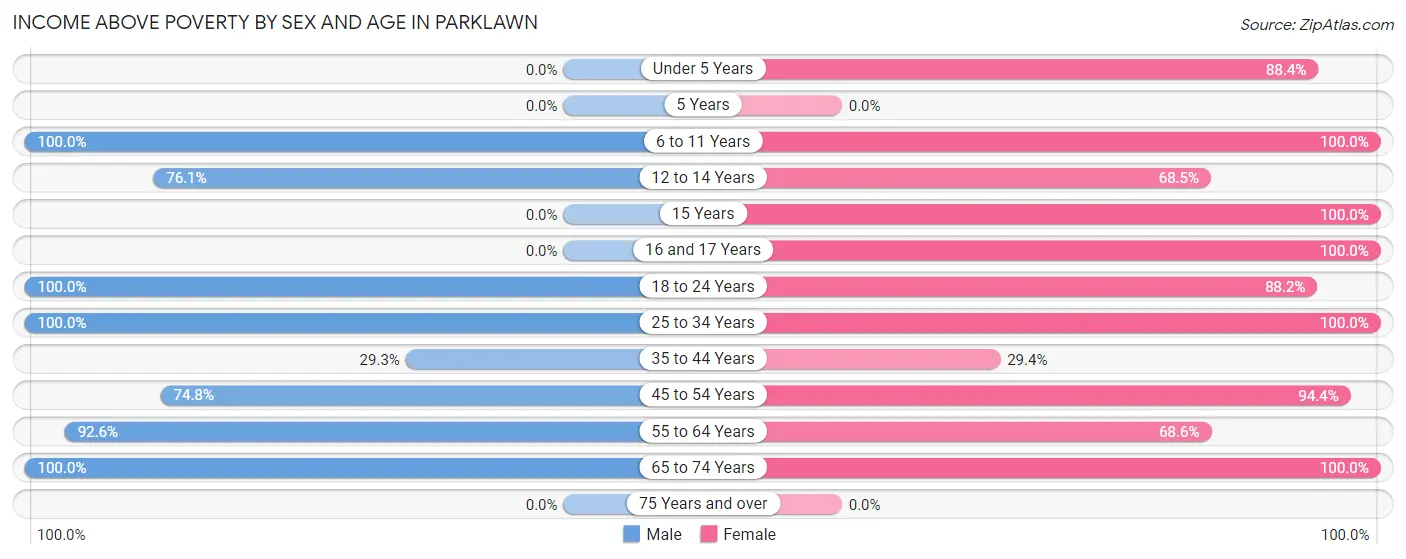
| Age Bracket | Male | Female |
| Under 5 Years | 0 (0.0%) | 61 (88.4%) |
| 5 Years | 0 (0.0%) | 0 (0.0%) |
| 6 to 11 Years | 95 (100.0%) | 109 (100.0%) |
| 12 to 14 Years | 86 (76.1%) | 63 (68.5%) |
| 15 Years | 0 (0.0%) | 24 (100.0%) |
| 16 and 17 Years | 0 (0.0%) | 26 (100.0%) |
| 18 to 24 Years | 48 (100.0%) | 60 (88.2%) |
| 25 to 34 Years | 206 (100.0%) | 189 (100.0%) |
| 35 to 44 Years | 12 (29.3%) | 10 (29.4%) |
| 45 to 54 Years | 74 (74.8%) | 102 (94.4%) |
| 55 to 64 Years | 87 (92.5%) | 48 (68.6%) |
| 65 to 74 Years | 27 (100.0%) | 31 (100.0%) |
| 75 Years and over | 0 (0.0%) | 0 (0.0%) |
| Total | 635 (87.8%) | 723 (88.2%) |
Income Below Poverty Among Married-Couple Families in Parklawn
The poverty statistics for married-couple families in Parklawn show that 15.4% or 32 of the total 208 families live below the poverty line. Families with 1 or 2 children have the highest poverty rate of 24.6%, comprising of 32 families. On the other hand, families with no children have the lowest poverty rate of 0.0%, which includes 0 families.
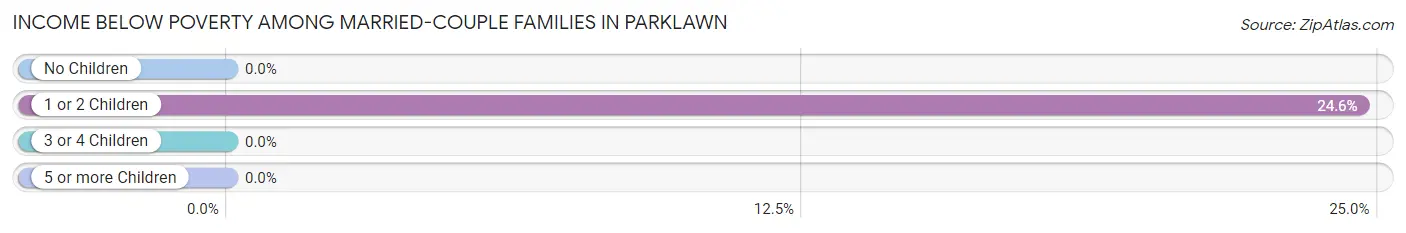
| Children | Above Poverty | Below Poverty |
| No Children | 17 (100.0%) | 0 (0.0%) |
| 1 or 2 Children | 98 (75.4%) | 32 (24.6%) |
| 3 or 4 Children | 33 (100.0%) | 0 (0.0%) |
| 5 or more Children | 28 (100.0%) | 0 (0.0%) |
| Total | 176 (84.6%) | 32 (15.4%) |
Income Below Poverty Among Single-Parent Households in Parklawn
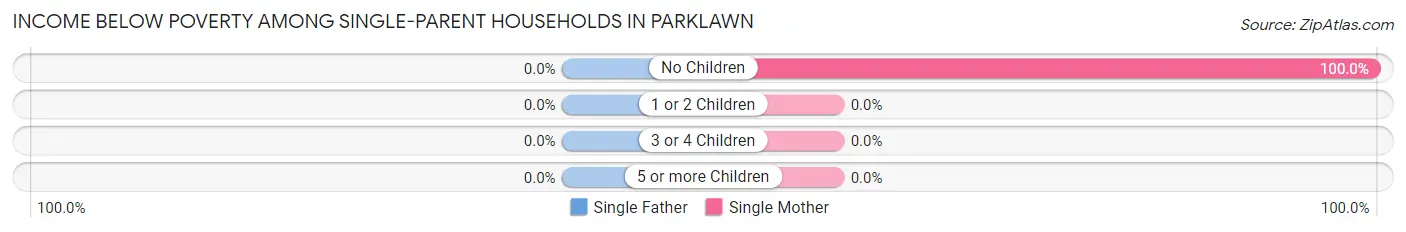
| Children | Single Father | Single Mother |
| No Children | 0 (0.0%) | 22 (100.0%) |
| 1 or 2 Children | 0 (0.0%) | 0 (0.0%) |
| 3 or 4 Children | 0 (0.0%) | 0 (0.0%) |
| 5 or more Children | 0 (0.0%) | 0 (0.0%) |
| Total | 0 (0.0%) | 22 (25.6%) |
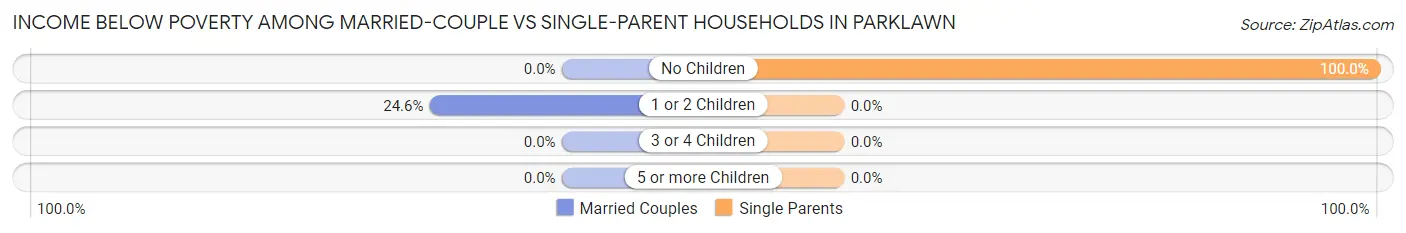
Income Below Poverty Among Married-Couple vs Single-Parent Households in Parklawn
The poverty data for Parklawn shows that 32 of the married-couple family households (15.4%) and 22 of the single-parent households (25.6%) are living below the poverty level. Within the married-couple family households, those with 1 or 2 children have the highest poverty rate, with 32 households (24.6%) falling below the poverty line. Among the single-parent households, those with no children have the highest poverty rate, with 22 household (100.0%) living below poverty.
| Children | Married-Couple Families | Single-Parent Households |
| No Children | 0 (0.0%) | 22 (100.0%) |
| 1 or 2 Children | 32 (24.6%) | 0 (0.0%) |
| 3 or 4 Children | 0 (0.0%) | 0 (0.0%) |
| 5 or more Children | 0 (0.0%) | 0 (0.0%) |
| Total | 32 (15.4%) | 22 (25.6%) |
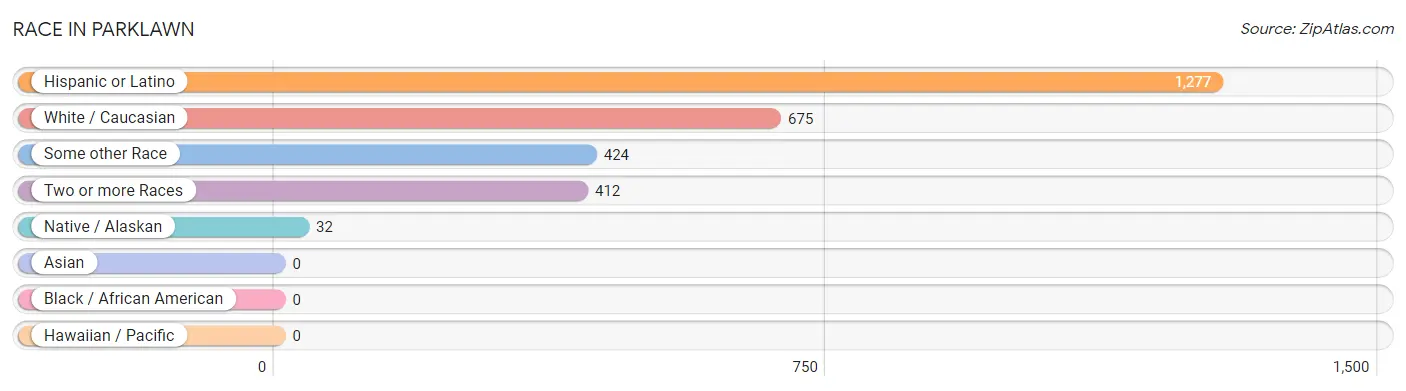
Race in Parklawn
The most populous races in Parklawn are Hispanic or Latino (1,277 | 82.8%), White / Caucasian (675 | 43.8%), and Some other Race (424 | 27.5%).
| Race | # Population | % Population |
| Asian | 0 | 0.0% |
| Black / African American | 0 | 0.0% |
| Hawaiian / Pacific | 0 | 0.0% |
| Hispanic or Latino | 1,277 | 82.8% |
| Native / Alaskan | 32 | 2.1% |
| White / Caucasian | 675 | 43.8% |
| Two or more Races | 412 | 26.7% |
| Some other Race | 424 | 27.5% |
| Total | 1,543 | 100.0% |
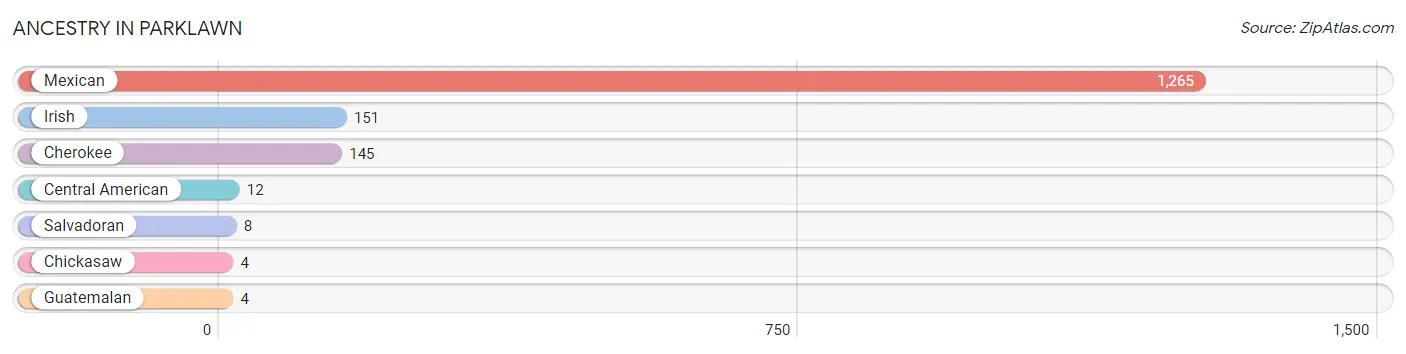
Ancestry in Parklawn
The most populous ancestries reported in Parklawn are Mexican (1,265 | 82.0%), Irish (151 | 9.8%), Cherokee (145 | 9.4%), Central American (12 | 0.8%), and Salvadoran (8 | 0.5%), together accounting for 102.5% of all Parklawn residents.
| Ancestry | # Population | % Population |
| Central American | 12 | 0.8% |
| Cherokee | 145 | 9.4% |
| Chickasaw | 4 | 0.3% |
| Guatemalan | 4 | 0.3% |
| Irish | 151 | 9.8% |
| Mexican | 1,265 | 82.0% |
| Salvadoran | 8 | 0.5% | View All 7 Rows |
Immigrants in Parklawn
The most numerous immigrant groups reported in Parklawn came from Central America (535 | 34.7%), Latin America (535 | 34.7%), Mexico (476 | 30.8%), Guatemala (55 | 3.6%), and El Salvador (4 | 0.3%), together accounting for 104.0% of all Parklawn residents.
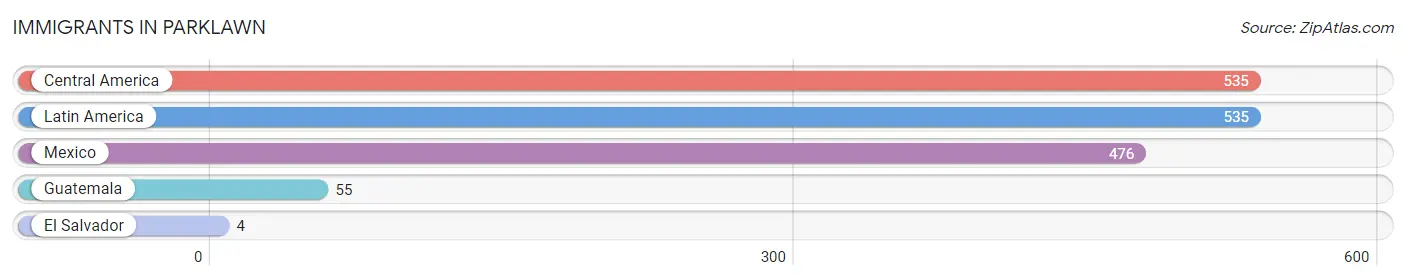
| Immigration Origin | # Population | % Population |
| Central America | 535 | 34.7% |
| El Salvador | 4 | 0.3% |
| Guatemala | 55 | 3.6% |
| Latin America | 535 | 34.7% |
| Mexico | 476 | 30.8% | View All 5 Rows |
Sex and Age in Parklawn
Sex and Age in Parklawn
The most populous age groups in Parklawn are 10 to 14 Years (145 | 20.1%) for men and 10 to 14 Years (136 | 16.6%) for women.
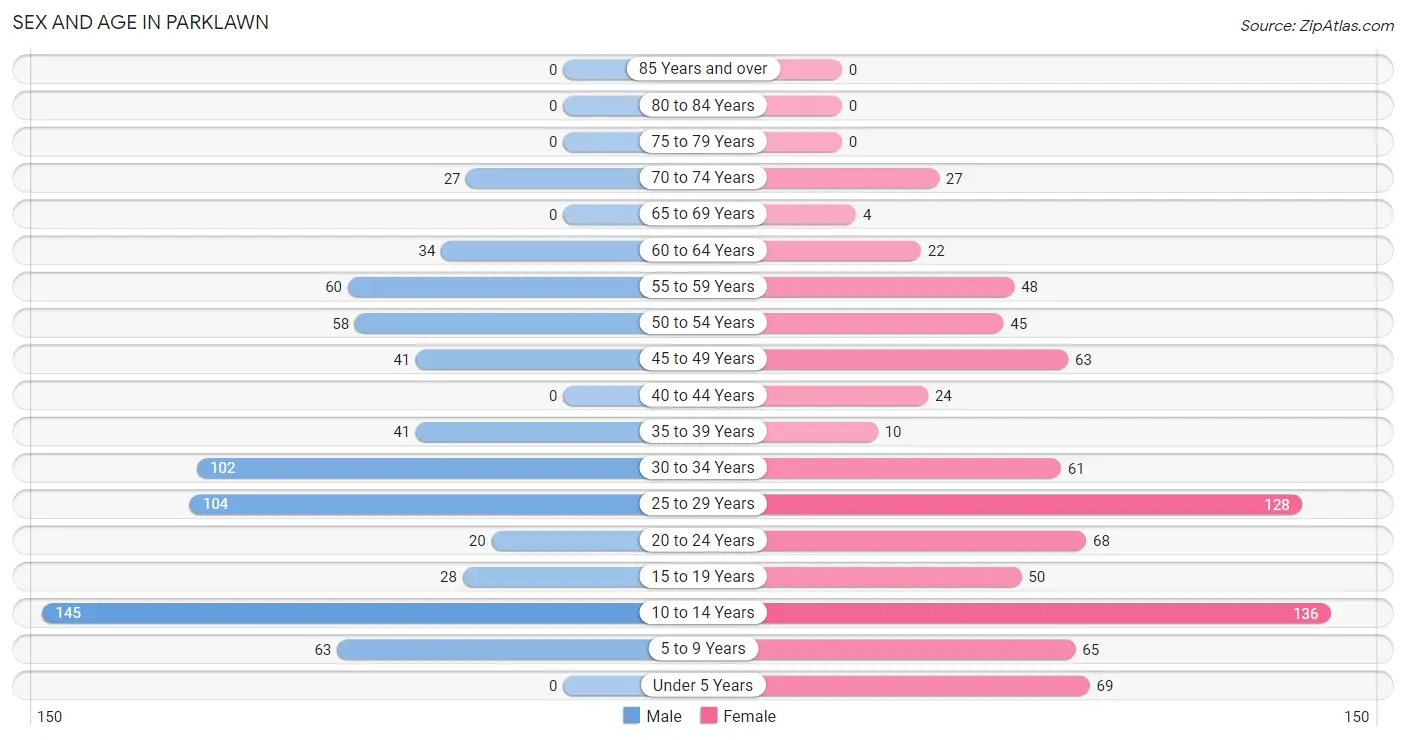
| Age Bracket | Male | Female |
| Under 5 Years | 0 (0.0%) | 69 (8.4%) |
| 5 to 9 Years | 63 (8.7%) | 65 (7.9%) |
| 10 to 14 Years | 145 (20.1%) | 136 (16.6%) |
| 15 to 19 Years | 28 (3.9%) | 50 (6.1%) |
| 20 to 24 Years | 20 (2.8%) | 68 (8.3%) |
| 25 to 29 Years | 104 (14.4%) | 128 (15.6%) |
| 30 to 34 Years | 102 (14.1%) | 61 (7.4%) |
| 35 to 39 Years | 41 (5.7%) | 10 (1.2%) |
| 40 to 44 Years | 0 (0.0%) | 24 (2.9%) |
| 45 to 49 Years | 41 (5.7%) | 63 (7.7%) |
| 50 to 54 Years | 58 (8.0%) | 45 (5.5%) |
| 55 to 59 Years | 60 (8.3%) | 48 (5.9%) |
| 60 to 64 Years | 34 (4.7%) | 22 (2.7%) |
| 65 to 69 Years | 0 (0.0%) | 4 (0.5%) |
| 70 to 74 Years | 27 (3.7%) | 27 (3.3%) |
| 75 to 79 Years | 0 (0.0%) | 0 (0.0%) |
| 80 to 84 Years | 0 (0.0%) | 0 (0.0%) |
| 85 Years and over | 0 (0.0%) | 0 (0.0%) |
| Total | 723 (100.0%) | 820 (100.0%) |
Families and Households in Parklawn
Median Family Size in Parklawn
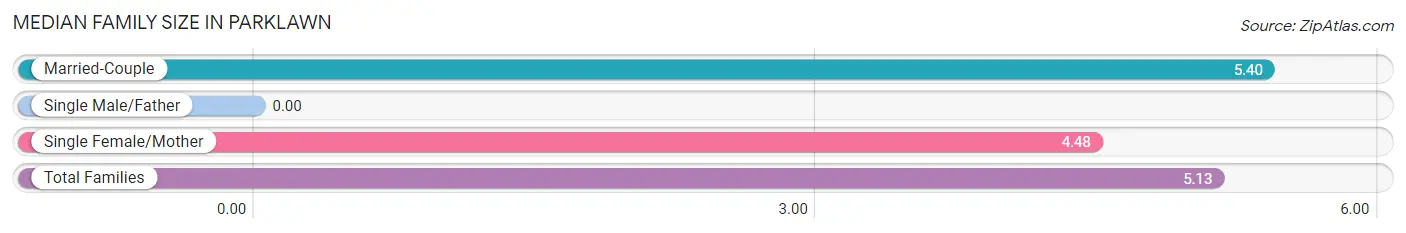
| Family Type | # Families | Family Size |
| Married-Couple | 208 (70.8%) | 5.40 |
| Single Male/Father | 0 (0.0%) | - |
| Single Female/Mother | 86 (29.2%) | 4.48 |
| Total Families | 294 (100.0%) | 5.13 |
Median Household Size in Parklawn
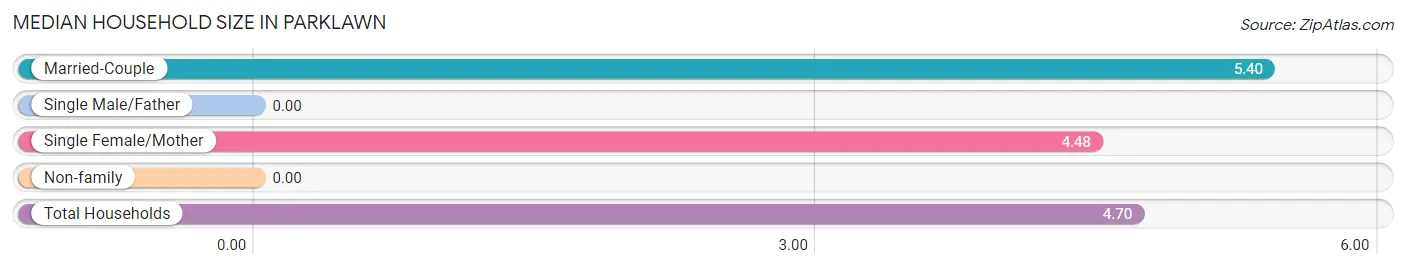
| Household Type | # Households | Household Size |
| Married-Couple | 208 (63.4%) | 5.40 |
| Single Male/Father | 0 (0.0%) | - |
| Single Female/Mother | 86 (26.2%) | 4.48 |
| Non-family | 34 (10.4%) | - |
| Total Households | 328 (100.0%) | 4.70 |
Household Size by Marriage Status in Parklawn
Out of a total of 328 households in Parklawn, 294 (89.6%) are family households, while 34 (10.4%) are nonfamily households. The most numerous type of family households are 7+ person households, comprising 119, and the most common type of nonfamily households are 1-person households, comprising 34.
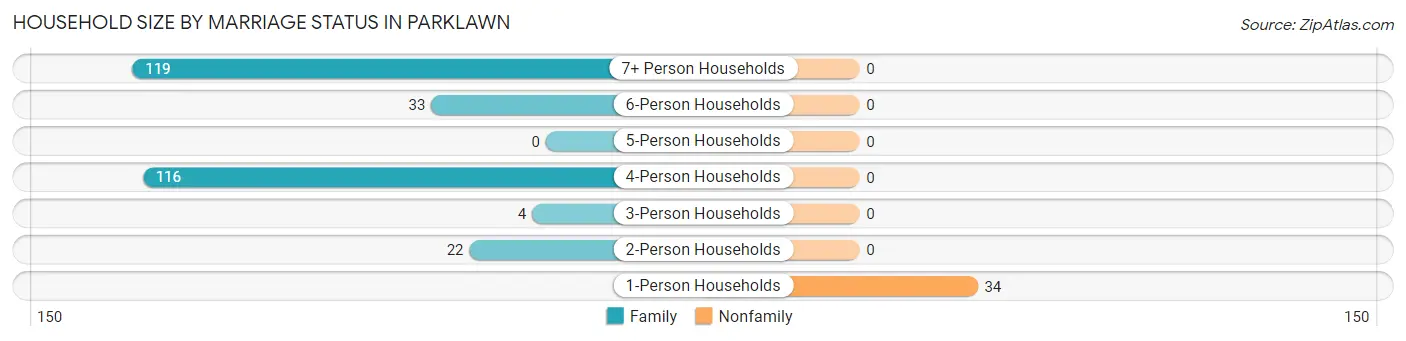
| Household Size | Family Households | Nonfamily Households |
| 1-Person Households | - | 34 (10.4%) |
| 2-Person Households | 22 (6.7%) | 0 (0.0%) |
| 3-Person Households | 4 (1.2%) | 0 (0.0%) |
| 4-Person Households | 116 (35.4%) | 0 (0.0%) |
| 5-Person Households | 0 (0.0%) | 0 (0.0%) |
| 6-Person Households | 33 (10.1%) | 0 (0.0%) |
| 7+ Person Households | 119 (36.3%) | 0 (0.0%) |
| Total | 294 (89.6%) | 34 (10.4%) |
Female Fertility in Parklawn
Fertility by Age in Parklawn
| Age Bracket | Women with Births | Births / 1,000 Women |
| 15 to 19 years | 0 (0.0%) | 0.0 |
| 20 to 34 years | 0 (0.0%) | 0.0 |
| 35 to 50 years | 0 (0.0%) | 0.0 |
| Total | 0 (0.0%) | 0.0 |
Fertility by Age by Marriage Status in Parklawn
| Age Bracket | Married | Unmarried |
| 15 to 19 years | 0 (0.0%) | 0 (0.0%) |
| 20 to 34 years | 0 (0.0%) | 0 (0.0%) |
| 35 to 50 years | 0 (0.0%) | 0 (0.0%) |
| Total | 0 (0.0%) | 0 (0.0%) |
Fertility by Education in Parklawn
| Educational Attainment | Women with Births | Births / 1,000 Women |
| Less than High School | 0 (0.0%) | 0.0 |
| High School Diploma | 0 (0.0%) | 0.0 |
| College or Associate's Degree | 0 (0.0%) | 0.0 |
| Bachelor's Degree | 0 (0.0%) | 0.0 |
| Graduate Degree | 0 (0.0%) | 0.0 |
| Total | 0 (0.0%) | 0.0 |
Fertility by Education by Marriage Status in Parklawn
| Educational Attainment | Married | Unmarried |
| Less than High School | 0 (0.0%) | 0 (0.0%) |
| High School Diploma | 0 (0.0%) | 0 (0.0%) |
| College or Associate's Degree | 0 (0.0%) | 0 (0.0%) |
| Bachelor's Degree | 0 (0.0%) | 0 (0.0%) |
| Graduate Degree | 0 (0.0%) | 0 (0.0%) |
| Total | 0 (0.0%) | 0 (0.0%) |
Employment Characteristics in Parklawn
Employment by Class of Employer in Parklawn
Among the 621 employed individuals in Parklawn, private company employees (512 | 82.5%), local government employees (60 | 9.7%), and self-employed (incorporated) (49 | 7.9%) make up the most common classes of employment.
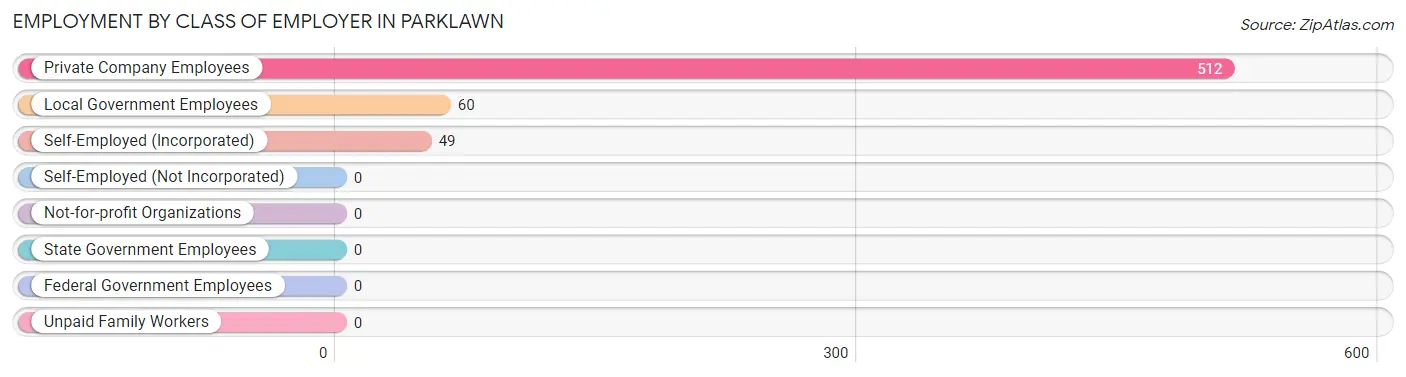
| Employer Class | # Employees | % Employees |
| Private Company Employees | 512 | 82.5% |
| Self-Employed (Incorporated) | 49 | 7.9% |
| Self-Employed (Not Incorporated) | 0 | 0.0% |
| Not-for-profit Organizations | 0 | 0.0% |
| Local Government Employees | 60 | 9.7% |
| State Government Employees | 0 | 0.0% |
| Federal Government Employees | 0 | 0.0% |
| Unpaid Family Workers | 0 | 0.0% |
| Total | 621 | 100.0% |
Employment Status by Age in Parklawn
According to the labor force statistics for Parklawn, out of the total population over 16 years of age (1,041), 62.6% or 652 individuals are in the labor force, with 3.7% or 24 of them unemployed. The age group with the highest labor force participation rate is 55 to 59 years, with 100.0% or 108 individuals in the labor force. Within the labor force, the 45 to 54 years age range has the highest percentage of unemployed individuals, with 20.2% or 24 of them being unemployed.
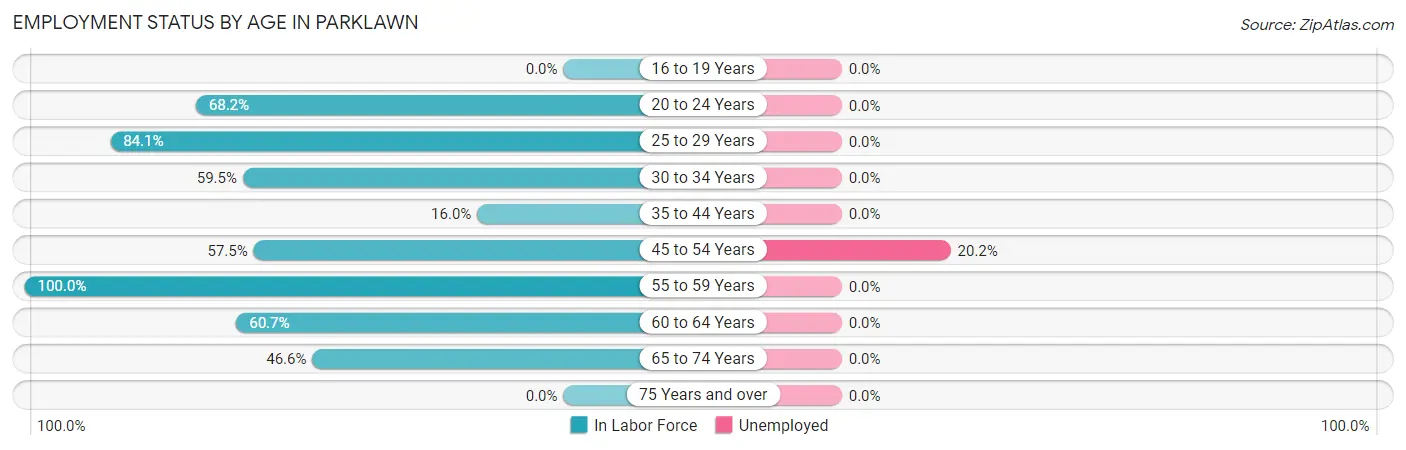
| Age Bracket | In Labor Force | Unemployed |
| 16 to 19 Years | 0 (0.0%) | 0 (0.0%) |
| 20 to 24 Years | 60 (68.2%) | 0 (0.0%) |
| 25 to 29 Years | 195 (84.1%) | 0 (0.0%) |
| 30 to 34 Years | 97 (59.5%) | 0 (0.0%) |
| 35 to 44 Years | 12 (16.0%) | 0 (0.0%) |
| 45 to 54 Years | 119 (57.5%) | 24 (20.2%) |
| 55 to 59 Years | 108 (100.0%) | 0 (0.0%) |
| 60 to 64 Years | 34 (60.7%) | 0 (0.0%) |
| 65 to 74 Years | 27 (46.6%) | 0 (0.0%) |
| 75 Years and over | 0 (0.0%) | 0 (0.0%) |
| Total | 652 (62.6%) | 24 (3.7%) |
Employment Status by Educational Attainment in Parklawn
According to labor force statistics for Parklawn, 67.2% of individuals (565) out of the total population between 25 and 64 years of age (841) are in the labor force, with 4.2% or 24 of them being unemployed. The group with the highest labor force participation rate are those with the educational attainment of high school diploma, with 100.0% or 200 individuals in the labor force. Within the labor force, individuals with bachelor's degree or higher education have the highest percentage of unemployment, with 66.7% or 24 of them being unemployed.
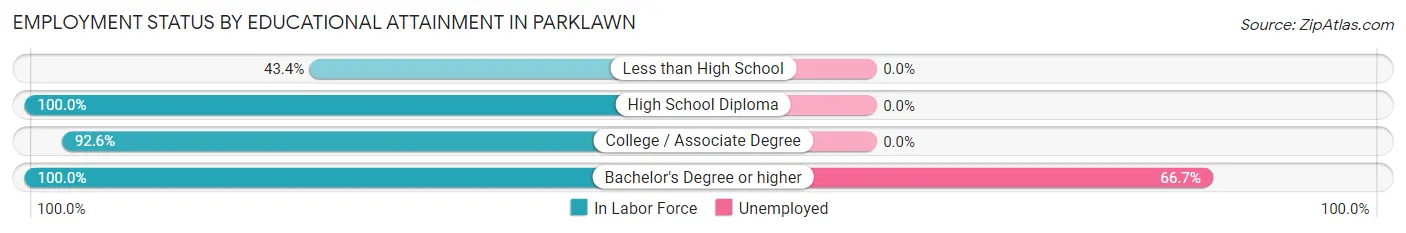
| Educational Attainment | In Labor Force | Unemployed |
| Less than High School | 204 (43.4%) | 0 (0.0%) |
| High School Diploma | 200 (100.0%) | 0 (0.0%) |
| College / Associate Degree | 125 (92.6%) | 0 (0.0%) |
| Bachelor's Degree or higher | 36 (100.0%) | 24 (66.7%) |
| Total | 565 (67.2%) | 35 (4.2%) |
Employment Occupations by Sex in Parklawn
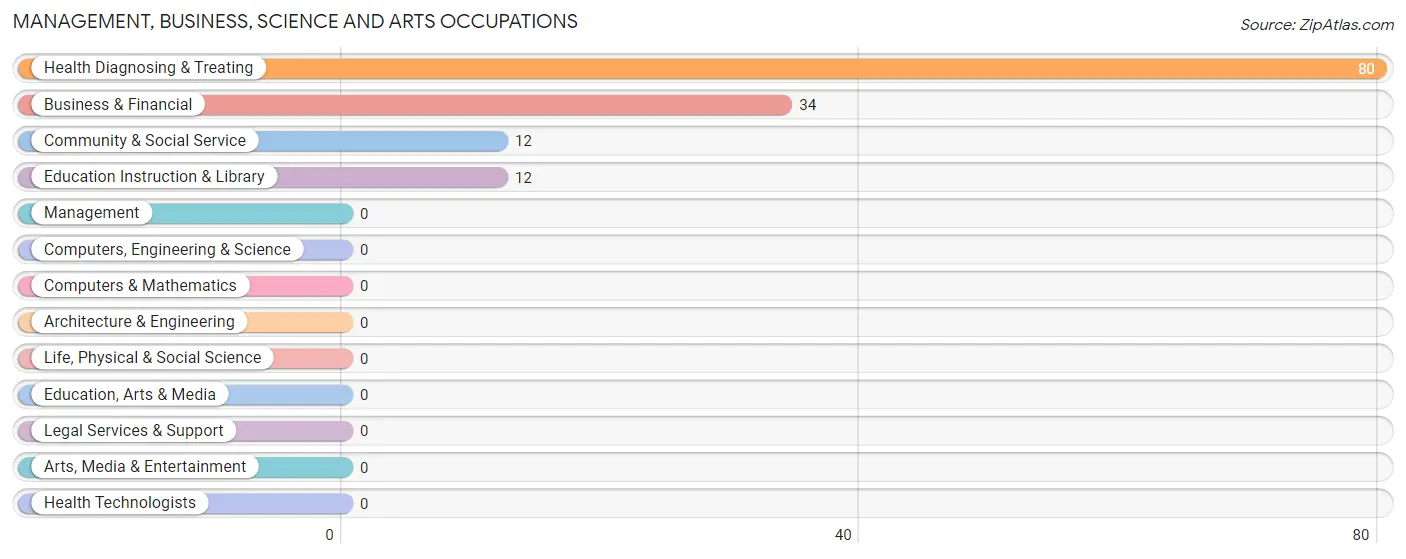
Management, Business, Science and Arts Occupations
The most common Management, Business, Science and Arts occupations in Parklawn are Health Diagnosing & Treating (80 | 12.7%), Business & Financial (34 | 5.4%), Community & Social Service (12 | 1.9%), and Education Instruction & Library (12 | 1.9%).
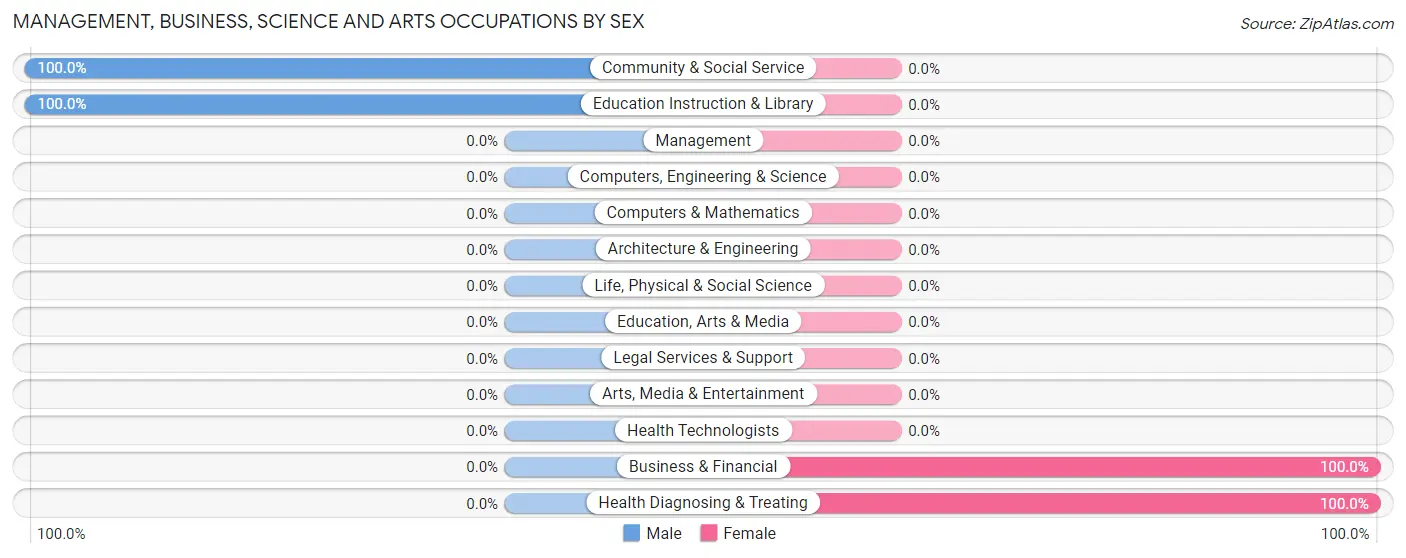
Management, Business, Science and Arts Occupations by Sex
Within the Management, Business, Science and Arts occupations in Parklawn, the most male-oriented occupations are Community & Social Service (100.0%), and Education Instruction & Library (100.0%), while the most female-oriented occupations are Business & Financial (100.0%), and Health Diagnosing & Treating (100.0%).
| Occupation | Male | Female |
| Management | 0 (0.0%) | 0 (0.0%) |
| Business & Financial | 0 (0.0%) | 34 (100.0%) |
| Computers, Engineering & Science | 0 (0.0%) | 0 (0.0%) |
| Computers & Mathematics | 0 (0.0%) | 0 (0.0%) |
| Architecture & Engineering | 0 (0.0%) | 0 (0.0%) |
| Life, Physical & Social Science | 0 (0.0%) | 0 (0.0%) |
| Community & Social Service | 12 (100.0%) | 0 (0.0%) |
| Education, Arts & Media | 0 (0.0%) | 0 (0.0%) |
| Legal Services & Support | 0 (0.0%) | 0 (0.0%) |
| Education Instruction & Library | 12 (100.0%) | 0 (0.0%) |
| Arts, Media & Entertainment | 0 (0.0%) | 0 (0.0%) |
| Health Diagnosing & Treating | 0 (0.0%) | 80 (100.0%) |
| Health Technologists | 0 (0.0%) | 0 (0.0%) |
| Total (Category) | 12 (9.5%) | 114 (90.5%) |
| Total (Overall) | 358 (57.0%) | 270 (43.0%) |
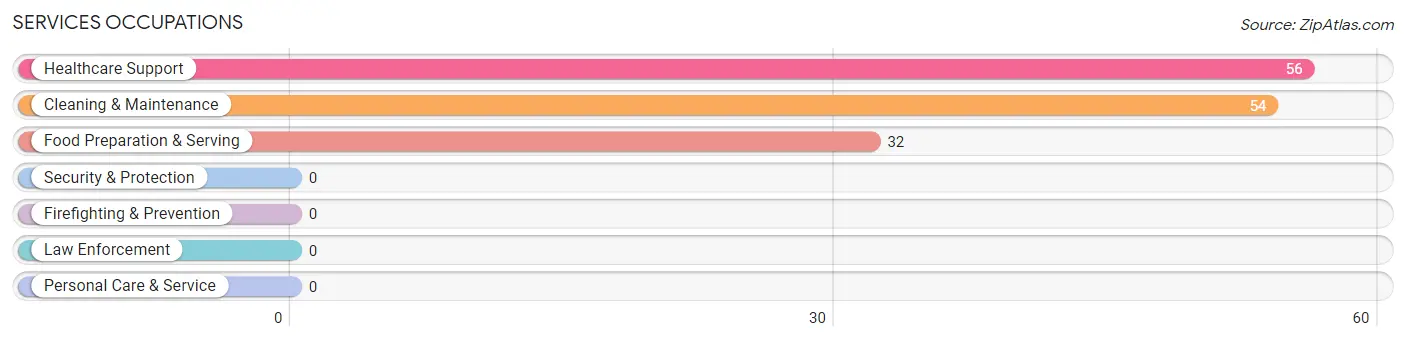
Services Occupations
The most common Services occupations in Parklawn are Healthcare Support (56 | 8.9%), Cleaning & Maintenance (54 | 8.6%), and Food Preparation & Serving (32 | 5.1%).
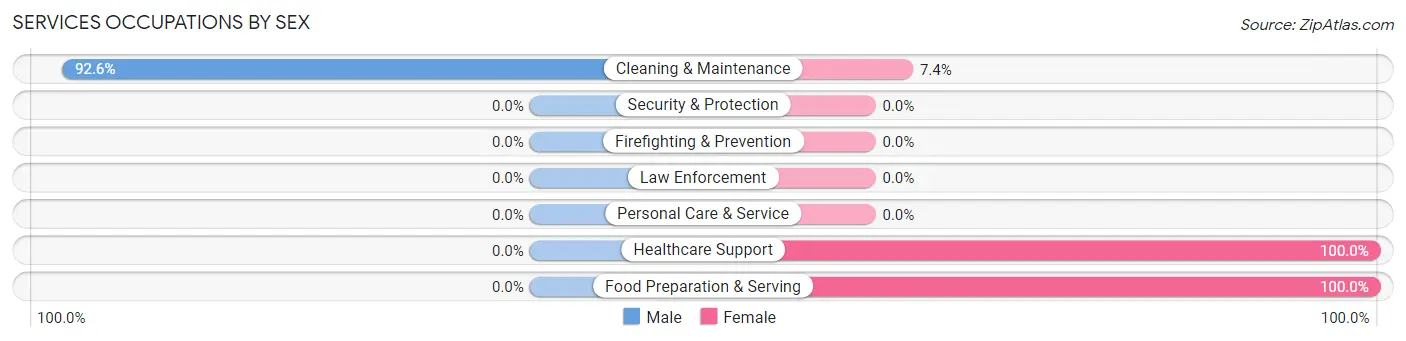
Services Occupations by Sex
| Occupation | Male | Female |
| Healthcare Support | 0 (0.0%) | 56 (100.0%) |
| Security & Protection | 0 (0.0%) | 0 (0.0%) |
| Firefighting & Prevention | 0 (0.0%) | 0 (0.0%) |
| Law Enforcement | 0 (0.0%) | 0 (0.0%) |
| Food Preparation & Serving | 0 (0.0%) | 32 (100.0%) |
| Cleaning & Maintenance | 50 (92.6%) | 4 (7.4%) |
| Personal Care & Service | 0 (0.0%) | 0 (0.0%) |
| Total (Category) | 50 (35.2%) | 92 (64.8%) |
| Total (Overall) | 358 (57.0%) | 270 (43.0%) |
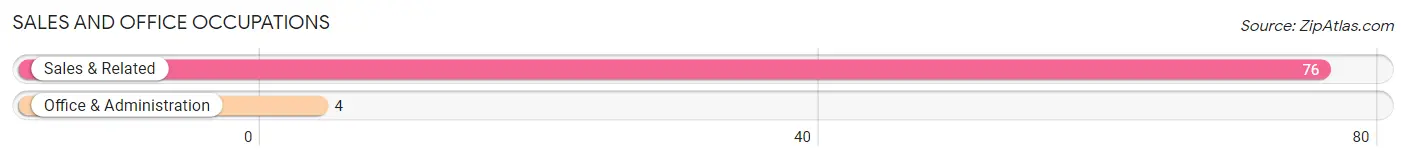
Sales and Office Occupations
The most common Sales and Office occupations in Parklawn are Sales & Related (76 | 12.1%), and Office & Administration (4 | 0.6%).
Sales and Office Occupations by Sex
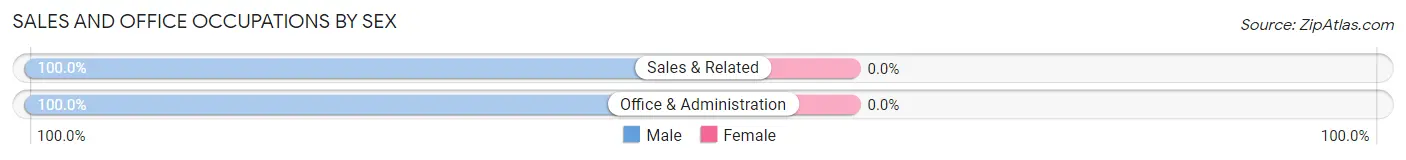
| Occupation | Male | Female |
| Sales & Related | 76 (100.0%) | 0 (0.0%) |
| Office & Administration | 4 (100.0%) | 0 (0.0%) |
| Total (Category) | 80 (100.0%) | 0 (0.0%) |
| Total (Overall) | 358 (57.0%) | 270 (43.0%) |
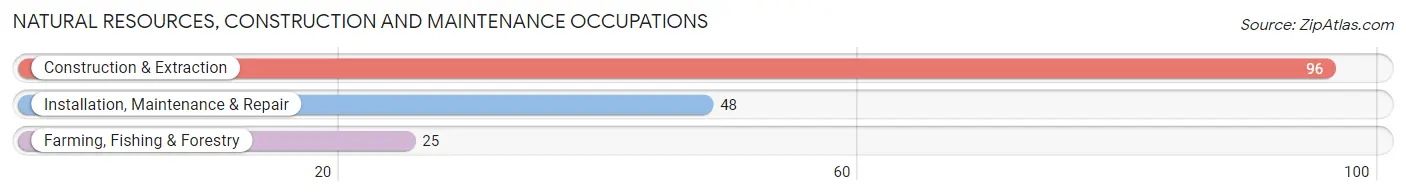
Natural Resources, Construction and Maintenance Occupations
The most common Natural Resources, Construction and Maintenance occupations in Parklawn are Construction & Extraction (96 | 15.3%), Installation, Maintenance & Repair (48 | 7.6%), and Farming, Fishing & Forestry (25 | 4.0%).
Natural Resources, Construction and Maintenance Occupations by Sex
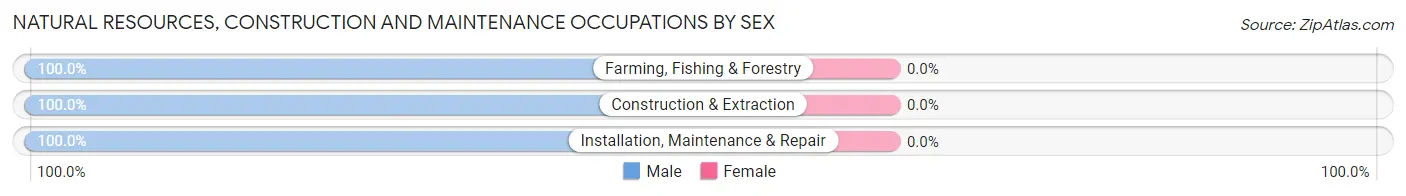
| Occupation | Male | Female |
| Farming, Fishing & Forestry | 25 (100.0%) | 0 (0.0%) |
| Construction & Extraction | 96 (100.0%) | 0 (0.0%) |
| Installation, Maintenance & Repair | 48 (100.0%) | 0 (0.0%) |
| Total (Category) | 169 (100.0%) | 0 (0.0%) |
| Total (Overall) | 358 (57.0%) | 270 (43.0%) |
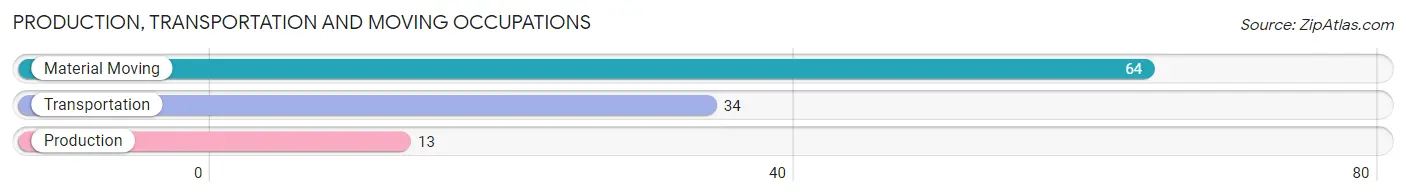
Production, Transportation and Moving Occupations
The most common Production, Transportation and Moving occupations in Parklawn are Material Moving (64 | 10.2%), Transportation (34 | 5.4%), and Production (13 | 2.1%).
Production, Transportation and Moving Occupations by Sex
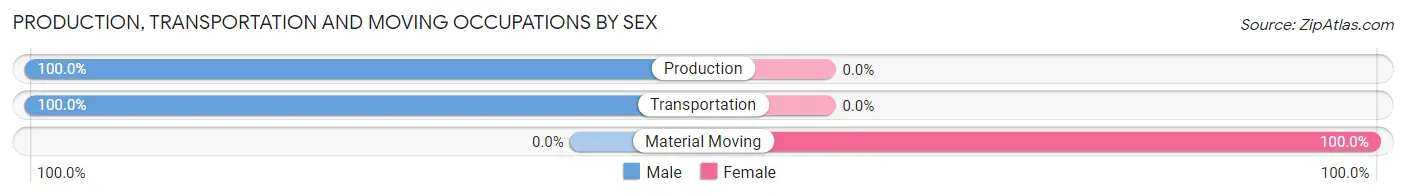
| Occupation | Male | Female |
| Production | 13 (100.0%) | 0 (0.0%) |
| Transportation | 34 (100.0%) | 0 (0.0%) |
| Material Moving | 0 (0.0%) | 64 (100.0%) |
| Total (Category) | 47 (42.3%) | 64 (57.7%) |
| Total (Overall) | 358 (57.0%) | 270 (43.0%) |
Employment Industries by Sex in Parklawn
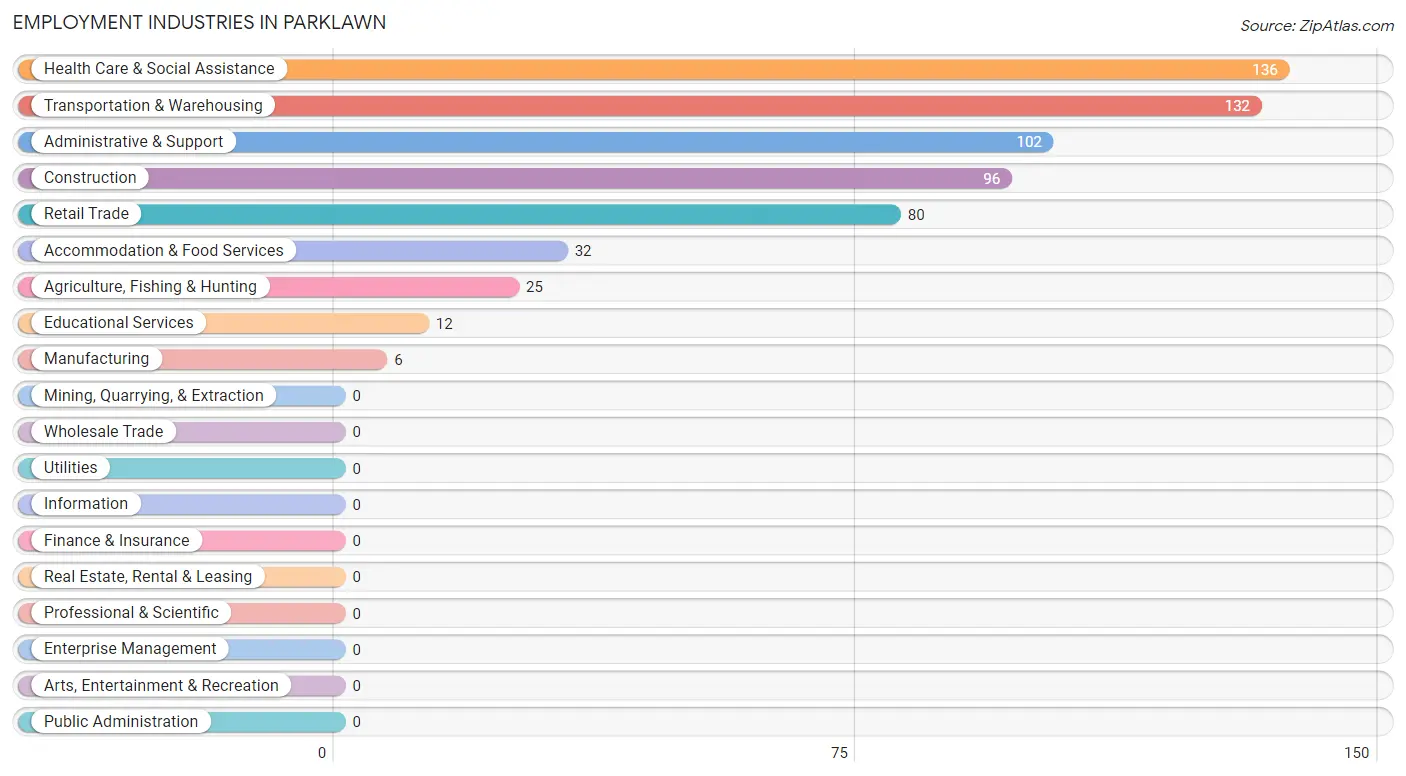
Employment Industries in Parklawn
The major employment industries in Parklawn include Health Care & Social Assistance (136 | 21.7%), Transportation & Warehousing (132 | 21.0%), Administrative & Support (102 | 16.2%), Construction (96 | 15.3%), and Retail Trade (80 | 12.7%).
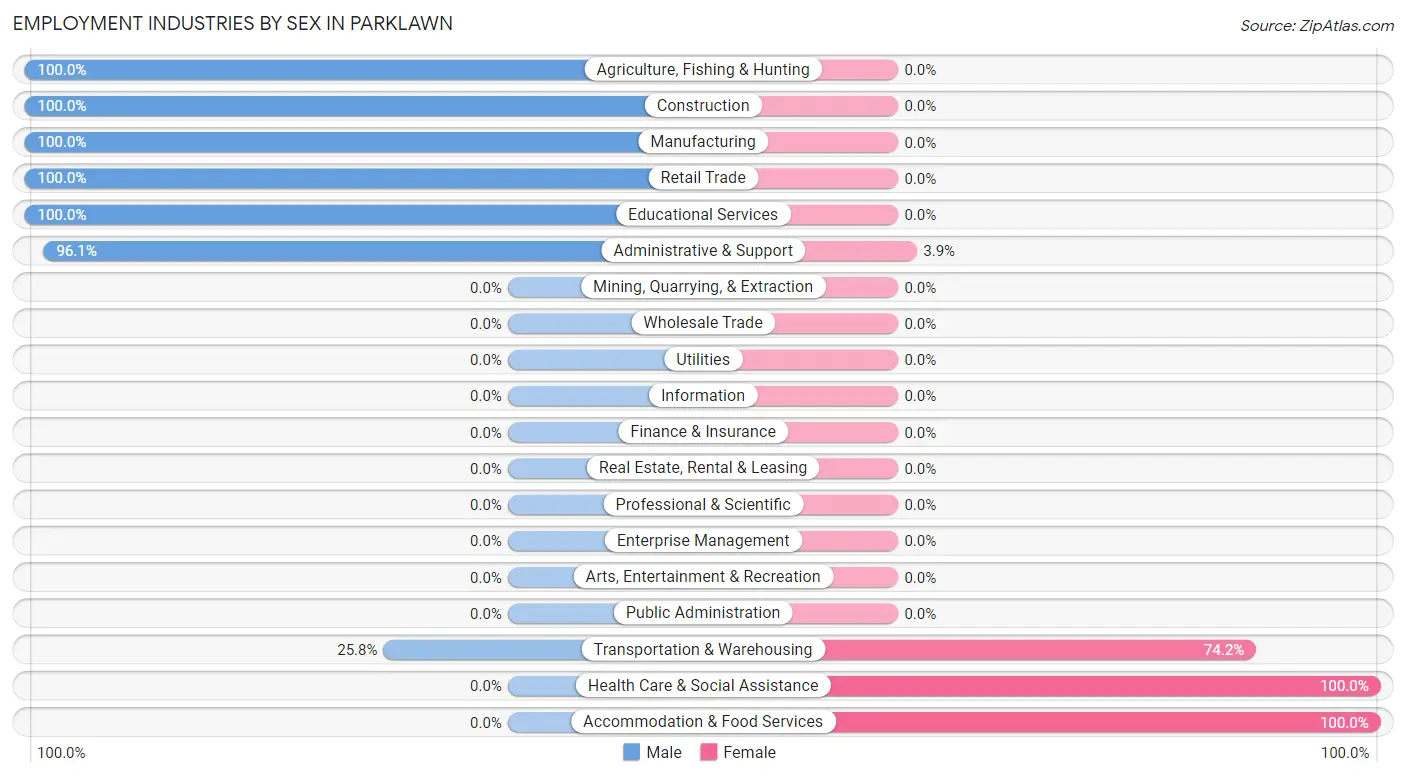
Employment Industries by Sex in Parklawn
The Parklawn industries that see more men than women are Agriculture, Fishing & Hunting (100.0%), Construction (100.0%), and Manufacturing (100.0%), whereas the industries that tend to have a higher number of women are Health Care & Social Assistance (100.0%), Accommodation & Food Services (100.0%), and Transportation & Warehousing (74.2%).
| Industry | Male | Female |
| Agriculture, Fishing & Hunting | 25 (100.0%) | 0 (0.0%) |
| Mining, Quarrying, & Extraction | 0 (0.0%) | 0 (0.0%) |
| Construction | 96 (100.0%) | 0 (0.0%) |
| Manufacturing | 6 (100.0%) | 0 (0.0%) |
| Wholesale Trade | 0 (0.0%) | 0 (0.0%) |
| Retail Trade | 80 (100.0%) | 0 (0.0%) |
| Transportation & Warehousing | 34 (25.8%) | 98 (74.2%) |
| Utilities | 0 (0.0%) | 0 (0.0%) |
| Information | 0 (0.0%) | 0 (0.0%) |
| Finance & Insurance | 0 (0.0%) | 0 (0.0%) |
| Real Estate, Rental & Leasing | 0 (0.0%) | 0 (0.0%) |
| Professional & Scientific | 0 (0.0%) | 0 (0.0%) |
| Enterprise Management | 0 (0.0%) | 0 (0.0%) |
| Administrative & Support | 98 (96.1%) | 4 (3.9%) |
| Educational Services | 12 (100.0%) | 0 (0.0%) |
| Health Care & Social Assistance | 0 (0.0%) | 136 (100.0%) |
| Arts, Entertainment & Recreation | 0 (0.0%) | 0 (0.0%) |
| Accommodation & Food Services | 0 (0.0%) | 32 (100.0%) |
| Public Administration | 0 (0.0%) | 0 (0.0%) |
| Total | 358 (57.0%) | 270 (43.0%) |
Education in Parklawn
School Enrollment in Parklawn
The most common levels of schooling among the 503 students in Parklawn are middle school (247 | 49.1%), elementary school (116 | 23.1%), and high school (84 | 16.7%).
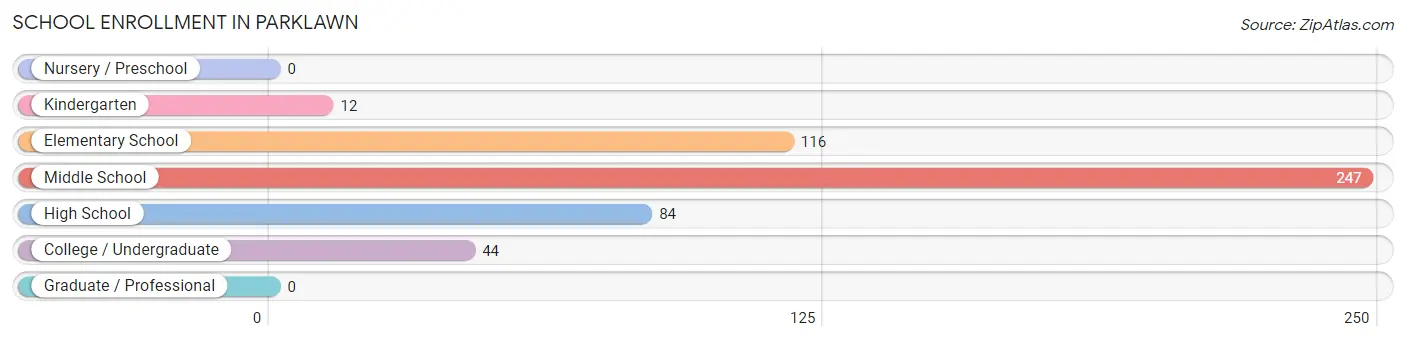
| School Level | # Students | % Students |
| Nursery / Preschool | 0 | 0.0% |
| Kindergarten | 12 | 2.4% |
| Elementary School | 116 | 23.1% |
| Middle School | 247 | 49.1% |
| High School | 84 | 16.7% |
| College / Undergraduate | 44 | 8.7% |
| Graduate / Professional | 0 | 0.0% |
| Total | 503 | 100.0% |
School Enrollment by Age by Funding Source in Parklawn
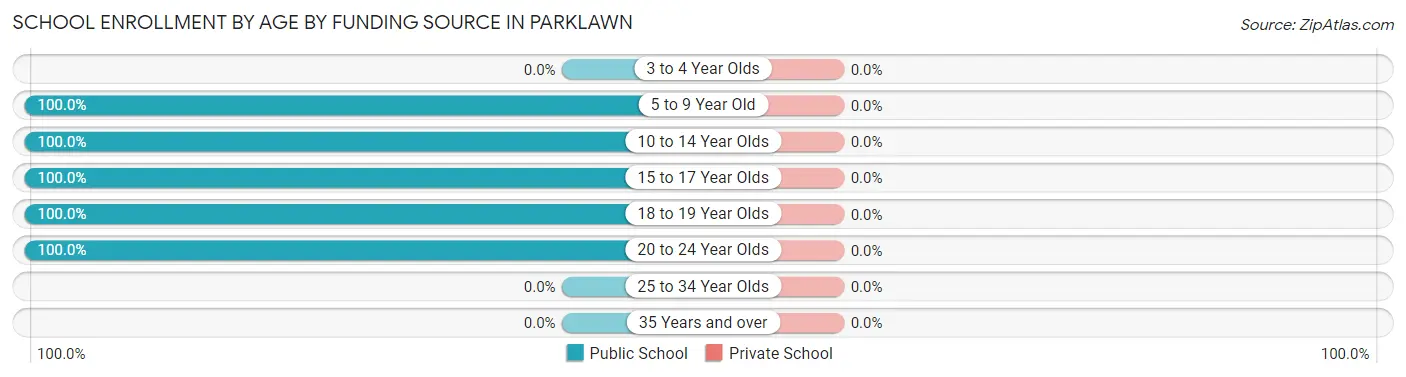
| Age Bracket | Public School | Private School |
| 3 to 4 Year Olds | 0 (0.0%) | 0 (0.0%) |
| 5 to 9 Year Old | 128 (100.0%) | 0 (0.0%) |
| 10 to 14 Year Olds | 281 (100.0%) | 0 (0.0%) |
| 15 to 17 Year Olds | 50 (100.0%) | 0 (0.0%) |
| 18 to 19 Year Olds | 28 (100.0%) | 0 (0.0%) |
| 20 to 24 Year Olds | 16 (100.0%) | 0 (0.0%) |
| 25 to 34 Year Olds | 0 (0.0%) | 0 (0.0%) |
| 35 Years and over | 0 (0.0%) | 0 (0.0%) |
| Total | 503 (100.0%) | 0 (0.0%) |
Educational Attainment by Field of Study in Parklawn
Engineering (24 | 66.7%), and psychology (12 | 33.3%) are the most common fields of study among 36 individuals in Parklawn who have obtained a bachelor's degree or higher.
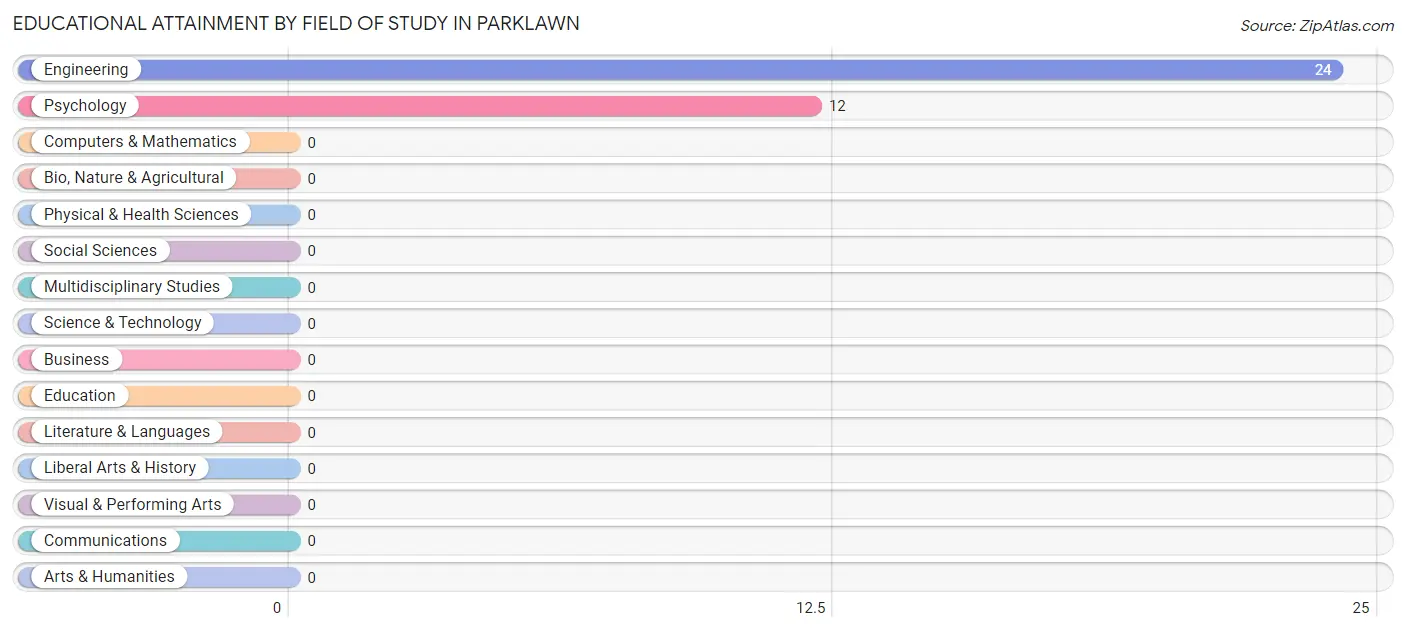
| Field of Study | # Graduates | % Graduates |
| Computers & Mathematics | 0 | 0.0% |
| Bio, Nature & Agricultural | 0 | 0.0% |
| Physical & Health Sciences | 0 | 0.0% |
| Psychology | 12 | 33.3% |
| Social Sciences | 0 | 0.0% |
| Engineering | 24 | 66.7% |
| Multidisciplinary Studies | 0 | 0.0% |
| Science & Technology | 0 | 0.0% |
| Business | 0 | 0.0% |
| Education | 0 | 0.0% |
| Literature & Languages | 0 | 0.0% |
| Liberal Arts & History | 0 | 0.0% |
| Visual & Performing Arts | 0 | 0.0% |
| Communications | 0 | 0.0% |
| Arts & Humanities | 0 | 0.0% |
| Total | 36 | 100.0% |
Transportation & Commute in Parklawn
Vehicle Availability by Sex in Parklawn
The most prevalent vehicle ownership categories in Parklawn are males with 5 or more vehicles (177, accounting for 50.4%) and females with 5 or more vehicles (210, making up 65.6%).
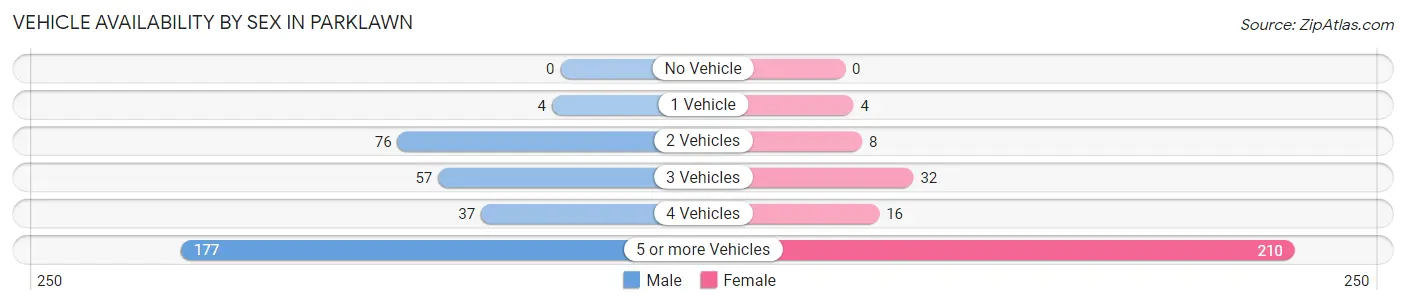
| Vehicles Available | Male | Female |
| No Vehicle | 0 (0.0%) | 0 (0.0%) |
| 1 Vehicle | 4 (1.1%) | 4 (1.5%) |
| 2 Vehicles | 76 (21.6%) | 8 (3.0%) |
| 3 Vehicles | 57 (16.2%) | 32 (11.8%) |
| 4 Vehicles | 37 (10.5%) | 16 (5.9%) |
| 5 or more Vehicles | 177 (50.4%) | 210 (77.8%) |
| Total | 351 (100.0%) | 270 (100.0%) |
Commute Time in Parklawn
The most frequently occuring commute durations in Parklawn are 30 to 34 minutes (208 commuters, 34.4%), 20 to 24 minutes (111 commuters, 18.4%), and 10 to 14 minutes (71 commuters, 11.7%).
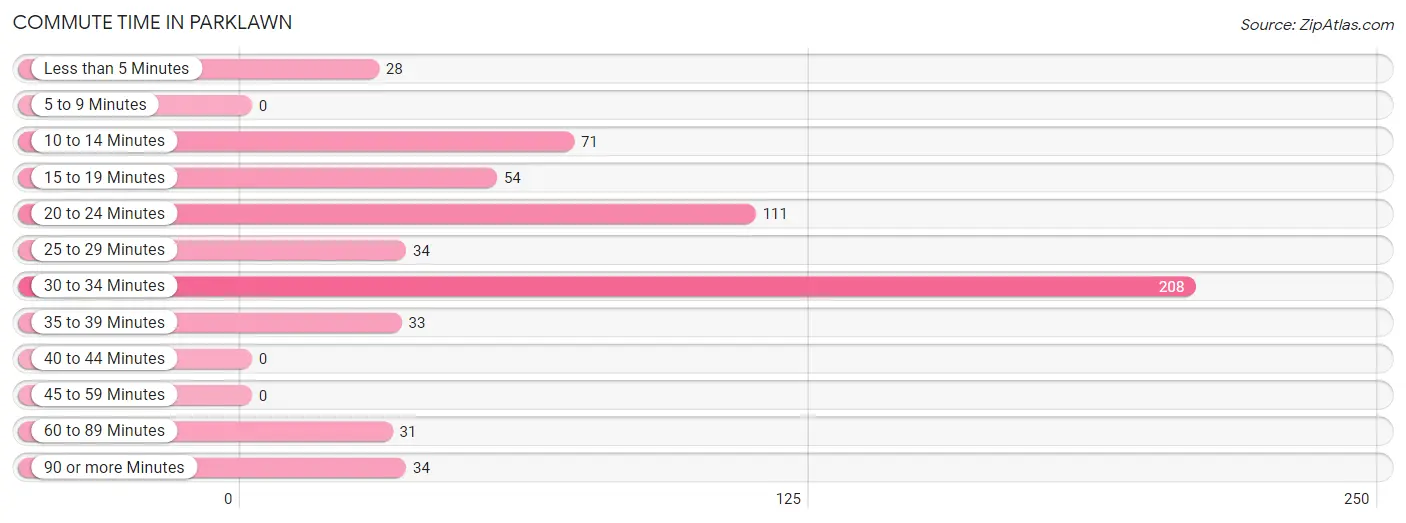
| Commute Time | # Commuters | % Commuters |
| Less than 5 Minutes | 28 | 4.6% |
| 5 to 9 Minutes | 0 | 0.0% |
| 10 to 14 Minutes | 71 | 11.7% |
| 15 to 19 Minutes | 54 | 8.9% |
| 20 to 24 Minutes | 111 | 18.4% |
| 25 to 29 Minutes | 34 | 5.6% |
| 30 to 34 Minutes | 208 | 34.4% |
| 35 to 39 Minutes | 33 | 5.5% |
| 40 to 44 Minutes | 0 | 0.0% |
| 45 to 59 Minutes | 0 | 0.0% |
| 60 to 89 Minutes | 31 | 5.1% |
| 90 or more Minutes | 34 | 5.6% |
Commute Time by Sex in Parklawn
The most common commute times in Parklawn are 30 to 34 minutes (104 commuters, 31.1%) for males and 30 to 34 minutes (104 commuters, 38.5%) for females.
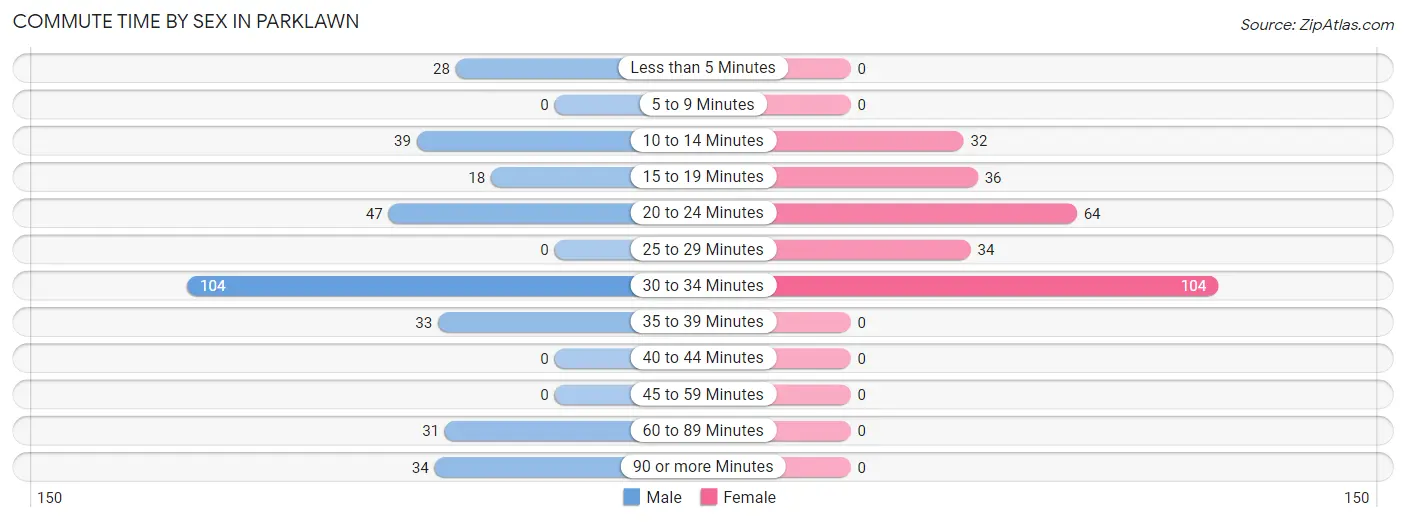
| Commute Time | Male | Female |
| Less than 5 Minutes | 28 (8.4%) | 0 (0.0%) |
| 5 to 9 Minutes | 0 (0.0%) | 0 (0.0%) |
| 10 to 14 Minutes | 39 (11.7%) | 32 (11.8%) |
| 15 to 19 Minutes | 18 (5.4%) | 36 (13.3%) |
| 20 to 24 Minutes | 47 (14.1%) | 64 (23.7%) |
| 25 to 29 Minutes | 0 (0.0%) | 34 (12.6%) |
| 30 to 34 Minutes | 104 (31.1%) | 104 (38.5%) |
| 35 to 39 Minutes | 33 (9.9%) | 0 (0.0%) |
| 40 to 44 Minutes | 0 (0.0%) | 0 (0.0%) |
| 45 to 59 Minutes | 0 (0.0%) | 0 (0.0%) |
| 60 to 89 Minutes | 31 (9.3%) | 0 (0.0%) |
| 90 or more Minutes | 34 (10.2%) | 0 (0.0%) |
Time of Departure to Work by Sex in Parklawn
The most frequent times of departure to work in Parklawn are 7:00 AM to 7:29 AM (88, 26.4%) for males and 6:00 AM to 6:29 AM (106, 39.3%) for females.
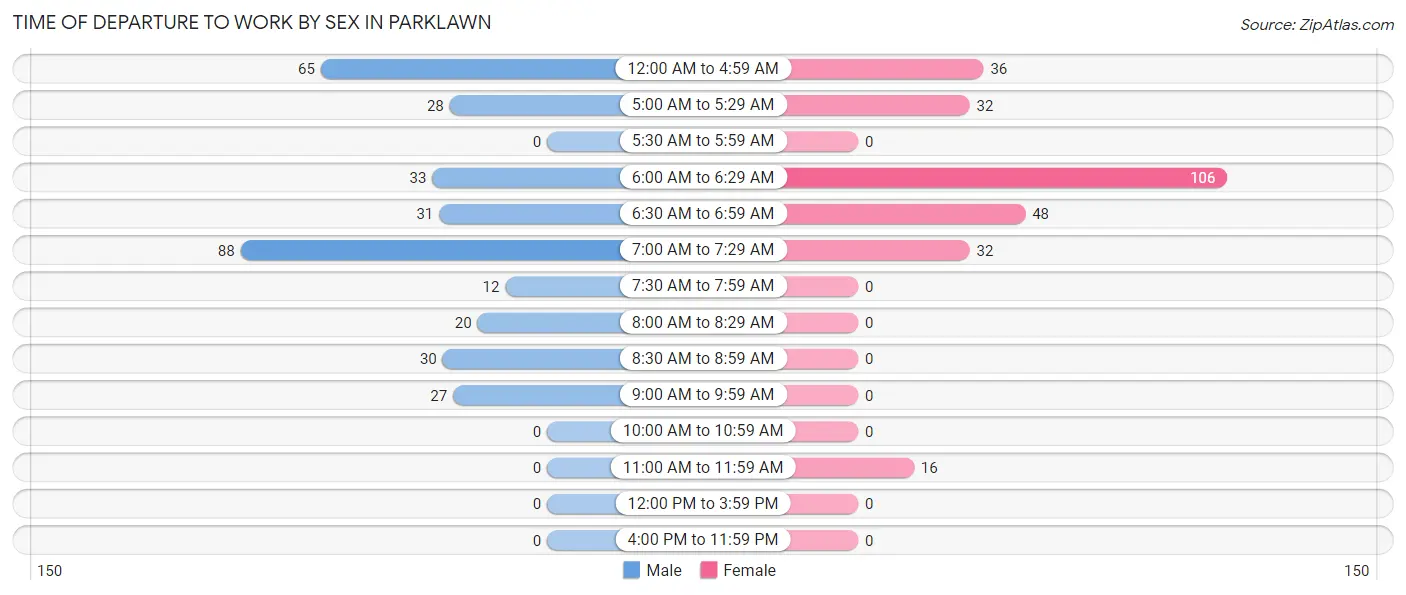
| Time of Departure | Male | Female |
| 12:00 AM to 4:59 AM | 65 (19.5%) | 36 (13.3%) |
| 5:00 AM to 5:29 AM | 28 (8.4%) | 32 (11.8%) |
| 5:30 AM to 5:59 AM | 0 (0.0%) | 0 (0.0%) |
| 6:00 AM to 6:29 AM | 33 (9.9%) | 106 (39.3%) |
| 6:30 AM to 6:59 AM | 31 (9.3%) | 48 (17.8%) |
| 7:00 AM to 7:29 AM | 88 (26.4%) | 32 (11.8%) |
| 7:30 AM to 7:59 AM | 12 (3.6%) | 0 (0.0%) |
| 8:00 AM to 8:29 AM | 20 (6.0%) | 0 (0.0%) |
| 8:30 AM to 8:59 AM | 30 (9.0%) | 0 (0.0%) |
| 9:00 AM to 9:59 AM | 27 (8.1%) | 0 (0.0%) |
| 10:00 AM to 10:59 AM | 0 (0.0%) | 0 (0.0%) |
| 11:00 AM to 11:59 AM | 0 (0.0%) | 16 (5.9%) |
| 12:00 PM to 3:59 PM | 0 (0.0%) | 0 (0.0%) |
| 4:00 PM to 11:59 PM | 0 (0.0%) | 0 (0.0%) |
| Total | 334 (100.0%) | 270 (100.0%) |
Housing Occupancy in Parklawn
Occupancy by Ownership in Parklawn
Of the total 328 dwellings in Parklawn, owner-occupied units account for 132 (40.2%), while renter-occupied units make up 196 (59.8%).
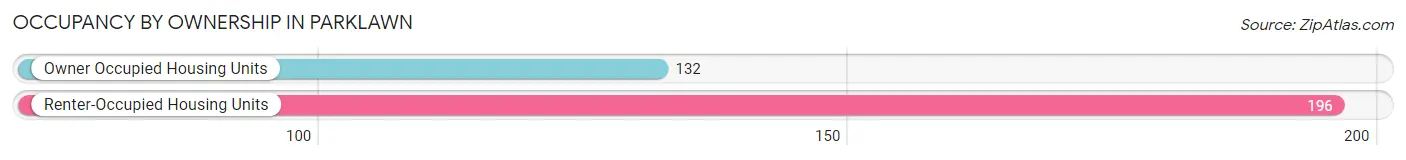
| Occupancy | # Housing Units | % Housing Units |
| Owner Occupied Housing Units | 132 | 40.2% |
| Renter-Occupied Housing Units | 196 | 59.8% |
| Total Occupied Housing Units | 328 | 100.0% |
Occupancy by Household Size in Parklawn
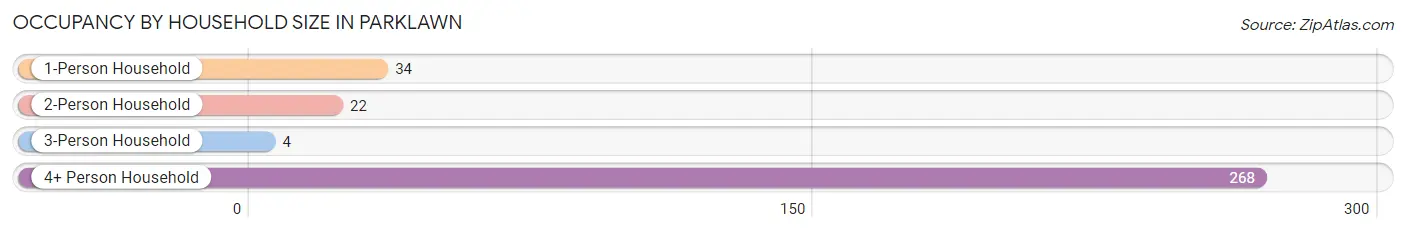
| Household Size | # Housing Units | % Housing Units |
| 1-Person Household | 34 | 10.4% |
| 2-Person Household | 22 | 6.7% |
| 3-Person Household | 4 | 1.2% |
| 4+ Person Household | 268 | 81.7% |
| Total Housing Units | 328 | 100.0% |
Occupancy by Ownership by Household Size in Parklawn
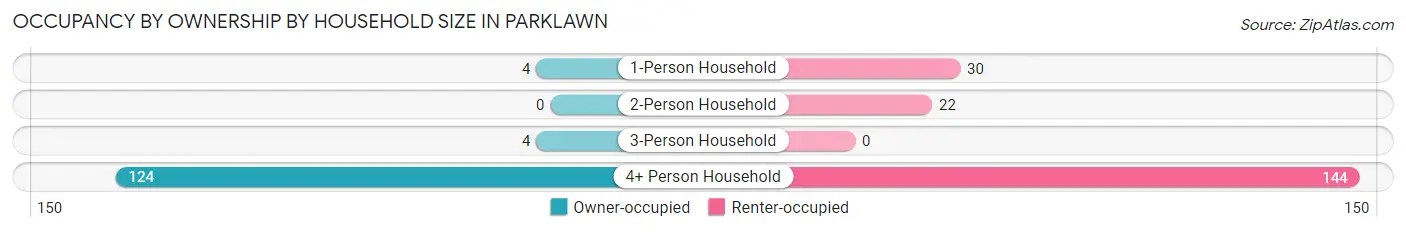
| Household Size | Owner-occupied | Renter-occupied |
| 1-Person Household | 4 (11.8%) | 30 (88.2%) |
| 2-Person Household | 0 (0.0%) | 22 (100.0%) |
| 3-Person Household | 4 (100.0%) | 0 (0.0%) |
| 4+ Person Household | 124 (46.3%) | 144 (53.7%) |
| Total Housing Units | 132 (40.2%) | 196 (59.8%) |
Occupancy by Educational Attainment in Parklawn
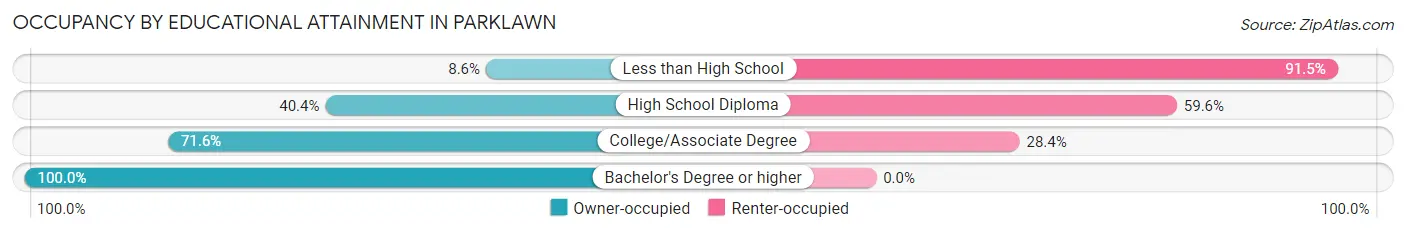
| Household Size | Owner-occupied | Renter-occupied |
| Less than High School | 10 (8.6%) | 107 (91.4%) |
| High School Diploma | 42 (40.4%) | 62 (59.6%) |
| College/Associate Degree | 68 (71.6%) | 27 (28.4%) |
| Bachelor's Degree or higher | 12 (100.0%) | 0 (0.0%) |
Occupancy by Age of Householder in Parklawn
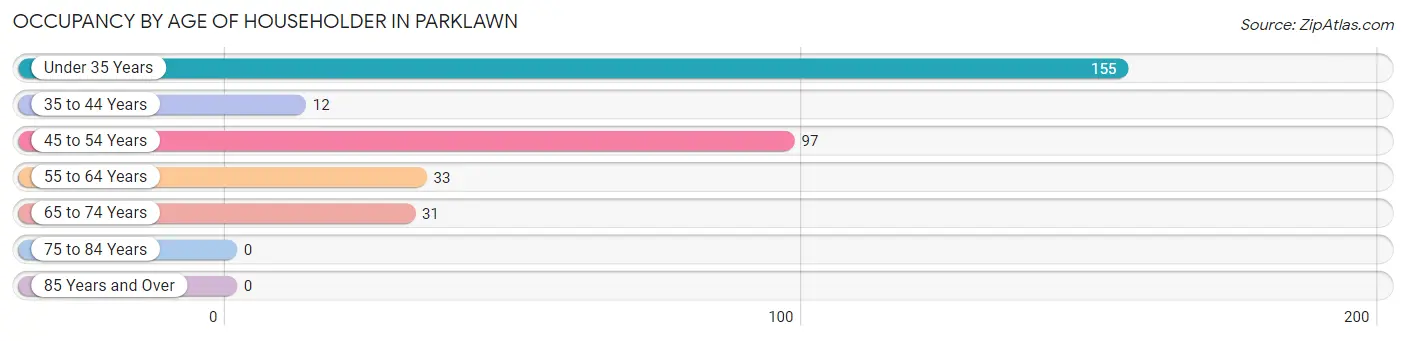
| Age Bracket | # Households | % Households |
| Under 35 Years | 155 | 47.3% |
| 35 to 44 Years | 12 | 3.7% |
| 45 to 54 Years | 97 | 29.6% |
| 55 to 64 Years | 33 | 10.1% |
| 65 to 74 Years | 31 | 9.5% |
| 75 to 84 Years | 0 | 0.0% |
| 85 Years and Over | 0 | 0.0% |
| Total | 328 | 100.0% |
Housing Finances in Parklawn
Median Income by Occupancy in Parklawn
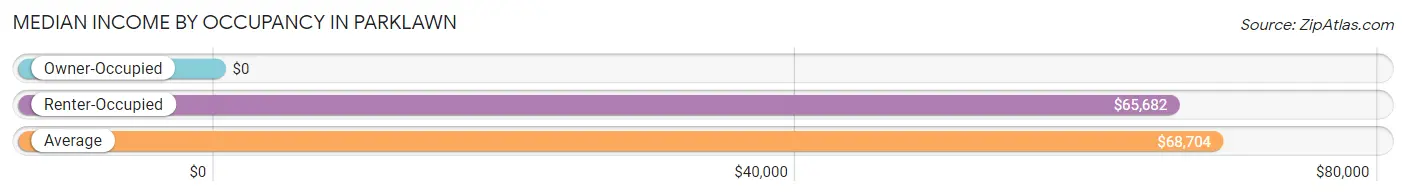
| Occupancy Type | # Households | Median Income |
| Owner-Occupied | 132 (40.2%) | $0 |
| Renter-Occupied | 196 (59.8%) | $65,682 |
| Average | 328 (100.0%) | $68,704 |
Occupancy by Householder Income Bracket in Parklawn
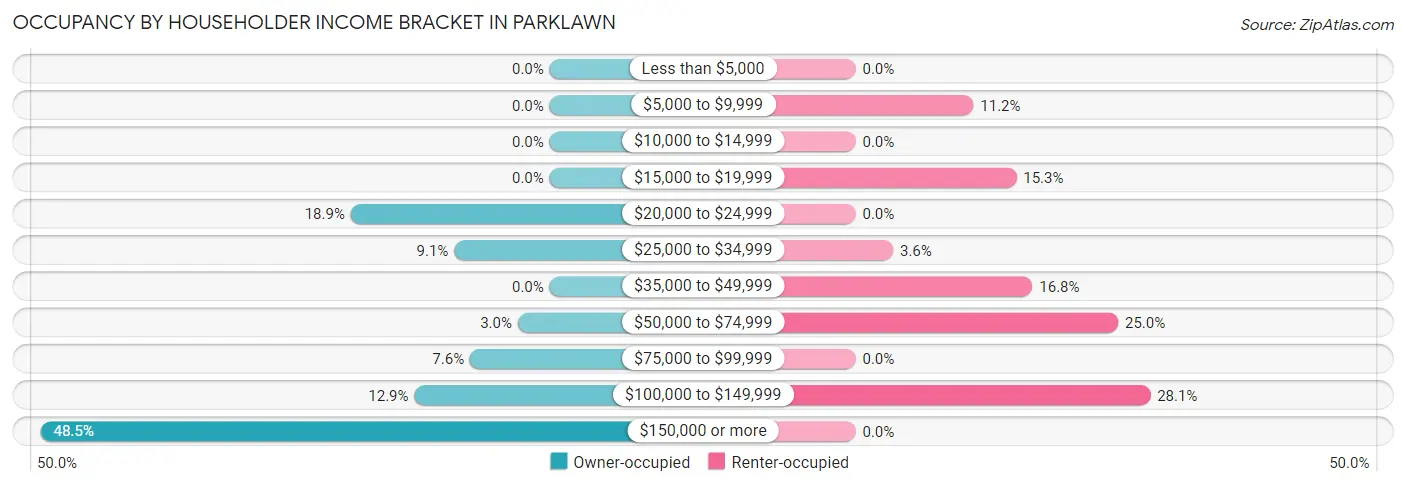
| Income Bracket | Owner-occupied | Renter-occupied |
| Less than $5,000 | 0 (0.0%) | 0 (0.0%) |
| $5,000 to $9,999 | 0 (0.0%) | 22 (11.2%) |
| $10,000 to $14,999 | 0 (0.0%) | 0 (0.0%) |
| $15,000 to $19,999 | 0 (0.0%) | 30 (15.3%) |
| $20,000 to $24,999 | 25 (18.9%) | 0 (0.0%) |
| $25,000 to $34,999 | 12 (9.1%) | 7 (3.6%) |
| $35,000 to $49,999 | 0 (0.0%) | 33 (16.8%) |
| $50,000 to $74,999 | 4 (3.0%) | 49 (25.0%) |
| $75,000 to $99,999 | 10 (7.6%) | 0 (0.0%) |
| $100,000 to $149,999 | 17 (12.9%) | 55 (28.1%) |
| $150,000 or more | 64 (48.5%) | 0 (0.0%) |
| Total | 132 (100.0%) | 196 (100.0%) |
Monthly Housing Cost Tiers in Parklawn
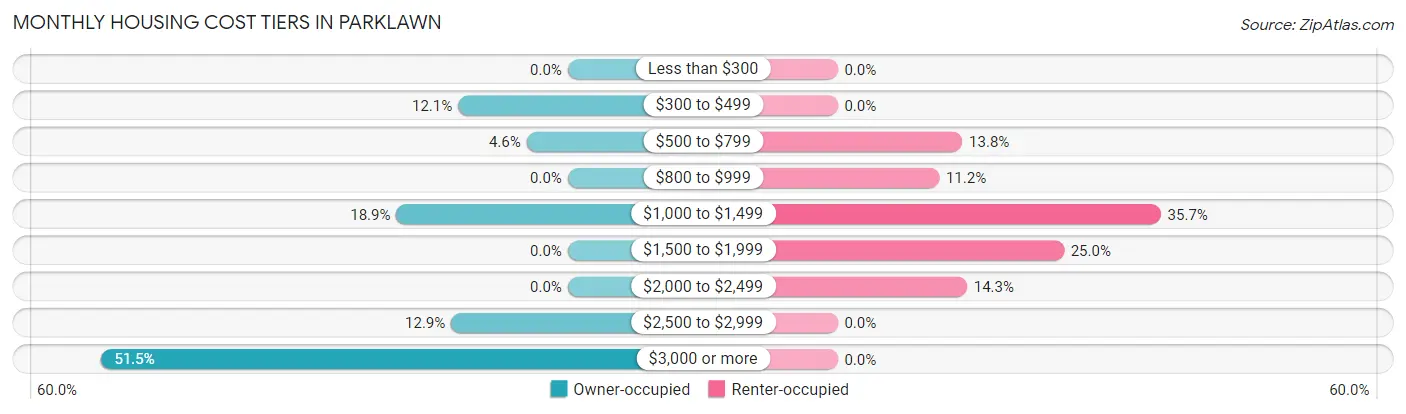
| Monthly Cost | Owner-occupied | Renter-occupied |
| Less than $300 | 0 (0.0%) | 0 (0.0%) |
| $300 to $499 | 16 (12.1%) | 0 (0.0%) |
| $500 to $799 | 6 (4.5%) | 27 (13.8%) |
| $800 to $999 | 0 (0.0%) | 22 (11.2%) |
| $1,000 to $1,499 | 25 (18.9%) | 70 (35.7%) |
| $1,500 to $1,999 | 0 (0.0%) | 49 (25.0%) |
| $2,000 to $2,499 | 0 (0.0%) | 28 (14.3%) |
| $2,500 to $2,999 | 17 (12.9%) | 0 (0.0%) |
| $3,000 or more | 68 (51.5%) | 0 (0.0%) |
| Total | 132 (100.0%) | 196 (100.0%) |
Physical Housing Characteristics in Parklawn
Housing Structures in Parklawn
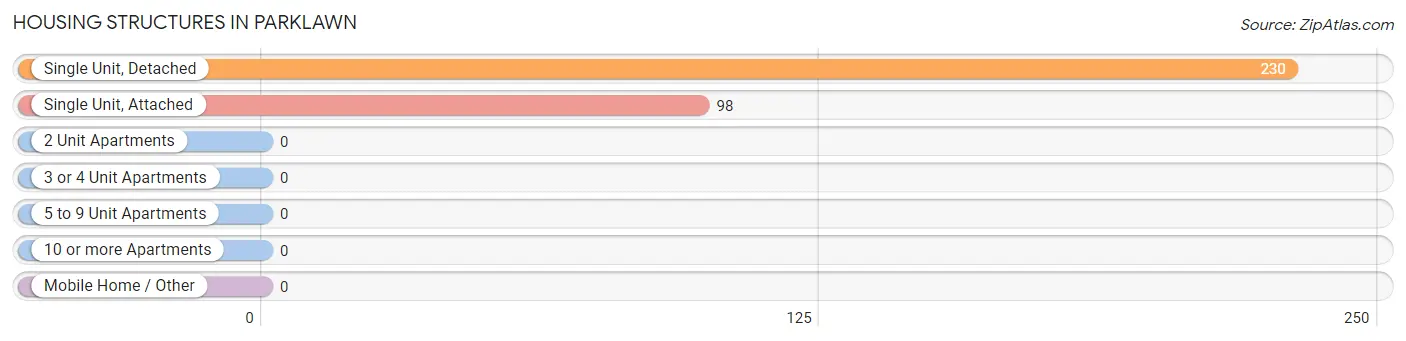
| Structure Type | # Housing Units | % Housing Units |
| Single Unit, Detached | 230 | 70.1% |
| Single Unit, Attached | 98 | 29.9% |
| 2 Unit Apartments | 0 | 0.0% |
| 3 or 4 Unit Apartments | 0 | 0.0% |
| 5 to 9 Unit Apartments | 0 | 0.0% |
| 10 or more Apartments | 0 | 0.0% |
| Mobile Home / Other | 0 | 0.0% |
| Total | 328 | 100.0% |
Housing Structures by Occupancy in Parklawn
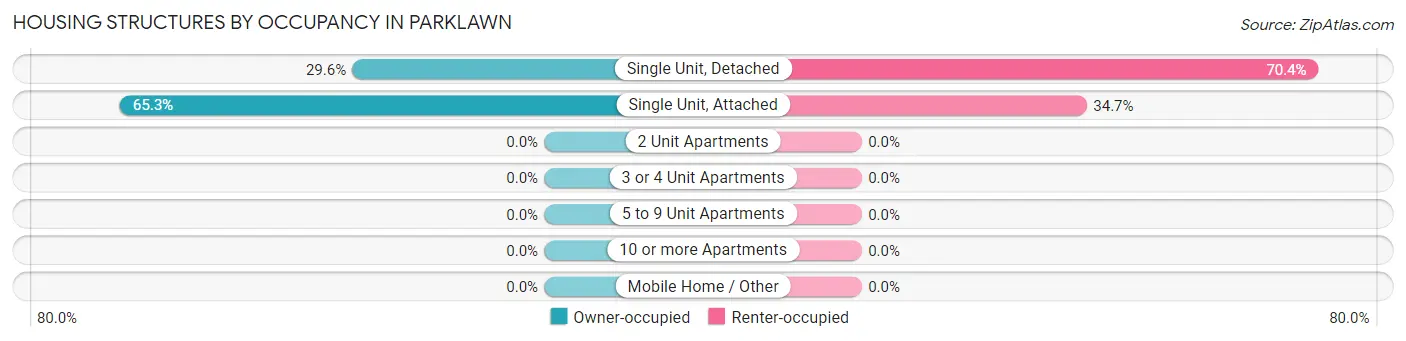
| Structure Type | Owner-occupied | Renter-occupied |
| Single Unit, Detached | 68 (29.6%) | 162 (70.4%) |
| Single Unit, Attached | 64 (65.3%) | 34 (34.7%) |
| 2 Unit Apartments | 0 (0.0%) | 0 (0.0%) |
| 3 or 4 Unit Apartments | 0 (0.0%) | 0 (0.0%) |
| 5 to 9 Unit Apartments | 0 (0.0%) | 0 (0.0%) |
| 10 or more Apartments | 0 (0.0%) | 0 (0.0%) |
| Mobile Home / Other | 0 (0.0%) | 0 (0.0%) |
| Total | 132 (40.2%) | 196 (59.8%) |
Housing Structures by Number of Rooms in Parklawn
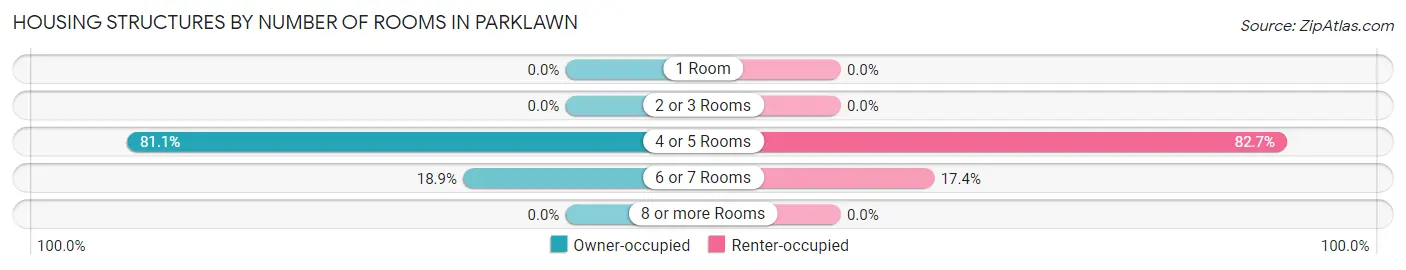
| Number of Rooms | Owner-occupied | Renter-occupied |
| 1 Room | 0 (0.0%) | 0 (0.0%) |
| 2 or 3 Rooms | 0 (0.0%) | 0 (0.0%) |
| 4 or 5 Rooms | 107 (81.1%) | 162 (82.7%) |
| 6 or 7 Rooms | 25 (18.9%) | 34 (17.3%) |
| 8 or more Rooms | 0 (0.0%) | 0 (0.0%) |
| Total | 132 (100.0%) | 196 (100.0%) |
Housing Structure by Heating Type in Parklawn
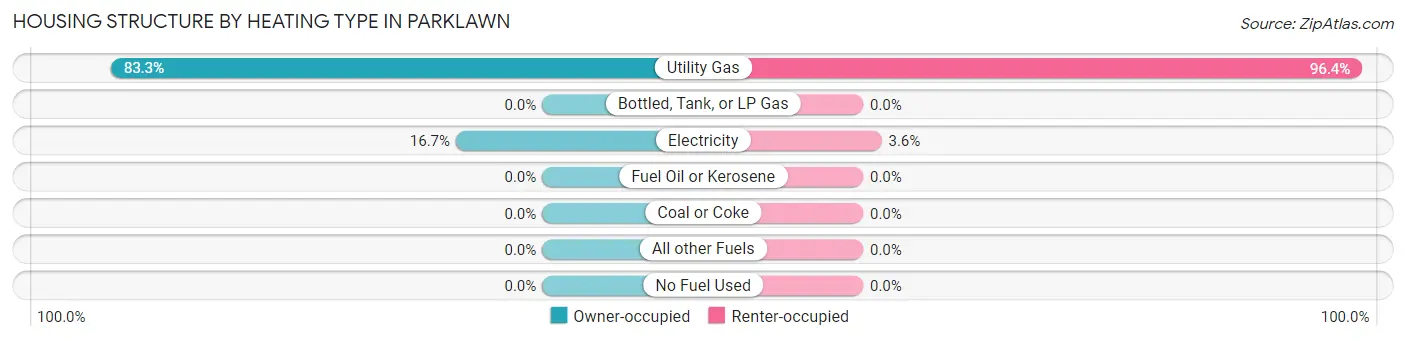
| Heating Type | Owner-occupied | Renter-occupied |
| Utility Gas | 110 (83.3%) | 189 (96.4%) |
| Bottled, Tank, or LP Gas | 0 (0.0%) | 0 (0.0%) |
| Electricity | 22 (16.7%) | 7 (3.6%) |
| Fuel Oil or Kerosene | 0 (0.0%) | 0 (0.0%) |
| Coal or Coke | 0 (0.0%) | 0 (0.0%) |
| All other Fuels | 0 (0.0%) | 0 (0.0%) |
| No Fuel Used | 0 (0.0%) | 0 (0.0%) |
| Total | 132 (100.0%) | 196 (100.0%) |
Household Vehicle Usage in Parklawn
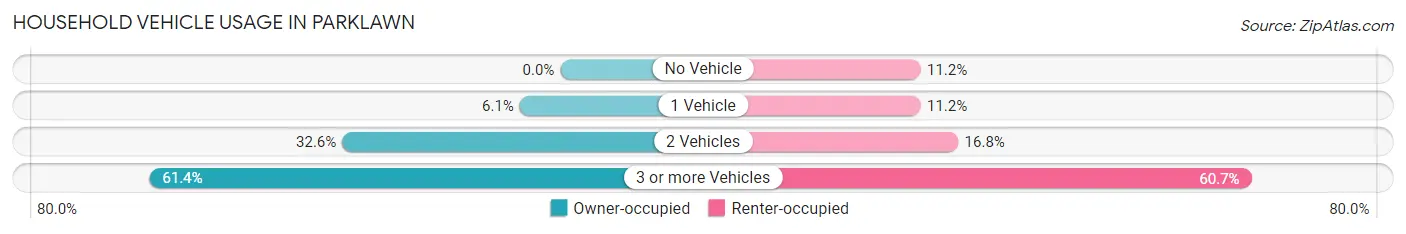
| Vehicles per Household | Owner-occupied | Renter-occupied |
| No Vehicle | 0 (0.0%) | 22 (11.2%) |
| 1 Vehicle | 8 (6.1%) | 22 (11.2%) |
| 2 Vehicles | 43 (32.6%) | 33 (16.8%) |
| 3 or more Vehicles | 81 (61.4%) | 119 (60.7%) |
| Total | 132 (100.0%) | 196 (100.0%) |
Real Estate & Mortgages in Parklawn
Real Estate and Mortgage Overview in Parklawn
| Characteristic | Without Mortgage | With Mortgage |
| Housing Units | 26 | 106 |
| Median Property Value | $253,600 | $793,000 |
| Median Household Income | - | - |
| Monthly Housing Costs | - | - |
| Real Estate Taxes | $482 | $0 |
Property Value by Mortgage Status in Parklawn
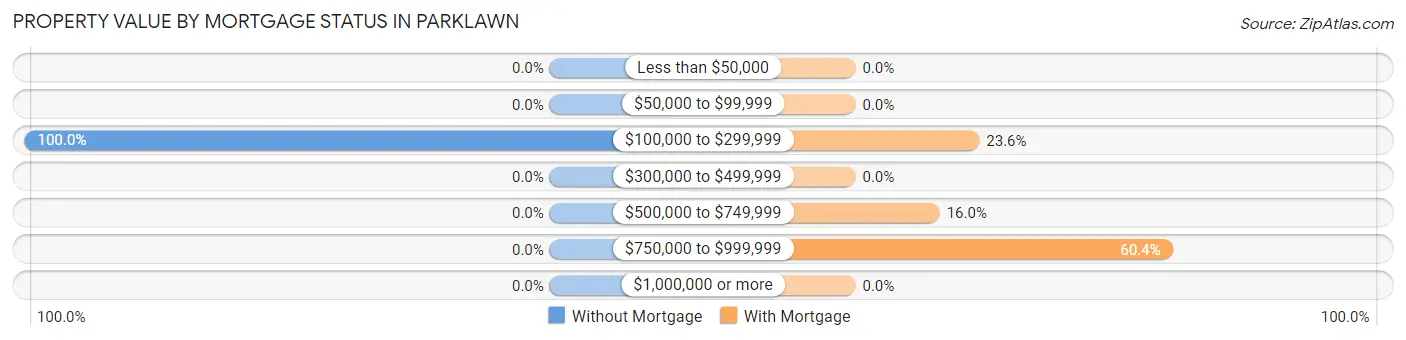
| Property Value | Without Mortgage | With Mortgage |
| Less than $50,000 | 0 (0.0%) | 0 (0.0%) |
| $50,000 to $99,999 | 0 (0.0%) | 0 (0.0%) |
| $100,000 to $299,999 | 26 (100.0%) | 25 (23.6%) |
| $300,000 to $499,999 | 0 (0.0%) | 0 (0.0%) |
| $500,000 to $749,999 | 0 (0.0%) | 17 (16.0%) |
| $750,000 to $999,999 | 0 (0.0%) | 64 (60.4%) |
| $1,000,000 or more | 0 (0.0%) | 0 (0.0%) |
| Total | 26 (100.0%) | 106 (100.0%) |
Household Income by Mortgage Status in Parklawn
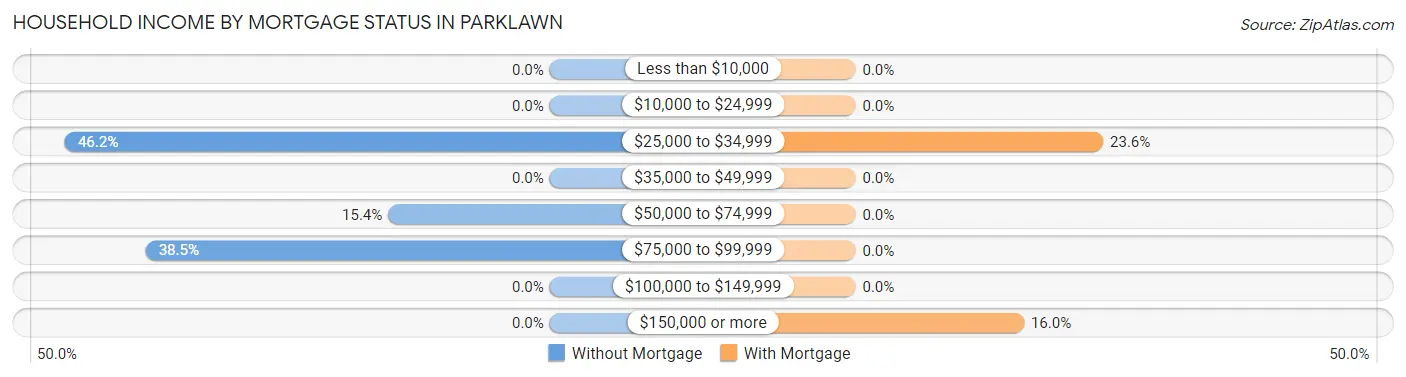
| Household Income | Without Mortgage | With Mortgage |
| Less than $10,000 | 0 (0.0%) | 0 (0.0%) |
| $10,000 to $24,999 | 0 (0.0%) | 0 (0.0%) |
| $25,000 to $34,999 | 12 (46.2%) | 25 (23.6%) |
| $35,000 to $49,999 | 0 (0.0%) | 0 (0.0%) |
| $50,000 to $74,999 | 4 (15.4%) | 0 (0.0%) |
| $75,000 to $99,999 | 10 (38.5%) | 0 (0.0%) |
| $100,000 to $149,999 | 0 (0.0%) | 0 (0.0%) |
| $150,000 or more | 0 (0.0%) | 17 (16.0%) |
| Total | 26 (100.0%) | 106 (100.0%) |
Property Value to Household Income Ratio in Parklawn
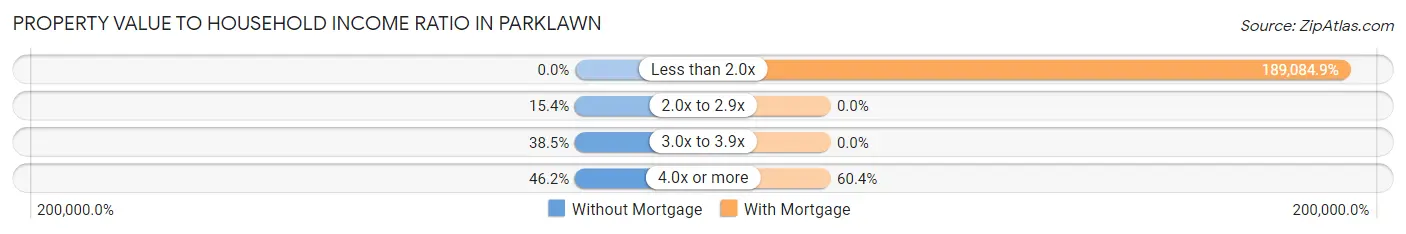
| Value-to-Income Ratio | Without Mortgage | With Mortgage |
| Less than 2.0x | 0 (0.0%) | 200,430 (189,084.9%) |
| 2.0x to 2.9x | 4 (15.4%) | 0 (0.0%) |
| 3.0x to 3.9x | 10 (38.5%) | 0 (0.0%) |
| 4.0x or more | 12 (46.2%) | 64 (60.4%) |
| Total | 26 (100.0%) | 106 (100.0%) |
Real Estate Taxes by Mortgage Status in Parklawn
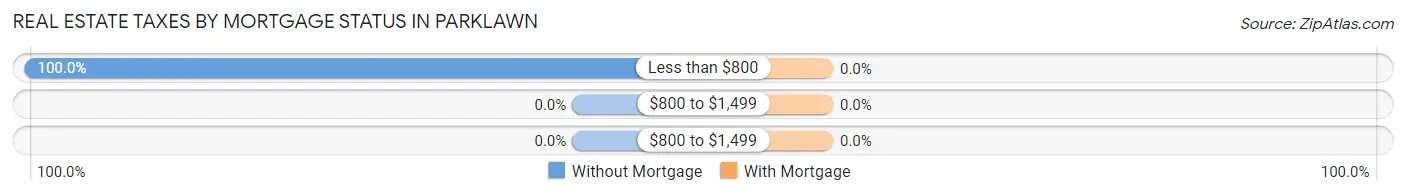
| Property Taxes | Without Mortgage | With Mortgage |
| Less than $800 | 26 (100.0%) | 0 (0.0%) |
| $800 to $1,499 | 0 (0.0%) | 0 (0.0%) |
| $800 to $1,499 | 0 (0.0%) | 0 (0.0%) |
| Total | 26 (100.0%) | 106 (100.0%) |
Health & Disability in Parklawn
Health Insurance Coverage by Age in Parklawn
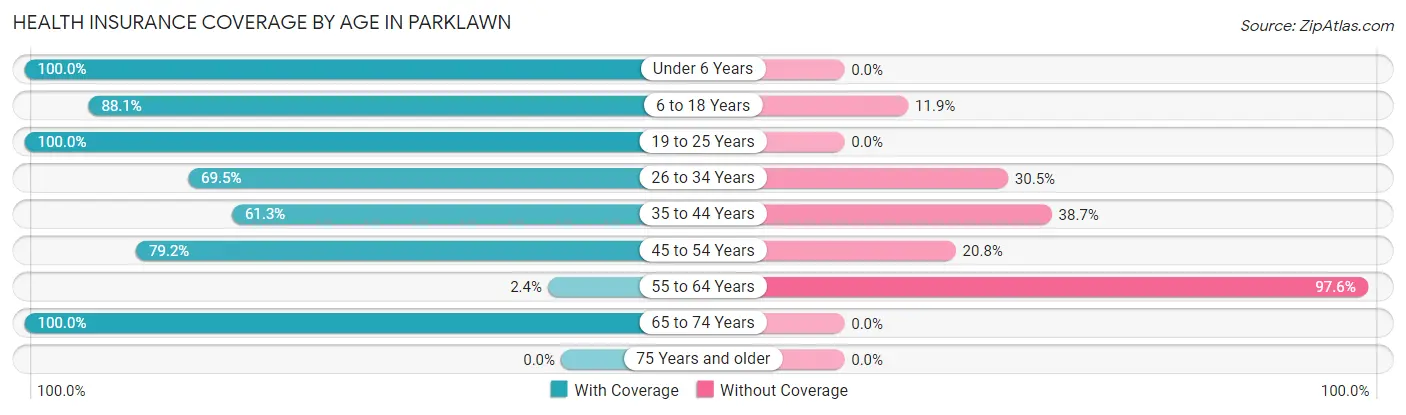
| Age Bracket | With Coverage | Without Coverage |
| Under 6 Years | 69 (100.0%) | 0 (0.0%) |
| 6 to 18 Years | 429 (88.1%) | 58 (11.9%) |
| 19 to 25 Years | 152 (100.0%) | 0 (0.0%) |
| 26 to 34 Years | 230 (69.5%) | 101 (30.5%) |
| 35 to 44 Years | 46 (61.3%) | 29 (38.7%) |
| 45 to 54 Years | 164 (79.2%) | 43 (20.8%) |
| 55 to 64 Years | 4 (2.4%) | 160 (97.6%) |
| 65 to 74 Years | 58 (100.0%) | 0 (0.0%) |
| 75 Years and older | 0 (0.0%) | 0 (0.0%) |
| Total | 1,152 (74.7%) | 391 (25.3%) |
Health Insurance Coverage by Citizenship Status in Parklawn
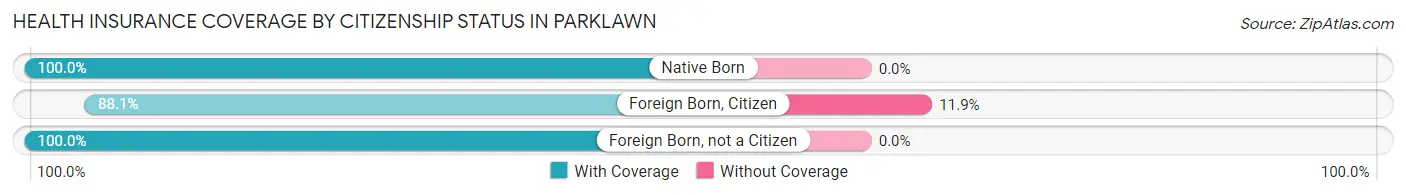
| Citizenship Status | With Coverage | Without Coverage |
| Native Born | 69 (100.0%) | 0 (0.0%) |
| Foreign Born, Citizen | 429 (88.1%) | 58 (11.9%) |
| Foreign Born, not a Citizen | 152 (100.0%) | 0 (0.0%) |
Health Insurance Coverage by Household Income in Parklawn
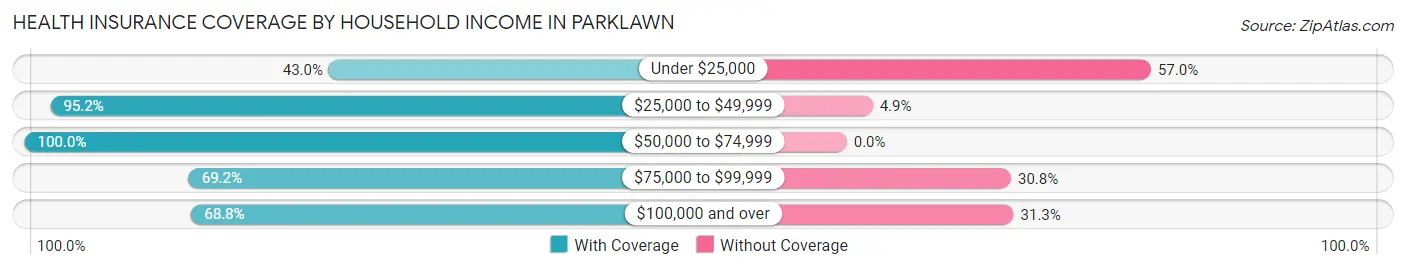
| Household Income | With Coverage | Without Coverage |
| Under $25,000 | 80 (43.0%) | 106 (57.0%) |
| $25,000 to $49,999 | 255 (95.2%) | 13 (4.9%) |
| $50,000 to $74,999 | 218 (100.0%) | 0 (0.0%) |
| $75,000 to $99,999 | 27 (69.2%) | 12 (30.8%) |
| $100,000 and over | 572 (68.8%) | 260 (31.2%) |
Public vs Private Health Insurance Coverage by Age in Parklawn
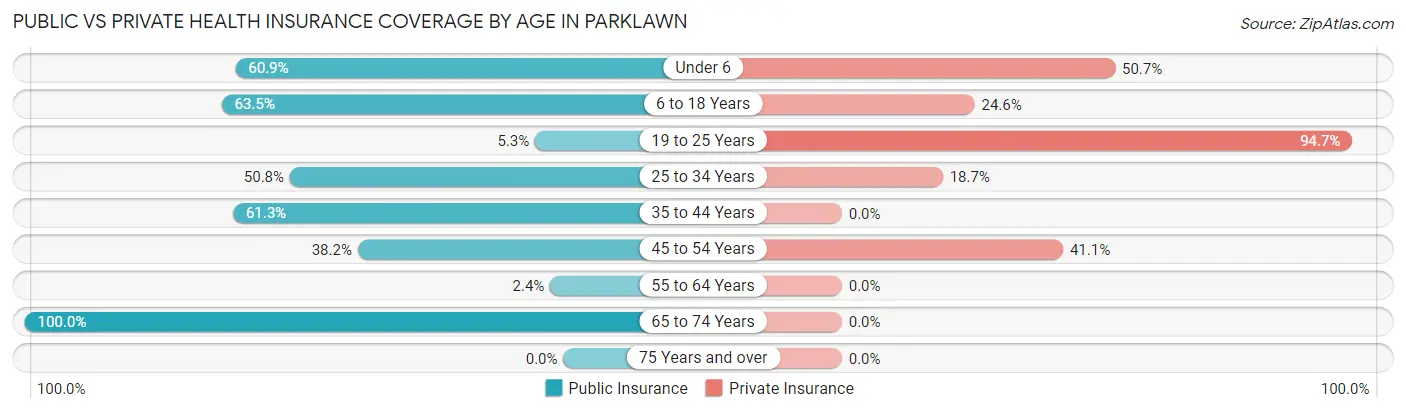
| Age Bracket | Public Insurance | Private Insurance |
| Under 6 | 42 (60.9%) | 35 (50.7%) |
| 6 to 18 Years | 309 (63.4%) | 120 (24.6%) |
| 19 to 25 Years | 8 (5.3%) | 144 (94.7%) |
| 25 to 34 Years | 168 (50.8%) | 62 (18.7%) |
| 35 to 44 Years | 46 (61.3%) | 0 (0.0%) |
| 45 to 54 Years | 79 (38.2%) | 85 (41.1%) |
| 55 to 64 Years | 4 (2.4%) | 0 (0.0%) |
| 65 to 74 Years | 58 (100.0%) | 0 (0.0%) |
| 75 Years and over | 0 (0.0%) | 0 (0.0%) |
| Total | 714 (46.3%) | 446 (28.9%) |
Disability Status by Sex by Age in Parklawn
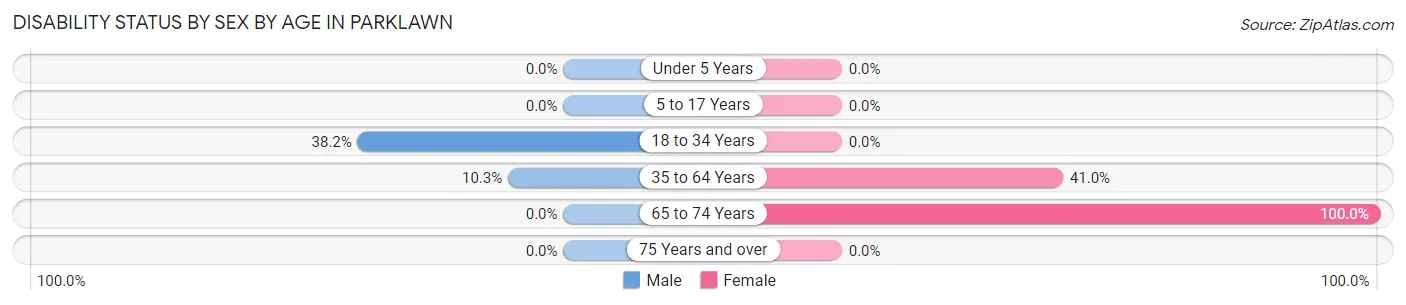
| Age Bracket | Male | Female |
| Under 5 Years | 0 (0.0%) | 0 (0.0%) |
| 5 to 17 Years | 0 (0.0%) | 0 (0.0%) |
| 18 to 34 Years | 97 (38.2%) | 0 (0.0%) |
| 35 to 64 Years | 24 (10.3%) | 87 (41.0%) |
| 65 to 74 Years | 0 (0.0%) | 31 (100.0%) |
| 75 Years and over | 0 (0.0%) | 0 (0.0%) |
Disability Class by Sex by Age in Parklawn
Disability Class: Hearing Difficulty
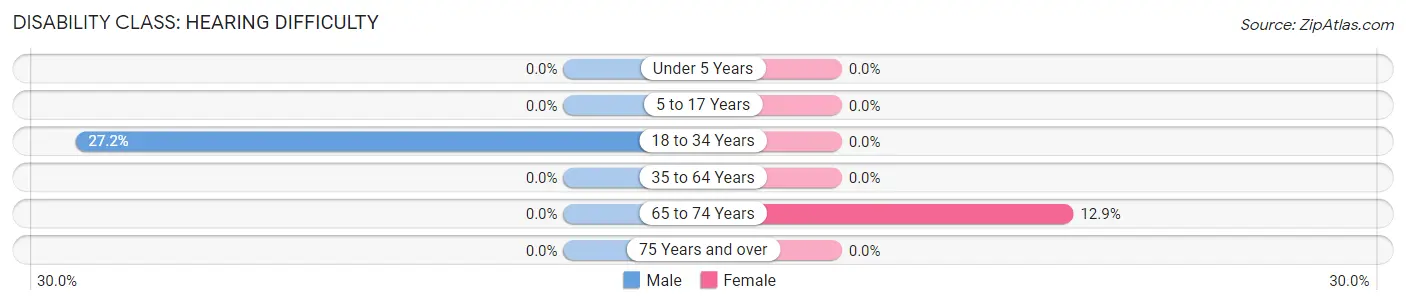
| Age Bracket | Male | Female |
| Under 5 Years | 0 (0.0%) | 0 (0.0%) |
| 5 to 17 Years | 0 (0.0%) | 0 (0.0%) |
| 18 to 34 Years | 69 (27.2%) | 0 (0.0%) |
| 35 to 64 Years | 0 (0.0%) | 0 (0.0%) |
| 65 to 74 Years | 0 (0.0%) | 4 (12.9%) |
| 75 Years and over | 0 (0.0%) | 0 (0.0%) |
Disability Class: Vision Difficulty
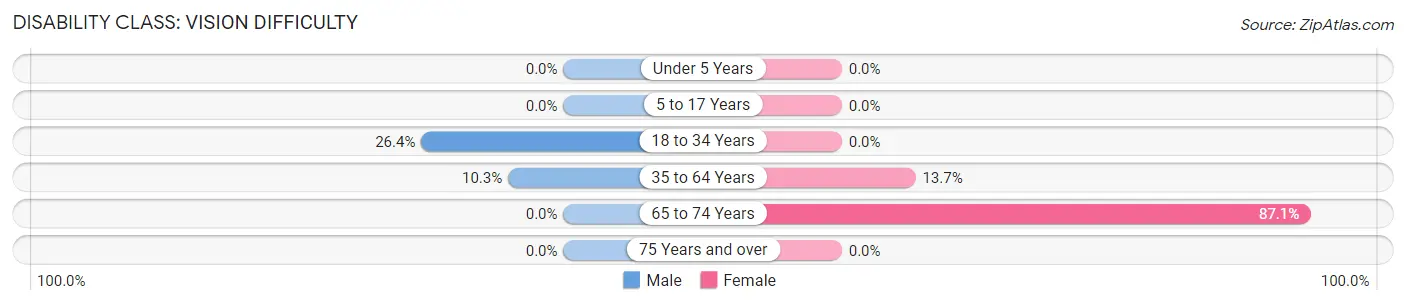
| Age Bracket | Male | Female |
| Under 5 Years | 0 (0.0%) | 0 (0.0%) |
| 5 to 17 Years | 0 (0.0%) | 0 (0.0%) |
| 18 to 34 Years | 67 (26.4%) | 0 (0.0%) |
| 35 to 64 Years | 24 (10.3%) | 29 (13.7%) |
| 65 to 74 Years | 0 (0.0%) | 27 (87.1%) |
| 75 Years and over | 0 (0.0%) | 0 (0.0%) |
Disability Class: Cognitive Difficulty
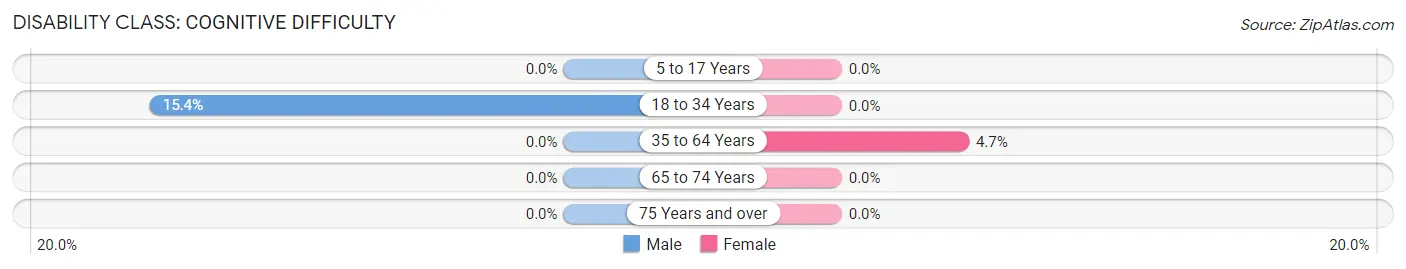
| Age Bracket | Male | Female |
| 5 to 17 Years | 0 (0.0%) | 0 (0.0%) |
| 18 to 34 Years | 39 (15.3%) | 0 (0.0%) |
| 35 to 64 Years | 0 (0.0%) | 10 (4.7%) |
| 65 to 74 Years | 0 (0.0%) | 0 (0.0%) |
| 75 Years and over | 0 (0.0%) | 0 (0.0%) |
Disability Class: Ambulatory Difficulty
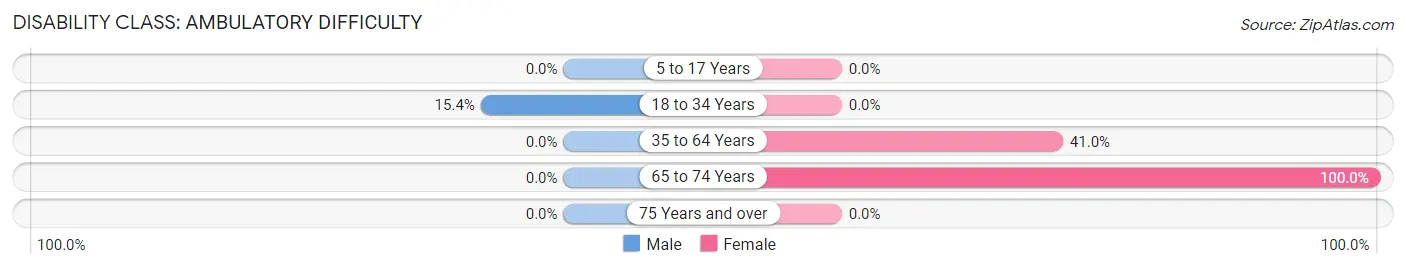
| Age Bracket | Male | Female |
| 5 to 17 Years | 0 (0.0%) | 0 (0.0%) |
| 18 to 34 Years | 39 (15.3%) | 0 (0.0%) |
| 35 to 64 Years | 0 (0.0%) | 87 (41.0%) |
| 65 to 74 Years | 0 (0.0%) | 31 (100.0%) |
| 75 Years and over | 0 (0.0%) | 0 (0.0%) |
Disability Class: Self-Care Difficulty
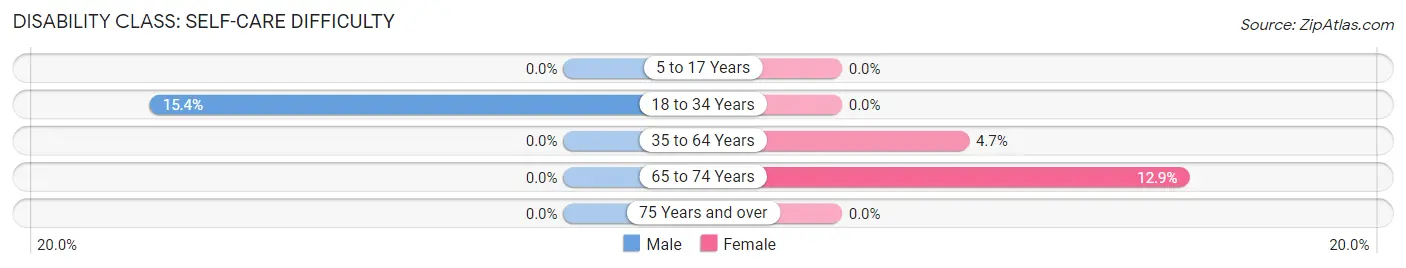
| Age Bracket | Male | Female |
| 5 to 17 Years | 0 (0.0%) | 0 (0.0%) |
| 18 to 34 Years | 39 (15.3%) | 0 (0.0%) |
| 35 to 64 Years | 0 (0.0%) | 10 (4.7%) |
| 65 to 74 Years | 0 (0.0%) | 4 (12.9%) |
| 75 Years and over | 0 (0.0%) | 0 (0.0%) |
Technology Access in Parklawn
Computing Device Access in Parklawn
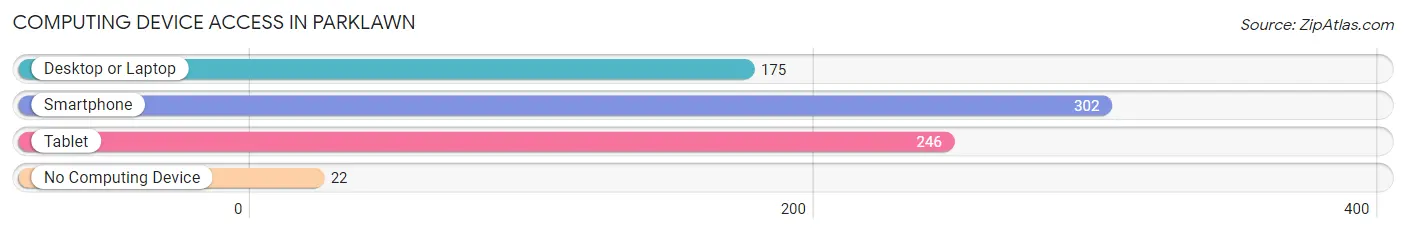
| Device Type | # Households | % Households |
| Desktop or Laptop | 175 | 53.3% |
| Smartphone | 302 | 92.1% |
| Tablet | 246 | 75.0% |
| No Computing Device | 22 | 6.7% |
| Total | 328 | 100.0% |
Internet Access in Parklawn
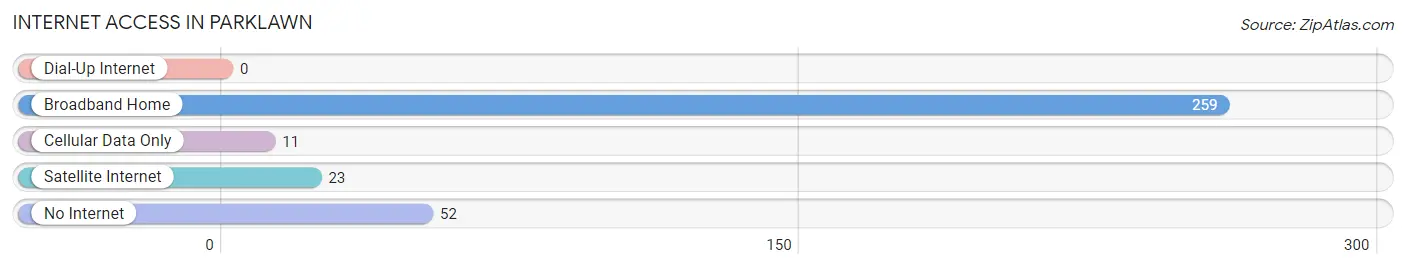
| Internet Type | # Households | % Households |
| Dial-Up Internet | 0 | 0.0% |
| Broadband Home | 259 | 79.0% |
| Cellular Data Only | 11 | 3.4% |
| Satellite Internet | 23 | 7.0% |
| No Internet | 52 | 15.9% |
| Total | 328 | 100.0% |
Parklawn Summary
Parklawn is a small unincorporated community located in the San Bernardino County of California. It is situated in the foothills of the San Bernardino Mountains, approximately 10 miles east of the city of San Bernardino. Parklawn is a rural community with a population of approximately 1,000 people.
History
Parklawn was founded in the late 1800s by a group of settlers who were looking for a place to settle and raise their families. The area was originally known as “Parklawn” because of the large park that was located in the center of the community. The park was used for picnics, barbecues, and other social gatherings.
In the early 1900s, the area began to grow and develop. The first school was built in Parklawn in 1906 and the first post office was established in 1908. The community continued to grow and by the 1950s, it had become a thriving rural community.
Geography
Parklawn is located in the foothills of the San Bernardino Mountains, approximately 10 miles east of the city of San Bernardino. The area is characterized by rolling hills and valleys, with an elevation of approximately 3,000 feet. The climate is semi-arid, with hot summers and mild winters.
Economy
The economy of Parklawn is largely based on agriculture. The area is home to several farms and ranches, which produce a variety of crops, including citrus, avocados, and olives. The area also has a thriving tourism industry, with many visitors coming to enjoy the scenic beauty of the area.
Demographics
As of the 2010 census, the population of Parklawn was 1,000 people. The racial makeup of the community was 79.2% White, 0.7% African American, 0.3% Native American, 0.3% Asian, 0.1% Pacific Islander, and 19.4% from other races. The median household income was $45,000, and the median age was 37 years.
Conclusion
Parklawn is a small unincorporated community located in the San Bernardino County of California. It is situated in the foothills of the San Bernardino Mountains, approximately 10 miles east of the city of San Bernardino. Parklawn is a rural community with a population of approximately 1,000 people. The economy of Parklawn is largely based on agriculture, with many farms and ranches producing a variety of crops. The area also has a thriving tourism industry, with many visitors coming to enjoy the scenic beauty of the area. The racial makeup of the community is 79.2% White, 0.7% African American, 0.3% Native American, 0.3% Asian, 0.1% Pacific Islander, and 19.4% from other races. The median household income was $45,000, and the median age was 37 years.
Common Questions
What is Per Capita Income in Parklawn?
Per Capita income in Parklawn is $18,523.
What is the Median Household income in Parklawn?
Median Household Income in Parklawn is $68,704.
What is Income or Wage Gap in Parklawn?
Income or Wage Gap in Parklawn is 13.0%.
Women in Parklawn earn 87.0 cents for every dollar earned by a man.
What is Inequality or Gini Index in Parklawn?
Inequality or Gini Index in Parklawn is 0.42.
What is the Total Population of Parklawn?
Total Population of Parklawn is 1,543.
What is the Total Male Population of Parklawn?
Total Male Population of Parklawn is 723.
What is the Total Female Population of Parklawn?
Total Female Population of Parklawn is 820.
What is the Ratio of Males per 100 Females in Parklawn?
There are 88.17 Males per 100 Females in Parklawn.
What is the Ratio of Females per 100 Males in Parklawn?
There are 113.42 Females per 100 Males in Parklawn.
What is the Median Population Age in Parklawn?
Median Population Age in Parklawn is 26.9 Years.
What is the Average Family Size in Parklawn
Average Family Size in Parklawn is 5.1 People.
What is the Average Household Size in Parklawn
Average Household Size in Parklawn is 4.7 People.
How Large is the Labor Force in Parklawn?
There are 652 People in the Labor Forcein in Parklawn.
What is the Percentage of People in the Labor Force in Parklawn?
62.6% of People are in the Labor Force in Parklawn.
What is the Unemployment Rate in Parklawn?
Unemployment Rate in Parklawn is 3.7%.