Cities with the Highest Percentage of Population Employed in Health Diagnosing & Treating in Mississippi
RELATED REPORTS & OPTIONS
Health Diagnosing & Treating
Mississippi
Compare Cities
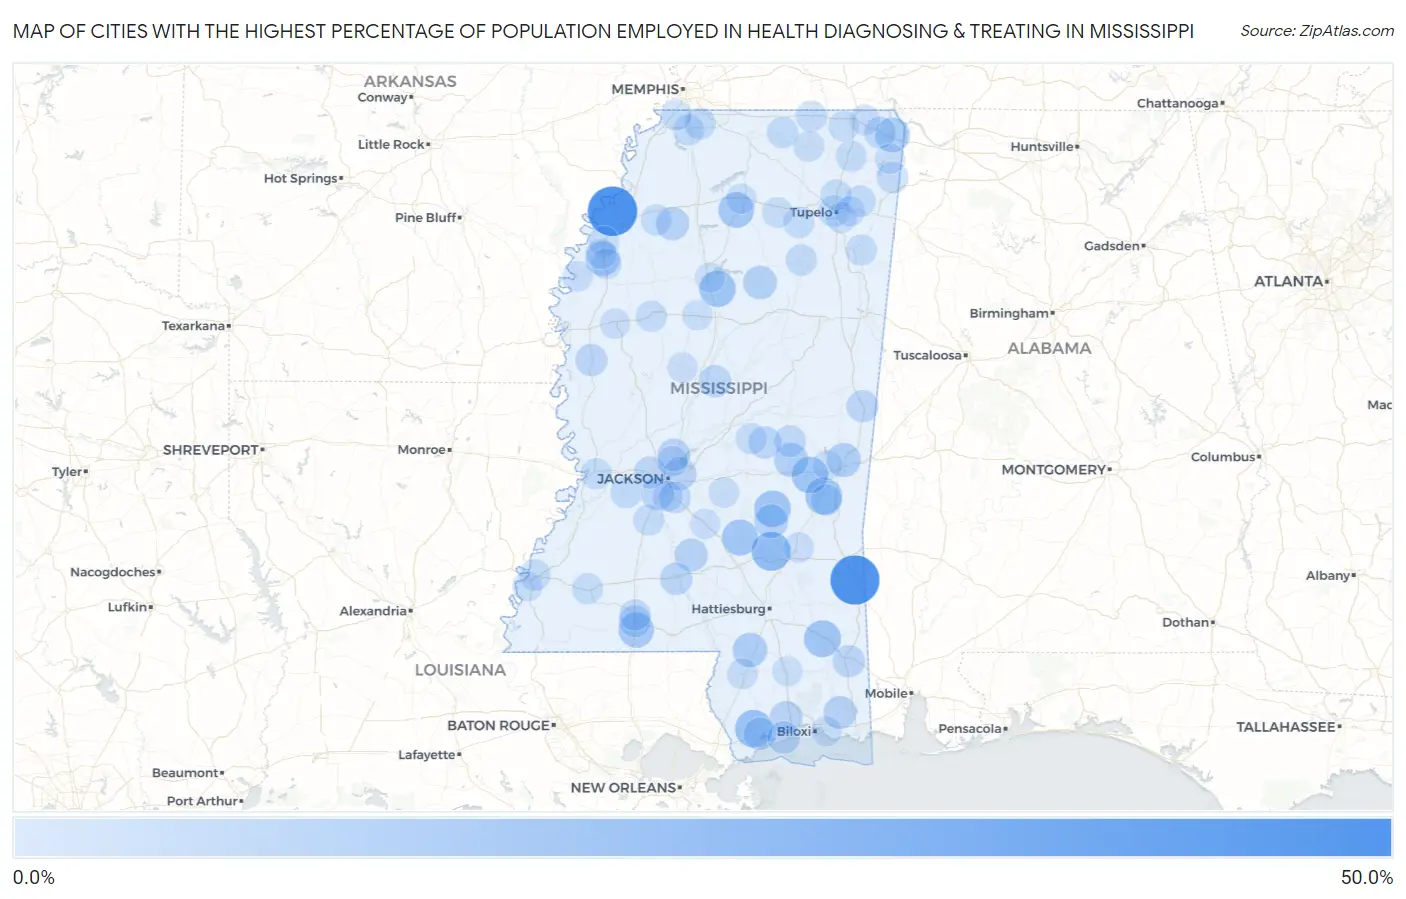
Map of Cities with the Highest Percentage of Population Employed in Health Diagnosing & Treating in Mississippi
0.0%
50.0%
Cities with the Highest Percentage of Population Employed in Health Diagnosing & Treating in Mississippi
| City | % Employed | vs State | vs National | |
| 1. | Farrell | 44.5% | 7.8%(+36.7)#1 | 6.2%(+38.3)#107 |
| 2. | Buckatunna | 43.8% | 7.8%(+35.9)#2 | 6.2%(+37.5)#113 |
| 3. | Bovina | 41.1% | 7.8%(+33.3)#3 | 6.2%(+34.9)#137 |
| 4. | Bobo | 34.4% | 7.8%(+26.5)#4 | 6.2%(+28.1)#212 |
| 5. | Oak Grove | 31.2% | 7.8%(+23.4)#5 | 6.2%(+24.9)#289 |
| 6. | Soso | 24.8% | 7.8%(+16.9)#6 | 6.2%(+18.5)#454 |
| 7. | Independence | 24.5% | 7.8%(+16.6)#7 | 6.2%(+18.2)#469 |
| 8. | Kiln | 21.8% | 7.8%(+14.0)#8 | 6.2%(+15.6)#613 |
| 9. | Mclain | 20.7% | 7.8%(+12.9)#9 | 6.2%(+14.5)#689 |
| 10. | Enterprise | 20.5% | 7.8%(+12.7)#10 | 6.2%(+14.3)#702 |
| 11. | Chunky | 20.2% | 7.8%(+12.3)#11 | 6.2%(+13.9)#725 |
| 12. | Louin | 20.0% | 7.8%(+12.2)#12 | 6.2%(+13.8)#740 |
| 13. | Elliott | 19.8% | 7.8%(+12.0)#13 | 6.2%(+13.5)#767 |
| 14. | Mize | 19.4% | 7.8%(+11.6)#14 | 6.2%(+13.2)#799 |
| 15. | Glen Allan | 18.6% | 7.8%(+10.8)#15 | 6.2%(+12.4)#883 |
| 16. | Taylor | 18.5% | 7.8%(+10.7)#16 | 6.2%(+12.3)#891 |
| 17. | Gluckstadt | 18.5% | 7.8%(+10.6)#17 | 6.2%(+12.2)#898 |
| 18. | Magnolia | 18.1% | 7.8%(+10.2)#18 | 6.2%(+11.8)#950 |
| 19. | Iuka | 16.8% | 7.8%(+8.98)#19 | 6.2%(+10.6)#1,119 |
| 20. | Benton | 16.8% | 7.8%(+8.94)#20 | 6.2%(+10.5)#1,127 |
| 21. | Agricola | 16.7% | 7.8%(+8.92)#21 | 6.2%(+10.5)#1,132 |
| 22. | Winstonville | 16.7% | 7.8%(+8.83)#22 | 6.2%(+10.4)#1,154 |
| 23. | Lumberton | 16.4% | 7.8%(+8.56)#23 | 6.2%(+10.1)#1,202 |
| 24. | Marion | 15.8% | 7.8%(+7.92)#24 | 6.2%(+9.51)#1,339 |
| 25. | Decatur | 15.6% | 7.8%(+7.74)#25 | 6.2%(+9.33)#1,376 |
| 26. | Bay Springs | 15.2% | 7.8%(+7.35)#26 | 6.2%(+8.94)#1,466 |
| 27. | Slate Springs | 15.0% | 7.8%(+7.17)#27 | 6.2%(+8.76)#1,512 |
| 28. | Crowder | 14.3% | 7.8%(+6.45)#28 | 6.2%(+8.04)#1,700 |
| 29. | Vancleave | 14.0% | 7.8%(+6.14)#29 | 6.2%(+7.73)#1,814 |
| 30. | New Hebron | 13.8% | 7.8%(+5.98)#30 | 6.2%(+7.57)#1,860 |
| 31. | Flowood | 13.7% | 7.8%(+5.88)#31 | 6.2%(+7.47)#1,905 |
| 32. | Lyman | 13.6% | 7.8%(+5.75)#32 | 6.2%(+7.34)#1,947 |
| 33. | Byram | 13.4% | 7.8%(+5.53)#33 | 6.2%(+7.11)#2,036 |
| 34. | Madison | 13.3% | 7.8%(+5.47)#34 | 6.2%(+7.06)#2,062 |
| 35. | Diamondhead | 13.0% | 7.8%(+5.17)#35 | 6.2%(+6.76)#2,188 |
| 36. | Sebastopol | 12.9% | 7.8%(+5.07)#36 | 6.2%(+6.66)#2,237 |
| 37. | Monticello | 12.9% | 7.8%(+5.04)#37 | 6.2%(+6.63)#2,252 |
| 38. | Long Beach | 12.8% | 7.8%(+4.97)#38 | 6.2%(+6.56)#2,287 |
| 39. | Sallis | 12.6% | 7.8%(+4.80)#39 | 6.2%(+6.39)#2,363 |
| 40. | Scooba | 12.5% | 7.8%(+4.67)#40 | 6.2%(+6.26)#2,418 |
| 41. | Hollandale | 12.5% | 7.8%(+4.65)#41 | 6.2%(+6.24)#2,453 |
| 42. | Lucedale | 12.4% | 7.8%(+4.56)#42 | 6.2%(+6.15)#2,485 |
| 43. | Clinton | 12.3% | 7.8%(+4.51)#43 | 6.2%(+6.09)#2,509 |
| 44. | Mccomb | 12.0% | 7.8%(+4.16)#44 | 6.2%(+5.75)#2,677 |
| 45. | Union | 11.7% | 7.8%(+3.88)#45 | 6.2%(+5.47)#2,832 |
| 46. | Burnsville | 11.7% | 7.8%(+3.84)#46 | 6.2%(+5.43)#2,851 |
| 47. | Biggersville | 11.7% | 7.8%(+3.83)#47 | 6.2%(+5.42)#2,860 |
| 48. | Florence | 11.5% | 7.8%(+3.68)#48 | 6.2%(+5.27)#2,978 |
| 49. | Arkabutla | 11.3% | 7.8%(+3.50)#49 | 6.2%(+5.09)#3,102 |
| 50. | Lakeview | 11.3% | 7.8%(+3.46)#50 | 6.2%(+5.05)#3,125 |
| 51. | Tupelo | 11.3% | 7.8%(+3.44)#51 | 6.2%(+5.03)#3,135 |
| 52. | Belmont | 11.1% | 7.8%(+3.32)#52 | 6.2%(+4.90)#3,224 |
| 53. | Learned | 11.1% | 7.8%(+3.28)#53 | 6.2%(+4.87)#3,265 |
| 54. | Ashland | 11.1% | 7.8%(+3.23)#54 | 6.2%(+4.82)#3,296 |
| 55. | Bridgetown | 11.0% | 7.8%(+3.18)#55 | 6.2%(+4.77)#3,322 |
| 56. | Morgantown | 10.9% | 7.8%(+3.05)#56 | 6.2%(+4.64)#3,398 |
| 57. | Houston | 10.9% | 7.8%(+3.02)#57 | 6.2%(+4.61)#3,421 |
| 58. | Stonewall | 10.8% | 7.8%(+3.00)#58 | 6.2%(+4.59)#3,445 |
| 59. | Summit | 10.8% | 7.8%(+2.97)#59 | 6.2%(+4.56)#3,471 |
| 60. | Mantachie | 10.8% | 7.8%(+2.95)#60 | 6.2%(+4.54)#3,486 |
| 61. | Itta Bena | 10.7% | 7.8%(+2.83)#61 | 6.2%(+4.42)#3,581 |
| 62. | Lambert | 10.6% | 7.8%(+2.81)#62 | 6.2%(+4.39)#3,601 |
| 63. | Booneville | 10.6% | 7.8%(+2.79)#63 | 6.2%(+4.38)#3,615 |
| 64. | Algoma | 10.6% | 7.8%(+2.72)#64 | 6.2%(+4.31)#3,682 |
| 65. | Saltillo | 10.6% | 7.8%(+2.72)#65 | 6.2%(+4.31)#3,686 |
| 66. | Hernando | 10.5% | 7.8%(+2.67)#66 | 6.2%(+4.26)#3,738 |
| 67. | Walnut Grove | 10.5% | 7.8%(+2.66)#67 | 6.2%(+4.25)#3,744 |
| 68. | Amory | 10.4% | 7.8%(+2.56)#68 | 6.2%(+4.15)#3,828 |
| 69. | Lynchburg | 10.4% | 7.8%(+2.55)#69 | 6.2%(+4.13)#3,839 |
| 70. | Meadville | 10.3% | 7.8%(+2.49)#70 | 6.2%(+4.08)#3,887 |
| 71. | Crystal Springs | 10.3% | 7.8%(+2.48)#71 | 6.2%(+4.07)#3,902 |
| 72. | Beechwood | 10.3% | 7.8%(+2.48)#72 | 6.2%(+4.07)#3,904 |
| 73. | Walnut | 10.2% | 7.8%(+2.39)#73 | 6.2%(+3.98)#3,986 |
| 74. | Duncan | 10.1% | 7.8%(+2.24)#74 | 6.2%(+3.83)#4,124 |
| 75. | Mound Bayou | 10.1% | 7.8%(+2.24)#75 | 6.2%(+3.83)#4,126 |
| 76. | Farmington | 10.0% | 7.8%(+2.16)#76 | 6.2%(+3.74)#4,234 |
| 77. | Plantersville | 10.0% | 7.8%(+2.14)#77 | 6.2%(+3.73)#4,249 |
| 78. | Toccopola | 9.9% | 7.8%(+2.10)#78 | 6.2%(+3.68)#4,282 |
| 79. | Ripley | 9.8% | 7.8%(+1.98)#79 | 6.2%(+3.57)#4,419 |
| 80. | Poplarville | 9.8% | 7.8%(+1.93)#80 | 6.2%(+3.51)#4,480 |
| 81. | Bogue Chitto Cdp Kemper And Neshoba Counties | 9.7% | 7.8%(+1.90)#81 | 6.2%(+3.49)#4,504 |
| 82. | Kossuth | 9.7% | 7.8%(+1.84)#82 | 6.2%(+3.43)#4,567 |
| 83. | Polkville | 9.6% | 7.8%(+1.78)#83 | 6.2%(+3.37)#4,627 |
| 84. | Ridgeland | 9.6% | 7.8%(+1.78)#84 | 6.2%(+3.36)#4,641 |
| 85. | Cleary | 9.6% | 7.8%(+1.75)#85 | 6.2%(+3.34)#4,673 |
| 86. | Beulah | 9.4% | 7.8%(+1.60)#86 | 6.2%(+3.19)#4,842 |
| 87. | Carrollton | 9.4% | 7.8%(+1.54)#87 | 6.2%(+3.13)#4,922 |
| 88. | Lexington | 9.3% | 7.8%(+1.49)#88 | 6.2%(+3.08)#5,005 |
| 89. | Sandersville | 9.2% | 7.8%(+1.36)#89 | 6.2%(+2.95)#5,138 |
| 90. | Indianola | 9.2% | 7.8%(+1.35)#90 | 6.2%(+2.94)#5,155 |
| 91. | Mooreville | 9.1% | 7.8%(+1.30)#91 | 6.2%(+2.89)#5,222 |
| 92. | Shelby | 9.1% | 7.8%(+1.29)#92 | 6.2%(+2.87)#5,238 |
| 93. | Mendenhall | 9.1% | 7.8%(+1.27)#93 | 6.2%(+2.86)#5,263 |
| 94. | Wiggins | 9.1% | 7.8%(+1.24)#94 | 6.2%(+2.83)#5,325 |
| 95. | Oxford | 9.0% | 7.8%(+1.20)#95 | 6.2%(+2.79)#5,368 |
| 96. | Tishomingo | 9.0% | 7.8%(+1.18)#96 | 6.2%(+2.76)#5,412 |
| 97. | Ocean Springs | 9.0% | 7.8%(+1.16)#97 | 6.2%(+2.75)#5,435 |
| 98. | Cloverdale | 9.0% | 7.8%(+1.16)#98 | 6.2%(+2.74)#5,444 |
| 99. | Nellieburg | 8.7% | 7.8%(+0.917)#99 | 6.2%(+2.51)#5,774 |
| 100. | Grenada | 8.7% | 7.8%(+0.829)#100 | 6.2%(+2.42)#5,911 |
Common Questions
What are the Top 10 Cities with the Highest Percentage of Population Employed in Health Diagnosing & Treating in Mississippi?
Top 10 Cities with the Highest Percentage of Population Employed in Health Diagnosing & Treating in Mississippi are:
#1
44.5%
#2
43.8%
#3
24.8%
#4
21.8%
#5
20.7%
#6
20.5%
#7
20.2%
#8
20.0%
#9
19.8%
#10
19.4%
What city has the Highest Percentage of Population Employed in Health Diagnosing & Treating in Mississippi?
Farrell has the Highest Percentage of Population Employed in Health Diagnosing & Treating in Mississippi with 44.5%.
What is the Percentage of Population Employed in Health Diagnosing & Treating in the State of Mississippi?
Percentage of Population Employed in Health Diagnosing & Treating in Mississippi is 7.8%.
What is the Percentage of Population Employed in Health Diagnosing & Treating in the United States?
Percentage of Population Employed in Health Diagnosing & Treating in the United States is 6.2%.