Diablo Grande, CA Map & Demographics
Diablo Grande Map
Diablo Grande Overview
$46,777
PER CAPITA INCOME
$115,625
AVG FAMILY INCOME
$109,875
AVG HOUSEHOLD INCOME
0.34
INEQUALITY / GINI INDEX
1,257
TOTAL POPULATION
565
MALE POPULATION
692
FEMALE POPULATION
81.65
MALES / 100 FEMALES
122.48
FEMALES / 100 MALES
48.0
MEDIAN AGE
2.9
AVG FAMILY SIZE
2.7
AVG HOUSEHOLD SIZE
504
LABOR FORCE [ PEOPLE ]
47.5%
PERCENT IN LABOR FORCE
5.6%
UNEMPLOYMENT RATE
Diablo Grande Area Codes
Income in Diablo Grande
Income Overview in Diablo Grande
Per Capita Income in Diablo Grande is $46,777, while median incomes of families and households are $115,625 and $109,875 respectively.
| Characteristic | Number | Measure |
| Per Capita Income | 1,257 | $46,777 |
| Median Family Income | 412 | $115,625 |
| Mean Family Income | 412 | $134,291 |
| Median Household Income | 462 | $109,875 |
| Mean Household Income | 462 | $126,267 |
| Income Deficit | 412 | $0 |
| Wage / Income Gap (%) | 1,257 | 0.00% |
| Wage / Income Gap ($) | 1,257 | 100.00¢ per $1 |
| Gini / Inequality Index | 1,257 | 0.34 |
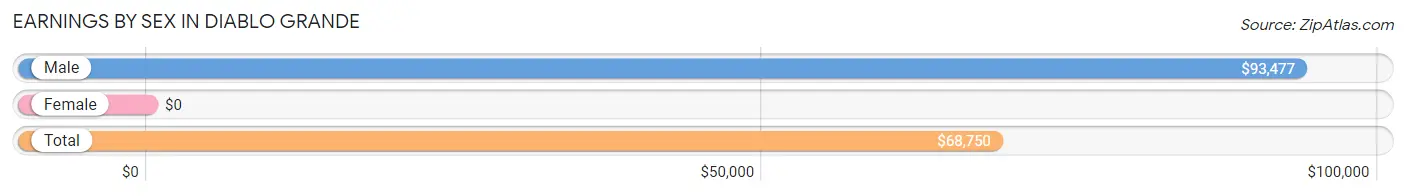
Earnings by Sex in Diablo Grande
| Sex | Number | Average Earnings |
| Male | 315 (55.1%) | $93,477 |
| Female | 257 (44.9%) | $0 |
| Total | 572 (100.0%) | $68,750 |
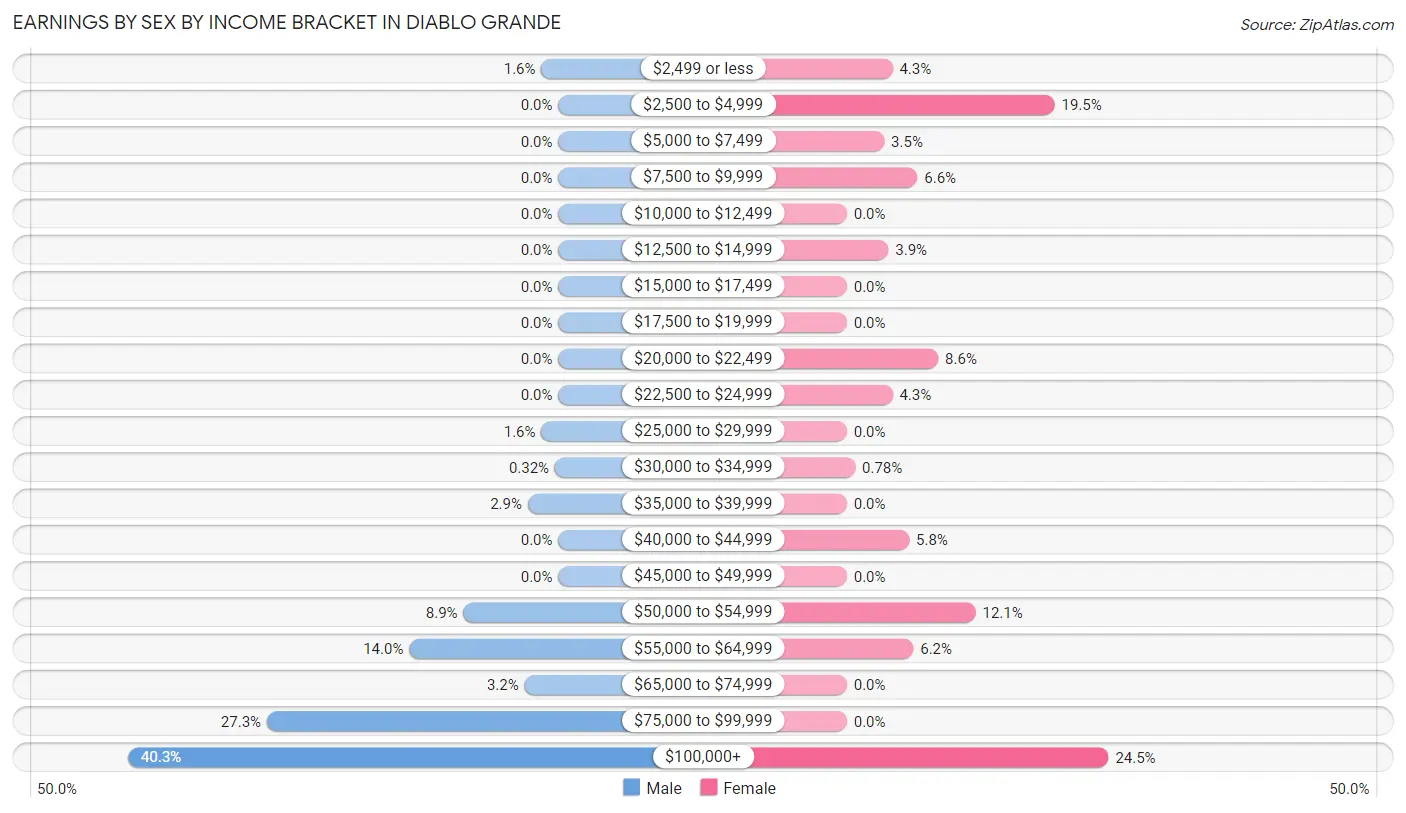
Earnings by Sex by Income Bracket in Diablo Grande
The most common earnings brackets in Diablo Grande are $100,000+ for men (127 | 40.3%) and $100,000+ for women (63 | 24.5%).
| Income | Male | Female |
| $2,499 or less | 5 (1.6%) | 11 (4.3%) |
| $2,500 to $4,999 | 0 (0.0%) | 50 (19.5%) |
| $5,000 to $7,499 | 0 (0.0%) | 9 (3.5%) |
| $7,500 to $9,999 | 0 (0.0%) | 17 (6.6%) |
| $10,000 to $12,499 | 0 (0.0%) | 0 (0.0%) |
| $12,500 to $14,999 | 0 (0.0%) | 10 (3.9%) |
| $15,000 to $17,499 | 0 (0.0%) | 0 (0.0%) |
| $17,500 to $19,999 | 0 (0.0%) | 0 (0.0%) |
| $20,000 to $22,499 | 0 (0.0%) | 22 (8.6%) |
| $22,500 to $24,999 | 0 (0.0%) | 11 (4.3%) |
| $25,000 to $29,999 | 5 (1.6%) | 0 (0.0%) |
| $30,000 to $34,999 | 1 (0.3%) | 2 (0.8%) |
| $35,000 to $39,999 | 9 (2.9%) | 0 (0.0%) |
| $40,000 to $44,999 | 0 (0.0%) | 15 (5.8%) |
| $45,000 to $49,999 | 0 (0.0%) | 0 (0.0%) |
| $50,000 to $54,999 | 28 (8.9%) | 31 (12.1%) |
| $55,000 to $64,999 | 44 (14.0%) | 16 (6.2%) |
| $65,000 to $74,999 | 10 (3.2%) | 0 (0.0%) |
| $75,000 to $99,999 | 86 (27.3%) | 0 (0.0%) |
| $100,000+ | 127 (40.3%) | 63 (24.5%) |
| Total | 315 (100.0%) | 257 (100.0%) |
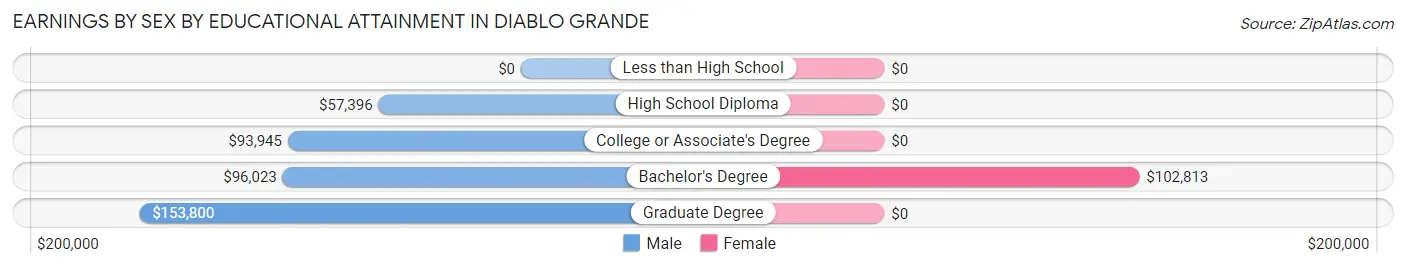
Earnings by Sex by Educational Attainment in Diablo Grande
Average earnings in Diablo Grande are $93,477 for men and $52,016 for women, a difference of 44.4%. Men with an educational attainment of graduate degree enjoy the highest average annual earnings of $153,800, while those with high school diploma education earn the least with $57,396. Women with an educational attainment of bachelor's degree earn the most with the average annual earnings of $102,813, while those with bachelor's degree education have the smallest earnings of $102,813.
| Educational Attainment | Male Income | Female Income |
| Less than High School | - | - |
| High School Diploma | $57,396 | $0 |
| College or Associate's Degree | $93,945 | $0 |
| Bachelor's Degree | $96,023 | $102,813 |
| Graduate Degree | $153,800 | $0 |
| Total | $93,477 | $52,016 |
Family Income in Diablo Grande
Family Income Brackets in Diablo Grande
According to the Diablo Grande family income data, there are 102 families falling into the $200,000+ income range, which is the most common income bracket and makes up 24.8% of all families.
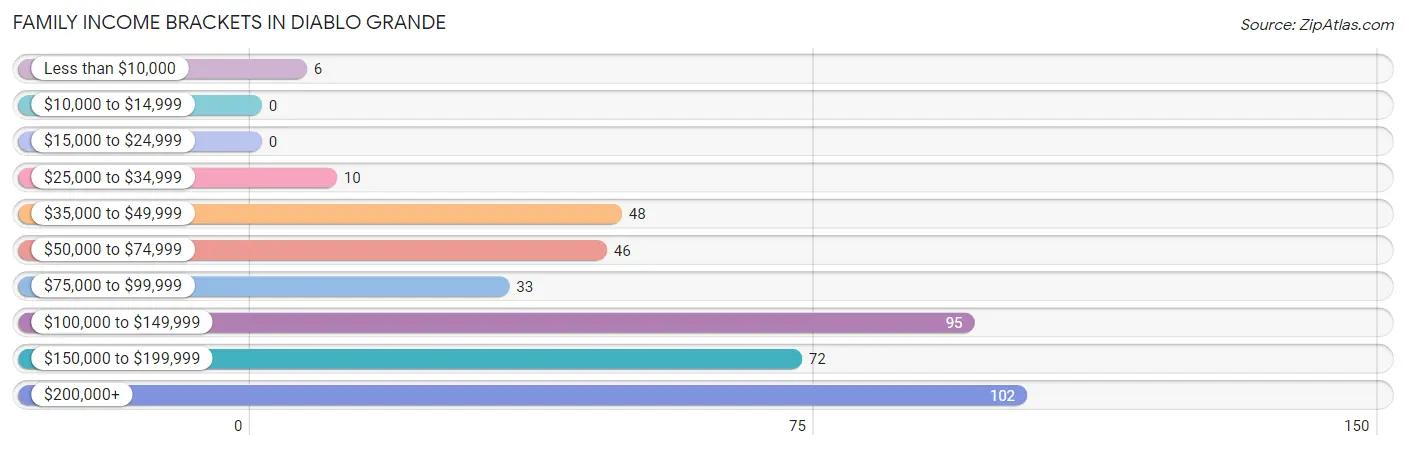
| Income Bracket | # Families | % Families |
| Less than $10,000 | 6 | 1.5% |
| $10,000 to $14,999 | 0 | 0.0% |
| $15,000 to $24,999 | 0 | 0.0% |
| $25,000 to $34,999 | 10 | 2.4% |
| $35,000 to $49,999 | 48 | 11.7% |
| $50,000 to $74,999 | 46 | 11.2% |
| $75,000 to $99,999 | 33 | 8.0% |
| $100,000 to $149,999 | 95 | 23.1% |
| $150,000 to $199,999 | 72 | 17.5% |
| $200,000+ | 102 | 24.8% |
Family Income by Famaliy Size in Diablo Grande
4-person families (22 | 5.3%) account for the highest median family income in Diablo Grande with $198,750 per family, while 2-person families (247 | 60.0%) have the highest median income of $53,238 per family member.
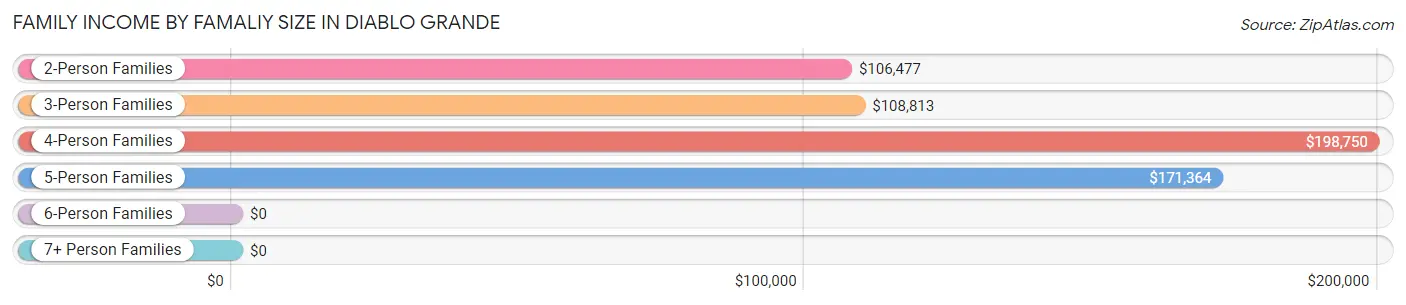
| Income Bracket | # Families | Median Income |
| 2-Person Families | 247 (60.0%) | $106,477 |
| 3-Person Families | 81 (19.7%) | $108,813 |
| 4-Person Families | 22 (5.3%) | $198,750 |
| 5-Person Families | 36 (8.7%) | $171,364 |
| 6-Person Families | 0 (0.0%) | $0 |
| 7+ Person Families | 26 (6.3%) | $0 |
| Total | 412 (100.0%) | $115,625 |
Family Income by Number of Earners in Diablo Grande
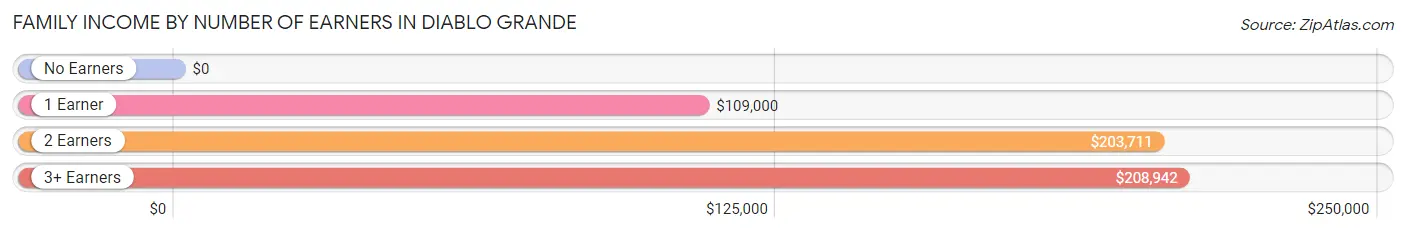
| Number of Earners | # Families | Median Income |
| No Earners | 114 (27.7%) | $0 |
| 1 Earner | 140 (34.0%) | $109,000 |
| 2 Earners | 115 (27.9%) | $203,711 |
| 3+ Earners | 43 (10.4%) | $208,942 |
| Total | 412 (100.0%) | $115,625 |
Household Income in Diablo Grande
Household Income Brackets in Diablo Grande
With 105 households falling in the category, the $100,000 to $149,999 income range is the most frequent in Diablo Grande, accounting for 22.7% of all households.
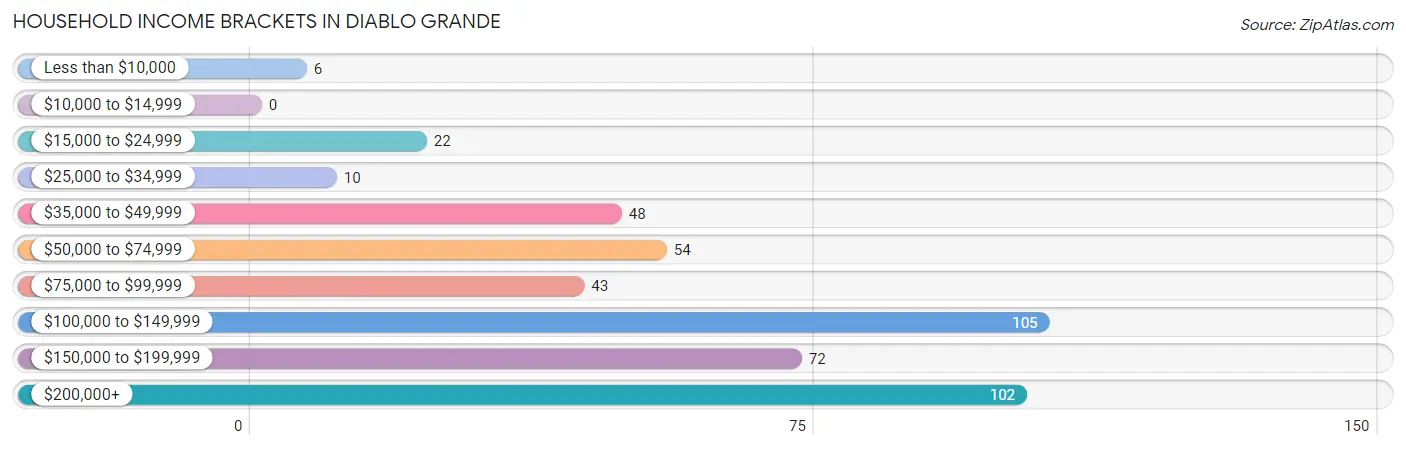
| Income Bracket | # Households | % Households |
| Less than $10,000 | 6 | 1.3% |
| $10,000 to $14,999 | 0 | 0.0% |
| $15,000 to $24,999 | 22 | 4.8% |
| $25,000 to $34,999 | 10 | 2.2% |
| $35,000 to $49,999 | 48 | 10.4% |
| $50,000 to $74,999 | 54 | 11.7% |
| $75,000 to $99,999 | 43 | 9.3% |
| $100,000 to $149,999 | 105 | 22.7% |
| $150,000 to $199,999 | 72 | 15.6% |
| $200,000+ | 102 | 22.1% |
Household Income by Householder Age in Diablo Grande
The median household income in Diablo Grande is $109,875, with the highest median household income of $198,000 found in the 45 to 64 years age bracket for the primary householder. A total of 168 households (36.4%) fall into this category. Meanwhile, the 15 to 24 years age bracket for the primary householder has the lowest median household income of $0, with 22 households (4.8%) in this group.
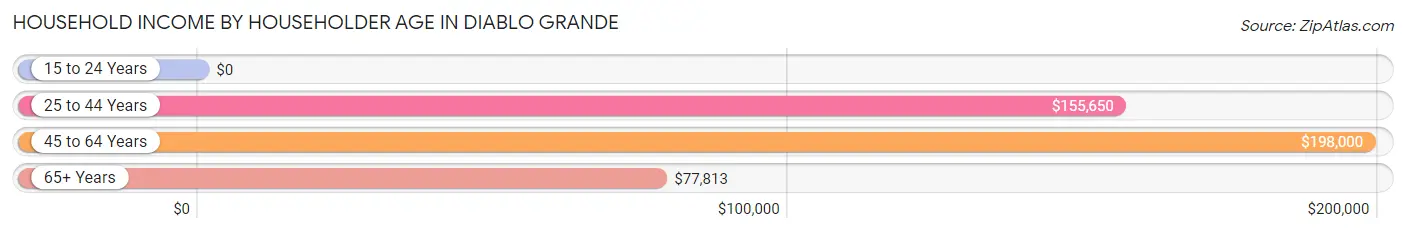
| Income Bracket | # Households | Median Income |
| 15 to 24 Years | 22 (4.8%) | $0 |
| 25 to 44 Years | 121 (26.2%) | $155,650 |
| 45 to 64 Years | 168 (36.4%) | $198,000 |
| 65+ Years | 151 (32.7%) | $77,813 |
| Total | 462 (100.0%) | $109,875 |
Poverty in Diablo Grande
Income Below Poverty by Sex and Age in Diablo Grande
With 2.8% poverty level for males and 0.1% for females among the residents of Diablo Grande, 35 to 44 year old males and 65 to 74 year old females are the most vulnerable to poverty, with 10 males (10.9%) and 1 females (0.7%) in their respective age groups living below the poverty level.
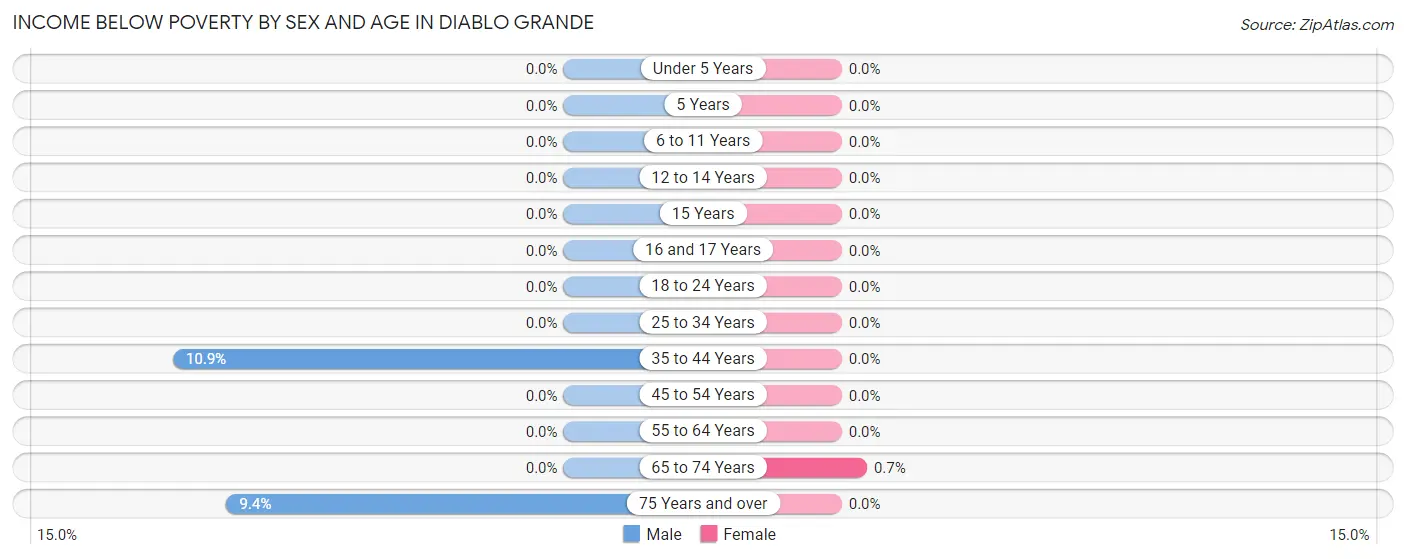
| Age Bracket | Male | Female |
| Under 5 Years | 0 (0.0%) | 0 (0.0%) |
| 5 Years | 0 (0.0%) | 0 (0.0%) |
| 6 to 11 Years | 0 (0.0%) | 0 (0.0%) |
| 12 to 14 Years | 0 (0.0%) | 0 (0.0%) |
| 15 Years | 0 (0.0%) | 0 (0.0%) |
| 16 and 17 Years | 0 (0.0%) | 0 (0.0%) |
| 18 to 24 Years | 0 (0.0%) | 0 (0.0%) |
| 25 to 34 Years | 0 (0.0%) | 0 (0.0%) |
| 35 to 44 Years | 10 (10.9%) | 0 (0.0%) |
| 45 to 54 Years | 0 (0.0%) | 0 (0.0%) |
| 55 to 64 Years | 0 (0.0%) | 0 (0.0%) |
| 65 to 74 Years | 0 (0.0%) | 1 (0.7%) |
| 75 Years and over | 6 (9.4%) | 0 (0.0%) |
| Total | 16 (2.8%) | 1 (0.1%) |
Income Above Poverty by Sex and Age in Diablo Grande
According to the poverty statistics in Diablo Grande, males aged 6 to 11 years and females aged under 5 years are the age groups that are most secure financially, with 100.0% of males and 100.0% of females in these age groups living above the poverty line.
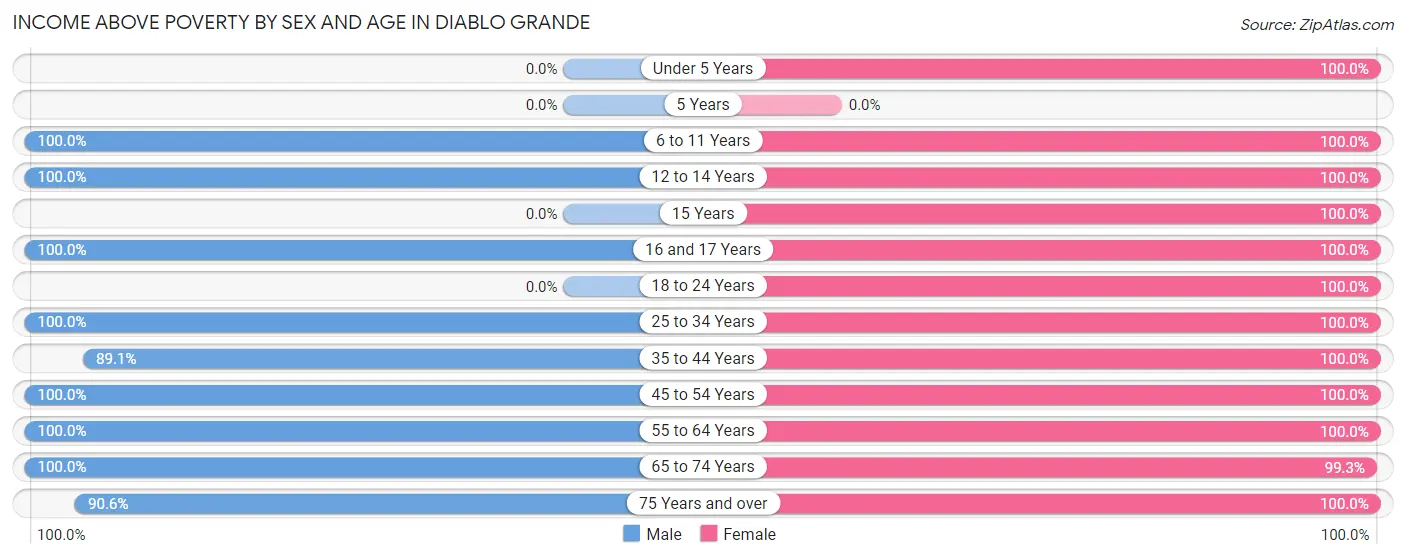
| Age Bracket | Male | Female |
| Under 5 Years | 0 (0.0%) | 19 (100.0%) |
| 5 Years | 0 (0.0%) | 0 (0.0%) |
| 6 to 11 Years | 30 (100.0%) | 71 (100.0%) |
| 12 to 14 Years | 11 (100.0%) | 50 (100.0%) |
| 15 Years | 0 (0.0%) | 15 (100.0%) |
| 16 and 17 Years | 10 (100.0%) | 33 (100.0%) |
| 18 to 24 Years | 0 (0.0%) | 69 (100.0%) |
| 25 to 34 Years | 64 (100.0%) | 52 (100.0%) |
| 35 to 44 Years | 82 (89.1%) | 75 (100.0%) |
| 45 to 54 Years | 100 (100.0%) | 40 (100.0%) |
| 55 to 64 Years | 100 (100.0%) | 93 (100.0%) |
| 65 to 74 Years | 94 (100.0%) | 141 (99.3%) |
| 75 Years and over | 58 (90.6%) | 33 (100.0%) |
| Total | 549 (97.2%) | 691 (99.9%) |
Income Below Poverty Among Married-Couple Families in Diablo Grande
The poverty statistics for married-couple families in Diablo Grande show that 1.6% or 6 of the total 366 families live below the poverty line. Families with no children have the highest poverty rate of 2.1%, comprising of 6 families. On the other hand, families with 1 or 2 children have the lowest poverty rate of 0.0%, which includes 0 families.
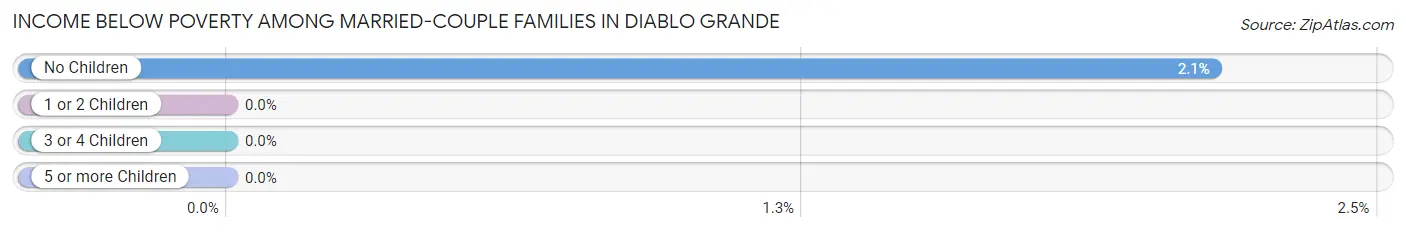
| Children | Above Poverty | Below Poverty |
| No Children | 274 (97.9%) | 6 (2.1%) |
| 1 or 2 Children | 37 (100.0%) | 0 (0.0%) |
| 3 or 4 Children | 49 (100.0%) | 0 (0.0%) |
| 5 or more Children | 0 (0.0%) | 0 (0.0%) |
| Total | 360 (98.4%) | 6 (1.6%) |
Income Below Poverty Among Single-Parent Households in Diablo Grande
| Children | Single Father | Single Mother |
| No Children | 0 (0.0%) | 0 (0.0%) |
| 1 or 2 Children | 0 (0.0%) | 0 (0.0%) |
| 3 or 4 Children | 0 (0.0%) | 0 (0.0%) |
| 5 or more Children | 0 (0.0%) | 0 (0.0%) |
| Total | 0 (0.0%) | 0 (0.0%) |
Income Below Poverty Among Married-Couple vs Single-Parent Households in Diablo Grande
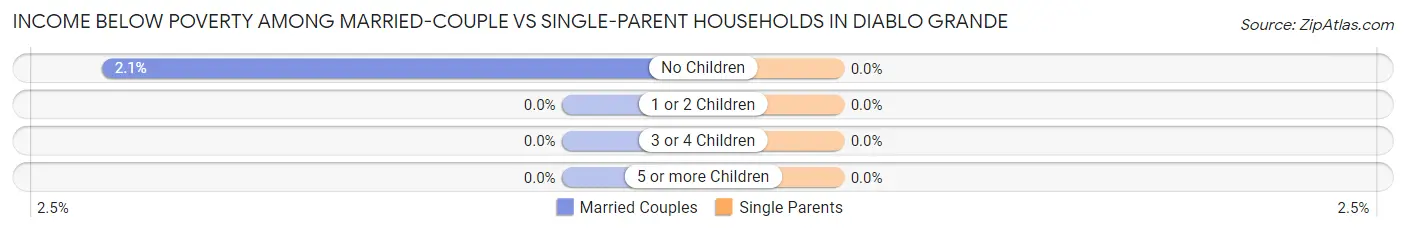
| Children | Married-Couple Families | Single-Parent Households |
| No Children | 6 (2.1%) | 0 (0.0%) |
| 1 or 2 Children | 0 (0.0%) | 0 (0.0%) |
| 3 or 4 Children | 0 (0.0%) | 0 (0.0%) |
| 5 or more Children | 0 (0.0%) | 0 (0.0%) |
| Total | 6 (1.6%) | 0 (0.0%) |
Race in Diablo Grande
The most populous races in Diablo Grande are White / Caucasian (766 | 60.9%), Hispanic or Latino (277 | 22.0%), and Two or more Races (241 | 19.2%).
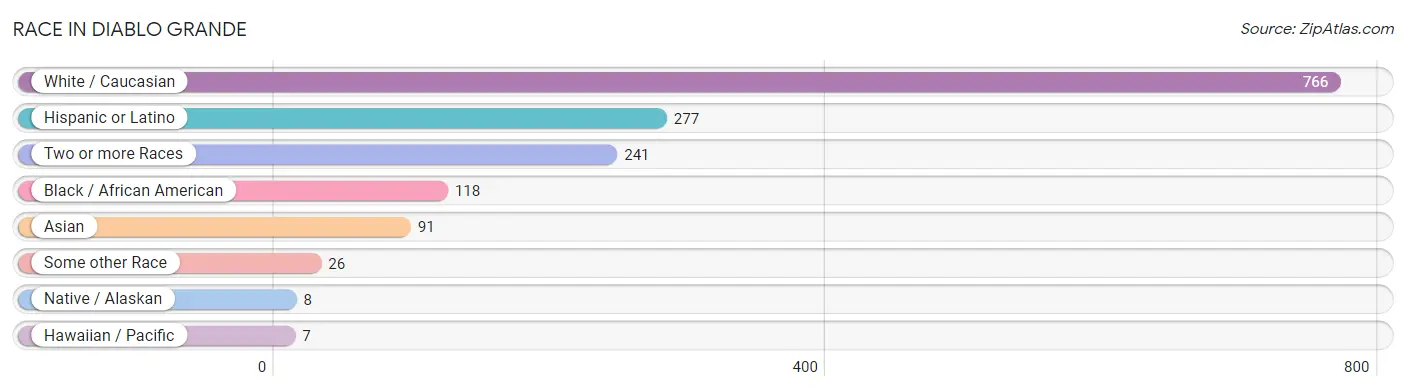
| Race | # Population | % Population |
| Asian | 91 | 7.2% |
| Black / African American | 118 | 9.4% |
| Hawaiian / Pacific | 7 | 0.6% |
| Hispanic or Latino | 277 | 22.0% |
| Native / Alaskan | 8 | 0.6% |
| White / Caucasian | 766 | 60.9% |
| Two or more Races | 241 | 19.2% |
| Some other Race | 26 | 2.1% |
| Total | 1,257 | 100.0% |
Ancestry in Diablo Grande
The most populous ancestries reported in Diablo Grande are Mexican (148 | 11.8%), Korean (141 | 11.2%), English (136 | 10.8%), German (108 | 8.6%), and Portuguese (94 | 7.5%), together accounting for 49.9% of all Diablo Grande residents.
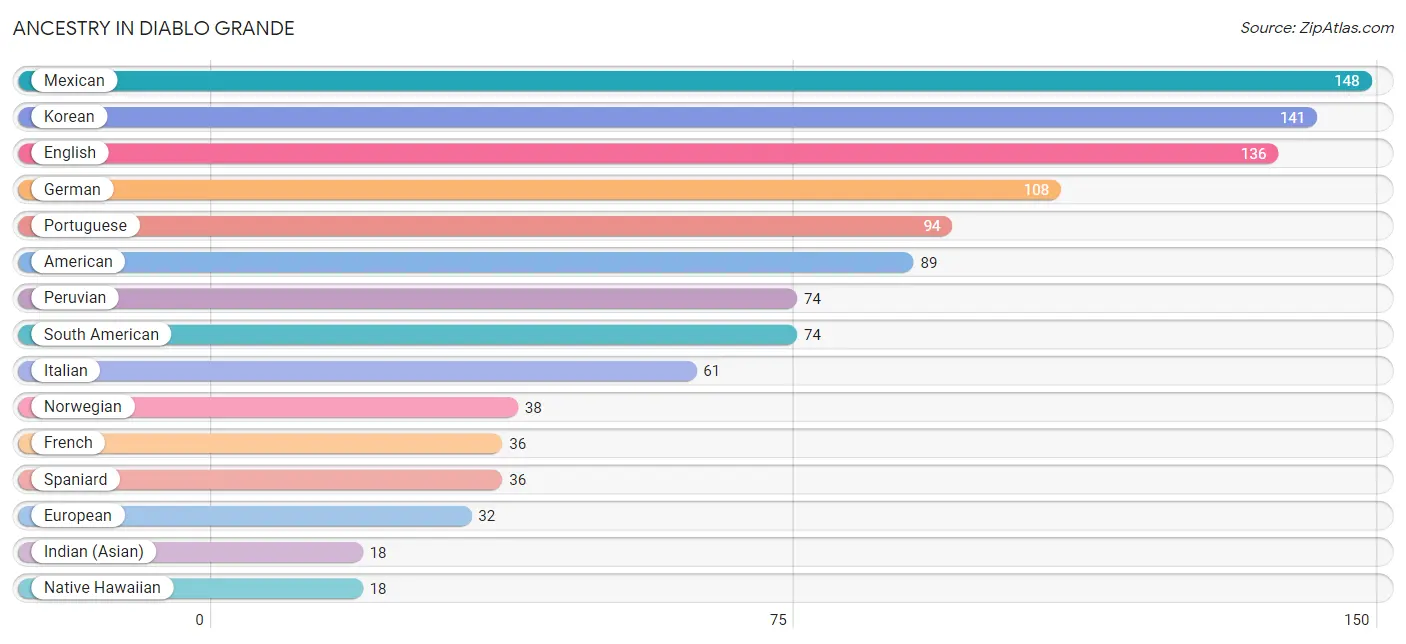
| Ancestry | # Population | % Population |
| American | 89 | 7.1% |
| Bhutanese | 7 | 0.6% |
| Burmese | 12 | 0.9% |
| Central American Indian | 8 | 0.6% |
| Dutch | 10 | 0.8% |
| English | 136 | 10.8% |
| European | 32 | 2.5% |
| French | 36 | 2.9% |
| German | 108 | 8.6% |
| Indian (Asian) | 18 | 1.4% |
| Italian | 61 | 4.9% |
| Korean | 141 | 11.2% |
| Mexican | 148 | 11.8% |
| Native Hawaiian | 18 | 1.4% |
| Northern European | 8 | 0.6% |
| Norwegian | 38 | 3.0% |
| Peruvian | 74 | 5.9% |
| Polish | 10 | 0.8% |
| Portuguese | 94 | 7.5% |
| Puerto Rican | 10 | 0.8% |
| Scotch-Irish | 9 | 0.7% |
| Slavic | 9 | 0.7% |
| South American | 74 | 5.9% |
| Spaniard | 36 | 2.9% |
| Spanish | 9 | 0.7% |
| Swiss | 6 | 0.5% | View All 26 Rows |
Immigrants in Diablo Grande
The most numerous immigrant groups reported in Diablo Grande came from Latin America (117 | 9.3%), Asia (105 | 8.4%), Peru (74 | 5.9%), South America (74 | 5.9%), and Philippines (65 | 5.2%), together accounting for 34.6% of all Diablo Grande residents.
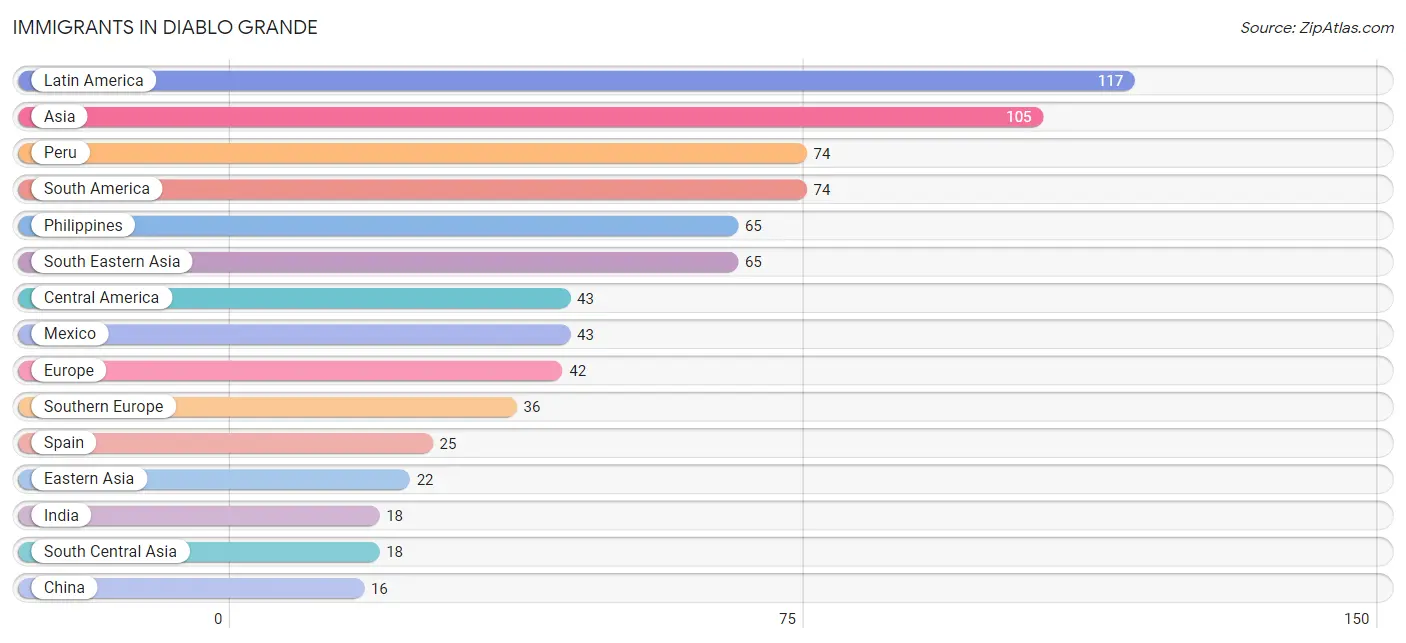
| Immigration Origin | # Population | % Population |
| Asia | 105 | 8.4% |
| Central America | 43 | 3.4% |
| China | 16 | 1.3% |
| Eastern Asia | 22 | 1.8% |
| Eastern Europe | 6 | 0.5% |
| Europe | 42 | 3.3% |
| Hong Kong | 3 | 0.2% |
| India | 18 | 1.4% |
| Korea | 6 | 0.5% |
| Latin America | 117 | 9.3% |
| Mexico | 43 | 3.4% |
| Peru | 74 | 5.9% |
| Philippines | 65 | 5.2% |
| Portugal | 11 | 0.9% |
| Russia | 6 | 0.5% |
| South America | 74 | 5.9% |
| South Central Asia | 18 | 1.4% |
| South Eastern Asia | 65 | 5.2% |
| Southern Europe | 36 | 2.9% |
| Spain | 25 | 2.0% |
| Taiwan | 11 | 0.9% | View All 21 Rows |
Sex and Age in Diablo Grande
Sex and Age in Diablo Grande
The most populous age groups in Diablo Grande are 45 to 49 Years (62 | 11.0%) for men and 10 to 14 Years (104 | 15.0%) for women.
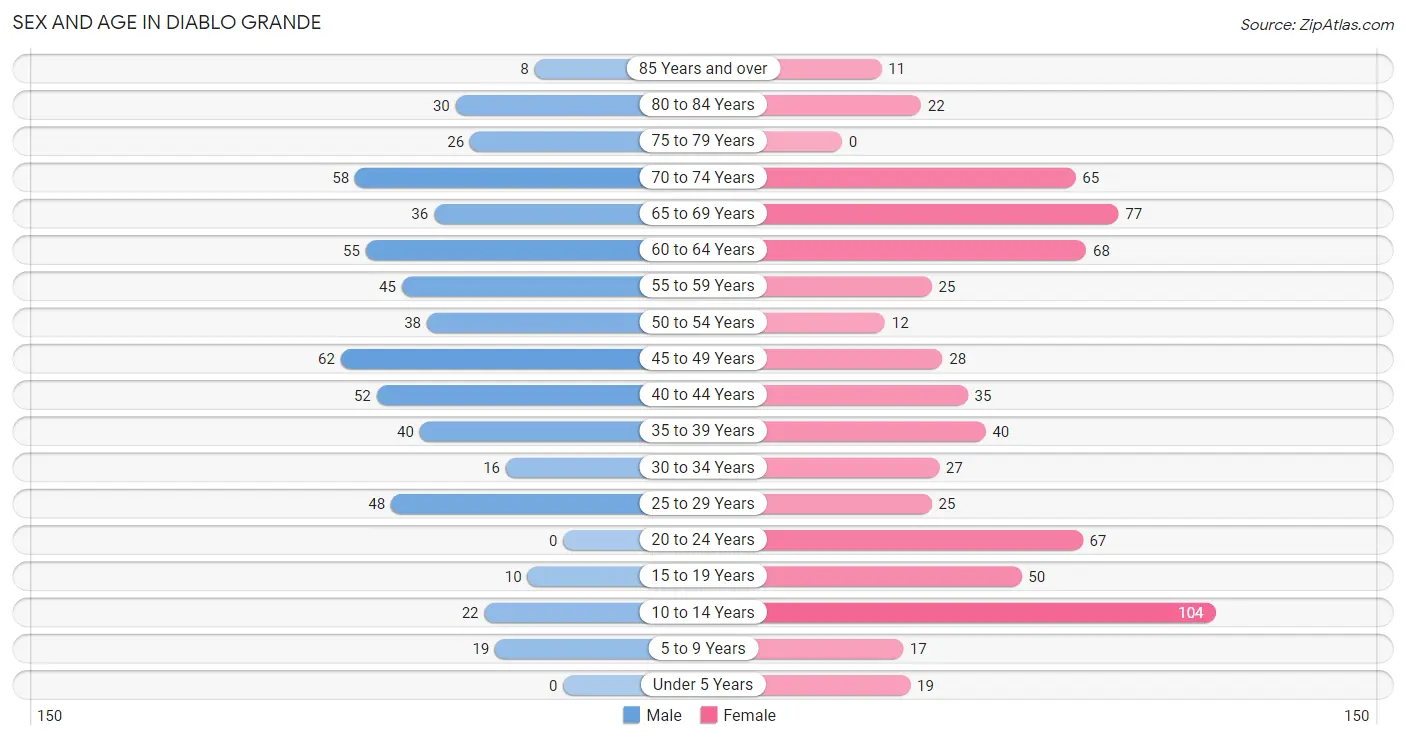
| Age Bracket | Male | Female |
| Under 5 Years | 0 (0.0%) | 19 (2.8%) |
| 5 to 9 Years | 19 (3.4%) | 17 (2.5%) |
| 10 to 14 Years | 22 (3.9%) | 104 (15.0%) |
| 15 to 19 Years | 10 (1.8%) | 50 (7.2%) |
| 20 to 24 Years | 0 (0.0%) | 67 (9.7%) |
| 25 to 29 Years | 48 (8.5%) | 25 (3.6%) |
| 30 to 34 Years | 16 (2.8%) | 27 (3.9%) |
| 35 to 39 Years | 40 (7.1%) | 40 (5.8%) |
| 40 to 44 Years | 52 (9.2%) | 35 (5.1%) |
| 45 to 49 Years | 62 (11.0%) | 28 (4.1%) |
| 50 to 54 Years | 38 (6.7%) | 12 (1.7%) |
| 55 to 59 Years | 45 (8.0%) | 25 (3.6%) |
| 60 to 64 Years | 55 (9.7%) | 68 (9.8%) |
| 65 to 69 Years | 36 (6.4%) | 77 (11.1%) |
| 70 to 74 Years | 58 (10.3%) | 65 (9.4%) |
| 75 to 79 Years | 26 (4.6%) | 0 (0.0%) |
| 80 to 84 Years | 30 (5.3%) | 22 (3.2%) |
| 85 Years and over | 8 (1.4%) | 11 (1.6%) |
| Total | 565 (100.0%) | 692 (100.0%) |
Families and Households in Diablo Grande
Median Family Size in Diablo Grande
The median family size in Diablo Grande is 2.91 persons per family, with married-couple families (366 | 88.8%) accounting for the largest median family size of 2.95 persons per family. On the other hand, single female/mother families (6 | 1.5%) represent the smallest median family size with 2.50 persons per family.
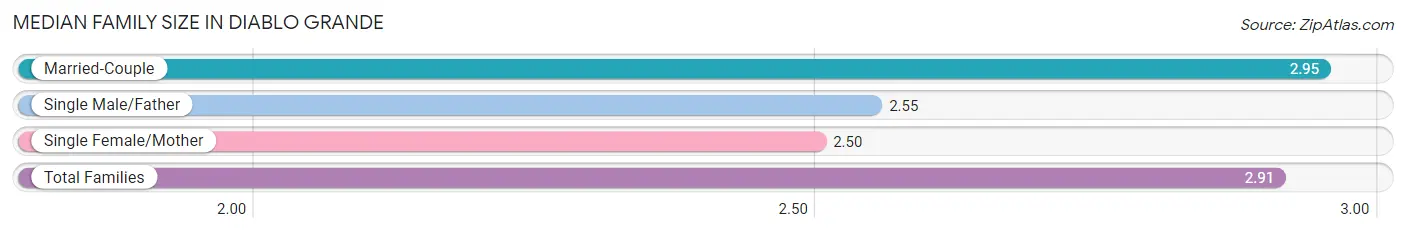
| Family Type | # Families | Family Size |
| Married-Couple | 366 (88.8%) | 2.95 |
| Single Male/Father | 40 (9.7%) | 2.55 |
| Single Female/Mother | 6 (1.5%) | 2.50 |
| Total Families | 412 (100.0%) | 2.91 |
Median Household Size in Diablo Grande
The median household size in Diablo Grande is 2.72 persons per household, with married-couple households (366 | 79.2%) accounting for the largest median household size of 2.95 persons per household. non-family households (50 | 10.8%) represent the smallest median household size with 1.20 persons per household.
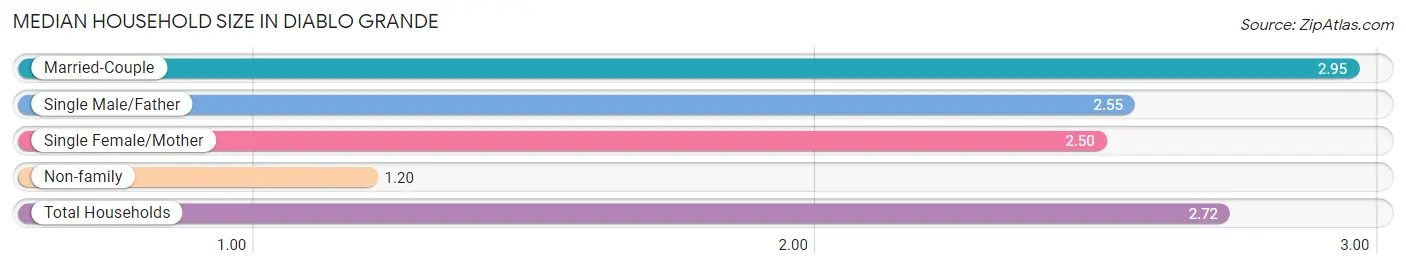
| Household Type | # Households | Household Size |
| Married-Couple | 366 (79.2%) | 2.95 |
| Single Male/Father | 40 (8.7%) | 2.55 |
| Single Female/Mother | 6 (1.3%) | 2.50 |
| Non-family | 50 (10.8%) | 1.20 |
| Total Households | 462 (100.0%) | 2.72 |
Household Size by Marriage Status in Diablo Grande
Out of a total of 462 households in Diablo Grande, 412 (89.2%) are family households, while 50 (10.8%) are nonfamily households. The most numerous type of family households are 2-person households, comprising 247, and the most common type of nonfamily households are 1-person households, comprising 40.
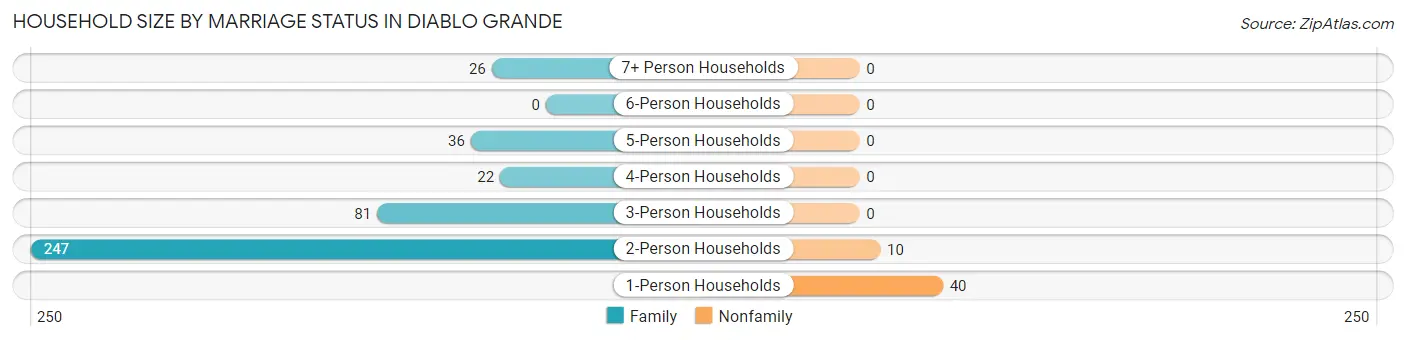
| Household Size | Family Households | Nonfamily Households |
| 1-Person Households | - | 40 (8.7%) |
| 2-Person Households | 247 (53.5%) | 10 (2.2%) |
| 3-Person Households | 81 (17.5%) | 0 (0.0%) |
| 4-Person Households | 22 (4.8%) | 0 (0.0%) |
| 5-Person Households | 36 (7.8%) | 0 (0.0%) |
| 6-Person Households | 0 (0.0%) | 0 (0.0%) |
| 7+ Person Households | 26 (5.6%) | 0 (0.0%) |
| Total | 412 (89.2%) | 50 (10.8%) |
Female Fertility in Diablo Grande
Fertility by Age in Diablo Grande
| Age Bracket | Women with Births | Births / 1,000 Women |
| 15 to 19 years | 0 (0.0%) | 0.0 |
| 20 to 34 years | 0 (0.0%) | 0.0 |
| 35 to 50 years | 0 (0.0%) | 0.0 |
| Total | 0 (0.0%) | 0.0 |
Fertility by Age by Marriage Status in Diablo Grande
| Age Bracket | Married | Unmarried |
| 15 to 19 years | 0 (0.0%) | 0 (0.0%) |
| 20 to 34 years | 0 (0.0%) | 0 (0.0%) |
| 35 to 50 years | 0 (0.0%) | 0 (0.0%) |
| Total | 0 (0.0%) | 0 (0.0%) |
Fertility by Education in Diablo Grande
| Educational Attainment | Women with Births | Births / 1,000 Women |
| Less than High School | 0 (0.0%) | 0.0 |
| High School Diploma | 0 (0.0%) | 0.0 |
| College or Associate's Degree | 0 (0.0%) | 0.0 |
| Bachelor's Degree | 0 (0.0%) | 0.0 |
| Graduate Degree | 0 (0.0%) | 0.0 |
| Total | 0 (0.0%) | 0.0 |
Fertility by Education by Marriage Status in Diablo Grande
| Educational Attainment | Married | Unmarried |
| Less than High School | 0 (0.0%) | 0 (0.0%) |
| High School Diploma | 0 (0.0%) | 0 (0.0%) |
| College or Associate's Degree | 0 (0.0%) | 0 (0.0%) |
| Bachelor's Degree | 0 (0.0%) | 0 (0.0%) |
| Graduate Degree | 0 (0.0%) | 0 (0.0%) |
| Total | 0 (0.0%) | 0 (0.0%) |
Employment Characteristics in Diablo Grande
Employment by Class of Employer in Diablo Grande
Among the 467 employed individuals in Diablo Grande, private company employees (316 | 67.7%), not-for-profit organizations (60 | 12.9%), and state government employees (47 | 10.1%) make up the most common classes of employment.
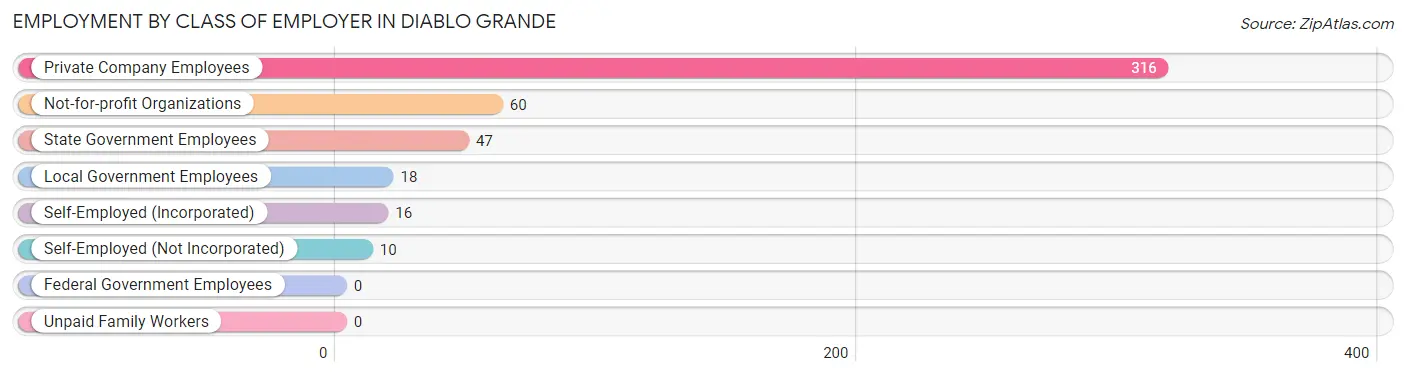
| Employer Class | # Employees | % Employees |
| Private Company Employees | 316 | 67.7% |
| Self-Employed (Incorporated) | 16 | 3.4% |
| Self-Employed (Not Incorporated) | 10 | 2.1% |
| Not-for-profit Organizations | 60 | 12.9% |
| Local Government Employees | 18 | 3.8% |
| State Government Employees | 47 | 10.1% |
| Federal Government Employees | 0 | 0.0% |
| Unpaid Family Workers | 0 | 0.0% |
| Total | 467 | 100.0% |
Employment Status by Age in Diablo Grande
According to the labor force statistics for Diablo Grande, out of the total population over 16 years of age (1,061), 47.5% or 504 individuals are in the labor force, with 5.6% or 28 of them unemployed. The age group with the highest labor force participation rate is 20 to 24 years, with 100.0% or 67 individuals in the labor force. Within the labor force, the 20 to 24 years age range has the highest percentage of unemployed individuals, with 28.4% or 19 of them being unemployed.
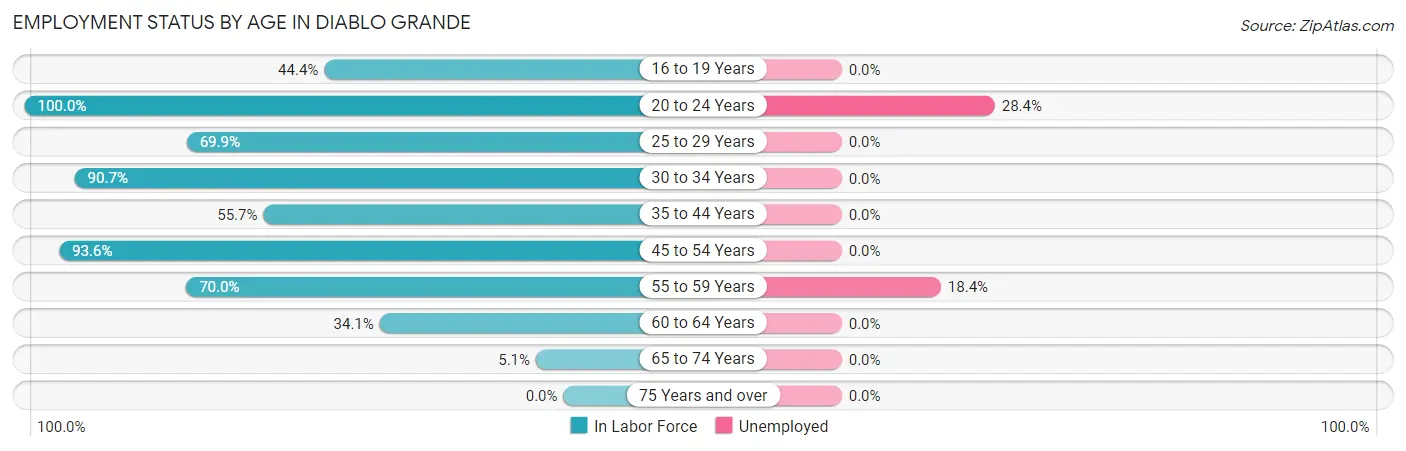
| Age Bracket | In Labor Force | Unemployed |
| 16 to 19 Years | 20 (44.4%) | 0 (0.0%) |
| 20 to 24 Years | 67 (100.0%) | 19 (28.4%) |
| 25 to 29 Years | 51 (69.9%) | 0 (0.0%) |
| 30 to 34 Years | 39 (90.7%) | 0 (0.0%) |
| 35 to 44 Years | 93 (55.7%) | 0 (0.0%) |
| 45 to 54 Years | 131 (93.6%) | 0 (0.0%) |
| 55 to 59 Years | 49 (70.0%) | 9 (18.4%) |
| 60 to 64 Years | 42 (34.1%) | 0 (0.0%) |
| 65 to 74 Years | 12 (5.1%) | 0 (0.0%) |
| 75 Years and over | 0 (0.0%) | 0 (0.0%) |
| Total | 504 (47.5%) | 28 (5.6%) |
Employment Status by Educational Attainment in Diablo Grande
According to labor force statistics for Diablo Grande, 65.7% of individuals (405) out of the total population between 25 and 64 years of age (616) are in the labor force, with 2.2% or 9 of them being unemployed. The group with the highest labor force participation rate are those with the educational attainment of high school diploma, with 77.2% or 71 individuals in the labor force. Within the labor force, individuals with bachelor's degree or higher education have the highest percentage of unemployment, with 5.3% or 9 of them being unemployed.
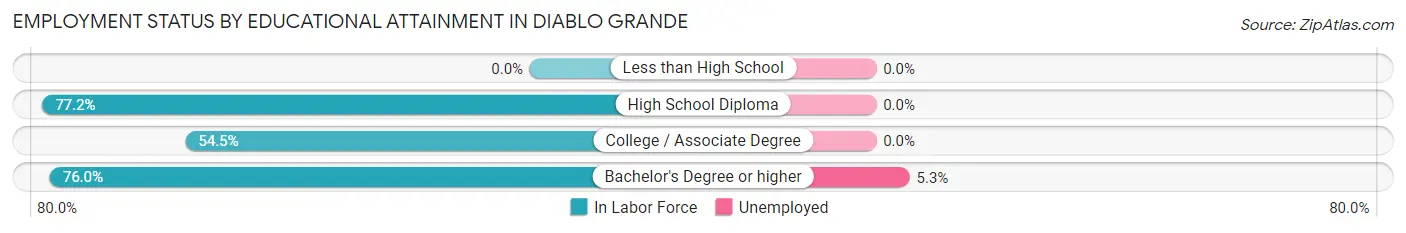
| Educational Attainment | In Labor Force | Unemployed |
| Less than High School | 0 (0.0%) | 0 (0.0%) |
| High School Diploma | 71 (77.2%) | 0 (0.0%) |
| College / Associate Degree | 163 (54.5%) | 0 (0.0%) |
| Bachelor's Degree or higher | 171 (76.0%) | 12 (5.3%) |
| Total | 405 (65.7%) | 14 (2.2%) |
Employment Occupations by Sex in Diablo Grande
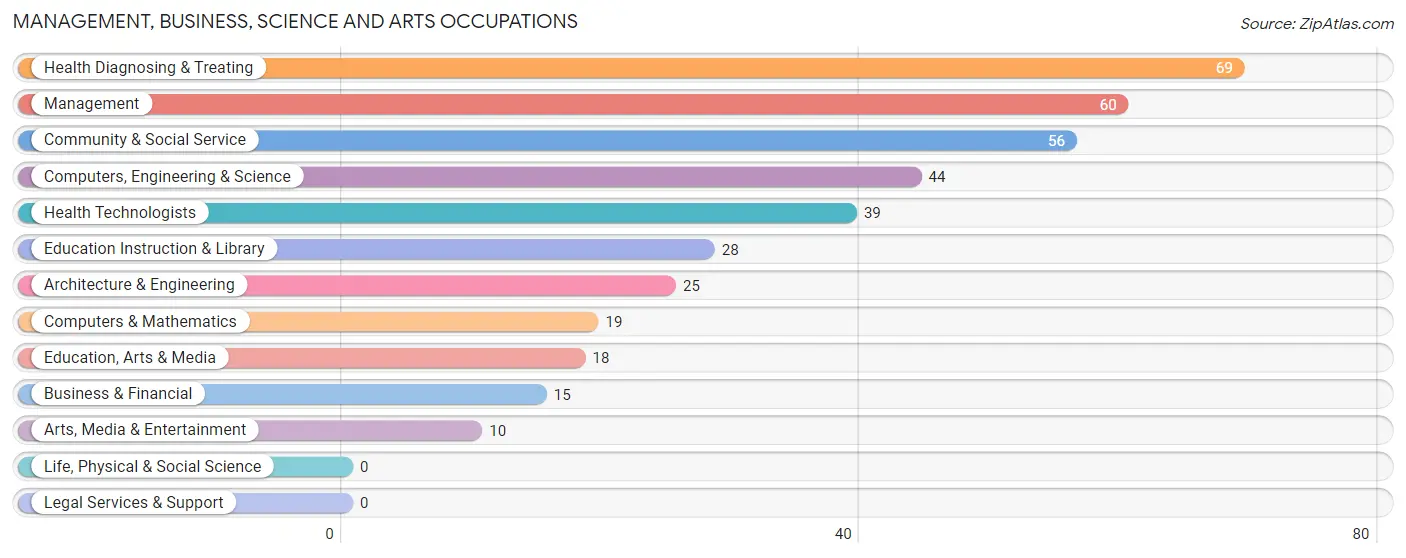
Management, Business, Science and Arts Occupations
The most common Management, Business, Science and Arts occupations in Diablo Grande are Health Diagnosing & Treating (69 | 14.5%), Management (60 | 12.6%), Community & Social Service (56 | 11.8%), Computers, Engineering & Science (44 | 9.2%), and Health Technologists (39 | 8.2%).
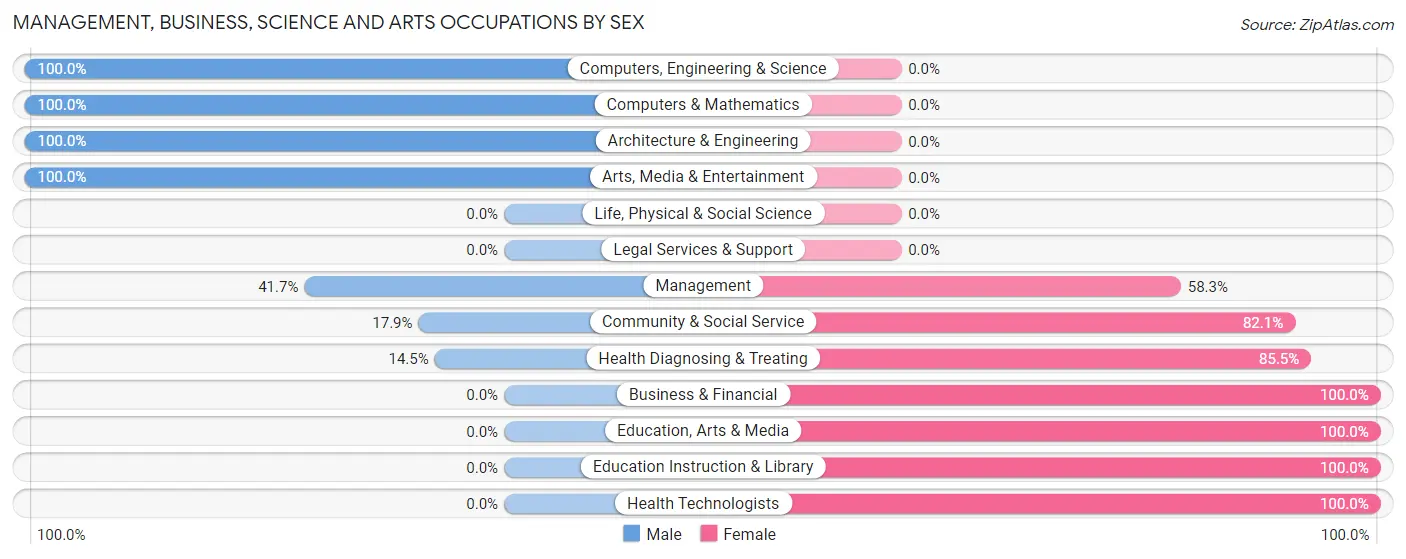
Management, Business, Science and Arts Occupations by Sex
Within the Management, Business, Science and Arts occupations in Diablo Grande, the most male-oriented occupations are Computers, Engineering & Science (100.0%), Computers & Mathematics (100.0%), and Architecture & Engineering (100.0%), while the most female-oriented occupations are Business & Financial (100.0%), Education, Arts & Media (100.0%), and Education Instruction & Library (100.0%).
| Occupation | Male | Female |
| Management | 25 (41.7%) | 35 (58.3%) |
| Business & Financial | 0 (0.0%) | 15 (100.0%) |
| Computers, Engineering & Science | 44 (100.0%) | 0 (0.0%) |
| Computers & Mathematics | 19 (100.0%) | 0 (0.0%) |
| Architecture & Engineering | 25 (100.0%) | 0 (0.0%) |
| Life, Physical & Social Science | 0 (0.0%) | 0 (0.0%) |
| Community & Social Service | 10 (17.9%) | 46 (82.1%) |
| Education, Arts & Media | 0 (0.0%) | 18 (100.0%) |
| Legal Services & Support | 0 (0.0%) | 0 (0.0%) |
| Education Instruction & Library | 0 (0.0%) | 28 (100.0%) |
| Arts, Media & Entertainment | 10 (100.0%) | 0 (0.0%) |
| Health Diagnosing & Treating | 10 (14.5%) | 59 (85.5%) |
| Health Technologists | 0 (0.0%) | 39 (100.0%) |
| Total (Category) | 89 (36.5%) | 155 (63.5%) |
| Total (Overall) | 259 (54.4%) | 217 (45.6%) |
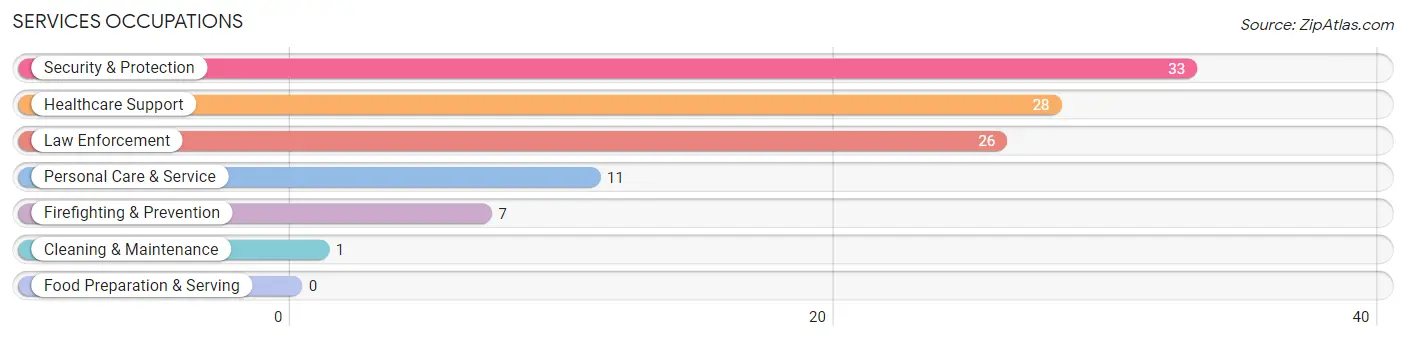
Services Occupations
The most common Services occupations in Diablo Grande are Security & Protection (33 | 6.9%), Healthcare Support (28 | 5.9%), Law Enforcement (26 | 5.5%), Personal Care & Service (11 | 2.3%), and Firefighting & Prevention (7 | 1.5%).
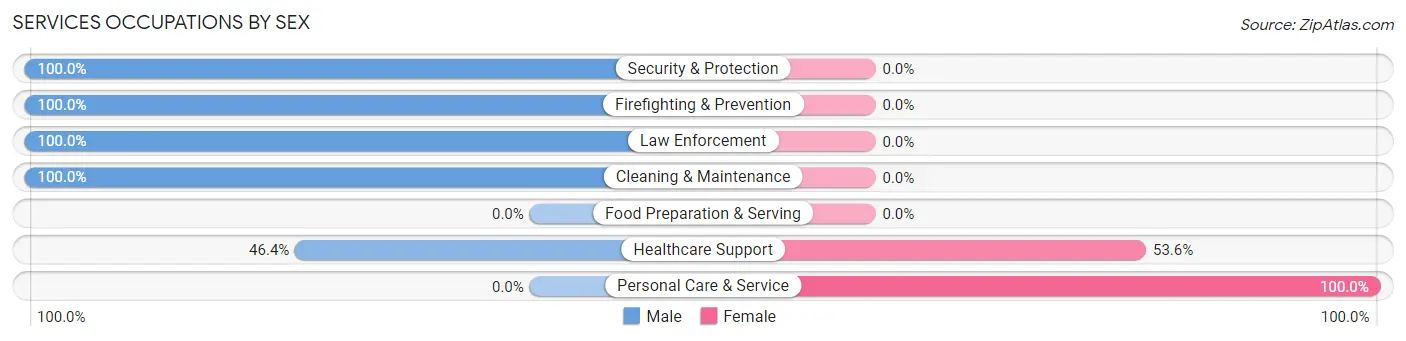
Services Occupations by Sex
Within the Services occupations in Diablo Grande, the most male-oriented occupations are Security & Protection (100.0%), Firefighting & Prevention (100.0%), and Law Enforcement (100.0%), while the most female-oriented occupations are Personal Care & Service (100.0%), and Healthcare Support (53.6%).
| Occupation | Male | Female |
| Healthcare Support | 13 (46.4%) | 15 (53.6%) |
| Security & Protection | 33 (100.0%) | 0 (0.0%) |
| Firefighting & Prevention | 7 (100.0%) | 0 (0.0%) |
| Law Enforcement | 26 (100.0%) | 0 (0.0%) |
| Food Preparation & Serving | 0 (0.0%) | 0 (0.0%) |
| Cleaning & Maintenance | 1 (100.0%) | 0 (0.0%) |
| Personal Care & Service | 0 (0.0%) | 11 (100.0%) |
| Total (Category) | 47 (64.4%) | 26 (35.6%) |
| Total (Overall) | 259 (54.4%) | 217 (45.6%) |
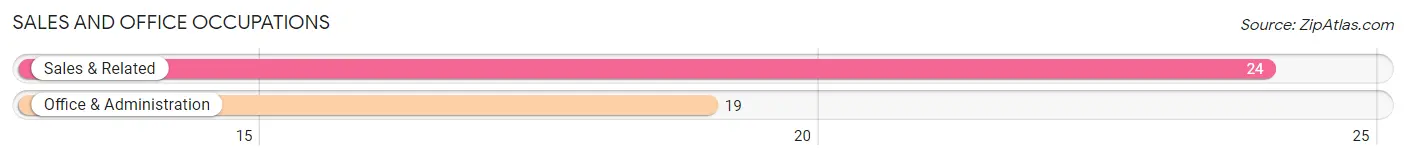
Sales and Office Occupations
The most common Sales and Office occupations in Diablo Grande are Sales & Related (24 | 5.0%), and Office & Administration (19 | 4.0%).
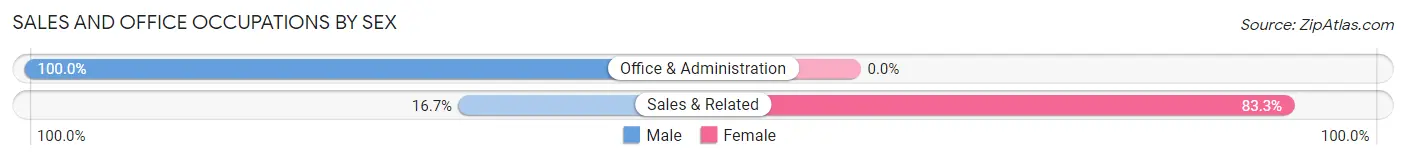
Sales and Office Occupations by Sex
| Occupation | Male | Female |
| Sales & Related | 4 (16.7%) | 20 (83.3%) |
| Office & Administration | 19 (100.0%) | 0 (0.0%) |
| Total (Category) | 23 (53.5%) | 20 (46.5%) |
| Total (Overall) | 259 (54.4%) | 217 (45.6%) |
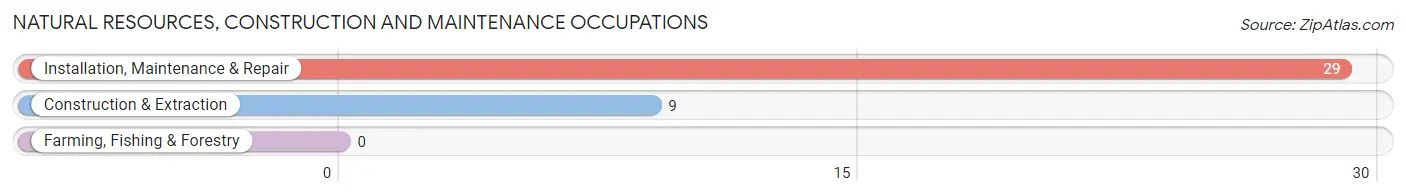
Natural Resources, Construction and Maintenance Occupations
The most common Natural Resources, Construction and Maintenance occupations in Diablo Grande are Installation, Maintenance & Repair (29 | 6.1%), and Construction & Extraction (9 | 1.9%).
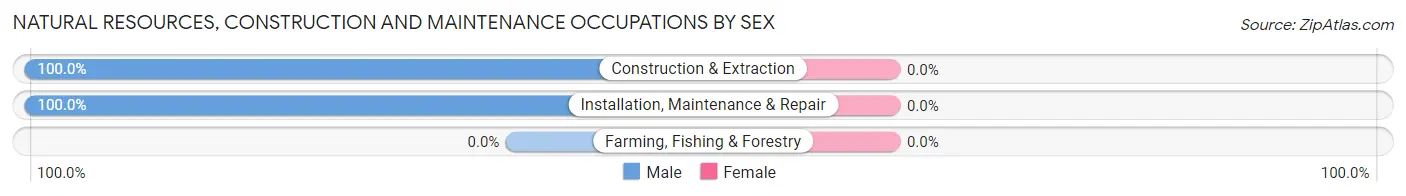
Natural Resources, Construction and Maintenance Occupations by Sex
| Occupation | Male | Female |
| Farming, Fishing & Forestry | 0 (0.0%) | 0 (0.0%) |
| Construction & Extraction | 9 (100.0%) | 0 (0.0%) |
| Installation, Maintenance & Repair | 29 (100.0%) | 0 (0.0%) |
| Total (Category) | 38 (100.0%) | 0 (0.0%) |
| Total (Overall) | 259 (54.4%) | 217 (45.6%) |
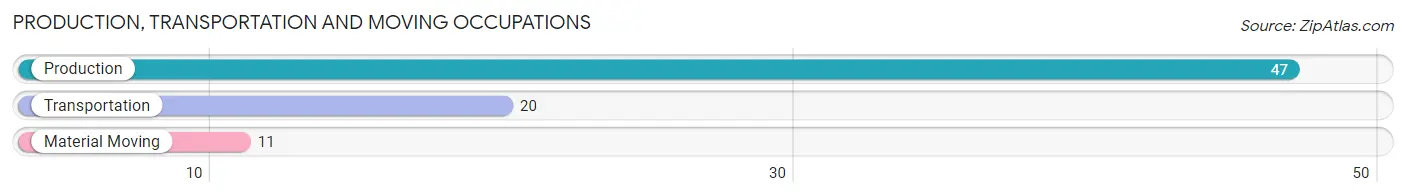
Production, Transportation and Moving Occupations
The most common Production, Transportation and Moving occupations in Diablo Grande are Production (47 | 9.9%), Transportation (20 | 4.2%), and Material Moving (11 | 2.3%).
Production, Transportation and Moving Occupations by Sex
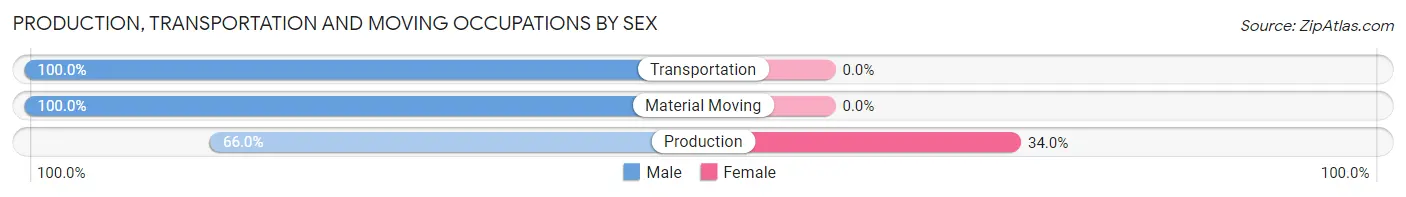
| Occupation | Male | Female |
| Production | 31 (66.0%) | 16 (34.0%) |
| Transportation | 20 (100.0%) | 0 (0.0%) |
| Material Moving | 11 (100.0%) | 0 (0.0%) |
| Total (Category) | 62 (79.5%) | 16 (20.5%) |
| Total (Overall) | 259 (54.4%) | 217 (45.6%) |
Employment Industries by Sex in Diablo Grande
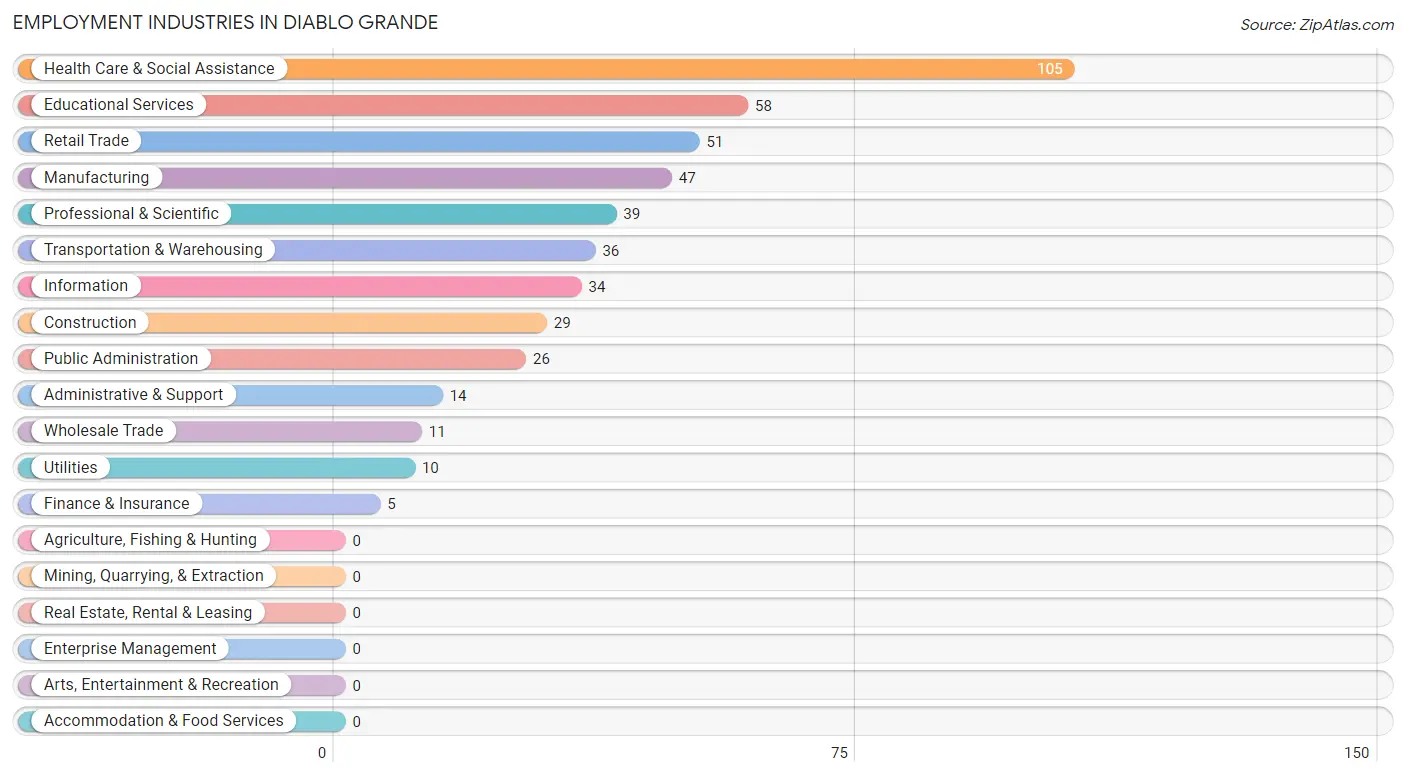
Employment Industries in Diablo Grande
The major employment industries in Diablo Grande include Health Care & Social Assistance (105 | 22.1%), Educational Services (58 | 12.2%), Retail Trade (51 | 10.7%), Manufacturing (47 | 9.9%), and Professional & Scientific (39 | 8.2%).
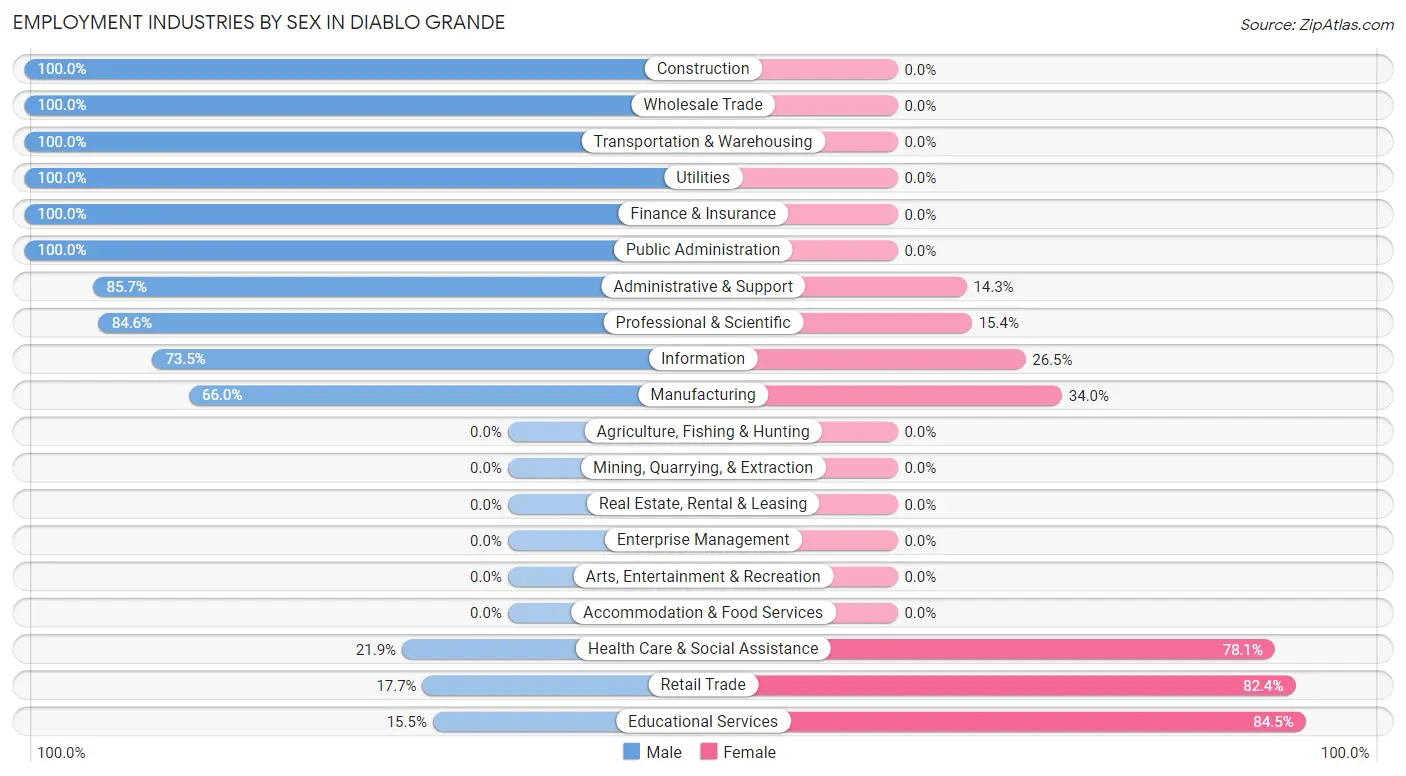
Employment Industries by Sex in Diablo Grande
The Diablo Grande industries that see more men than women are Construction (100.0%), Wholesale Trade (100.0%), and Transportation & Warehousing (100.0%), whereas the industries that tend to have a higher number of women are Educational Services (84.5%), Retail Trade (82.4%), and Health Care & Social Assistance (78.1%).
| Industry | Male | Female |
| Agriculture, Fishing & Hunting | 0 (0.0%) | 0 (0.0%) |
| Mining, Quarrying, & Extraction | 0 (0.0%) | 0 (0.0%) |
| Construction | 29 (100.0%) | 0 (0.0%) |
| Manufacturing | 31 (66.0%) | 16 (34.0%) |
| Wholesale Trade | 11 (100.0%) | 0 (0.0%) |
| Retail Trade | 9 (17.6%) | 42 (82.4%) |
| Transportation & Warehousing | 36 (100.0%) | 0 (0.0%) |
| Utilities | 10 (100.0%) | 0 (0.0%) |
| Information | 25 (73.5%) | 9 (26.5%) |
| Finance & Insurance | 5 (100.0%) | 0 (0.0%) |
| Real Estate, Rental & Leasing | 0 (0.0%) | 0 (0.0%) |
| Professional & Scientific | 33 (84.6%) | 6 (15.4%) |
| Enterprise Management | 0 (0.0%) | 0 (0.0%) |
| Administrative & Support | 12 (85.7%) | 2 (14.3%) |
| Educational Services | 9 (15.5%) | 49 (84.5%) |
| Health Care & Social Assistance | 23 (21.9%) | 82 (78.1%) |
| Arts, Entertainment & Recreation | 0 (0.0%) | 0 (0.0%) |
| Accommodation & Food Services | 0 (0.0%) | 0 (0.0%) |
| Public Administration | 26 (100.0%) | 0 (0.0%) |
| Total | 259 (54.4%) | 217 (45.6%) |
Education in Diablo Grande
School Enrollment in Diablo Grande
The most common levels of schooling among the 326 students in Diablo Grande are elementary school (90 | 27.6%), middle school (72 | 22.1%), and college / undergraduate (64 | 19.6%).
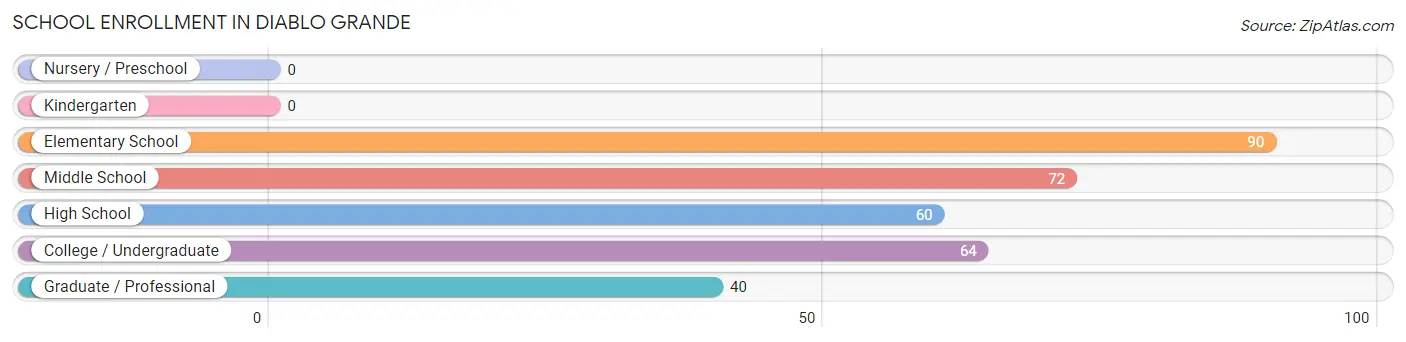
| School Level | # Students | % Students |
| Nursery / Preschool | 0 | 0.0% |
| Kindergarten | 0 | 0.0% |
| Elementary School | 90 | 27.6% |
| Middle School | 72 | 22.1% |
| High School | 60 | 18.4% |
| College / Undergraduate | 64 | 19.6% |
| Graduate / Professional | 40 | 12.3% |
| Total | 326 | 100.0% |
School Enrollment by Age by Funding Source in Diablo Grande
Out of a total of 326 students who are enrolled in schools in Diablo Grande, 40 (12.3%) attend a private institution, while the remaining 286 (87.7%) are enrolled in public schools. The age group of 25 to 34 year olds has the highest likelihood of being enrolled in private schools, with 40 (100.0% in the age bracket) enrolled. Conversely, the age group of 5 to 9 year old has the lowest likelihood of being enrolled in a private school, with 36 (100.0% in the age bracket) attending a public institution.
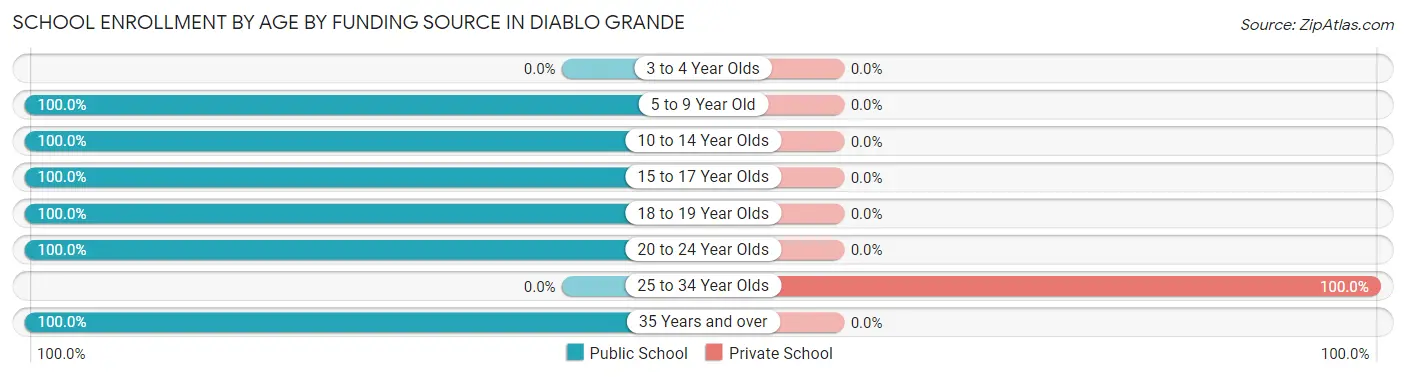
| Age Bracket | Public School | Private School |
| 3 to 4 Year Olds | 0 (0.0%) | 0 (0.0%) |
| 5 to 9 Year Old | 36 (100.0%) | 0 (0.0%) |
| 10 to 14 Year Olds | 126 (100.0%) | 0 (0.0%) |
| 15 to 17 Year Olds | 58 (100.0%) | 0 (0.0%) |
| 18 to 19 Year Olds | 2 (100.0%) | 0 (0.0%) |
| 20 to 24 Year Olds | 30 (100.0%) | 0 (0.0%) |
| 25 to 34 Year Olds | 0 (0.0%) | 40 (100.0%) |
| 35 Years and over | 34 (100.0%) | 0 (0.0%) |
| Total | 286 (87.7%) | 40 (12.3%) |
Educational Attainment by Field of Study in Diablo Grande
Business (79 | 24.5%), social sciences (72 | 22.4%), science & technology (48 | 14.9%), psychology (34 | 10.6%), and education (22 | 6.8%) are the most common fields of study among 322 individuals in Diablo Grande who have obtained a bachelor's degree or higher.
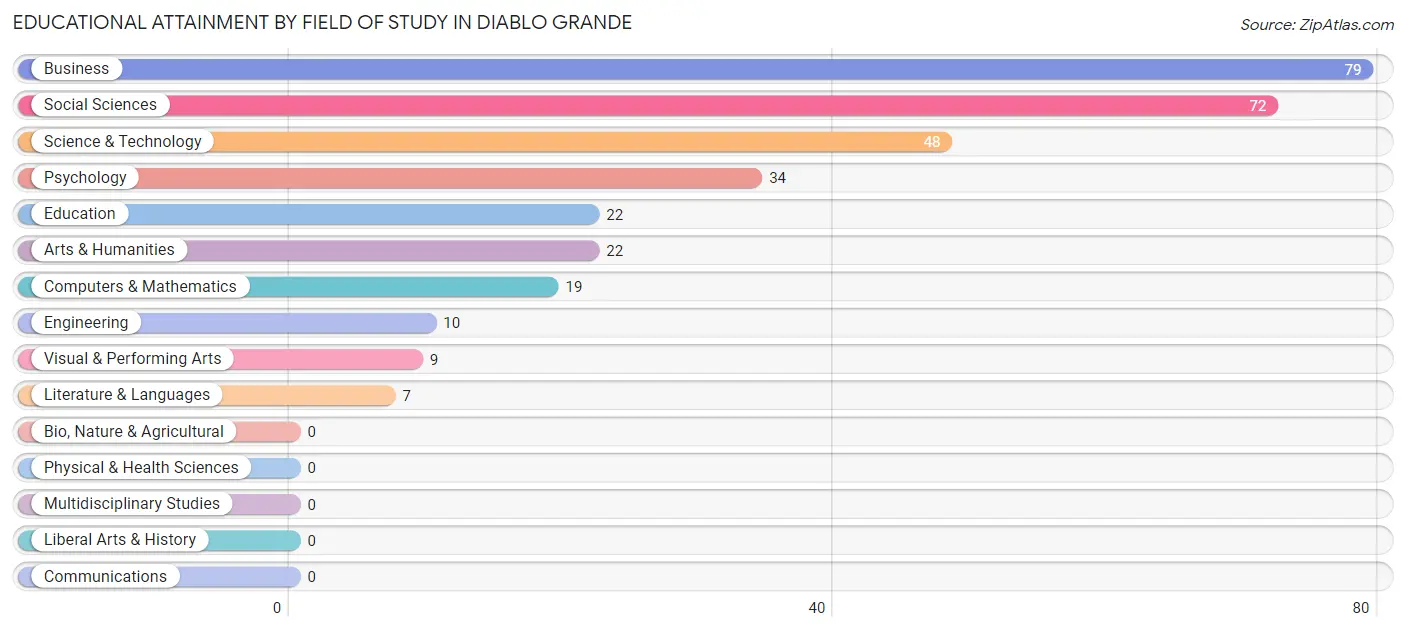
| Field of Study | # Graduates | % Graduates |
| Computers & Mathematics | 19 | 5.9% |
| Bio, Nature & Agricultural | 0 | 0.0% |
| Physical & Health Sciences | 0 | 0.0% |
| Psychology | 34 | 10.6% |
| Social Sciences | 72 | 22.4% |
| Engineering | 10 | 3.1% |
| Multidisciplinary Studies | 0 | 0.0% |
| Science & Technology | 48 | 14.9% |
| Business | 79 | 24.5% |
| Education | 22 | 6.8% |
| Literature & Languages | 7 | 2.2% |
| Liberal Arts & History | 0 | 0.0% |
| Visual & Performing Arts | 9 | 2.8% |
| Communications | 0 | 0.0% |
| Arts & Humanities | 22 | 6.8% |
| Total | 322 | 100.0% |
Transportation & Commute in Diablo Grande
Vehicle Availability by Sex in Diablo Grande
The most prevalent vehicle ownership categories in Diablo Grande are males with 2 vehicles (120, accounting for 46.3%) and females with 2 vehicles (84, making up 57.7%).
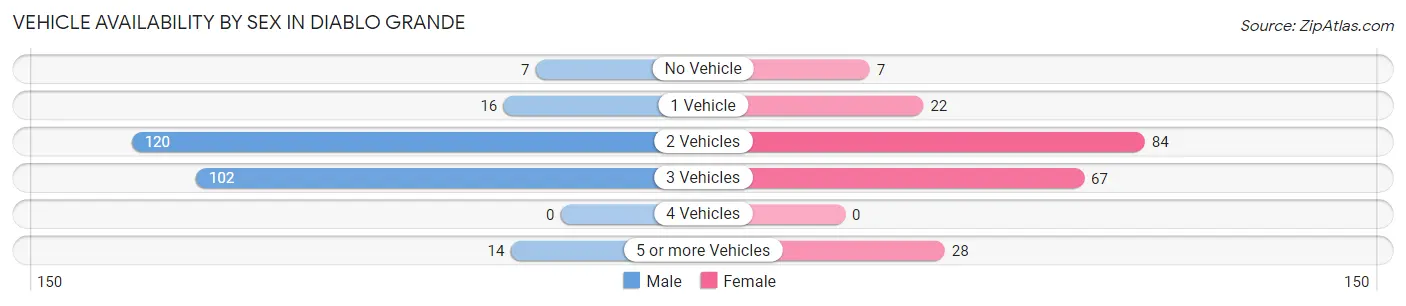
| Vehicles Available | Male | Female |
| No Vehicle | 7 (2.7%) | 7 (3.4%) |
| 1 Vehicle | 16 (6.2%) | 22 (10.6%) |
| 2 Vehicles | 120 (46.3%) | 84 (40.4%) |
| 3 Vehicles | 102 (39.4%) | 67 (32.2%) |
| 4 Vehicles | 0 (0.0%) | 0 (0.0%) |
| 5 or more Vehicles | 14 (5.4%) | 28 (13.5%) |
| Total | 259 (100.0%) | 208 (100.0%) |
Commute Time in Diablo Grande
The most frequently occuring commute durations in Diablo Grande are 60 to 89 minutes (123 commuters, 28.7%), 45 to 59 minutes (120 commuters, 28.0%), and 90 or more minutes (79 commuters, 18.4%).
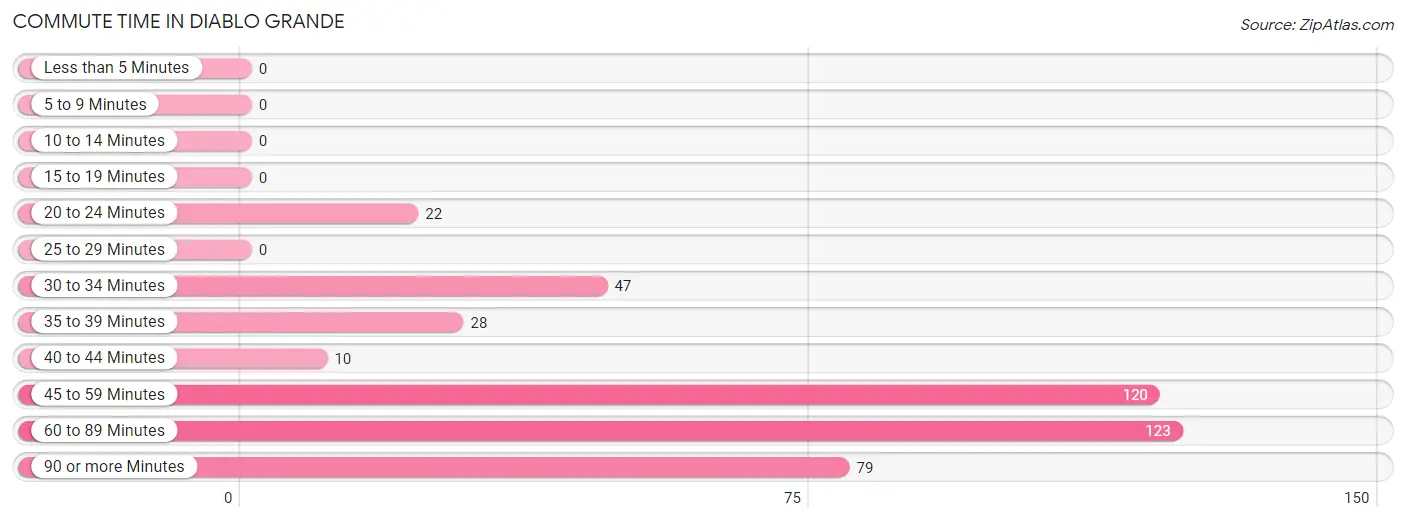
| Commute Time | # Commuters | % Commuters |
| Less than 5 Minutes | 0 | 0.0% |
| 5 to 9 Minutes | 0 | 0.0% |
| 10 to 14 Minutes | 0 | 0.0% |
| 15 to 19 Minutes | 0 | 0.0% |
| 20 to 24 Minutes | 22 | 5.1% |
| 25 to 29 Minutes | 0 | 0.0% |
| 30 to 34 Minutes | 47 | 11.0% |
| 35 to 39 Minutes | 28 | 6.5% |
| 40 to 44 Minutes | 10 | 2.3% |
| 45 to 59 Minutes | 120 | 28.0% |
| 60 to 89 Minutes | 123 | 28.7% |
| 90 or more Minutes | 79 | 18.4% |
Commute Time by Sex in Diablo Grande
The most common commute times in Diablo Grande are 90 or more minutes (64 commuters, 26.7%) for males and 45 to 59 minutes (69 commuters, 36.5%) for females.
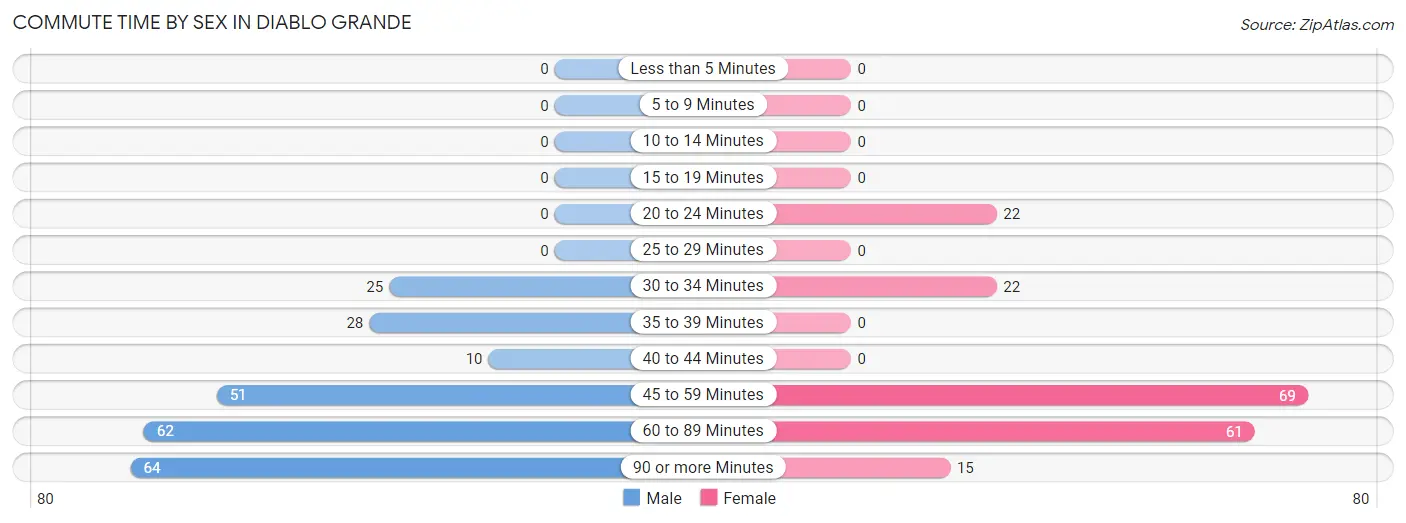
| Commute Time | Male | Female |
| Less than 5 Minutes | 0 (0.0%) | 0 (0.0%) |
| 5 to 9 Minutes | 0 (0.0%) | 0 (0.0%) |
| 10 to 14 Minutes | 0 (0.0%) | 0 (0.0%) |
| 15 to 19 Minutes | 0 (0.0%) | 0 (0.0%) |
| 20 to 24 Minutes | 0 (0.0%) | 22 (11.6%) |
| 25 to 29 Minutes | 0 (0.0%) | 0 (0.0%) |
| 30 to 34 Minutes | 25 (10.4%) | 22 (11.6%) |
| 35 to 39 Minutes | 28 (11.7%) | 0 (0.0%) |
| 40 to 44 Minutes | 10 (4.2%) | 0 (0.0%) |
| 45 to 59 Minutes | 51 (21.2%) | 69 (36.5%) |
| 60 to 89 Minutes | 62 (25.8%) | 61 (32.3%) |
| 90 or more Minutes | 64 (26.7%) | 15 (7.9%) |
Time of Departure to Work by Sex in Diablo Grande
The most frequent times of departure to work in Diablo Grande are 12:00 AM to 4:59 AM (58, 24.2%) for males and 6:30 AM to 6:59 AM (70, 37.0%) for females.
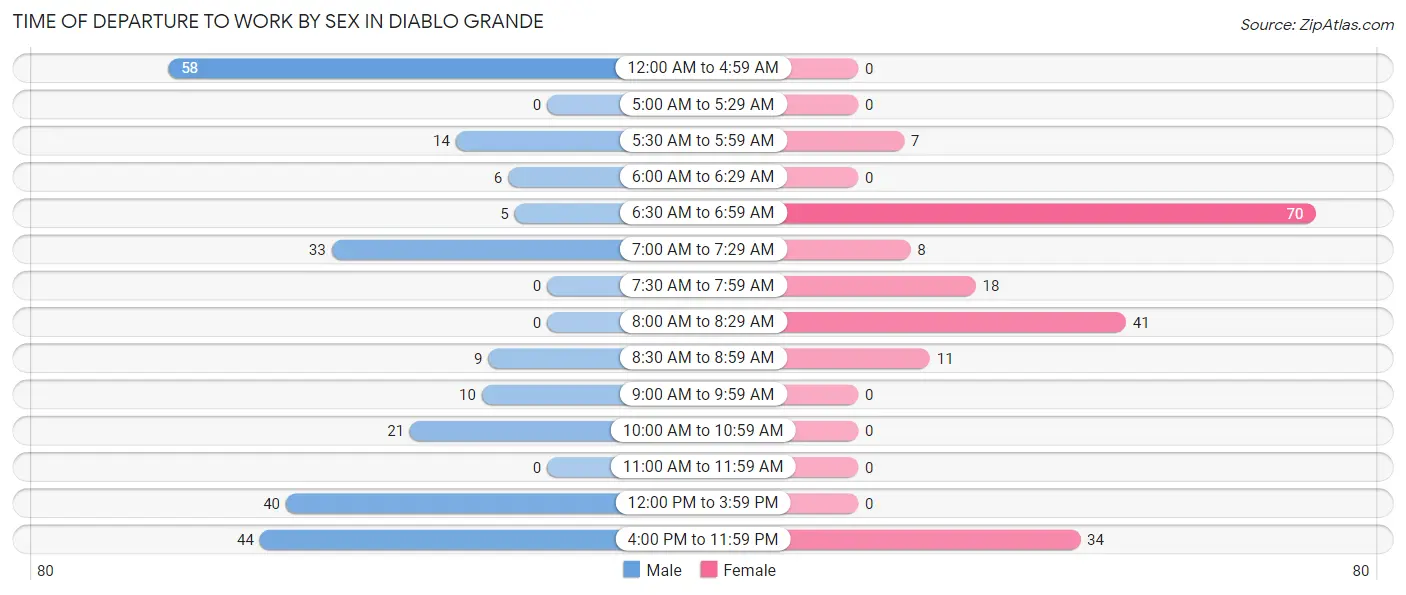
| Time of Departure | Male | Female |
| 12:00 AM to 4:59 AM | 58 (24.2%) | 0 (0.0%) |
| 5:00 AM to 5:29 AM | 0 (0.0%) | 0 (0.0%) |
| 5:30 AM to 5:59 AM | 14 (5.8%) | 7 (3.7%) |
| 6:00 AM to 6:29 AM | 6 (2.5%) | 0 (0.0%) |
| 6:30 AM to 6:59 AM | 5 (2.1%) | 70 (37.0%) |
| 7:00 AM to 7:29 AM | 33 (13.8%) | 8 (4.2%) |
| 7:30 AM to 7:59 AM | 0 (0.0%) | 18 (9.5%) |
| 8:00 AM to 8:29 AM | 0 (0.0%) | 41 (21.7%) |
| 8:30 AM to 8:59 AM | 9 (3.7%) | 11 (5.8%) |
| 9:00 AM to 9:59 AM | 10 (4.2%) | 0 (0.0%) |
| 10:00 AM to 10:59 AM | 21 (8.7%) | 0 (0.0%) |
| 11:00 AM to 11:59 AM | 0 (0.0%) | 0 (0.0%) |
| 12:00 PM to 3:59 PM | 40 (16.7%) | 0 (0.0%) |
| 4:00 PM to 11:59 PM | 44 (18.3%) | 34 (18.0%) |
| Total | 240 (100.0%) | 189 (100.0%) |
Housing Occupancy in Diablo Grande
Occupancy by Ownership in Diablo Grande
Of the total 462 dwellings in Diablo Grande, owner-occupied units account for 419 (90.7%), while renter-occupied units make up 43 (9.3%).
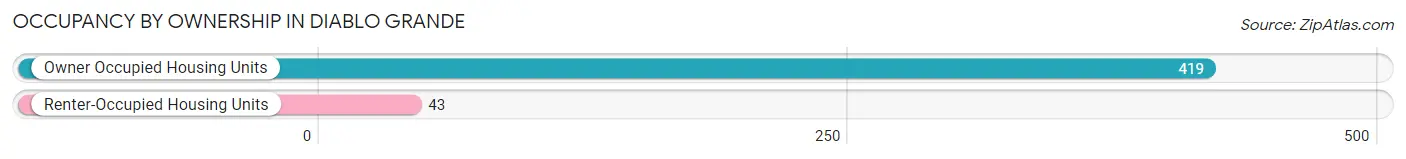
| Occupancy | # Housing Units | % Housing Units |
| Owner Occupied Housing Units | 419 | 90.7% |
| Renter-Occupied Housing Units | 43 | 9.3% |
| Total Occupied Housing Units | 462 | 100.0% |
Occupancy by Household Size in Diablo Grande
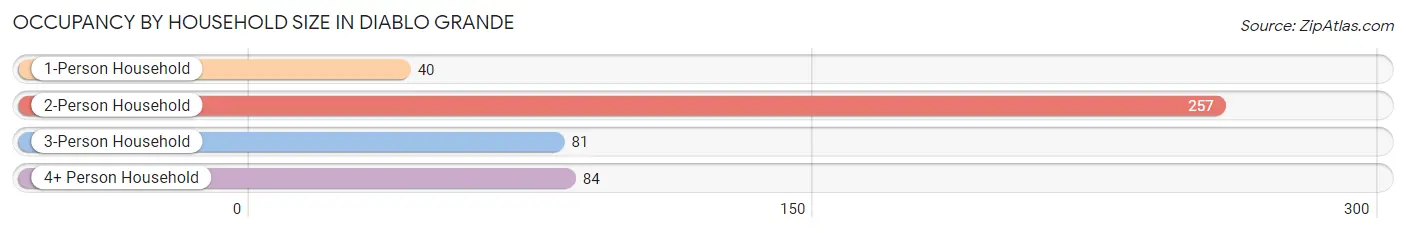
| Household Size | # Housing Units | % Housing Units |
| 1-Person Household | 40 | 8.7% |
| 2-Person Household | 257 | 55.6% |
| 3-Person Household | 81 | 17.5% |
| 4+ Person Household | 84 | 18.2% |
| Total Housing Units | 462 | 100.0% |
Occupancy by Ownership by Household Size in Diablo Grande
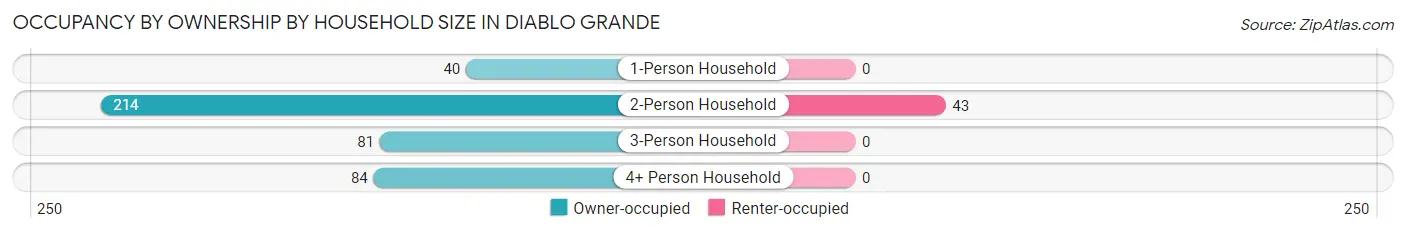
| Household Size | Owner-occupied | Renter-occupied |
| 1-Person Household | 40 (100.0%) | 0 (0.0%) |
| 2-Person Household | 214 (83.3%) | 43 (16.7%) |
| 3-Person Household | 81 (100.0%) | 0 (0.0%) |
| 4+ Person Household | 84 (100.0%) | 0 (0.0%) |
| Total Housing Units | 419 (90.7%) | 43 (9.3%) |
Occupancy by Educational Attainment in Diablo Grande
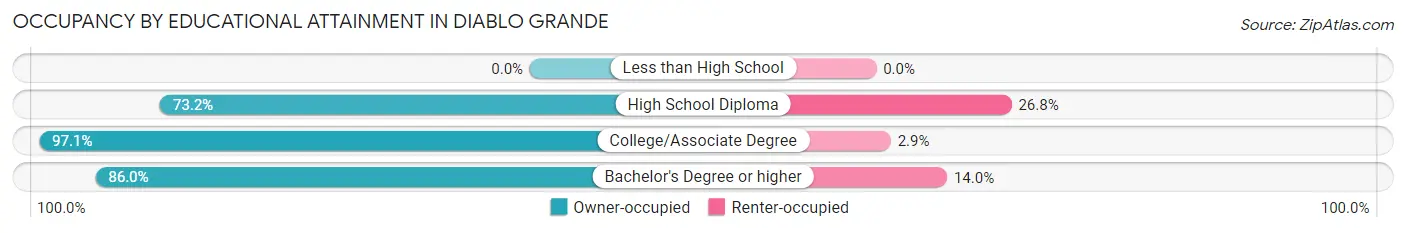
| Household Size | Owner-occupied | Renter-occupied |
| Less than High School | 0 (0.0%) | 0 (0.0%) |
| High School Diploma | 30 (73.2%) | 11 (26.8%) |
| College/Associate Degree | 236 (97.1%) | 7 (2.9%) |
| Bachelor's Degree or higher | 153 (86.0%) | 25 (14.0%) |
Occupancy by Age of Householder in Diablo Grande
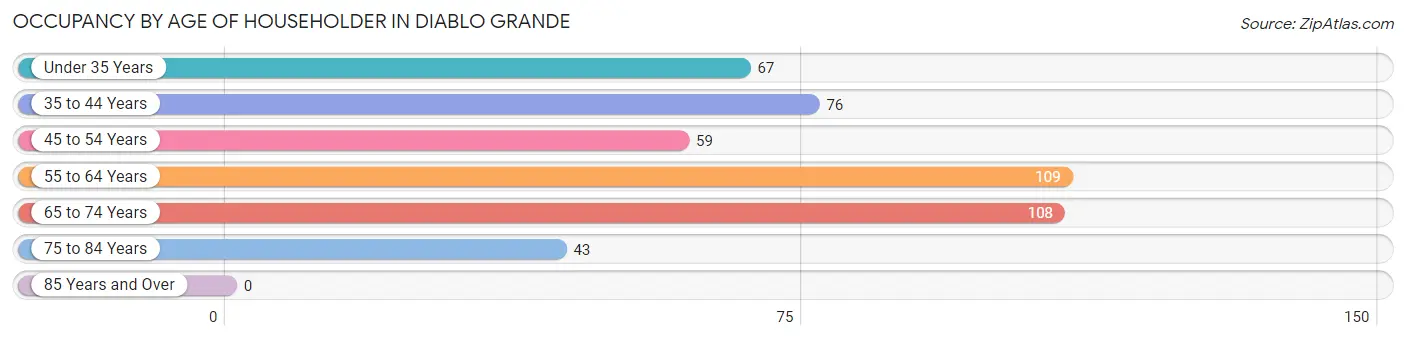
| Age Bracket | # Households | % Households |
| Under 35 Years | 67 | 14.5% |
| 35 to 44 Years | 76 | 16.5% |
| 45 to 54 Years | 59 | 12.8% |
| 55 to 64 Years | 109 | 23.6% |
| 65 to 74 Years | 108 | 23.4% |
| 75 to 84 Years | 43 | 9.3% |
| 85 Years and Over | 0 | 0.0% |
| Total | 462 | 100.0% |
Housing Finances in Diablo Grande
Median Income by Occupancy in Diablo Grande
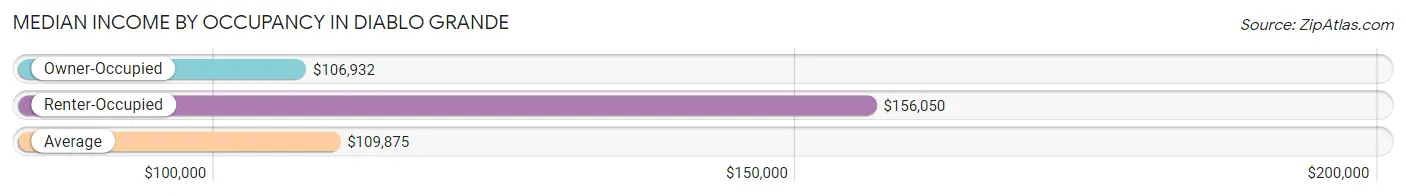
| Occupancy Type | # Households | Median Income |
| Owner-Occupied | 419 (90.7%) | $106,932 |
| Renter-Occupied | 43 (9.3%) | $156,050 |
| Average | 462 (100.0%) | $109,875 |
Occupancy by Householder Income Bracket in Diablo Grande
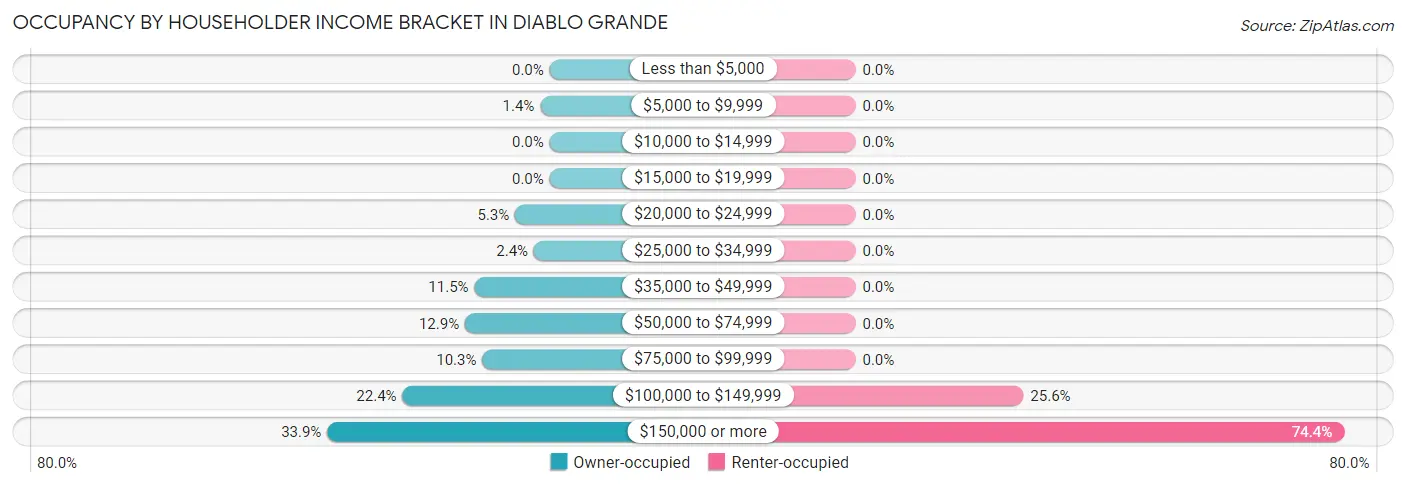
| Income Bracket | Owner-occupied | Renter-occupied |
| Less than $5,000 | 0 (0.0%) | 0 (0.0%) |
| $5,000 to $9,999 | 6 (1.4%) | 0 (0.0%) |
| $10,000 to $14,999 | 0 (0.0%) | 0 (0.0%) |
| $15,000 to $19,999 | 0 (0.0%) | 0 (0.0%) |
| $20,000 to $24,999 | 22 (5.2%) | 0 (0.0%) |
| $25,000 to $34,999 | 10 (2.4%) | 0 (0.0%) |
| $35,000 to $49,999 | 48 (11.5%) | 0 (0.0%) |
| $50,000 to $74,999 | 54 (12.9%) | 0 (0.0%) |
| $75,000 to $99,999 | 43 (10.3%) | 0 (0.0%) |
| $100,000 to $149,999 | 94 (22.4%) | 11 (25.6%) |
| $150,000 or more | 142 (33.9%) | 32 (74.4%) |
| Total | 419 (100.0%) | 43 (100.0%) |
Monthly Housing Cost Tiers in Diablo Grande
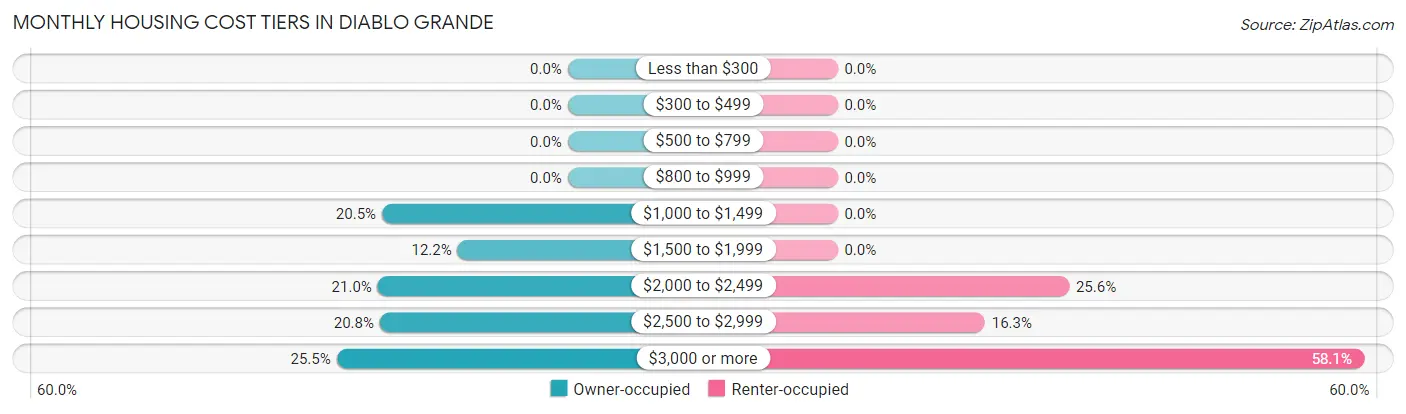
| Monthly Cost | Owner-occupied | Renter-occupied |
| Less than $300 | 0 (0.0%) | 0 (0.0%) |
| $300 to $499 | 0 (0.0%) | 0 (0.0%) |
| $500 to $799 | 0 (0.0%) | 0 (0.0%) |
| $800 to $999 | 0 (0.0%) | 0 (0.0%) |
| $1,000 to $1,499 | 86 (20.5%) | 0 (0.0%) |
| $1,500 to $1,999 | 51 (12.2%) | 0 (0.0%) |
| $2,000 to $2,499 | 88 (21.0%) | 11 (25.6%) |
| $2,500 to $2,999 | 87 (20.8%) | 7 (16.3%) |
| $3,000 or more | 107 (25.5%) | 25 (58.1%) |
| Total | 419 (100.0%) | 43 (100.0%) |
Physical Housing Characteristics in Diablo Grande
Housing Structures in Diablo Grande
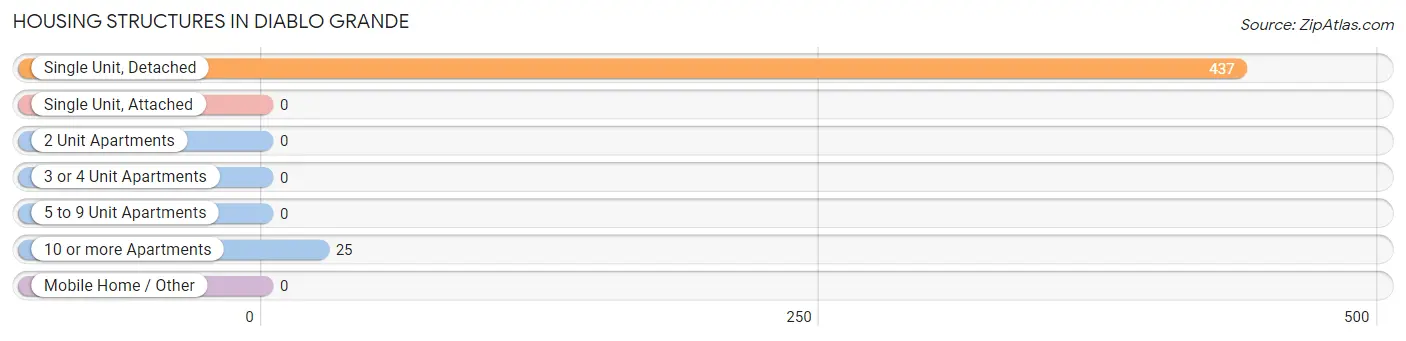
| Structure Type | # Housing Units | % Housing Units |
| Single Unit, Detached | 437 | 94.6% |
| Single Unit, Attached | 0 | 0.0% |
| 2 Unit Apartments | 0 | 0.0% |
| 3 or 4 Unit Apartments | 0 | 0.0% |
| 5 to 9 Unit Apartments | 0 | 0.0% |
| 10 or more Apartments | 25 | 5.4% |
| Mobile Home / Other | 0 | 0.0% |
| Total | 462 | 100.0% |
Housing Structures by Occupancy in Diablo Grande
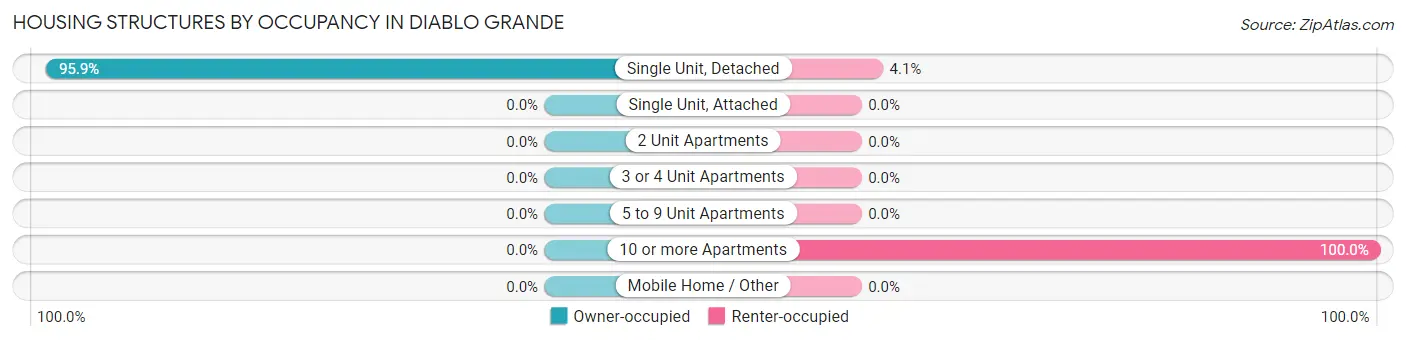
| Structure Type | Owner-occupied | Renter-occupied |
| Single Unit, Detached | 419 (95.9%) | 18 (4.1%) |
| Single Unit, Attached | 0 (0.0%) | 0 (0.0%) |
| 2 Unit Apartments | 0 (0.0%) | 0 (0.0%) |
| 3 or 4 Unit Apartments | 0 (0.0%) | 0 (0.0%) |
| 5 to 9 Unit Apartments | 0 (0.0%) | 0 (0.0%) |
| 10 or more Apartments | 0 (0.0%) | 25 (100.0%) |
| Mobile Home / Other | 0 (0.0%) | 0 (0.0%) |
| Total | 419 (90.7%) | 43 (9.3%) |
Housing Structures by Number of Rooms in Diablo Grande
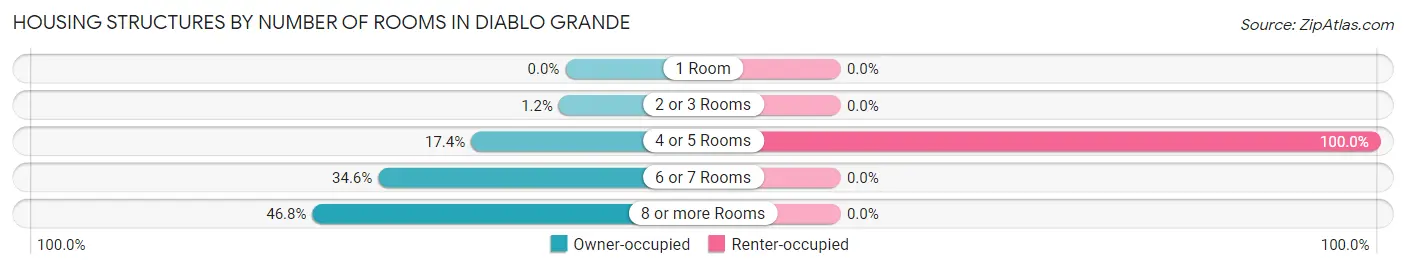
| Number of Rooms | Owner-occupied | Renter-occupied |
| 1 Room | 0 (0.0%) | 0 (0.0%) |
| 2 or 3 Rooms | 5 (1.2%) | 0 (0.0%) |
| 4 or 5 Rooms | 73 (17.4%) | 43 (100.0%) |
| 6 or 7 Rooms | 145 (34.6%) | 0 (0.0%) |
| 8 or more Rooms | 196 (46.8%) | 0 (0.0%) |
| Total | 419 (100.0%) | 43 (100.0%) |
Housing Structure by Heating Type in Diablo Grande
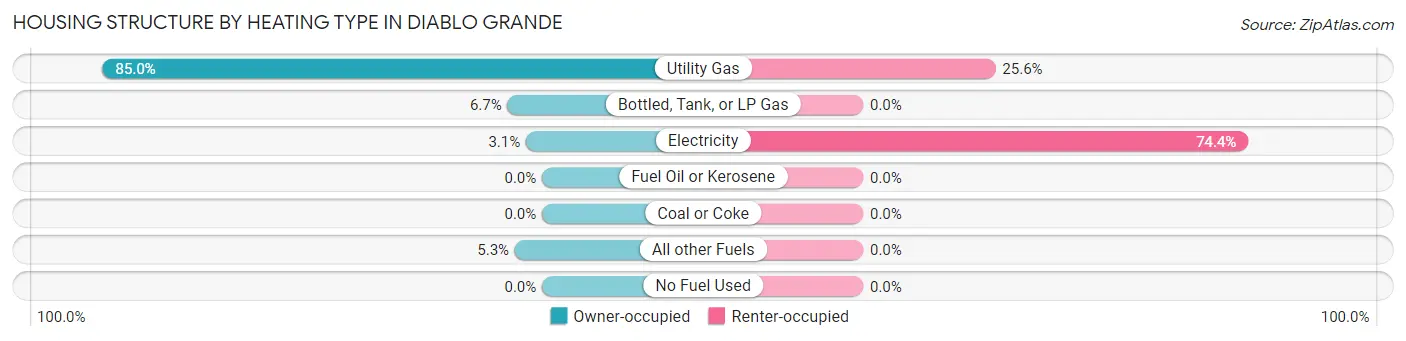
| Heating Type | Owner-occupied | Renter-occupied |
| Utility Gas | 356 (85.0%) | 11 (25.6%) |
| Bottled, Tank, or LP Gas | 28 (6.7%) | 0 (0.0%) |
| Electricity | 13 (3.1%) | 32 (74.4%) |
| Fuel Oil or Kerosene | 0 (0.0%) | 0 (0.0%) |
| Coal or Coke | 0 (0.0%) | 0 (0.0%) |
| All other Fuels | 22 (5.2%) | 0 (0.0%) |
| No Fuel Used | 0 (0.0%) | 0 (0.0%) |
| Total | 419 (100.0%) | 43 (100.0%) |
Household Vehicle Usage in Diablo Grande
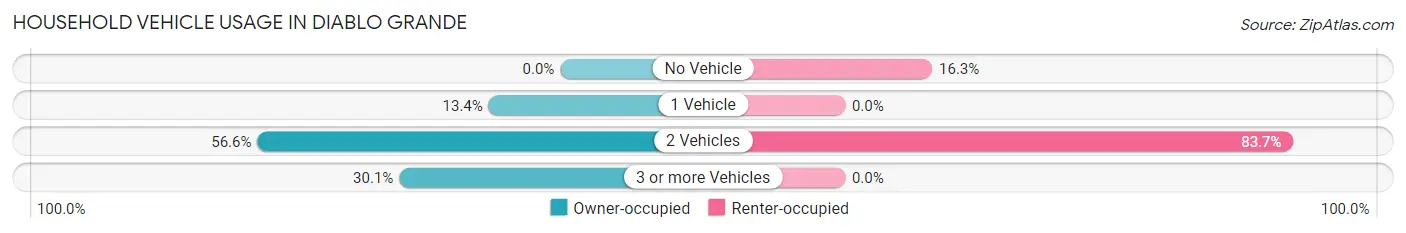
| Vehicles per Household | Owner-occupied | Renter-occupied |
| No Vehicle | 0 (0.0%) | 7 (16.3%) |
| 1 Vehicle | 56 (13.4%) | 0 (0.0%) |
| 2 Vehicles | 237 (56.6%) | 36 (83.7%) |
| 3 or more Vehicles | 126 (30.1%) | 0 (0.0%) |
| Total | 419 (100.0%) | 43 (100.0%) |
Real Estate & Mortgages in Diablo Grande
Real Estate and Mortgage Overview in Diablo Grande
| Characteristic | Without Mortgage | With Mortgage |
| Housing Units | 80 | 339 |
| Median Property Value | $564,800 | $474,100 |
| Median Household Income | $58,250 | $142 |
| Monthly Housing Costs | $1,156 | $107 |
| Real Estate Taxes | $7,727 | $0 |
Property Value by Mortgage Status in Diablo Grande
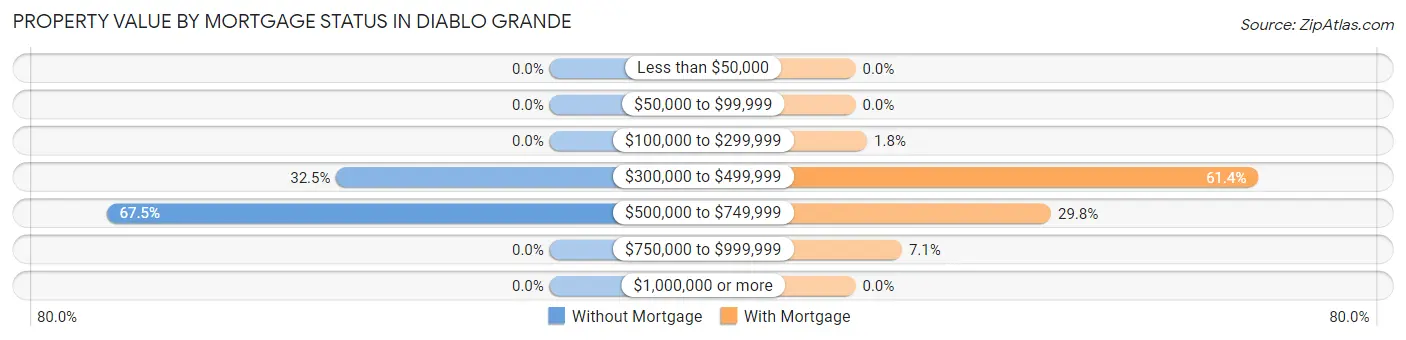
| Property Value | Without Mortgage | With Mortgage |
| Less than $50,000 | 0 (0.0%) | 0 (0.0%) |
| $50,000 to $99,999 | 0 (0.0%) | 0 (0.0%) |
| $100,000 to $299,999 | 0 (0.0%) | 6 (1.8%) |
| $300,000 to $499,999 | 26 (32.5%) | 208 (61.4%) |
| $500,000 to $749,999 | 54 (67.5%) | 101 (29.8%) |
| $750,000 to $999,999 | 0 (0.0%) | 24 (7.1%) |
| $1,000,000 or more | 0 (0.0%) | 0 (0.0%) |
| Total | 80 (100.0%) | 339 (100.0%) |
Household Income by Mortgage Status in Diablo Grande
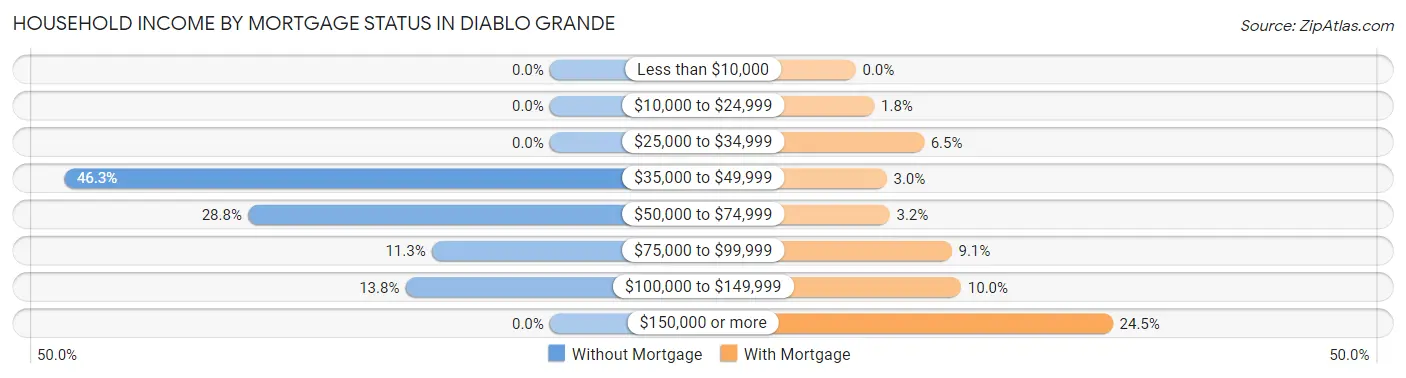
| Household Income | Without Mortgage | With Mortgage |
| Less than $10,000 | 0 (0.0%) | 0 (0.0%) |
| $10,000 to $24,999 | 0 (0.0%) | 6 (1.8%) |
| $25,000 to $34,999 | 0 (0.0%) | 22 (6.5%) |
| $35,000 to $49,999 | 37 (46.3%) | 10 (2.9%) |
| $50,000 to $74,999 | 23 (28.7%) | 11 (3.2%) |
| $75,000 to $99,999 | 9 (11.3%) | 31 (9.1%) |
| $100,000 to $149,999 | 11 (13.8%) | 34 (10.0%) |
| $150,000 or more | 0 (0.0%) | 83 (24.5%) |
| Total | 80 (100.0%) | 339 (100.0%) |
Property Value to Household Income Ratio in Diablo Grande
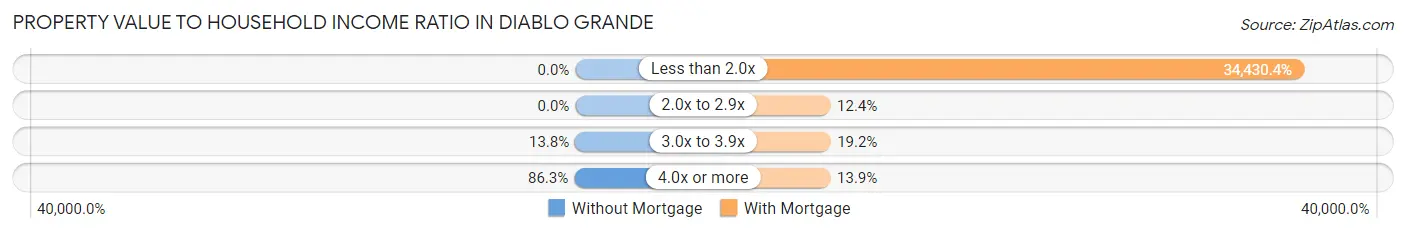
| Value-to-Income Ratio | Without Mortgage | With Mortgage |
| Less than 2.0x | 0 (0.0%) | 116,719 (34,430.4%) |
| 2.0x to 2.9x | 0 (0.0%) | 42 (12.4%) |
| 3.0x to 3.9x | 11 (13.8%) | 65 (19.2%) |
| 4.0x or more | 69 (86.3%) | 47 (13.9%) |
| Total | 80 (100.0%) | 339 (100.0%) |
Real Estate Taxes by Mortgage Status in Diablo Grande
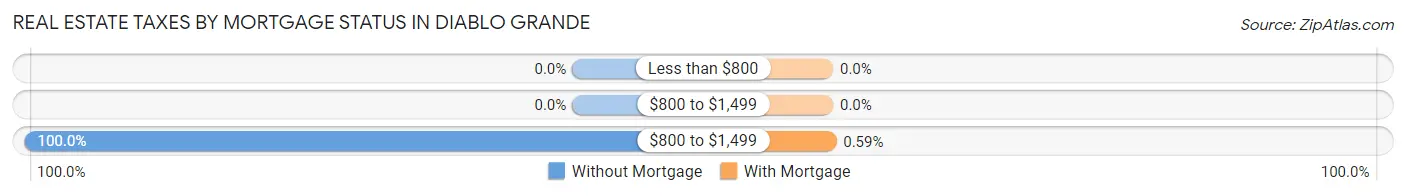
| Property Taxes | Without Mortgage | With Mortgage |
| Less than $800 | 0 (0.0%) | 0 (0.0%) |
| $800 to $1,499 | 0 (0.0%) | 0 (0.0%) |
| $800 to $1,499 | 80 (100.0%) | 2 (0.6%) |
| Total | 80 (100.0%) | 339 (100.0%) |
Health & Disability in Diablo Grande
Health Insurance Coverage by Age in Diablo Grande
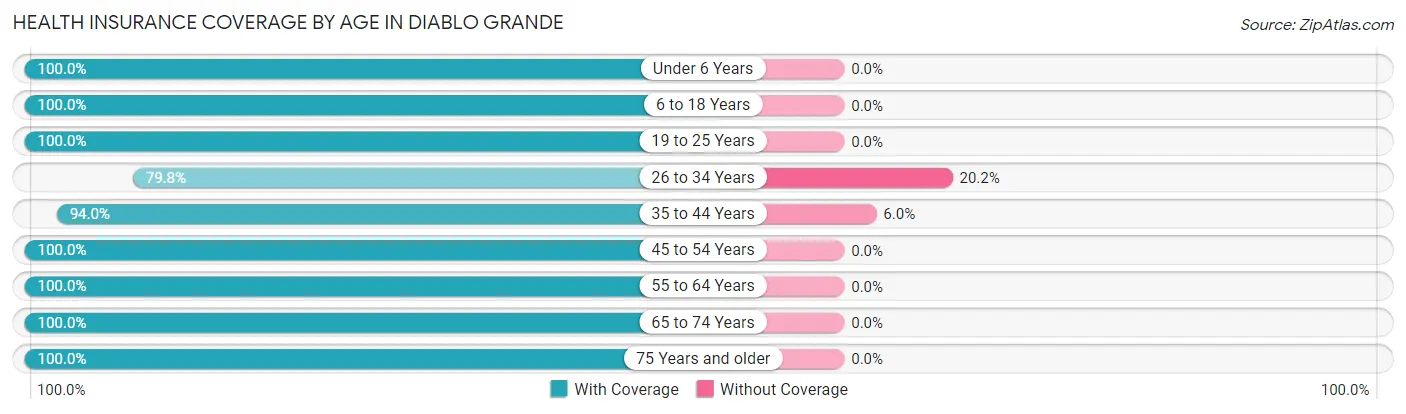
| Age Bracket | With Coverage | Without Coverage |
| Under 6 Years | 19 (100.0%) | 0 (0.0%) |
| 6 to 18 Years | 222 (100.0%) | 0 (0.0%) |
| 19 to 25 Years | 74 (100.0%) | 0 (0.0%) |
| 26 to 34 Years | 87 (79.8%) | 22 (20.2%) |
| 35 to 44 Years | 157 (94.0%) | 10 (6.0%) |
| 45 to 54 Years | 140 (100.0%) | 0 (0.0%) |
| 55 to 64 Years | 193 (100.0%) | 0 (0.0%) |
| 65 to 74 Years | 236 (100.0%) | 0 (0.0%) |
| 75 Years and older | 97 (100.0%) | 0 (0.0%) |
| Total | 1,225 (97.5%) | 32 (2.5%) |
Health Insurance Coverage by Citizenship Status in Diablo Grande
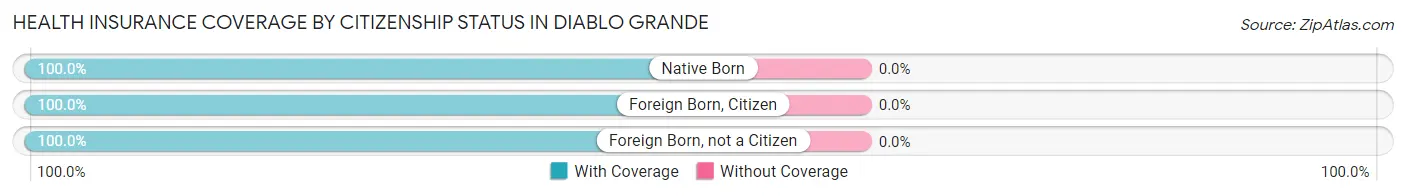
| Citizenship Status | With Coverage | Without Coverage |
| Native Born | 19 (100.0%) | 0 (0.0%) |
| Foreign Born, Citizen | 222 (100.0%) | 0 (0.0%) |
| Foreign Born, not a Citizen | 74 (100.0%) | 0 (0.0%) |
Health Insurance Coverage by Household Income in Diablo Grande
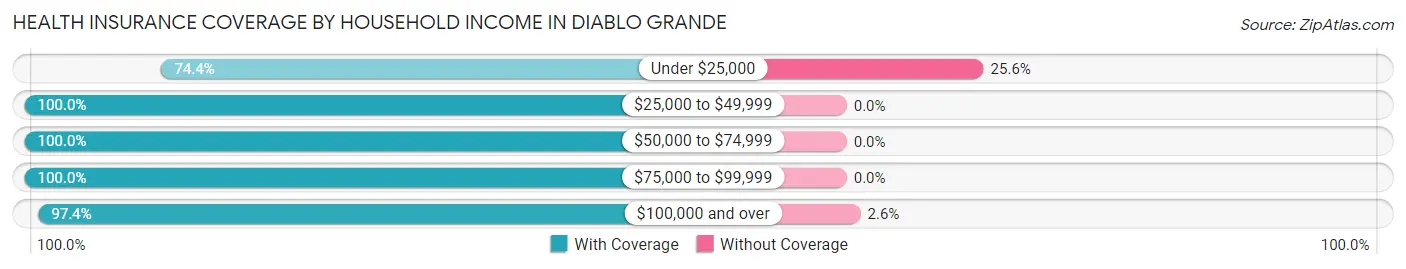
| Household Income | With Coverage | Without Coverage |
| Under $25,000 | 29 (74.4%) | 10 (25.6%) |
| $25,000 to $49,999 | 114 (100.0%) | 0 (0.0%) |
| $50,000 to $74,999 | 157 (100.0%) | 0 (0.0%) |
| $75,000 to $99,999 | 94 (100.0%) | 0 (0.0%) |
| $100,000 and over | 831 (97.4%) | 22 (2.6%) |
Public vs Private Health Insurance Coverage by Age in Diablo Grande
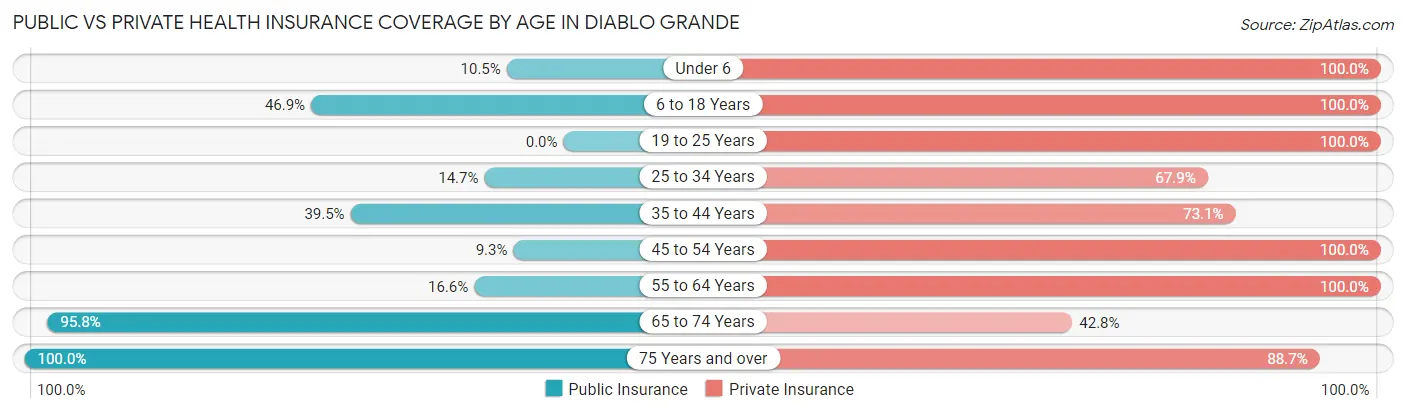
| Age Bracket | Public Insurance | Private Insurance |
| Under 6 | 2 (10.5%) | 19 (100.0%) |
| 6 to 18 Years | 104 (46.9%) | 222 (100.0%) |
| 19 to 25 Years | 0 (0.0%) | 74 (100.0%) |
| 25 to 34 Years | 16 (14.7%) | 74 (67.9%) |
| 35 to 44 Years | 66 (39.5%) | 122 (73.1%) |
| 45 to 54 Years | 13 (9.3%) | 140 (100.0%) |
| 55 to 64 Years | 32 (16.6%) | 193 (100.0%) |
| 65 to 74 Years | 226 (95.8%) | 101 (42.8%) |
| 75 Years and over | 97 (100.0%) | 86 (88.7%) |
| Total | 556 (44.2%) | 1,031 (82.0%) |
Disability Status by Sex by Age in Diablo Grande
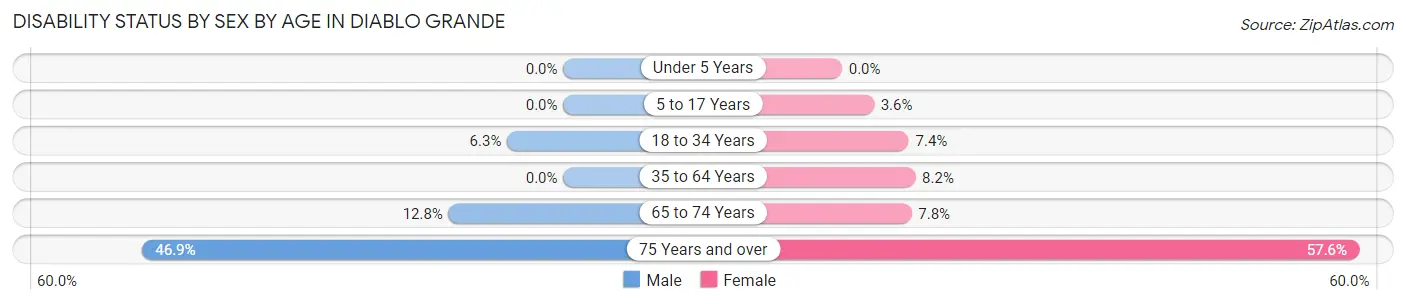
| Age Bracket | Male | Female |
| Under 5 Years | 0 (0.0%) | 0 (0.0%) |
| 5 to 17 Years | 0 (0.0%) | 6 (3.5%) |
| 18 to 34 Years | 4 (6.2%) | 9 (7.4%) |
| 35 to 64 Years | 0 (0.0%) | 17 (8.2%) |
| 65 to 74 Years | 12 (12.8%) | 11 (7.7%) |
| 75 Years and over | 30 (46.9%) | 19 (57.6%) |
Disability Class by Sex by Age in Diablo Grande
Disability Class: Hearing Difficulty
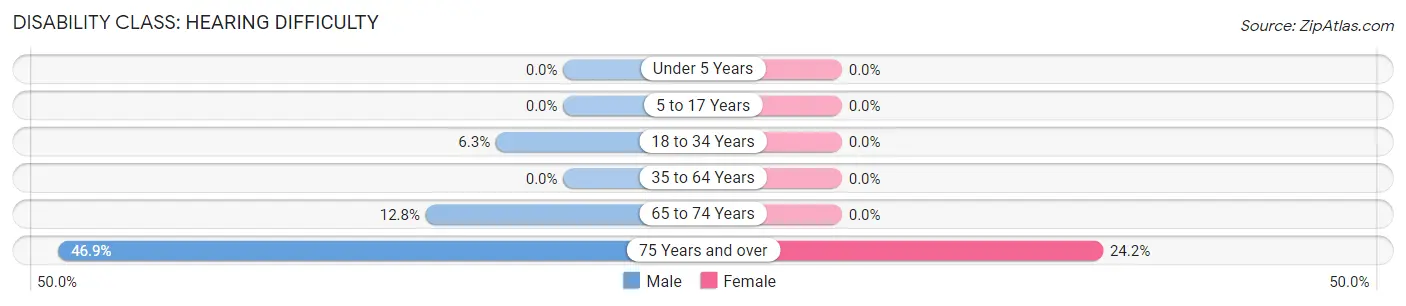
| Age Bracket | Male | Female |
| Under 5 Years | 0 (0.0%) | 0 (0.0%) |
| 5 to 17 Years | 0 (0.0%) | 0 (0.0%) |
| 18 to 34 Years | 4 (6.2%) | 0 (0.0%) |
| 35 to 64 Years | 0 (0.0%) | 0 (0.0%) |
| 65 to 74 Years | 12 (12.8%) | 0 (0.0%) |
| 75 Years and over | 30 (46.9%) | 8 (24.2%) |
Disability Class: Vision Difficulty
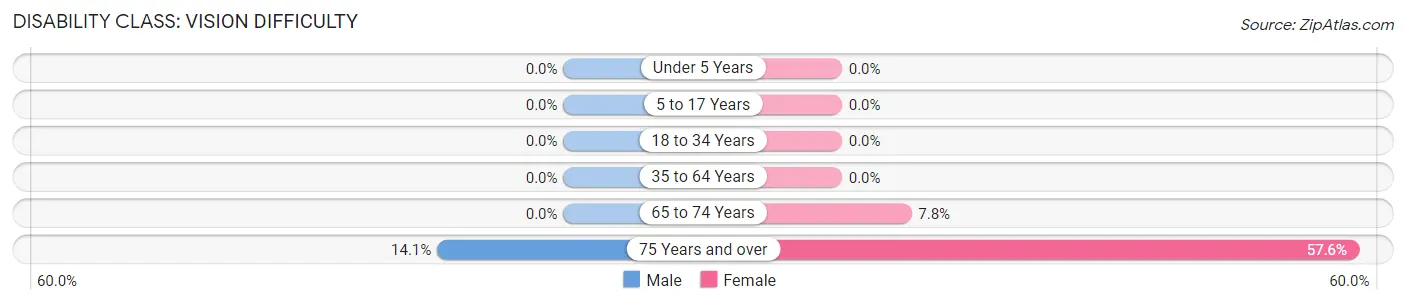
| Age Bracket | Male | Female |
| Under 5 Years | 0 (0.0%) | 0 (0.0%) |
| 5 to 17 Years | 0 (0.0%) | 0 (0.0%) |
| 18 to 34 Years | 0 (0.0%) | 0 (0.0%) |
| 35 to 64 Years | 0 (0.0%) | 0 (0.0%) |
| 65 to 74 Years | 0 (0.0%) | 11 (7.7%) |
| 75 Years and over | 9 (14.1%) | 19 (57.6%) |
Disability Class: Cognitive Difficulty
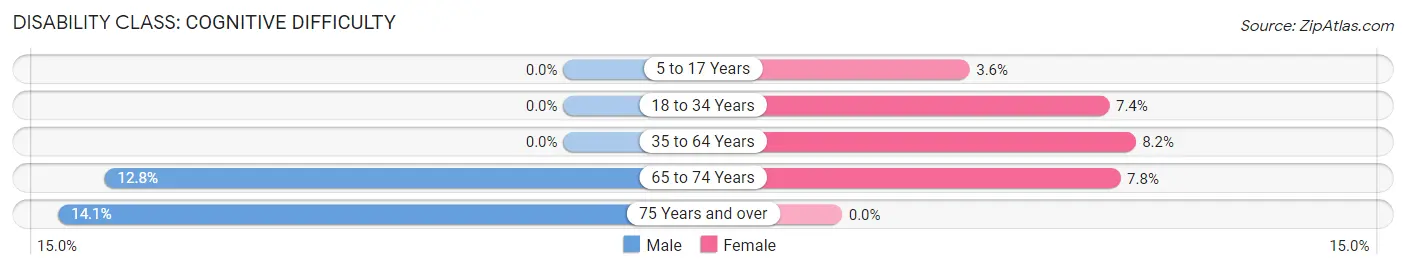
| Age Bracket | Male | Female |
| 5 to 17 Years | 0 (0.0%) | 6 (3.5%) |
| 18 to 34 Years | 0 (0.0%) | 9 (7.4%) |
| 35 to 64 Years | 0 (0.0%) | 17 (8.2%) |
| 65 to 74 Years | 12 (12.8%) | 11 (7.7%) |
| 75 Years and over | 9 (14.1%) | 0 (0.0%) |
Disability Class: Ambulatory Difficulty
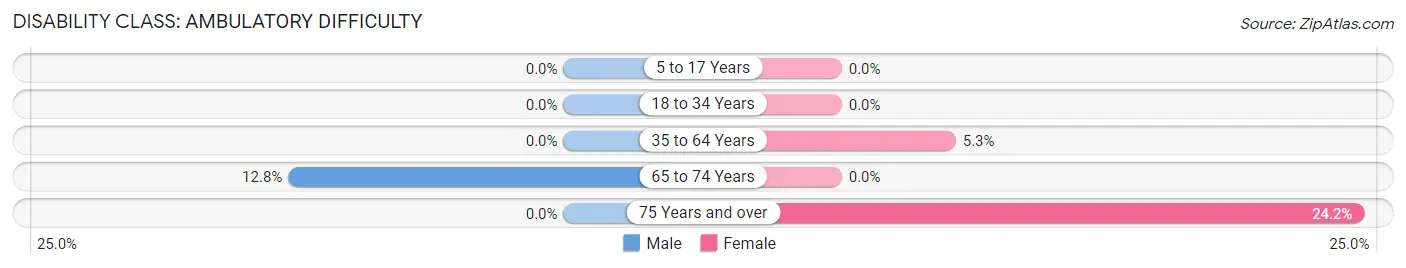
| Age Bracket | Male | Female |
| 5 to 17 Years | 0 (0.0%) | 0 (0.0%) |
| 18 to 34 Years | 0 (0.0%) | 0 (0.0%) |
| 35 to 64 Years | 0 (0.0%) | 11 (5.3%) |
| 65 to 74 Years | 12 (12.8%) | 0 (0.0%) |
| 75 Years and over | 0 (0.0%) | 8 (24.2%) |
Disability Class: Self-Care Difficulty
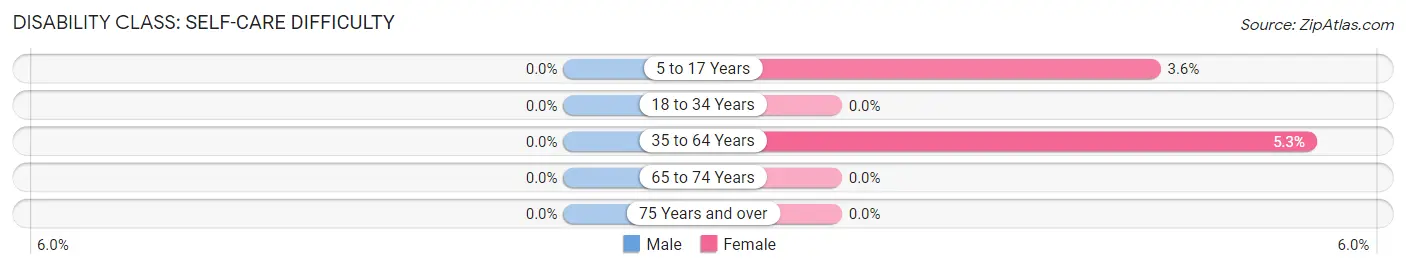
| Age Bracket | Male | Female |
| 5 to 17 Years | 0 (0.0%) | 6 (3.5%) |
| 18 to 34 Years | 0 (0.0%) | 0 (0.0%) |
| 35 to 64 Years | 0 (0.0%) | 11 (5.3%) |
| 65 to 74 Years | 0 (0.0%) | 0 (0.0%) |
| 75 Years and over | 0 (0.0%) | 0 (0.0%) |
Technology Access in Diablo Grande
Computing Device Access in Diablo Grande
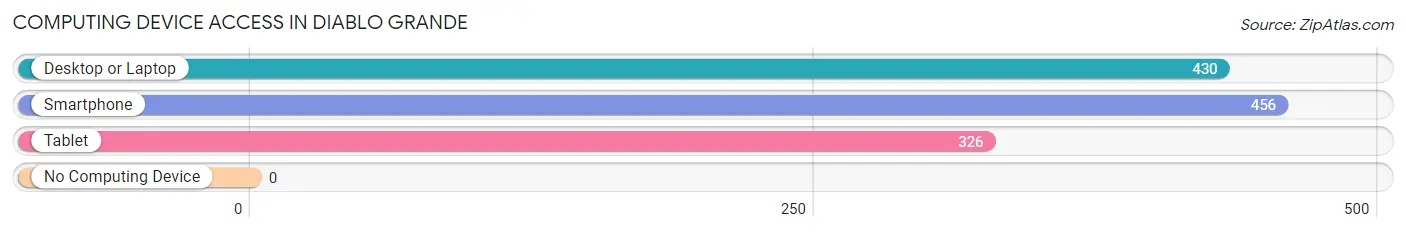
| Device Type | # Households | % Households |
| Desktop or Laptop | 430 | 93.1% |
| Smartphone | 456 | 98.7% |
| Tablet | 326 | 70.6% |
| No Computing Device | 0 | 0.0% |
| Total | 462 | 100.0% |
Internet Access in Diablo Grande
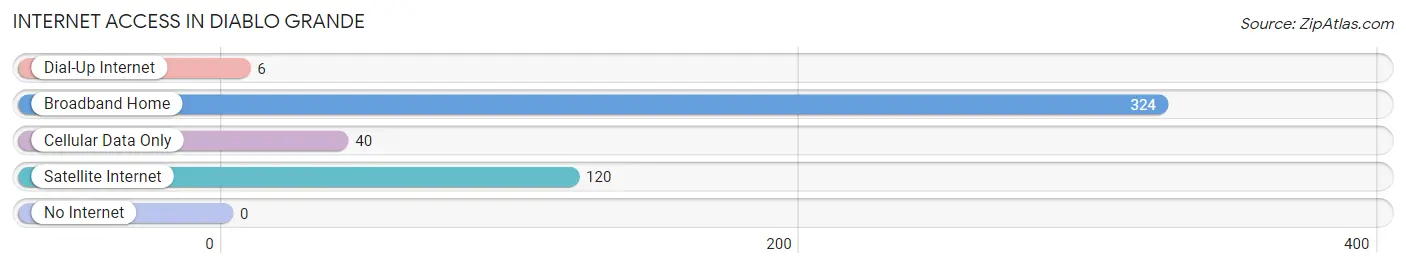
| Internet Type | # Households | % Households |
| Dial-Up Internet | 6 | 1.3% |
| Broadband Home | 324 | 70.1% |
| Cellular Data Only | 40 | 8.7% |
| Satellite Internet | 120 | 26.0% |
| No Internet | 0 | 0.0% |
| Total | 462 | 100.0% |
Diablo Grande Summary
Diablo Grande, California is a small unincorporated community located in Stanislaus County, California. It is situated in the Diablo Grande Valley, which is part of the Central Valley of California. The community is located approximately 25 miles east of Modesto and is bordered by the cities of Patterson and Newman. The population of Diablo Grande was estimated to be 1,845 in 2019.
History
Diablo Grande was originally inhabited by the Yokuts Native American tribe. The area was first settled by Europeans in the late 1800s, when a group of settlers from the East Coast arrived in the area. The settlers established a small farming community and named it Diablo Grande, after the nearby Diablo Grande Creek.
In the early 1900s, the area began to experience rapid growth due to the development of the railroad and the construction of the nearby Patterson Dam. This led to the establishment of a post office in the area in 1910.
In the 1950s, the area experienced a population boom due to the development of the nearby Patterson Air Force Base. This led to the construction of several housing developments in the area, which further increased the population.
Geography
Diablo Grande is located in the Diablo Grande Valley, which is part of the Central Valley of California. The valley is surrounded by rolling hills and is home to several small lakes and streams. The area is known for its mild climate and fertile soil, which makes it ideal for farming and ranching.
The community is located approximately 25 miles east of Modesto and is bordered by the cities of Patterson and Newman. The nearest major city is Stockton, which is located approximately 40 miles to the north.
Economy
The economy of Diablo Grande is largely based on agriculture. The area is home to several large farms and ranches, which produce a variety of crops, including almonds, walnuts, grapes, and tomatoes. The area is also home to several wineries, which produce a variety of wines.
In addition to agriculture, the area is also home to several small businesses, including restaurants, retail stores, and auto repair shops. The area is also home to several manufacturing companies, which produce a variety of products, including furniture, clothing, and electronics.
Demographics
The population of Diablo Grande was estimated to be 1,845 in 2019. The population is largely Hispanic, with approximately 75% of the population identifying as Hispanic or Latino. The median age of the population is 33.5 years, and the median household income is $50,000.
Conclusion
Diablo Grande, California is a small unincorporated community located in Stanislaus County, California. It is situated in the Diablo Grande Valley, which is part of the Central Valley of California. The community is located approximately 25 miles east of Modesto and is bordered by the cities of Patterson and Newman. The population of Diablo Grande was estimated to be 1,845 in 2019. The economy of Diablo Grande is largely based on agriculture, with several large farms and ranches producing a variety of crops. The area is also home to several small businesses, including restaurants, retail stores, and auto repair shops. The population of Diablo Grande is largely Hispanic, with approximately 75% of the population identifying as Hispanic or Latino. The median age of the population is 33.5 years, and the median household income is $50,000.
Common Questions
What is Per Capita Income in Diablo Grande?
Per Capita income in Diablo Grande is $46,777.
What is the Median Family Income in Diablo Grande?
Median Family Income in Diablo Grande is $115,625.
What is the Median Household income in Diablo Grande?
Median Household Income in Diablo Grande is $109,875.
What is Inequality or Gini Index in Diablo Grande?
Inequality or Gini Index in Diablo Grande is 0.34.
What is the Total Population of Diablo Grande?
Total Population of Diablo Grande is 1,257.
What is the Total Male Population of Diablo Grande?
Total Male Population of Diablo Grande is 565.
What is the Total Female Population of Diablo Grande?
Total Female Population of Diablo Grande is 692.
What is the Ratio of Males per 100 Females in Diablo Grande?
There are 81.65 Males per 100 Females in Diablo Grande.
What is the Ratio of Females per 100 Males in Diablo Grande?
There are 122.48 Females per 100 Males in Diablo Grande.
What is the Median Population Age in Diablo Grande?
Median Population Age in Diablo Grande is 48.0 Years.
What is the Average Family Size in Diablo Grande
Average Family Size in Diablo Grande is 2.9 People.
What is the Average Household Size in Diablo Grande
Average Household Size in Diablo Grande is 2.7 People.
How Large is the Labor Force in Diablo Grande?
There are 504 People in the Labor Forcein in Diablo Grande.
What is the Percentage of People in the Labor Force in Diablo Grande?
47.5% of People are in the Labor Force in Diablo Grande.
What is the Unemployment Rate in Diablo Grande?
Unemployment Rate in Diablo Grande is 5.6%.