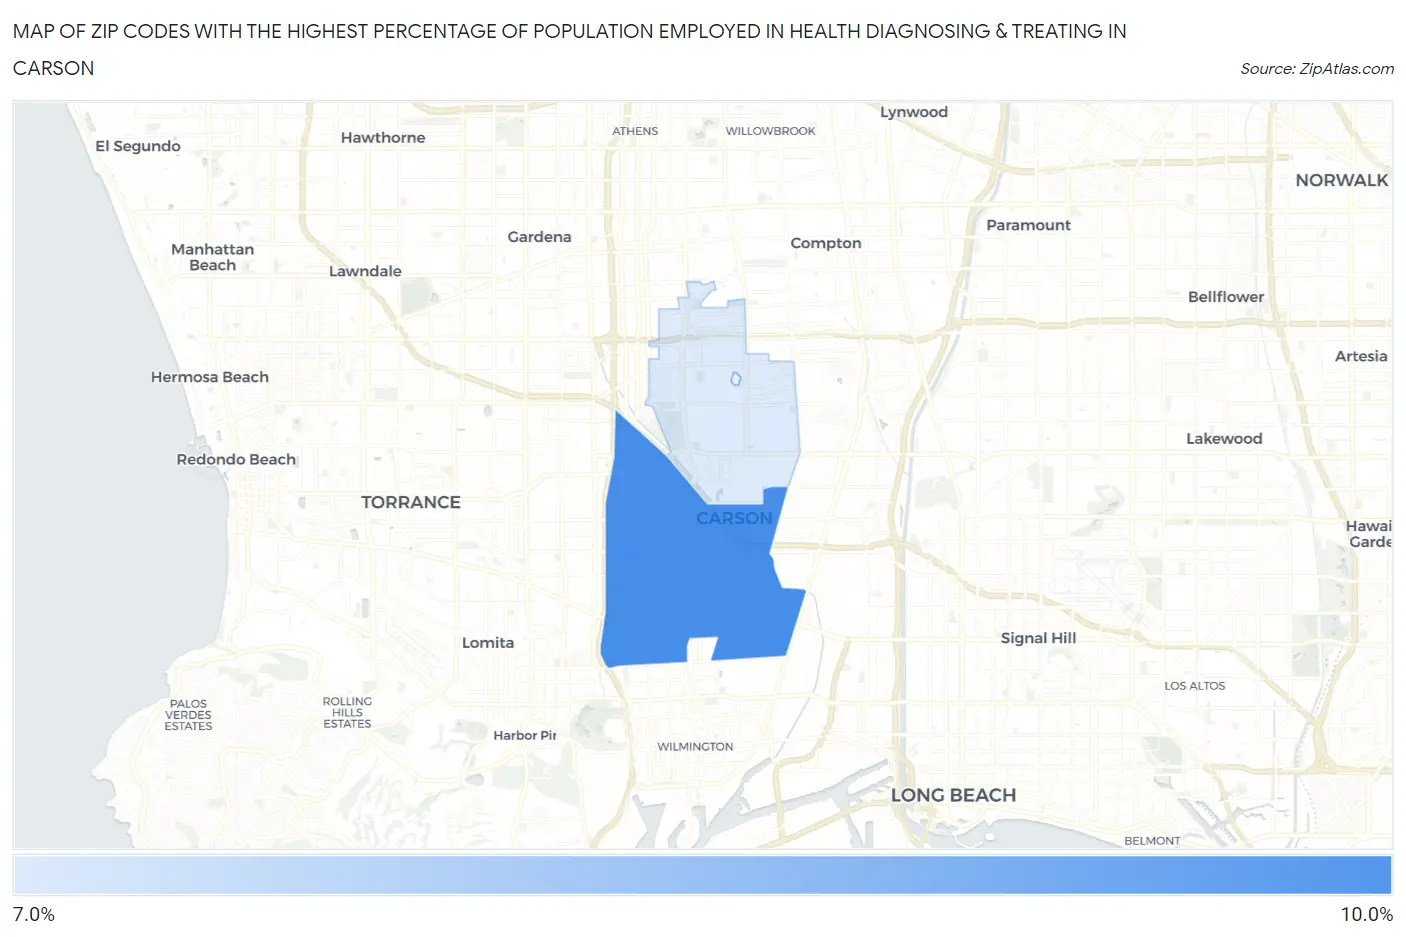
Zip Codes with the Highest Percentage of Population Employed in Health Diagnosing & Treating in Carson, CA
RELATED REPORTS & OPTIONS
Health Diagnosing & Treating
Carson
Compare Zip Codes
Map of Zip Codes with the Highest Percentage of Population Employed in Health Diagnosing & Treating in Carson
7.4%
8.5%
Zip Codes with the Highest Percentage of Population Employed in Health Diagnosing & Treating in Carson, CA
| Zip Code | % Employed | vs State | vs National | |
| 1. | 90745 | 8.5% | 5.3%(+3.18)#208 | 6.2%(+2.25)#6,345 |
| 2. | 90746 | 7.4% | 5.3%(+2.05)#334 | 6.2%(+1.11)#9,234 |
1
Common Questions
What are the Top Zip Codes with the Highest Percentage of Population Employed in Health Diagnosing & Treating in Carson, CA?
Top Zip Codes with the Highest Percentage of Population Employed in Health Diagnosing & Treating in Carson, CA are:
What zip code has the Highest Percentage of Population Employed in Health Diagnosing & Treating in Carson, CA?
90745 has the Highest Percentage of Population Employed in Health Diagnosing & Treating in Carson, CA with 8.5%.
What is the Percentage of Population Employed in Health Diagnosing & Treating in Carson, CA?
Percentage of Population Employed in Health Diagnosing & Treating in Carson is 7.7%.
What is the Percentage of Population Employed in Health Diagnosing & Treating in California?
Percentage of Population Employed in Health Diagnosing & Treating in California is 5.3%.
What is the Percentage of Population Employed in Health Diagnosing & Treating in the United States?
Percentage of Population Employed in Health Diagnosing & Treating in the United States is 6.2%.