Cities with the Highest Percentage of Population Employed in Health Diagnosing & Treating in South Dakota
RELATED REPORTS & OPTIONS
Health Diagnosing & Treating
South Dakota
Compare Cities
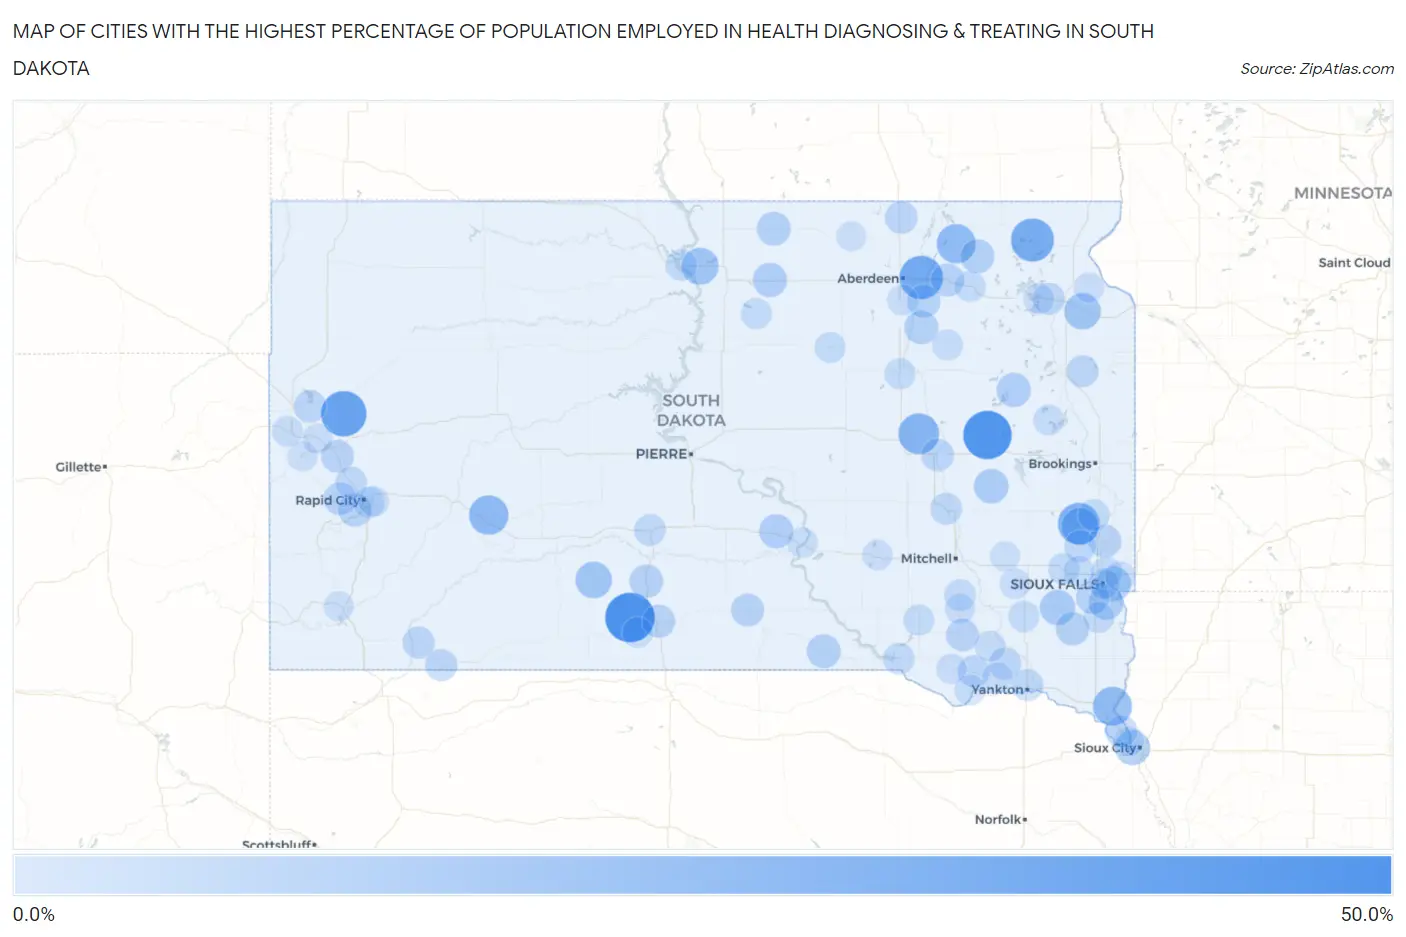
Map of Cities with the Highest Percentage of Population Employed in Health Diagnosing & Treating in South Dakota
0.0%
50.0%
Cities with the Highest Percentage of Population Employed in Health Diagnosing & Treating in South Dakota
| City | % Employed | vs State | vs National | |
| 1. | Soldier Creek | 46.7% | 7.5%(+39.1)#1 | 6.2%(+40.4)#93 |
| 2. | Bancroft | 44.4% | 7.5%(+36.9)#2 | 6.2%(+38.2)#111 |
| 3. | Vale | 38.3% | 7.5%(+30.8)#3 | 6.2%(+32.1)#159 |
| 4. | Bath | 34.0% | 7.5%(+26.5)#4 | 6.2%(+27.8)#216 |
| 5. | Clear Lake | 33.3% | 7.5%(+25.8)#5 | 6.2%(+27.1)#230 |
| 6. | Orland Colony | 33.3% | 7.5%(+25.8)#6 | 6.2%(+27.1)#235 |
| 7. | Brant Lake | 30.6% | 7.5%(+23.1)#7 | 6.2%(+24.4)#296 |
| 8. | Broadland | 28.6% | 7.5%(+21.0)#8 | 6.2%(+22.3)#337 |
| 9. | Prairiewood | 27.7% | 7.5%(+20.1)#9 | 6.2%(+21.4)#358 |
| 10. | Quinn | 25.8% | 7.5%(+18.3)#10 | 6.2%(+19.6)#416 |
| 11. | Claremont | 25.5% | 7.5%(+17.9)#11 | 6.2%(+19.2)#422 |
| 12. | Richland | 25.0% | 7.5%(+17.5)#12 | 6.2%(+18.8)#440 |
| 13. | Glenham | 20.9% | 7.5%(+13.4)#13 | 6.2%(+14.7)#668 |
| 14. | Brant Lake South | 20.9% | 7.5%(+13.3)#14 | 6.2%(+14.6)#670 |
| 15. | Corn Creek | 20.0% | 7.5%(+12.5)#15 | 6.2%(+13.8)#743 |
| 16. | Marvin | 20.0% | 7.5%(+12.5)#16 | 6.2%(+13.8)#757 |
| 17. | Parker | 17.6% | 7.5%(+10.1)#17 | 6.2%(+11.4)#997 |
| 18. | Dakota Dunes | 17.4% | 7.5%(+9.83)#18 | 6.2%(+11.1)#1,025 |
| 19. | Crook | 17.0% | 7.5%(+9.44)#19 | 6.2%(+10.7)#1,088 |
| 20. | Pine Lakes Addition | 16.7% | 7.5%(+9.12)#20 | 6.2%(+10.4)#1,144 |
| 21. | Carthage | 16.5% | 7.5%(+8.91)#21 | 6.2%(+10.2)#1,188 |
| 22. | Harrisburg | 16.3% | 7.5%(+8.80)#22 | 6.2%(+10.1)#1,207 |
| 23. | Mina | 15.9% | 7.5%(+8.33)#23 | 6.2%(+9.63)#1,308 |
| 24. | Bowdle | 15.7% | 7.5%(+8.11)#24 | 6.2%(+9.41)#1,362 |
| 25. | Reliance | 15.4% | 7.5%(+7.84)#25 | 6.2%(+9.14)#1,425 |
| 26. | Naples | 15.4% | 7.5%(+7.84)#26 | 6.2%(+9.14)#1,427 |
| 27. | Langford | 14.9% | 7.5%(+7.40)#27 | 6.2%(+8.70)#1,520 |
| 28. | Herrick | 14.8% | 7.5%(+7.27)#28 | 6.2%(+8.57)#1,553 |
| 29. | Brentford | 14.6% | 7.5%(+7.09)#29 | 6.2%(+8.39)#1,604 |
| 30. | Eureka | 14.6% | 7.5%(+7.06)#30 | 6.2%(+8.36)#1,615 |
| 31. | White River | 14.3% | 7.5%(+6.74)#31 | 6.2%(+8.04)#1,701 |
| 32. | Davis | 14.0% | 7.5%(+6.41)#32 | 6.2%(+7.71)#1,817 |
| 33. | Colonial Pine Hills | 13.7% | 7.5%(+6.17)#33 | 6.2%(+7.47)#1,902 |
| 34. | Angostura | 13.6% | 7.5%(+6.09)#34 | 6.2%(+7.39)#1,935 |
| 35. | Stratford | 13.5% | 7.5%(+5.97)#35 | 6.2%(+7.27)#1,977 |
| 36. | Antelope | 13.4% | 7.5%(+5.85)#36 | 6.2%(+7.15)#2,027 |
| 37. | Tea | 13.3% | 7.5%(+5.76)#37 | 6.2%(+7.06)#2,063 |
| 38. | Groton | 13.3% | 7.5%(+5.75)#38 | 6.2%(+7.05)#2,064 |
| 39. | Winner | 13.3% | 7.5%(+5.72)#39 | 6.2%(+7.02)#2,078 |
| 40. | Johnson Siding | 13.1% | 7.5%(+5.58)#40 | 6.2%(+6.88)#2,130 |
| 41. | Dell Rapids | 13.0% | 7.5%(+5.47)#41 | 6.2%(+6.77)#2,181 |
| 42. | Blucksberg Mountain | 12.8% | 7.5%(+5.25)#42 | 6.2%(+6.55)#2,292 |
| 43. | Tripp | 12.6% | 7.5%(+5.08)#43 | 6.2%(+6.38)#2,364 |
| 44. | Morningside | 12.5% | 7.5%(+4.96)#44 | 6.2%(+6.26)#2,438 |
| 45. | Frederick | 12.3% | 7.5%(+4.72)#45 | 6.2%(+6.02)#2,549 |
| 46. | Fruitdale | 12.2% | 7.5%(+4.65)#46 | 6.2%(+5.95)#2,580 |
| 47. | Ortley | 11.8% | 7.5%(+4.22)#47 | 6.2%(+5.52)#2,804 |
| 48. | Lesterville | 11.7% | 7.5%(+4.14)#48 | 6.2%(+5.44)#2,846 |
| 49. | Oglala | 11.5% | 7.5%(+3.94)#49 | 6.2%(+5.24)#3,001 |
| 50. | Jefferson | 11.4% | 7.5%(+3.89)#50 | 6.2%(+5.19)#3,038 |
| 51. | Pine Ridge | 11.4% | 7.5%(+3.83)#51 | 6.2%(+5.12)#3,074 |
| 52. | Kranzburg | 11.3% | 7.5%(+3.75)#52 | 6.2%(+5.05)#3,126 |
| 53. | Tyndall | 11.3% | 7.5%(+3.72)#53 | 6.2%(+5.02)#3,142 |
| 54. | Yankton | 11.2% | 7.5%(+3.62)#54 | 6.2%(+4.92)#3,213 |
| 55. | Forestburg | 11.1% | 7.5%(+3.57)#55 | 6.2%(+4.87)#3,269 |
| 56. | Colton | 11.1% | 7.5%(+3.54)#56 | 6.2%(+4.84)#3,279 |
| 57. | Murdo | 10.7% | 7.5%(+3.18)#57 | 6.2%(+4.48)#3,536 |
| 58. | Summerset | 10.7% | 7.5%(+3.11)#58 | 6.2%(+4.41)#3,592 |
| 59. | Dimock | 10.5% | 7.5%(+2.98)#59 | 6.2%(+4.28)#3,723 |
| 60. | Wonderland Homes | 10.4% | 7.5%(+2.86)#60 | 6.2%(+4.16)#3,817 |
| 61. | Pickstown | 10.4% | 7.5%(+2.83)#61 | 6.2%(+4.13)#3,848 |
| 62. | Colman | 10.3% | 7.5%(+2.78)#62 | 6.2%(+4.07)#3,893 |
| 63. | Humboldt | 10.3% | 7.5%(+2.74)#63 | 6.2%(+4.04)#3,929 |
| 64. | Mobridge | 10.3% | 7.5%(+2.74)#64 | 6.2%(+4.03)#3,937 |
| 65. | Rapid City | 9.9% | 7.5%(+2.38)#65 | 6.2%(+3.68)#4,290 |
| 66. | Meadow View Addition | 9.7% | 7.5%(+2.19)#66 | 6.2%(+3.49)#4,503 |
| 67. | Redfield | 9.5% | 7.5%(+1.99)#67 | 6.2%(+3.29)#4,719 |
| 68. | Andover | 9.5% | 7.5%(+1.98)#68 | 6.2%(+3.28)#4,749 |
| 69. | Hoven | 9.5% | 7.5%(+1.92)#69 | 6.2%(+3.21)#4,812 |
| 70. | Worthing | 9.4% | 7.5%(+1.89)#70 | 6.2%(+3.19)#4,851 |
| 71. | Armour | 9.3% | 7.5%(+1.79)#71 | 6.2%(+3.09)#4,991 |
| 72. | Freeman | 9.3% | 7.5%(+1.78)#72 | 6.2%(+3.07)#5,011 |
| 73. | Faulkton | 9.3% | 7.5%(+1.74)#73 | 6.2%(+3.04)#5,049 |
| 74. | Sioux Falls | 9.2% | 7.5%(+1.63)#74 | 6.2%(+2.92)#5,170 |
| 75. | Springfield | 9.1% | 7.5%(+1.57)#75 | 6.2%(+2.87)#5,243 |
| 76. | Waubay | 9.1% | 7.5%(+1.55)#76 | 6.2%(+2.85)#5,286 |
| 77. | Turton | 9.1% | 7.5%(+1.55)#77 | 6.2%(+2.85)#5,309 |
| 78. | Lake Norden | 9.0% | 7.5%(+1.49)#78 | 6.2%(+2.79)#5,367 |
| 79. | Scotland | 9.0% | 7.5%(+1.47)#79 | 6.2%(+2.76)#5,411 |
| 80. | Warner | 9.0% | 7.5%(+1.44)#80 | 6.2%(+2.74)#5,445 |
| 81. | North Spearfish | 9.0% | 7.5%(+1.44)#81 | 6.2%(+2.74)#5,457 |
| 82. | Rowena | 8.9% | 7.5%(+1.38)#82 | 6.2%(+2.68)#5,527 |
| 83. | Hartford | 8.7% | 7.5%(+1.13)#83 | 6.2%(+2.43)#5,893 |
| 84. | Tabor | 8.6% | 7.5%(+1.07)#84 | 6.2%(+2.37)#5,987 |
| 85. | Bridgewater | 8.6% | 7.5%(+1.06)#85 | 6.2%(+2.36)#6,008 |
| 86. | Rosebud | 8.6% | 7.5%(+1.03)#86 | 6.2%(+2.33)#6,044 |
| 87. | White Lake | 8.5% | 7.5%(+0.931)#87 | 6.2%(+2.23)#6,211 |
| 88. | Whitewood | 8.4% | 7.5%(+0.837)#88 | 6.2%(+2.14)#6,349 |
| 89. | Rapid Valley | 8.4% | 7.5%(+0.818)#89 | 6.2%(+2.12)#6,375 |
| 90. | Wilmot | 8.3% | 7.5%(+0.743)#90 | 6.2%(+2.04)#6,503 |
| 91. | Oacoma | 8.2% | 7.5%(+0.669)#91 | 6.2%(+1.97)#6,629 |
| 92. | Parkston | 8.2% | 7.5%(+0.650)#92 | 6.2%(+1.95)#6,658 |
| 93. | Avon | 8.1% | 7.5%(+0.515)#93 | 6.2%(+1.81)#6,894 |
| 94. | Leola | 8.0% | 7.5%(+0.416)#94 | 6.2%(+1.72)#7,066 |
| 95. | West Brule | 7.9% | 7.5%(+0.351)#95 | 6.2%(+1.65)#7,181 |
| 96. | North Sioux City | 7.8% | 7.5%(+0.267)#96 | 6.2%(+1.57)#7,365 |
| 97. | Brandon | 7.8% | 7.5%(+0.246)#97 | 6.2%(+1.54)#7,401 |
| 98. | Lead | 7.7% | 7.5%(+0.199)#98 | 6.2%(+1.50)#7,479 |
| 99. | Spencer | 7.7% | 7.5%(+0.148)#99 | 6.2%(+1.45)#7,584 |
| 100. | Hot Springs | 7.7% | 7.5%(+0.107)#100 | 6.2%(+1.41)#7,681 |
Common Questions
What are the Top 10 Cities with the Highest Percentage of Population Employed in Health Diagnosing & Treating in South Dakota?
Top 10 Cities with the Highest Percentage of Population Employed in Health Diagnosing & Treating in South Dakota are:
#1
46.7%
#2
44.4%
#3
38.3%
#4
34.0%
#5
33.3%
#6
30.6%
#7
28.6%
#8
25.8%
#9
25.5%
#10
25.0%
What city has the Highest Percentage of Population Employed in Health Diagnosing & Treating in South Dakota?
Soldier Creek has the Highest Percentage of Population Employed in Health Diagnosing & Treating in South Dakota with 46.7%.
What is the Percentage of Population Employed in Health Diagnosing & Treating in the State of South Dakota?
Percentage of Population Employed in Health Diagnosing & Treating in South Dakota is 7.5%.
What is the Percentage of Population Employed in Health Diagnosing & Treating in the United States?
Percentage of Population Employed in Health Diagnosing & Treating in the United States is 6.2%.