Bell Canyon, CA Map & Demographics
Bell Canyon Map
Bell Canyon Overview
$106,511
PER CAPITA INCOME
$250,001
AVG FAMILY INCOME
$237,384
AVG HOUSEHOLD INCOME
54.2%
WAGE / INCOME GAP [ % ]
45.8¢/ $1
WAGE / INCOME GAP [ $ ]
0.46
INEQUALITY / GINI INDEX
1,768
TOTAL POPULATION
921
MALE POPULATION
847
FEMALE POPULATION
108.74
MALES / 100 FEMALES
91.97
FEMALES / 100 MALES
48.2
MEDIAN AGE
3.6
AVG FAMILY SIZE
3.4
AVG HOUSEHOLD SIZE
823
LABOR FORCE [ PEOPLE ]
55.0%
PERCENT IN LABOR FORCE
1.6%
UNEMPLOYMENT RATE
Bell Canyon Area Codes
Income in Bell Canyon
Income Overview in Bell Canyon
Per Capita Income in Bell Canyon is $106,511, while median incomes of families and households are $250,001 and $237,384 respectively.
| Characteristic | Number | Measure |
| Per Capita Income | 1,768 | $106,511 |
| Median Family Income | 469 | $250,001 |
| Mean Family Income | 469 | $379,298 |
| Median Household Income | 528 | $237,384 |
| Mean Household Income | 528 | $355,273 |
| Income Deficit | 469 | $0 |
| Wage / Income Gap (%) | 1,768 | 54.20% |
| Wage / Income Gap ($) | 1,768 | 45.80¢ per $1 |
| Gini / Inequality Index | 1,768 | 0.46 |
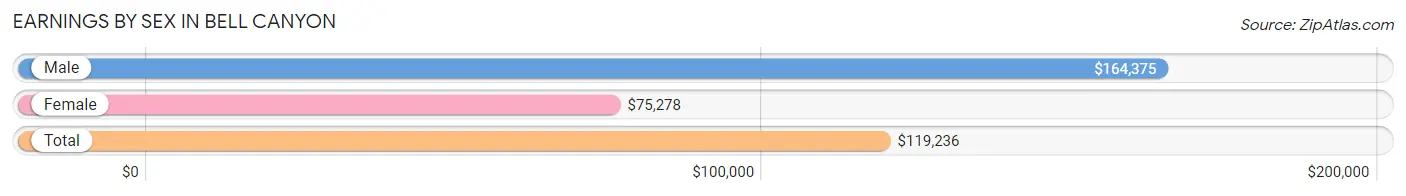
Earnings by Sex in Bell Canyon
Average Earnings in Bell Canyon are $119,236, $164,375 for men and $75,278 for women, a difference of 54.2%.
| Sex | Number | Average Earnings |
| Male | 481 (54.5%) | $164,375 |
| Female | 402 (45.5%) | $75,278 |
| Total | 883 (100.0%) | $119,236 |
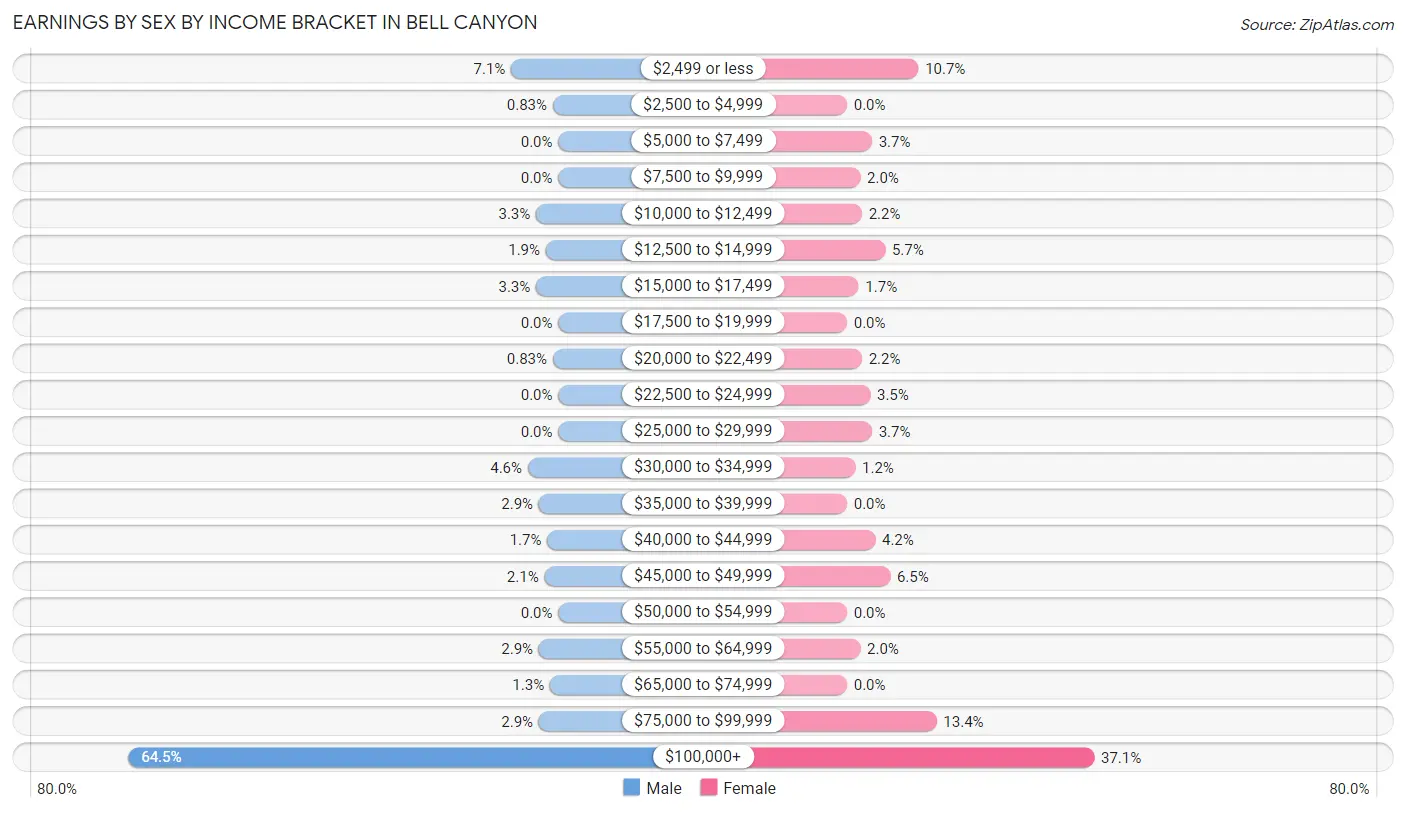
Earnings by Sex by Income Bracket in Bell Canyon
The most common earnings brackets in Bell Canyon are $100,000+ for men (310 | 64.4%) and $100,000+ for women (149 | 37.1%).
| Income | Male | Female |
| $2,499 or less | 34 (7.1%) | 43 (10.7%) |
| $2,500 to $4,999 | 4 (0.8%) | 0 (0.0%) |
| $5,000 to $7,499 | 0 (0.0%) | 15 (3.7%) |
| $7,500 to $9,999 | 0 (0.0%) | 8 (2.0%) |
| $10,000 to $12,499 | 16 (3.3%) | 9 (2.2%) |
| $12,500 to $14,999 | 9 (1.9%) | 23 (5.7%) |
| $15,000 to $17,499 | 16 (3.3%) | 7 (1.7%) |
| $17,500 to $19,999 | 0 (0.0%) | 0 (0.0%) |
| $20,000 to $22,499 | 4 (0.8%) | 9 (2.2%) |
| $22,500 to $24,999 | 0 (0.0%) | 14 (3.5%) |
| $25,000 to $29,999 | 0 (0.0%) | 15 (3.7%) |
| $30,000 to $34,999 | 22 (4.6%) | 5 (1.2%) |
| $35,000 to $39,999 | 14 (2.9%) | 0 (0.0%) |
| $40,000 to $44,999 | 8 (1.7%) | 17 (4.2%) |
| $45,000 to $49,999 | 10 (2.1%) | 26 (6.5%) |
| $50,000 to $54,999 | 0 (0.0%) | 0 (0.0%) |
| $55,000 to $64,999 | 14 (2.9%) | 8 (2.0%) |
| $65,000 to $74,999 | 6 (1.3%) | 0 (0.0%) |
| $75,000 to $99,999 | 14 (2.9%) | 54 (13.4%) |
| $100,000+ | 310 (64.4%) | 149 (37.1%) |
| Total | 481 (100.0%) | 402 (100.0%) |
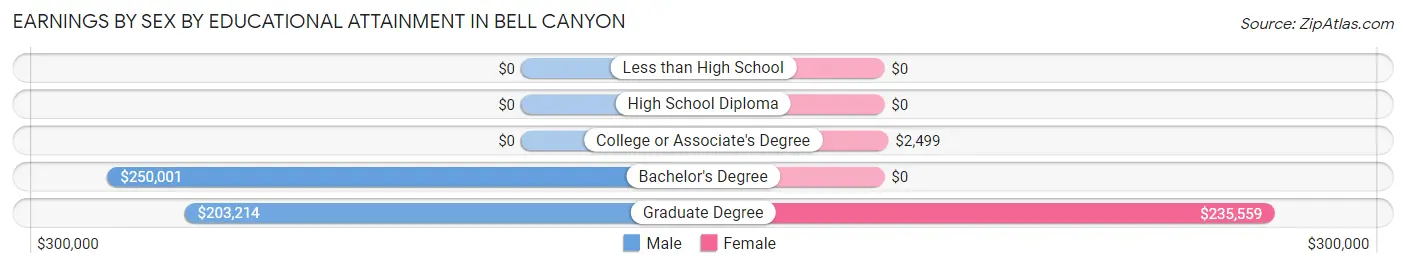
Earnings by Sex by Educational Attainment in Bell Canyon
Average earnings in Bell Canyon are $203,413 for men and $90,192 for women, a difference of 55.7%. Men with an educational attainment of bachelor's degree enjoy the highest average annual earnings of $250,001, while those with graduate degree education earn the least with $203,214. Women with an educational attainment of graduate degree earn the most with the average annual earnings of $235,559, while those with college or associate's degree education have the smallest earnings of $2,499.
| Educational Attainment | Male Income | Female Income |
| Less than High School | - | - |
| High School Diploma | - | - |
| College or Associate's Degree | - | - |
| Bachelor's Degree | $250,001 | $0 |
| Graduate Degree | $203,214 | $235,559 |
| Total | $203,413 | $90,192 |
Family Income in Bell Canyon
Family Income Brackets in Bell Canyon
According to the Bell Canyon family income data, there are 326 families falling into the $200,000+ income range, which is the most common income bracket and makes up 69.5% of all families.
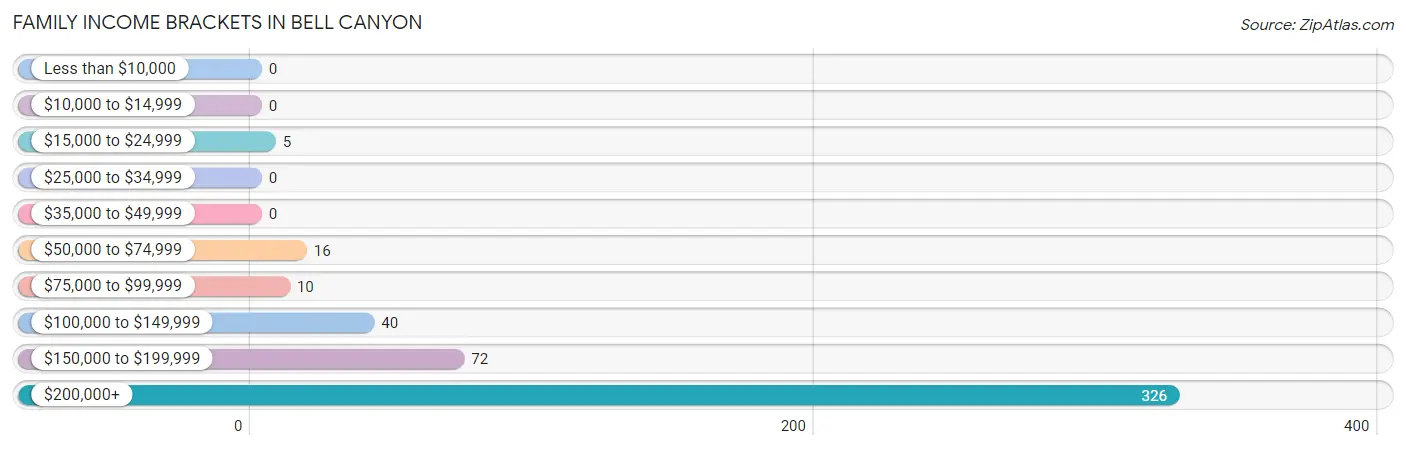
| Income Bracket | # Families | % Families |
| Less than $10,000 | 0 | 0.0% |
| $10,000 to $14,999 | 0 | 0.0% |
| $15,000 to $24,999 | 5 | 1.1% |
| $25,000 to $34,999 | 0 | 0.0% |
| $35,000 to $49,999 | 0 | 0.0% |
| $50,000 to $74,999 | 16 | 3.4% |
| $75,000 to $99,999 | 10 | 2.1% |
| $100,000 to $149,999 | 40 | 8.5% |
| $150,000 to $199,999 | 72 | 15.4% |
| $200,000+ | 326 | 69.5% |
Family Income by Famaliy Size in Bell Canyon
3-person families (53 | 11.3%) account for the highest median family income in Bell Canyon with $250,001 per family, while 2-person families (189 | 40.3%) have the highest median income of $104,258 per family member.
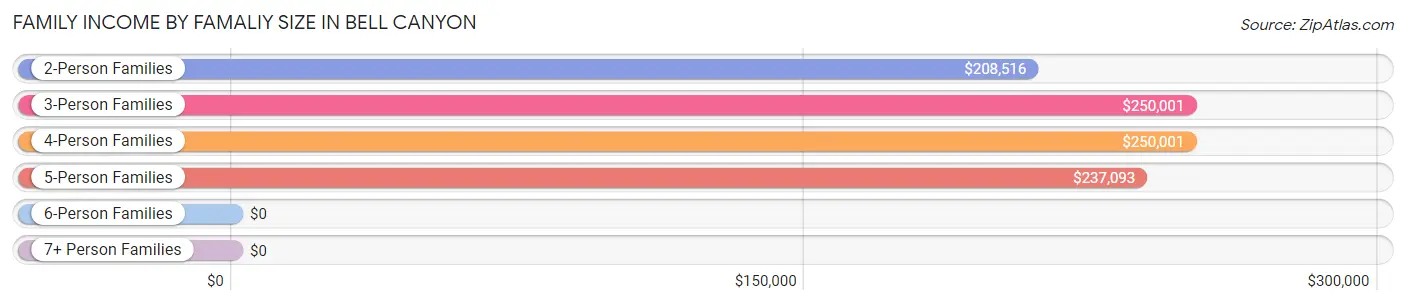
| Income Bracket | # Families | Median Income |
| 2-Person Families | 189 (40.3%) | $208,516 |
| 3-Person Families | 53 (11.3%) | $250,001 |
| 4-Person Families | 108 (23.0%) | $250,001 |
| 5-Person Families | 106 (22.6%) | $237,093 |
| 6-Person Families | 6 (1.3%) | $0 |
| 7+ Person Families | 7 (1.5%) | $0 |
| Total | 469 (100.0%) | $250,001 |
Family Income by Number of Earners in Bell Canyon
The median family income in Bell Canyon is $250,001, with families comprising 2 earners (175) having the highest median family income of $250,001, while families with no earners (43) have the lowest median family income of $155,536, accounting for 37.3% and 9.2% of families, respectively.
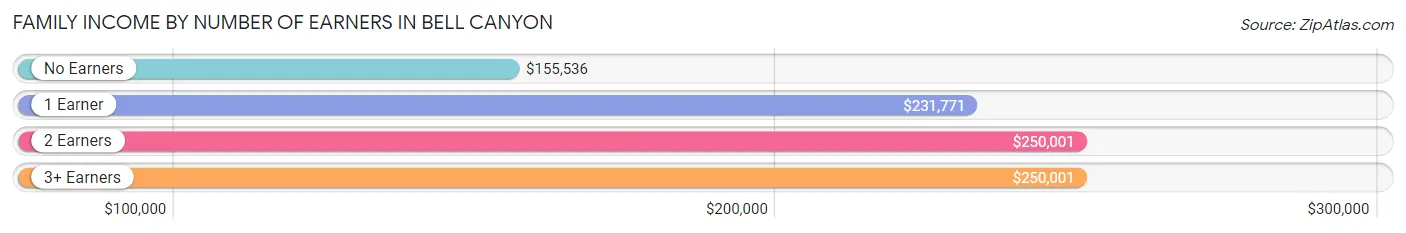
| Number of Earners | # Families | Median Income |
| No Earners | 43 (9.2%) | $155,536 |
| 1 Earner | 163 (34.7%) | $231,771 |
| 2 Earners | 175 (37.3%) | $250,001 |
| 3+ Earners | 88 (18.8%) | $250,001 |
| Total | 469 (100.0%) | $250,001 |
Household Income in Bell Canyon
Household Income Brackets in Bell Canyon
With 339 households falling in the category, the $200,000+ income range is the most frequent in Bell Canyon, accounting for 64.2% of all households.
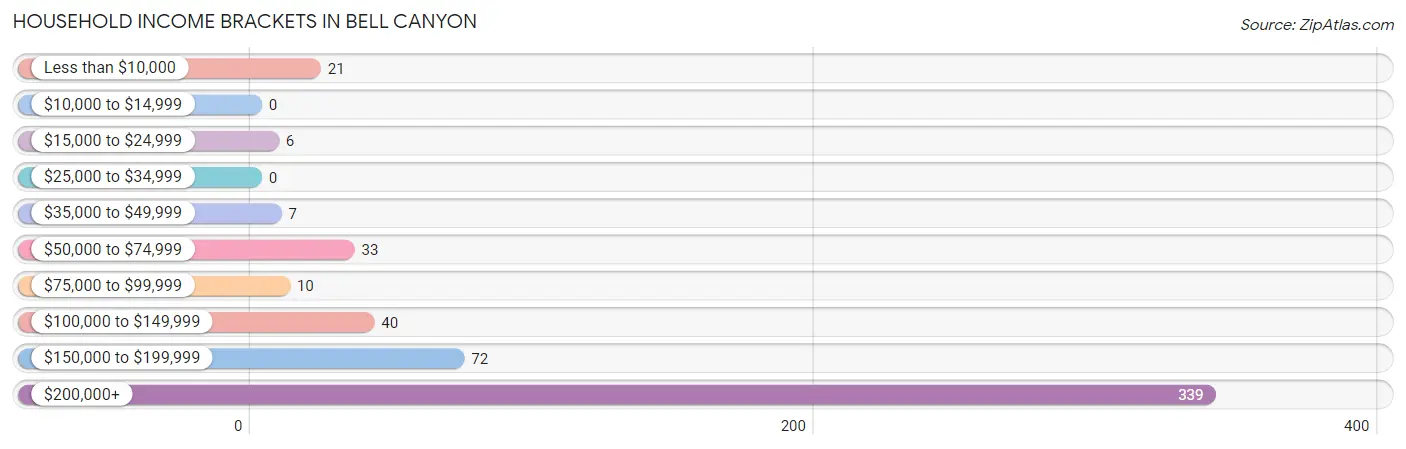
| Income Bracket | # Households | % Households |
| Less than $10,000 | 21 | 4.0% |
| $10,000 to $14,999 | 0 | 0.0% |
| $15,000 to $24,999 | 6 | 1.1% |
| $25,000 to $34,999 | 0 | 0.0% |
| $35,000 to $49,999 | 7 | 1.3% |
| $50,000 to $74,999 | 33 | 6.3% |
| $75,000 to $99,999 | 10 | 1.9% |
| $100,000 to $149,999 | 40 | 7.6% |
| $150,000 to $199,999 | 72 | 13.6% |
| $200,000+ | 339 | 64.2% |
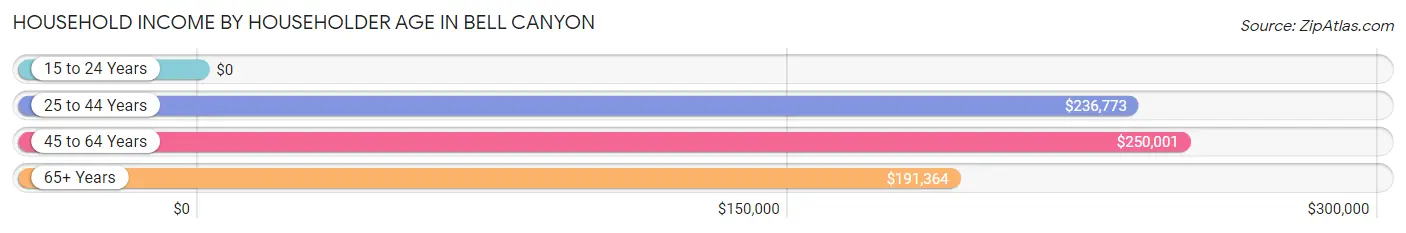
Household Income by Householder Age in Bell Canyon
The median household income in Bell Canyon is $237,384, with the highest median household income of $250,001 found in the 45 to 64 years age bracket for the primary householder. A total of 315 households (59.7%) fall into this category.
| Income Bracket | # Households | Median Income |
| 15 to 24 Years | 0 (0.0%) | $0 |
| 25 to 44 Years | 85 (16.1%) | $236,773 |
| 45 to 64 Years | 315 (59.7%) | $250,001 |
| 65+ Years | 128 (24.2%) | $191,364 |
| Total | 528 (100.0%) | $237,384 |
Poverty in Bell Canyon
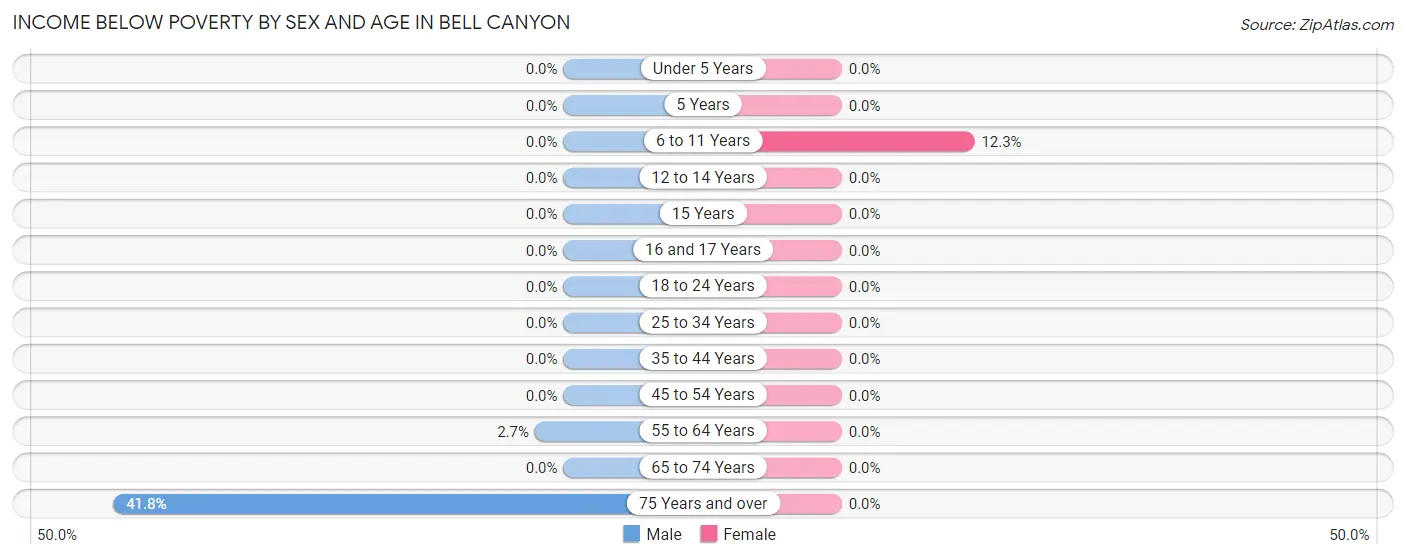
Income Below Poverty by Sex and Age in Bell Canyon
With 4.1% poverty level for males and 0.9% for females among the residents of Bell Canyon, 75 year old and over males and 6 to 11 year old females are the most vulnerable to poverty, with 33 males (41.8%) and 8 females (12.3%) in their respective age groups living below the poverty level.
| Age Bracket | Male | Female |
| Under 5 Years | 0 (0.0%) | 0 (0.0%) |
| 5 Years | 0 (0.0%) | 0 (0.0%) |
| 6 to 11 Years | 0 (0.0%) | 8 (12.3%) |
| 12 to 14 Years | 0 (0.0%) | 0 (0.0%) |
| 15 Years | 0 (0.0%) | 0 (0.0%) |
| 16 and 17 Years | 0 (0.0%) | 0 (0.0%) |
| 18 to 24 Years | 0 (0.0%) | 0 (0.0%) |
| 25 to 34 Years | 0 (0.0%) | 0 (0.0%) |
| 35 to 44 Years | 0 (0.0%) | 0 (0.0%) |
| 45 to 54 Years | 0 (0.0%) | 0 (0.0%) |
| 55 to 64 Years | 5 (2.6%) | 0 (0.0%) |
| 65 to 74 Years | 0 (0.0%) | 0 (0.0%) |
| 75 Years and over | 33 (41.8%) | 0 (0.0%) |
| Total | 38 (4.1%) | 8 (0.9%) |
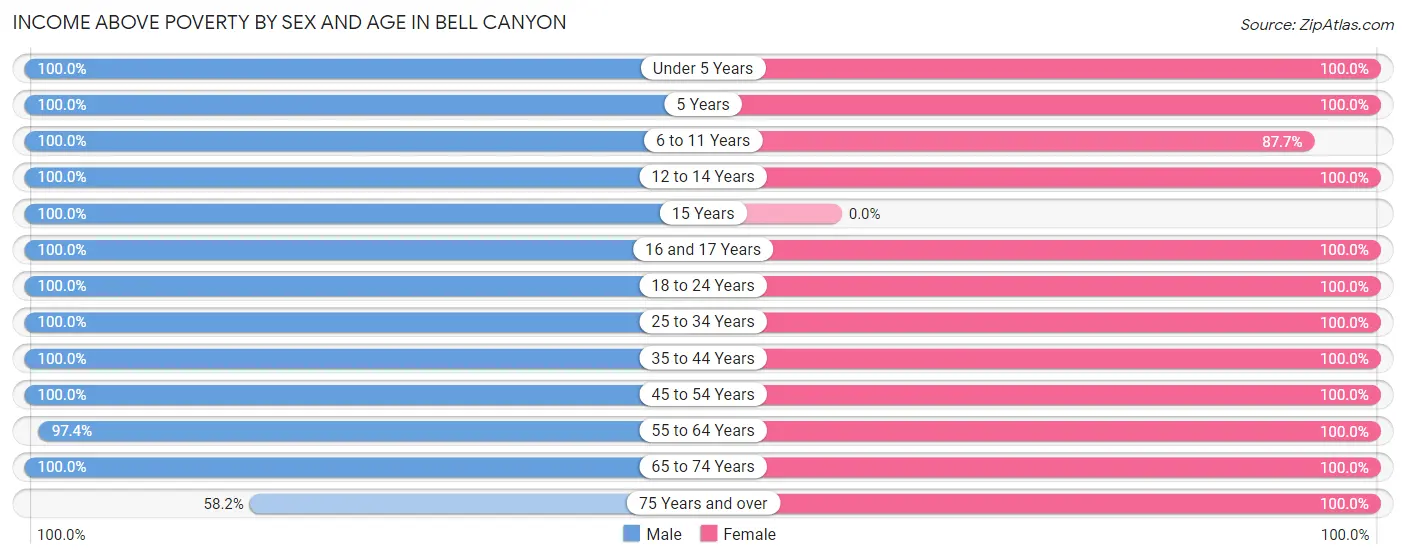
Income Above Poverty by Sex and Age in Bell Canyon
According to the poverty statistics in Bell Canyon, males aged under 5 years and females aged under 5 years are the age groups that are most secure financially, with 100.0% of males and 100.0% of females in these age groups living above the poverty line.
| Age Bracket | Male | Female |
| Under 5 Years | 22 (100.0%) | 14 (100.0%) |
| 5 Years | 9 (100.0%) | 8 (100.0%) |
| 6 to 11 Years | 44 (100.0%) | 57 (87.7%) |
| 12 to 14 Years | 53 (100.0%) | 53 (100.0%) |
| 15 Years | 3 (100.0%) | 0 (0.0%) |
| 16 and 17 Years | 30 (100.0%) | 40 (100.0%) |
| 18 to 24 Years | 173 (100.0%) | 88 (100.0%) |
| 25 to 34 Years | 34 (100.0%) | 32 (100.0%) |
| 35 to 44 Years | 105 (100.0%) | 76 (100.0%) |
| 45 to 54 Years | 116 (100.0%) | 130 (100.0%) |
| 55 to 64 Years | 184 (97.4%) | 178 (100.0%) |
| 65 to 74 Years | 64 (100.0%) | 74 (100.0%) |
| 75 Years and over | 46 (58.2%) | 89 (100.0%) |
| Total | 883 (95.9%) | 839 (99.1%) |
Income Below Poverty Among Married-Couple Families in Bell Canyon
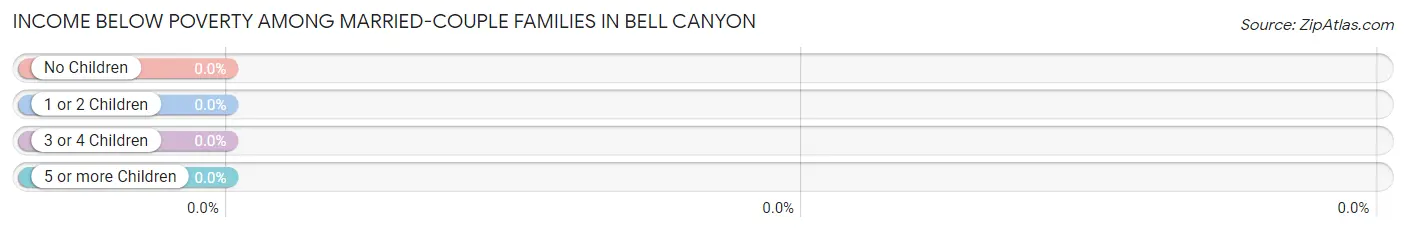
| Children | Above Poverty | Below Poverty |
| No Children | 243 (100.0%) | 0 (0.0%) |
| 1 or 2 Children | 188 (100.0%) | 0 (0.0%) |
| 3 or 4 Children | 14 (100.0%) | 0 (0.0%) |
| 5 or more Children | 0 (0.0%) | 0 (0.0%) |
| Total | 445 (100.0%) | 0 (0.0%) |
Income Below Poverty Among Single-Parent Households in Bell Canyon
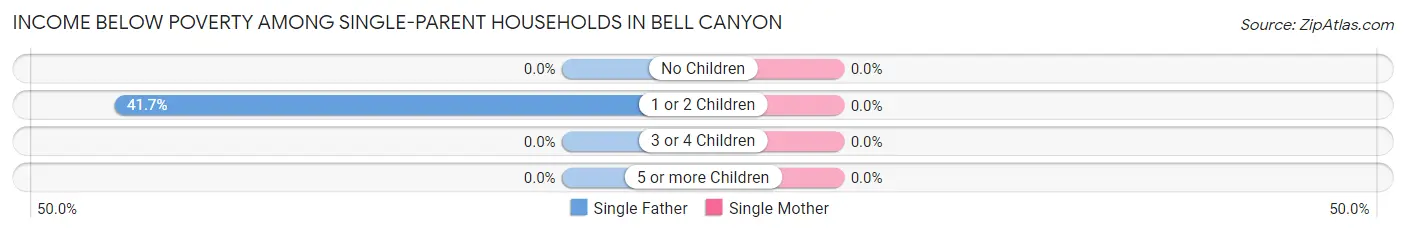
| Children | Single Father | Single Mother |
| No Children | 0 (0.0%) | 0 (0.0%) |
| 1 or 2 Children | 5 (41.7%) | 0 (0.0%) |
| 3 or 4 Children | 0 (0.0%) | 0 (0.0%) |
| 5 or more Children | 0 (0.0%) | 0 (0.0%) |
| Total | 5 (27.8%) | 0 (0.0%) |
Income Below Poverty Among Married-Couple vs Single-Parent Households in Bell Canyon
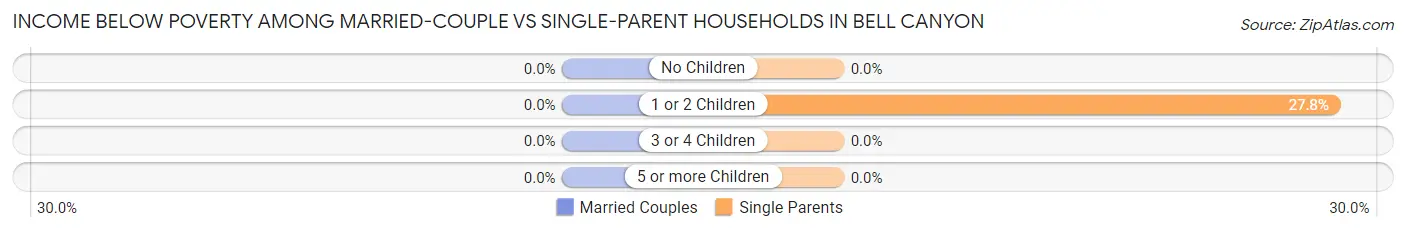
| Children | Married-Couple Families | Single-Parent Households |
| No Children | 0 (0.0%) | 0 (0.0%) |
| 1 or 2 Children | 0 (0.0%) | 5 (27.8%) |
| 3 or 4 Children | 0 (0.0%) | 0 (0.0%) |
| 5 or more Children | 0 (0.0%) | 0 (0.0%) |
| Total | 0 (0.0%) | 5 (20.8%) |
Race in Bell Canyon
The most populous races in Bell Canyon are White / Caucasian (1,138 | 64.4%), Asian (465 | 26.3%), and Hispanic or Latino (99 | 5.6%).
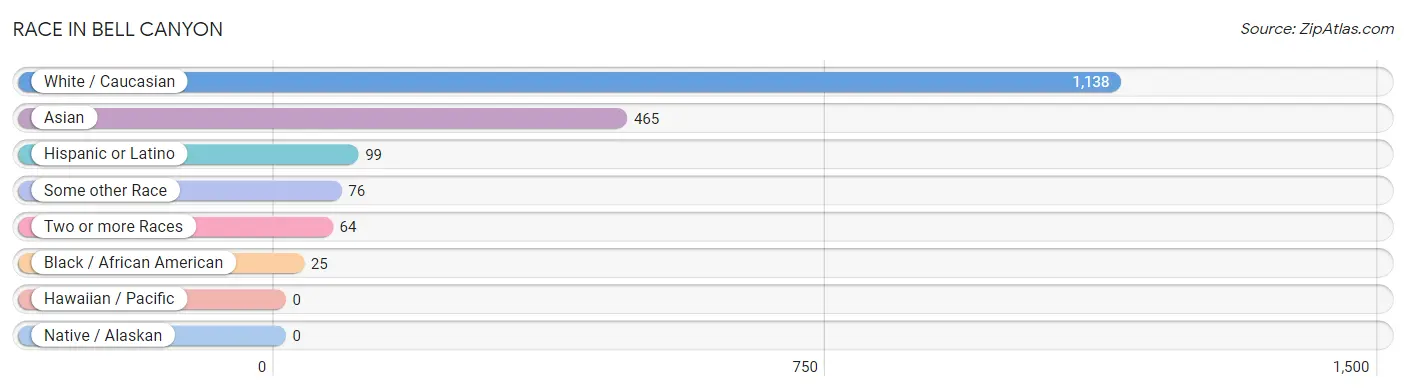
| Race | # Population | % Population |
| Asian | 465 | 26.3% |
| Black / African American | 25 | 1.4% |
| Hawaiian / Pacific | 0 | 0.0% |
| Hispanic or Latino | 99 | 5.6% |
| Native / Alaskan | 0 | 0.0% |
| White / Caucasian | 1,138 | 64.4% |
| Two or more Races | 64 | 3.6% |
| Some other Race | 76 | 4.3% |
| Total | 1,768 | 100.0% |
Ancestry in Bell Canyon
The most populous ancestries reported in Bell Canyon are Thai (234 | 13.2%), Indian (Asian) (177 | 10.0%), English (145 | 8.2%), Iranian (116 | 6.6%), and Italian (115 | 6.5%), together accounting for 44.5% of all Bell Canyon residents.
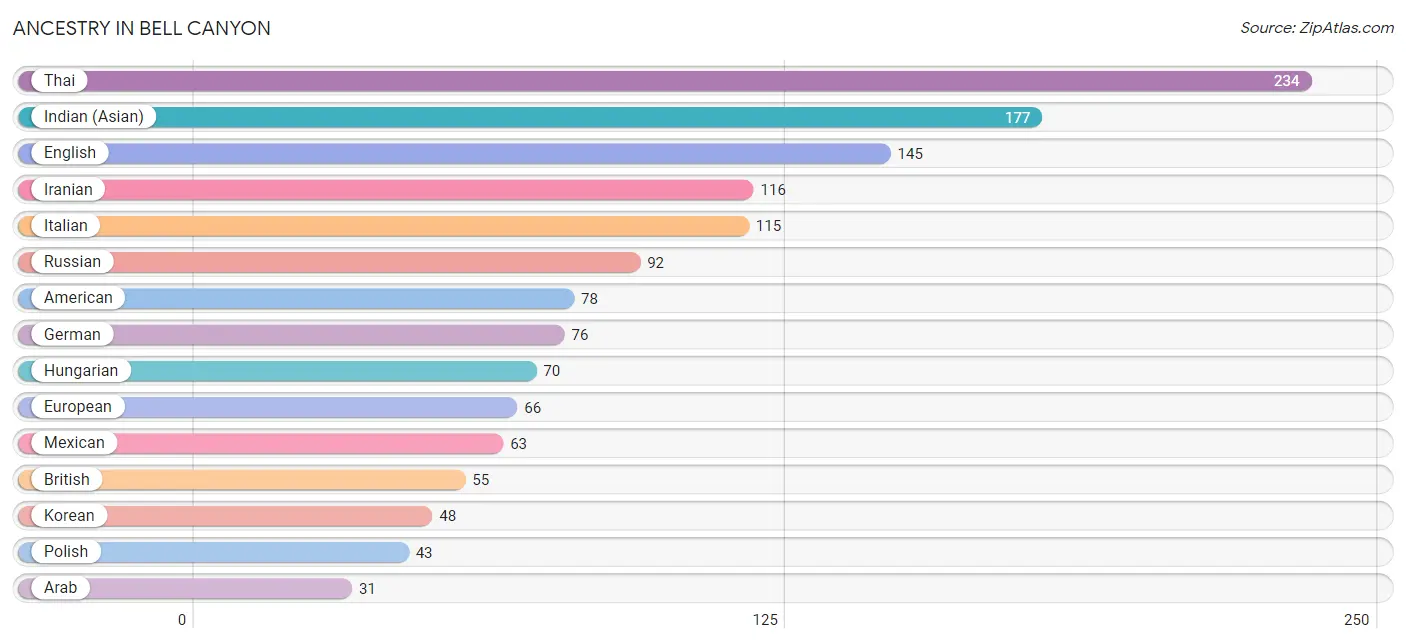
| Ancestry | # Population | % Population |
| American | 78 | 4.4% |
| Arab | 31 | 1.8% |
| Armenian | 26 | 1.5% |
| Austrian | 19 | 1.1% |
| British | 55 | 3.1% |
| Central American | 26 | 1.5% |
| Central American Indian | 11 | 0.6% |
| Czech | 4 | 0.2% |
| Eastern European | 12 | 0.7% |
| Egyptian | 26 | 1.5% |
| English | 145 | 8.2% |
| European | 66 | 3.7% |
| French | 10 | 0.6% |
| German | 76 | 4.3% |
| Greek | 15 | 0.9% |
| Hungarian | 70 | 4.0% |
| Indian (Asian) | 177 | 10.0% |
| Iranian | 116 | 6.6% |
| Irish | 27 | 1.5% |
| Italian | 115 | 6.5% |
| Korean | 48 | 2.7% |
| Laotian | 5 | 0.3% |
| Lithuanian | 25 | 1.4% |
| Mexican | 63 | 3.6% |
| Mongolian | 4 | 0.2% |
| Norwegian | 10 | 0.6% |
| Polish | 43 | 2.4% |
| Puerto Rican | 6 | 0.3% |
| Russian | 92 | 5.2% |
| Salvadoran | 26 | 1.5% |
| Scotch-Irish | 5 | 0.3% |
| Scottish | 4 | 0.2% |
| Swedish | 23 | 1.3% |
| Thai | 234 | 13.2% | View All 34 Rows |
Immigrants in Bell Canyon
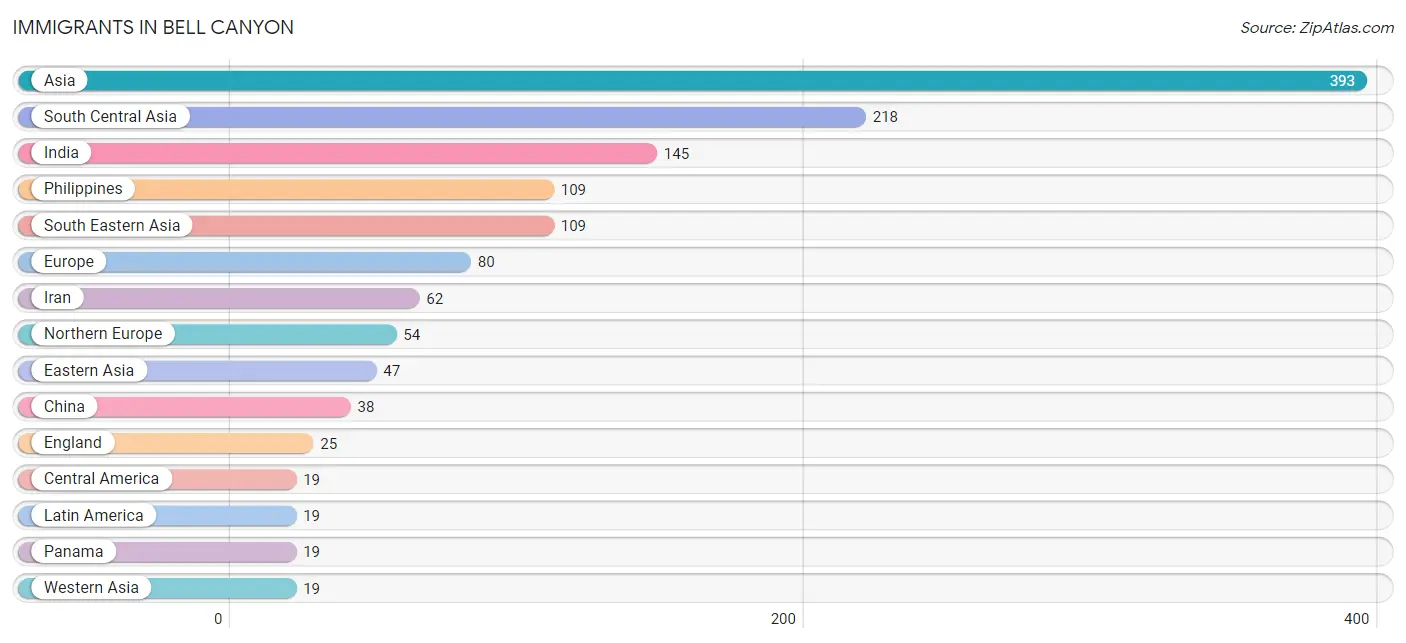
The most numerous immigrant groups reported in Bell Canyon came from Asia (393 | 22.2%), South Central Asia (218 | 12.3%), India (145 | 8.2%), Philippines (109 | 6.2%), and South Eastern Asia (109 | 6.2%), together accounting for 55.1% of all Bell Canyon residents.
| Immigration Origin | # Population | % Population |
| Asia | 393 | 22.2% |
| Central America | 19 | 1.1% |
| China | 38 | 2.1% |
| Eastern Asia | 47 | 2.7% |
| Eastern Europe | 11 | 0.6% |
| England | 25 | 1.4% |
| Europe | 80 | 4.5% |
| Greece | 15 | 0.9% |
| Hong Kong | 16 | 0.9% |
| India | 145 | 8.2% |
| Iran | 62 | 3.5% |
| Korea | 9 | 0.5% |
| Latin America | 19 | 1.1% |
| Lebanon | 7 | 0.4% |
| Northern Europe | 54 | 3.0% |
| Pakistan | 11 | 0.6% |
| Panama | 19 | 1.1% |
| Philippines | 109 | 6.2% |
| South Central Asia | 218 | 12.3% |
| South Eastern Asia | 109 | 6.2% |
| Southern Europe | 15 | 0.9% |
| Syria | 12 | 0.7% |
| Taiwan | 10 | 0.6% |
| Western Asia | 19 | 1.1% | View All 24 Rows |
Sex and Age in Bell Canyon
Sex and Age in Bell Canyon
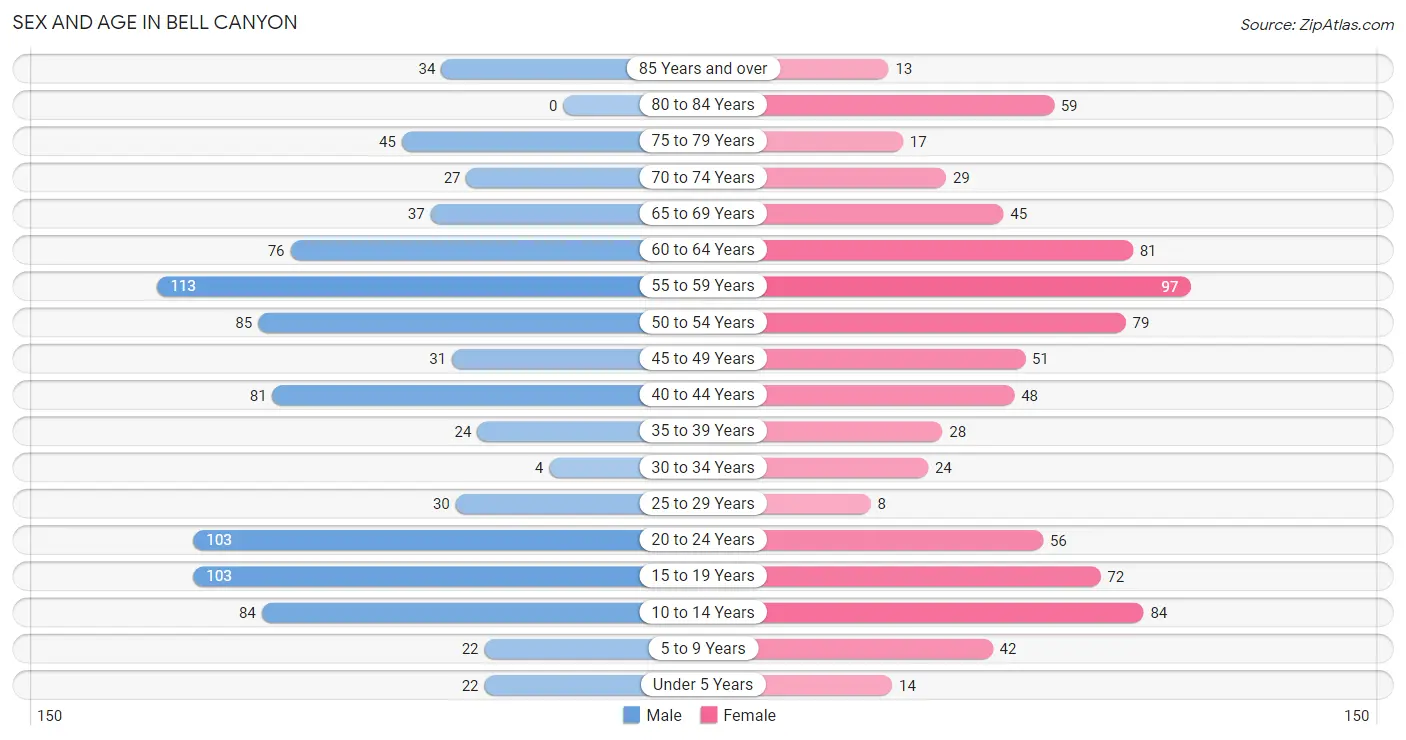
The most populous age groups in Bell Canyon are 55 to 59 Years (113 | 12.3%) for men and 55 to 59 Years (97 | 11.5%) for women.
| Age Bracket | Male | Female |
| Under 5 Years | 22 (2.4%) | 14 (1.7%) |
| 5 to 9 Years | 22 (2.4%) | 42 (5.0%) |
| 10 to 14 Years | 84 (9.1%) | 84 (9.9%) |
| 15 to 19 Years | 103 (11.2%) | 72 (8.5%) |
| 20 to 24 Years | 103 (11.2%) | 56 (6.6%) |
| 25 to 29 Years | 30 (3.3%) | 8 (0.9%) |
| 30 to 34 Years | 4 (0.4%) | 24 (2.8%) |
| 35 to 39 Years | 24 (2.6%) | 28 (3.3%) |
| 40 to 44 Years | 81 (8.8%) | 48 (5.7%) |
| 45 to 49 Years | 31 (3.4%) | 51 (6.0%) |
| 50 to 54 Years | 85 (9.2%) | 79 (9.3%) |
| 55 to 59 Years | 113 (12.3%) | 97 (11.5%) |
| 60 to 64 Years | 76 (8.3%) | 81 (9.6%) |
| 65 to 69 Years | 37 (4.0%) | 45 (5.3%) |
| 70 to 74 Years | 27 (2.9%) | 29 (3.4%) |
| 75 to 79 Years | 45 (4.9%) | 17 (2.0%) |
| 80 to 84 Years | 0 (0.0%) | 59 (7.0%) |
| 85 Years and over | 34 (3.7%) | 13 (1.5%) |
| Total | 921 (100.0%) | 847 (100.0%) |
Families and Households in Bell Canyon
Median Family Size in Bell Canyon
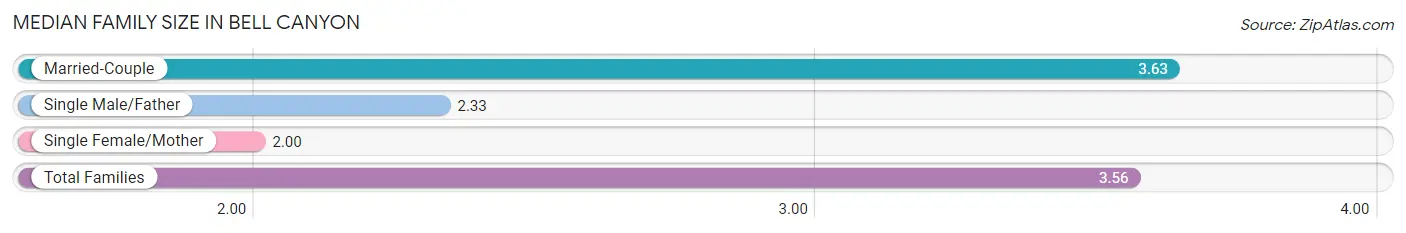
The median family size in Bell Canyon is 3.56 persons per family, with married-couple families (445 | 94.9%) accounting for the largest median family size of 3.63 persons per family. On the other hand, single female/mother families (6 | 1.3%) represent the smallest median family size with 2.00 persons per family.
| Family Type | # Families | Family Size |
| Married-Couple | 445 (94.9%) | 3.63 |
| Single Male/Father | 18 (3.8%) | 2.33 |
| Single Female/Mother | 6 (1.3%) | 2.00 |
| Total Families | 469 (100.0%) | 3.56 |
Median Household Size in Bell Canyon
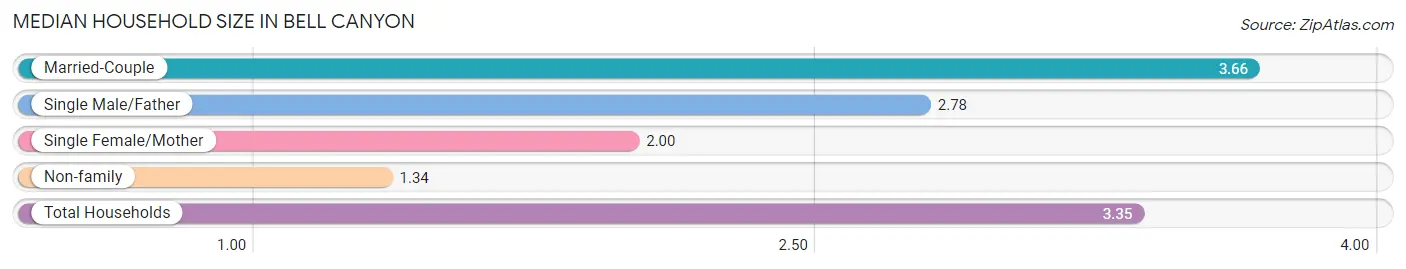
The median household size in Bell Canyon is 3.35 persons per household, with married-couple households (445 | 84.3%) accounting for the largest median household size of 3.66 persons per household. non-family households (59 | 11.2%) represent the smallest median household size with 1.34 persons per household.
| Household Type | # Households | Household Size |
| Married-Couple | 445 (84.3%) | 3.66 |
| Single Male/Father | 18 (3.4%) | 2.78 |
| Single Female/Mother | 6 (1.1%) | 2.00 |
| Non-family | 59 (11.2%) | 1.34 |
| Total Households | 528 (100.0%) | 3.35 |
Household Size by Marriage Status in Bell Canyon
Out of a total of 528 households in Bell Canyon, 469 (88.8%) are family households, while 59 (11.2%) are nonfamily households. The most numerous type of family households are 2-person households, comprising 184, and the most common type of nonfamily households are 1-person households, comprising 42.
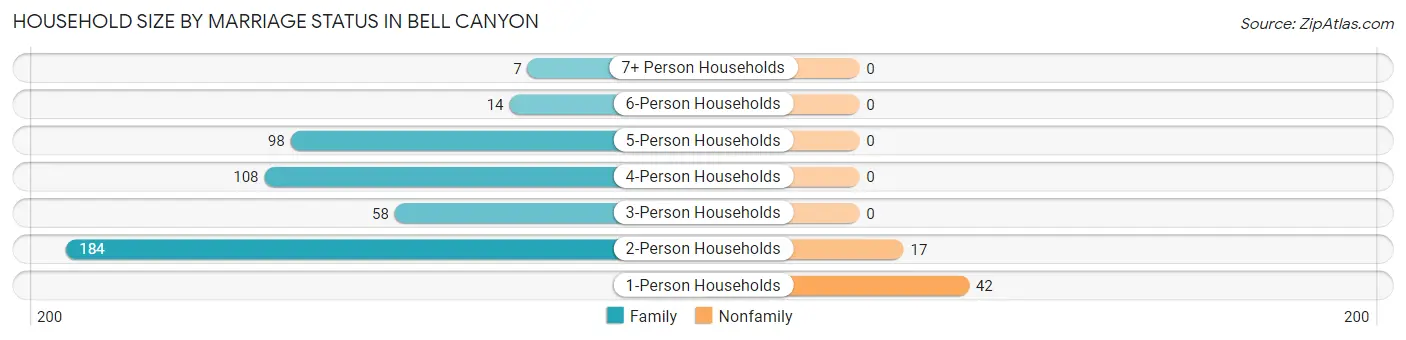
| Household Size | Family Households | Nonfamily Households |
| 1-Person Households | - | 42 (8.0%) |
| 2-Person Households | 184 (34.8%) | 17 (3.2%) |
| 3-Person Households | 58 (11.0%) | 0 (0.0%) |
| 4-Person Households | 108 (20.4%) | 0 (0.0%) |
| 5-Person Households | 98 (18.6%) | 0 (0.0%) |
| 6-Person Households | 14 (2.6%) | 0 (0.0%) |
| 7+ Person Households | 7 (1.3%) | 0 (0.0%) |
| Total | 469 (88.8%) | 59 (11.2%) |
Female Fertility in Bell Canyon
Fertility by Age in Bell Canyon
| Age Bracket | Women with Births | Births / 1,000 Women |
| 15 to 19 years | 0 (0.0%) | 0.0 |
| 20 to 34 years | 0 (0.0%) | 0.0 |
| 35 to 50 years | 0 (0.0%) | 0.0 |
| Total | 0 (0.0%) | 0.0 |
Fertility by Age by Marriage Status in Bell Canyon
| Age Bracket | Married | Unmarried |
| 15 to 19 years | 0 (0.0%) | 0 (0.0%) |
| 20 to 34 years | 0 (0.0%) | 0 (0.0%) |
| 35 to 50 years | 0 (0.0%) | 0 (0.0%) |
| Total | 0 (0.0%) | 0 (0.0%) |
Fertility by Education in Bell Canyon
| Educational Attainment | Women with Births | Births / 1,000 Women |
| Less than High School | 0 (0.0%) | 0.0 |
| High School Diploma | 0 (0.0%) | 0.0 |
| College or Associate's Degree | 0 (0.0%) | 0.0 |
| Bachelor's Degree | 0 (0.0%) | 0.0 |
| Graduate Degree | 0 (0.0%) | 0.0 |
| Total | 0 (0.0%) | 0.0 |
Fertility by Education by Marriage Status in Bell Canyon
| Educational Attainment | Married | Unmarried |
| Less than High School | 0 (0.0%) | 0 (0.0%) |
| High School Diploma | 0 (0.0%) | 0 (0.0%) |
| College or Associate's Degree | 0 (0.0%) | 0 (0.0%) |
| Bachelor's Degree | 0 (0.0%) | 0 (0.0%) |
| Graduate Degree | 0 (0.0%) | 0 (0.0%) |
| Total | 0 (0.0%) | 0 (0.0%) |
Employment Characteristics in Bell Canyon
Employment by Class of Employer in Bell Canyon
Among the 801 employed individuals in Bell Canyon, private company employees (593 | 74.0%), self-employed (incorporated) (95 | 11.9%), and self-employed (not incorporated) (66 | 8.2%) make up the most common classes of employment.
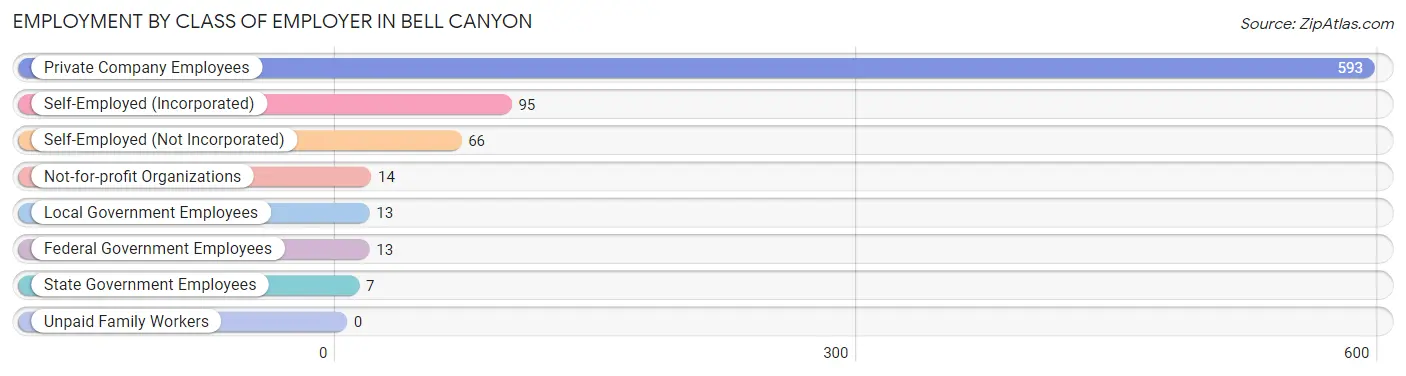
| Employer Class | # Employees | % Employees |
| Private Company Employees | 593 | 74.0% |
| Self-Employed (Incorporated) | 95 | 11.9% |
| Self-Employed (Not Incorporated) | 66 | 8.2% |
| Not-for-profit Organizations | 14 | 1.8% |
| Local Government Employees | 13 | 1.6% |
| State Government Employees | 7 | 0.9% |
| Federal Government Employees | 13 | 1.6% |
| Unpaid Family Workers | 0 | 0.0% |
| Total | 801 | 100.0% |
Employment Status by Age in Bell Canyon
According to the labor force statistics for Bell Canyon, out of the total population over 16 years of age (1,497), 55.0% or 823 individuals are in the labor force, with 1.6% or 13 of them unemployed. The age group with the highest labor force participation rate is 25 to 29 years, with 100.0% or 38 individuals in the labor force. Within the labor force, the 60 to 64 years age range has the highest percentage of unemployed individuals, with 5.2% or 6 of them being unemployed.
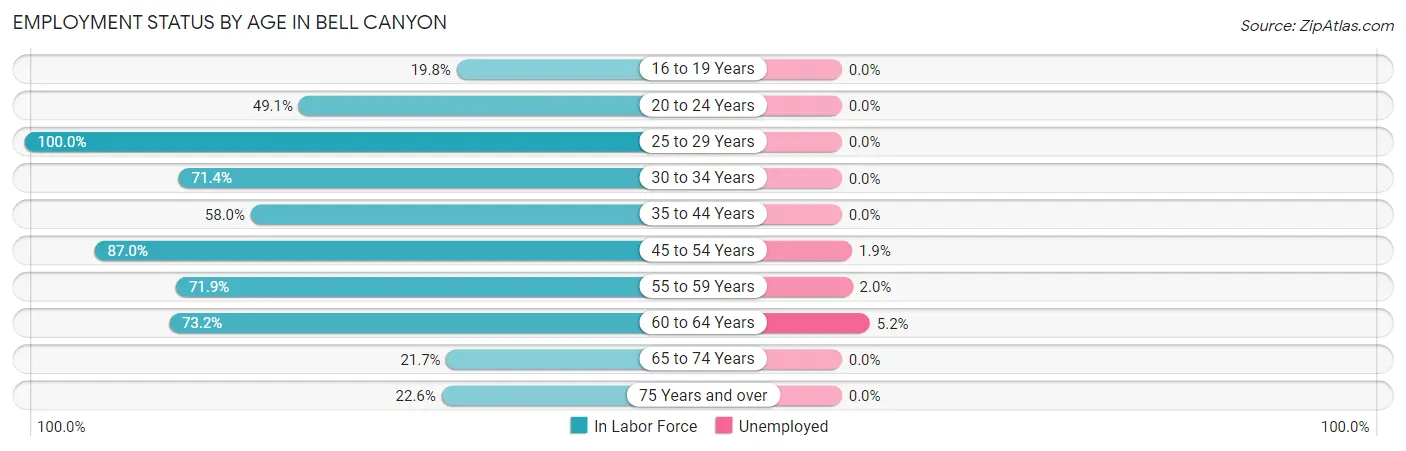
| Age Bracket | In Labor Force | Unemployed |
| 16 to 19 Years | 34 (19.8%) | 0 (0.0%) |
| 20 to 24 Years | 78 (49.1%) | 0 (0.0%) |
| 25 to 29 Years | 38 (100.0%) | 0 (0.0%) |
| 30 to 34 Years | 20 (71.4%) | 0 (0.0%) |
| 35 to 44 Years | 105 (58.0%) | 0 (0.0%) |
| 45 to 54 Years | 214 (87.0%) | 4 (1.9%) |
| 55 to 59 Years | 151 (71.9%) | 3 (2.0%) |
| 60 to 64 Years | 115 (73.2%) | 6 (5.2%) |
| 65 to 74 Years | 30 (21.7%) | 0 (0.0%) |
| 75 Years and over | 38 (22.6%) | 0 (0.0%) |
| Total | 823 (55.0%) | 13 (1.6%) |
Employment Status by Educational Attainment in Bell Canyon
According to labor force statistics for Bell Canyon, 74.8% of individuals (643) out of the total population between 25 and 64 years of age (860) are in the labor force, with 2.0% or 13 of them being unemployed. The group with the highest labor force participation rate are those with the educational attainment of less than high school, with 100.0% or 7 individuals in the labor force. Within the labor force, individuals with bachelor's degree or higher education have the highest percentage of unemployment, with 2.5% or 13 of them being unemployed.
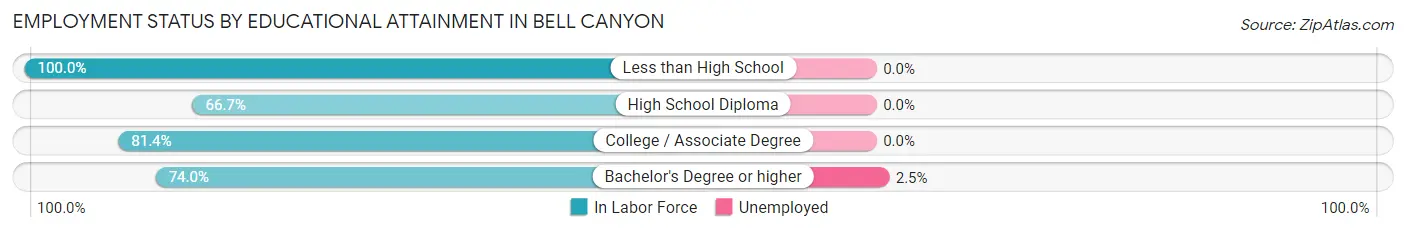
| Educational Attainment | In Labor Force | Unemployed |
| Less than High School | 7 (100.0%) | 0 (0.0%) |
| High School Diploma | 34 (66.7%) | 0 (0.0%) |
| College / Associate Degree | 92 (81.4%) | 0 (0.0%) |
| Bachelor's Degree or higher | 510 (74.0%) | 17 (2.5%) |
| Total | 643 (74.8%) | 17 (2.0%) |
Employment Occupations by Sex in Bell Canyon
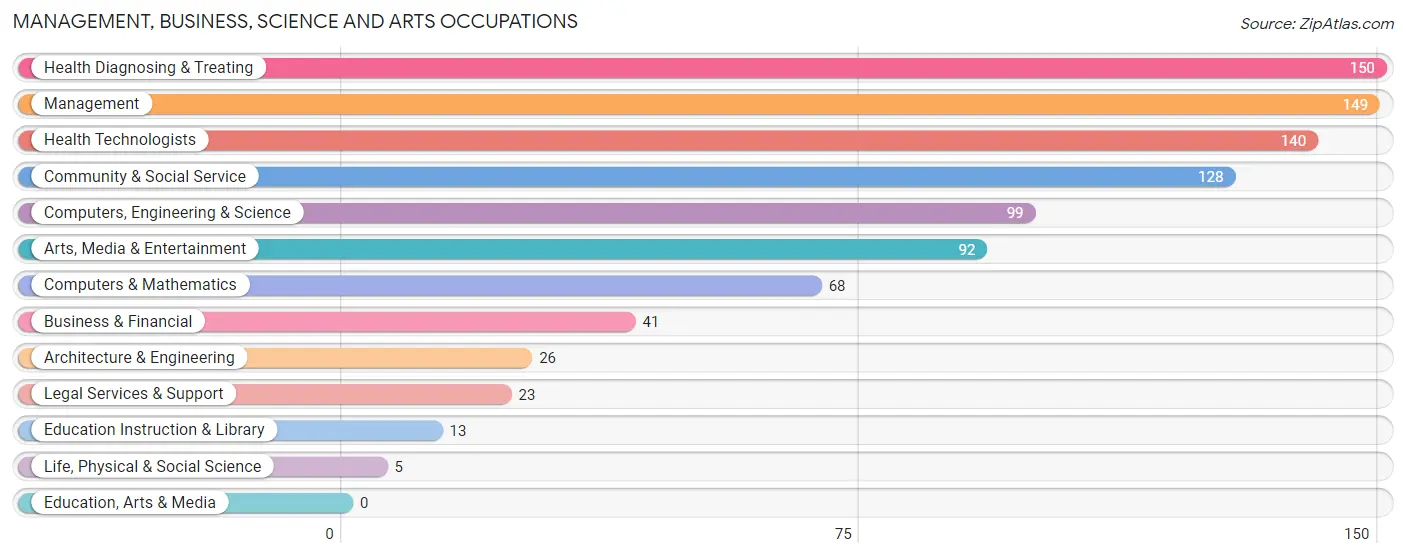
Management, Business, Science and Arts Occupations
The most common Management, Business, Science and Arts occupations in Bell Canyon are Health Diagnosing & Treating (150 | 18.5%), Management (149 | 18.4%), Health Technologists (140 | 17.3%), Community & Social Service (128 | 15.8%), and Computers, Engineering & Science (99 | 12.2%).
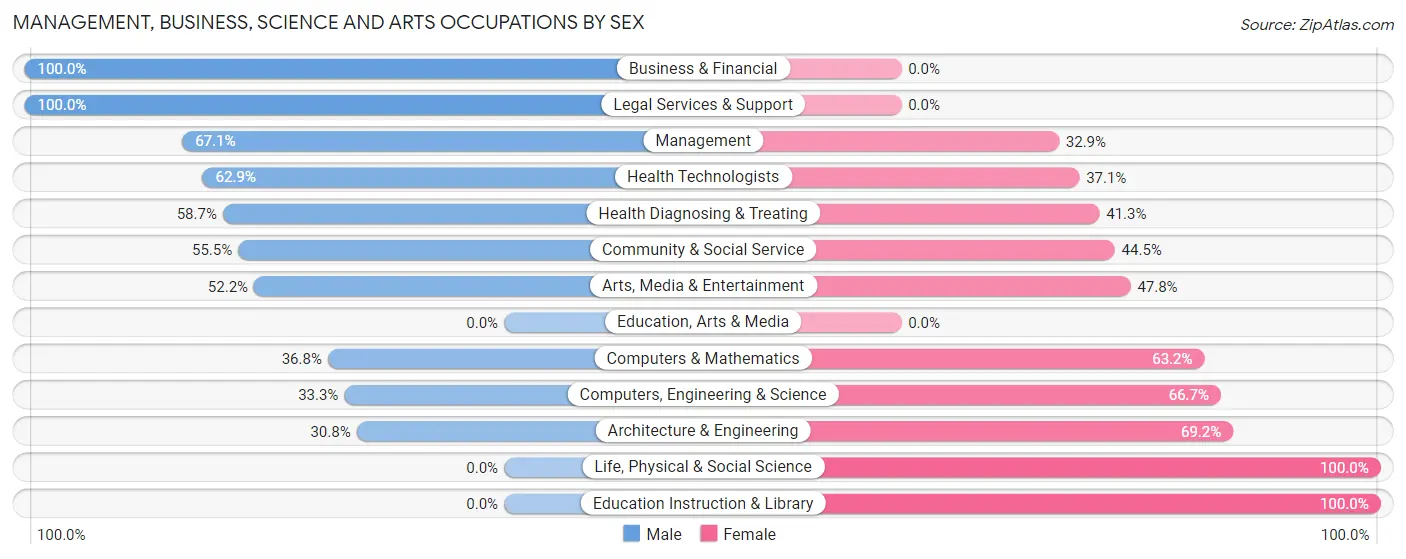
Management, Business, Science and Arts Occupations by Sex
Within the Management, Business, Science and Arts occupations in Bell Canyon, the most male-oriented occupations are Business & Financial (100.0%), Legal Services & Support (100.0%), and Management (67.1%), while the most female-oriented occupations are Life, Physical & Social Science (100.0%), Education Instruction & Library (100.0%), and Architecture & Engineering (69.2%).
| Occupation | Male | Female |
| Management | 100 (67.1%) | 49 (32.9%) |
| Business & Financial | 41 (100.0%) | 0 (0.0%) |
| Computers, Engineering & Science | 33 (33.3%) | 66 (66.7%) |
| Computers & Mathematics | 25 (36.8%) | 43 (63.2%) |
| Architecture & Engineering | 8 (30.8%) | 18 (69.2%) |
| Life, Physical & Social Science | 0 (0.0%) | 5 (100.0%) |
| Community & Social Service | 71 (55.5%) | 57 (44.5%) |
| Education, Arts & Media | 0 (0.0%) | 0 (0.0%) |
| Legal Services & Support | 23 (100.0%) | 0 (0.0%) |
| Education Instruction & Library | 0 (0.0%) | 13 (100.0%) |
| Arts, Media & Entertainment | 48 (52.2%) | 44 (47.8%) |
| Health Diagnosing & Treating | 88 (58.7%) | 62 (41.3%) |
| Health Technologists | 88 (62.9%) | 52 (37.1%) |
| Total (Category) | 333 (58.7%) | 234 (41.3%) |
| Total (Overall) | 449 (55.4%) | 361 (44.6%) |
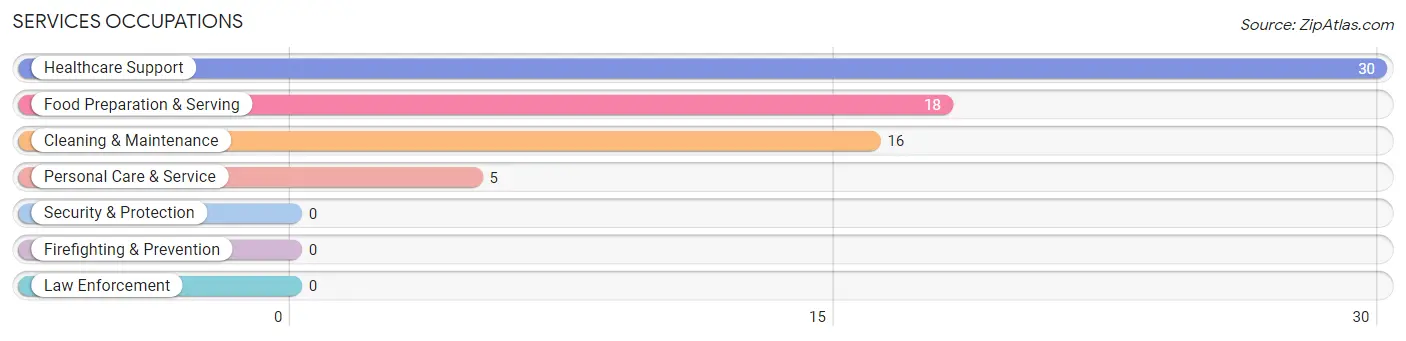
Services Occupations
The most common Services occupations in Bell Canyon are Healthcare Support (30 | 3.7%), Food Preparation & Serving (18 | 2.2%), Cleaning & Maintenance (16 | 2.0%), and Personal Care & Service (5 | 0.6%).
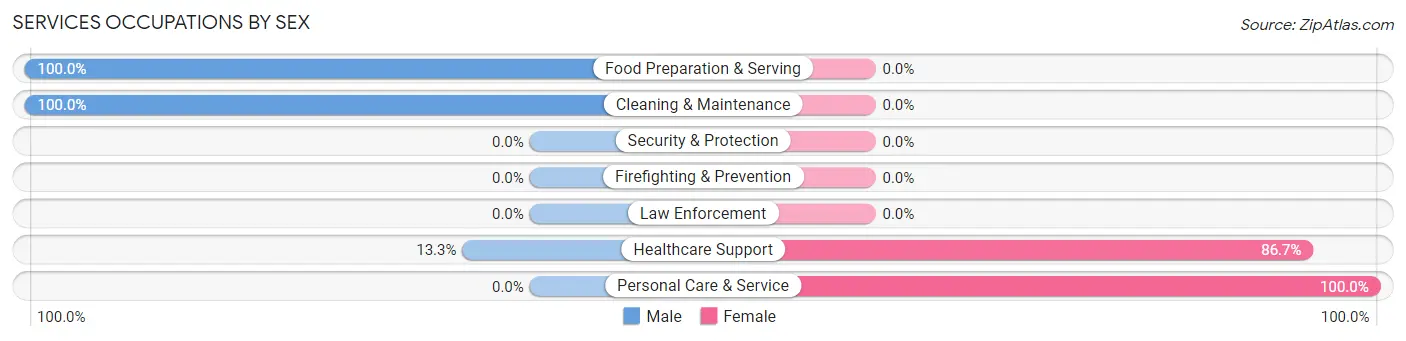
Services Occupations by Sex
Within the Services occupations in Bell Canyon, the most male-oriented occupations are Food Preparation & Serving (100.0%), Cleaning & Maintenance (100.0%), and Healthcare Support (13.3%), while the most female-oriented occupations are Personal Care & Service (100.0%), and Healthcare Support (86.7%).
| Occupation | Male | Female |
| Healthcare Support | 4 (13.3%) | 26 (86.7%) |
| Security & Protection | 0 (0.0%) | 0 (0.0%) |
| Firefighting & Prevention | 0 (0.0%) | 0 (0.0%) |
| Law Enforcement | 0 (0.0%) | 0 (0.0%) |
| Food Preparation & Serving | 18 (100.0%) | 0 (0.0%) |
| Cleaning & Maintenance | 16 (100.0%) | 0 (0.0%) |
| Personal Care & Service | 0 (0.0%) | 5 (100.0%) |
| Total (Category) | 38 (55.1%) | 31 (44.9%) |
| Total (Overall) | 449 (55.4%) | 361 (44.6%) |
Sales and Office Occupations
The most common Sales and Office occupations in Bell Canyon are Sales & Related (114 | 14.1%), and Office & Administration (34 | 4.2%).

Sales and Office Occupations by Sex

| Occupation | Male | Female |
| Sales & Related | 57 (50.0%) | 57 (50.0%) |
| Office & Administration | 0 (0.0%) | 34 (100.0%) |
| Total (Category) | 57 (38.5%) | 91 (61.5%) |
| Total (Overall) | 449 (55.4%) | 361 (44.6%) |
Natural Resources, Construction and Maintenance Occupations
The most common Natural Resources, Construction and Maintenance occupations in Bell Canyon are Installation, Maintenance & Repair (7 | 0.9%), and Farming, Fishing & Forestry (5 | 0.6%).
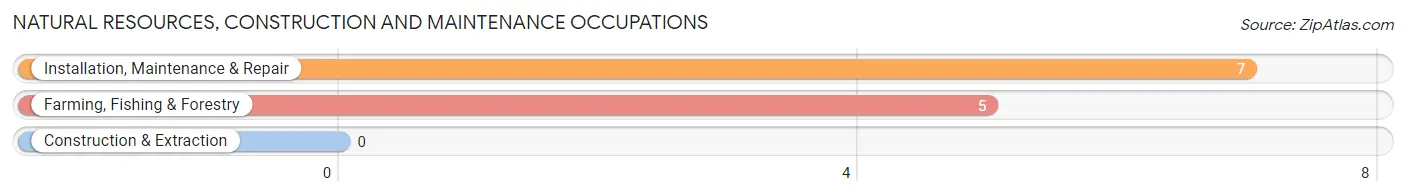
Natural Resources, Construction and Maintenance Occupations by Sex
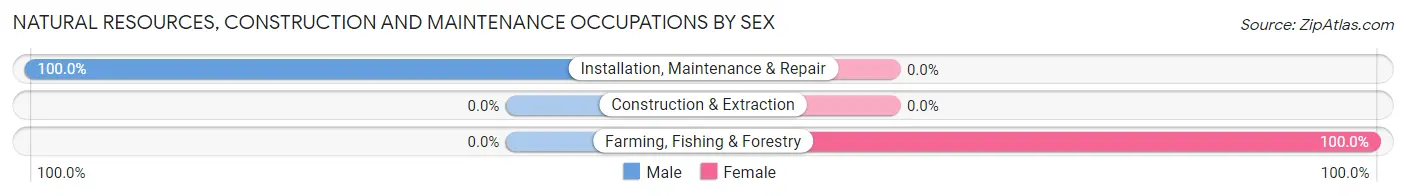
| Occupation | Male | Female |
| Farming, Fishing & Forestry | 0 (0.0%) | 5 (100.0%) |
| Construction & Extraction | 0 (0.0%) | 0 (0.0%) |
| Installation, Maintenance & Repair | 7 (100.0%) | 0 (0.0%) |
| Total (Category) | 7 (58.3%) | 5 (41.7%) |
| Total (Overall) | 449 (55.4%) | 361 (44.6%) |
Production, Transportation and Moving Occupations
The most common Production, Transportation and Moving occupations in Bell Canyon are , and Material Moving (14 | 1.7%).
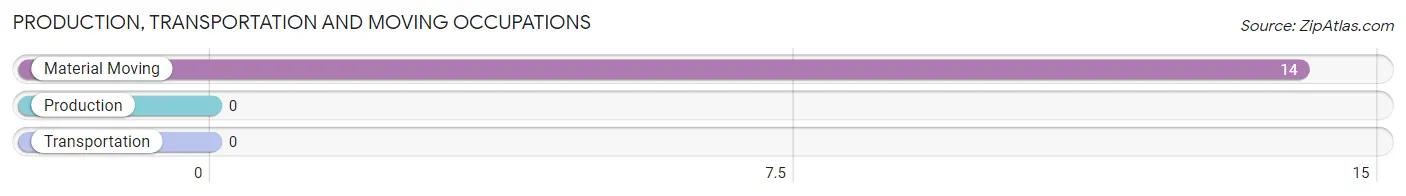
Production, Transportation and Moving Occupations by Sex
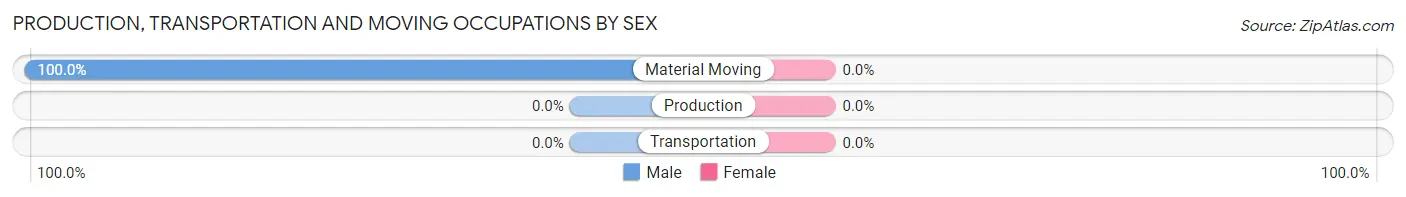
| Occupation | Male | Female |
| Production | 0 (0.0%) | 0 (0.0%) |
| Transportation | 0 (0.0%) | 0 (0.0%) |
| Material Moving | 14 (100.0%) | 0 (0.0%) |
| Total (Category) | 14 (100.0%) | 0 (0.0%) |
| Total (Overall) | 449 (55.4%) | 361 (44.6%) |
Employment Industries by Sex in Bell Canyon
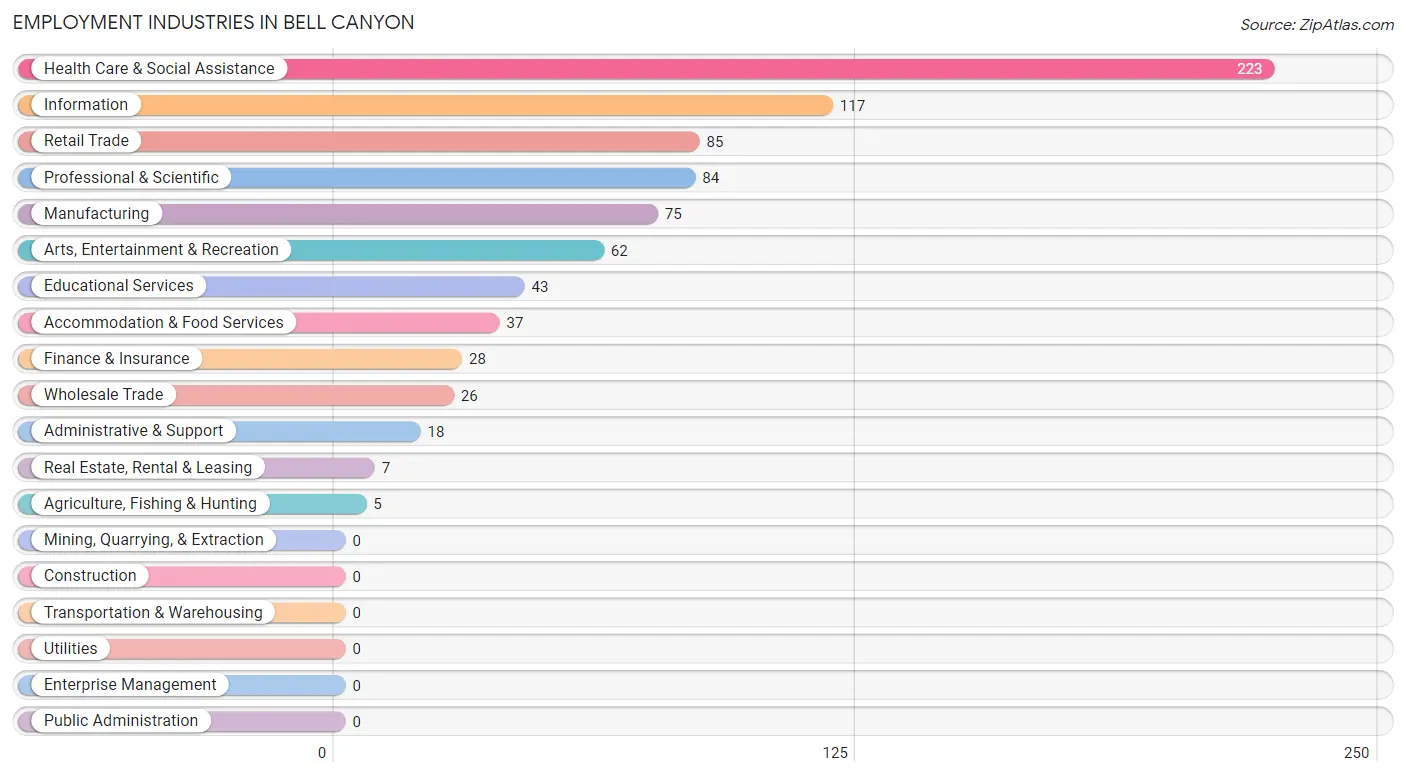
Employment Industries in Bell Canyon
The major employment industries in Bell Canyon include Health Care & Social Assistance (223 | 27.5%), Information (117 | 14.4%), Retail Trade (85 | 10.5%), Professional & Scientific (84 | 10.4%), and Manufacturing (75 | 9.3%).
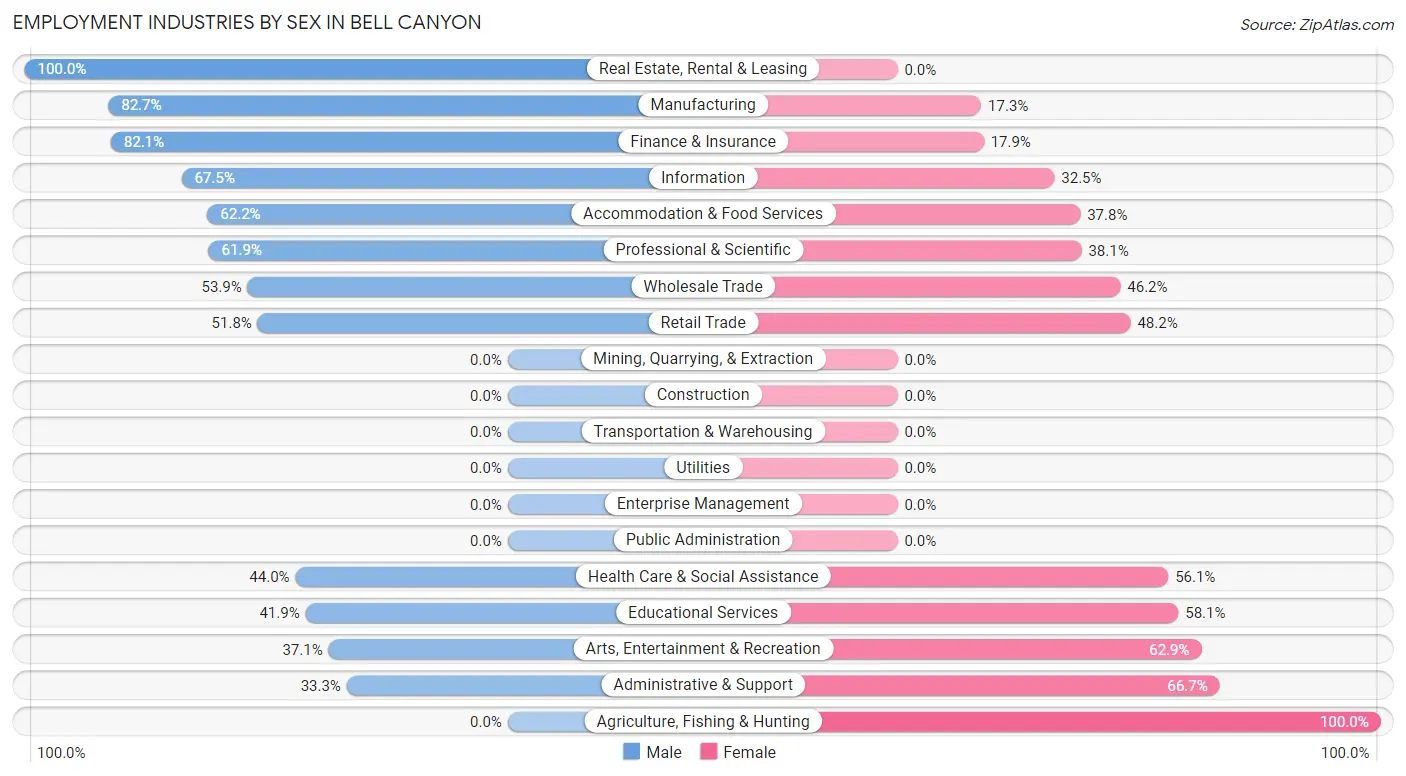
Employment Industries by Sex in Bell Canyon
The Bell Canyon industries that see more men than women are Real Estate, Rental & Leasing (100.0%), Manufacturing (82.7%), and Finance & Insurance (82.1%), whereas the industries that tend to have a higher number of women are Agriculture, Fishing & Hunting (100.0%), Administrative & Support (66.7%), and Arts, Entertainment & Recreation (62.9%).
| Industry | Male | Female |
| Agriculture, Fishing & Hunting | 0 (0.0%) | 5 (100.0%) |
| Mining, Quarrying, & Extraction | 0 (0.0%) | 0 (0.0%) |
| Construction | 0 (0.0%) | 0 (0.0%) |
| Manufacturing | 62 (82.7%) | 13 (17.3%) |
| Wholesale Trade | 14 (53.8%) | 12 (46.2%) |
| Retail Trade | 44 (51.8%) | 41 (48.2%) |
| Transportation & Warehousing | 0 (0.0%) | 0 (0.0%) |
| Utilities | 0 (0.0%) | 0 (0.0%) |
| Information | 79 (67.5%) | 38 (32.5%) |
| Finance & Insurance | 23 (82.1%) | 5 (17.9%) |
| Real Estate, Rental & Leasing | 7 (100.0%) | 0 (0.0%) |
| Professional & Scientific | 52 (61.9%) | 32 (38.1%) |
| Enterprise Management | 0 (0.0%) | 0 (0.0%) |
| Administrative & Support | 6 (33.3%) | 12 (66.7%) |
| Educational Services | 18 (41.9%) | 25 (58.1%) |
| Health Care & Social Assistance | 98 (44.0%) | 125 (56.0%) |
| Arts, Entertainment & Recreation | 23 (37.1%) | 39 (62.9%) |
| Accommodation & Food Services | 23 (62.2%) | 14 (37.8%) |
| Public Administration | 0 (0.0%) | 0 (0.0%) |
| Total | 449 (55.4%) | 361 (44.6%) |
Education in Bell Canyon
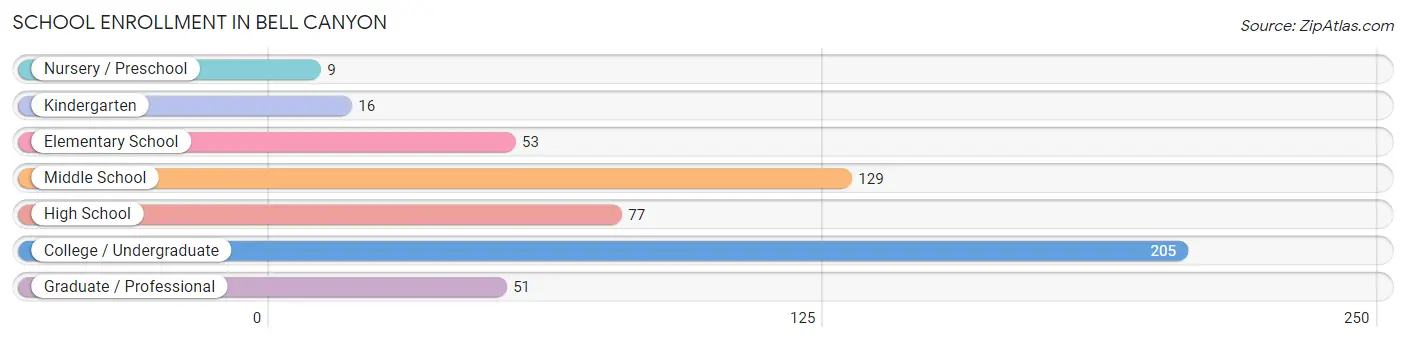
School Enrollment in Bell Canyon
The most common levels of schooling among the 540 students in Bell Canyon are college / undergraduate (205 | 38.0%), middle school (129 | 23.9%), and high school (77 | 14.3%).
| School Level | # Students | % Students |
| Nursery / Preschool | 9 | 1.7% |
| Kindergarten | 16 | 3.0% |
| Elementary School | 53 | 9.8% |
| Middle School | 129 | 23.9% |
| High School | 77 | 14.3% |
| College / Undergraduate | 205 | 38.0% |
| Graduate / Professional | 51 | 9.4% |
| Total | 540 | 100.0% |
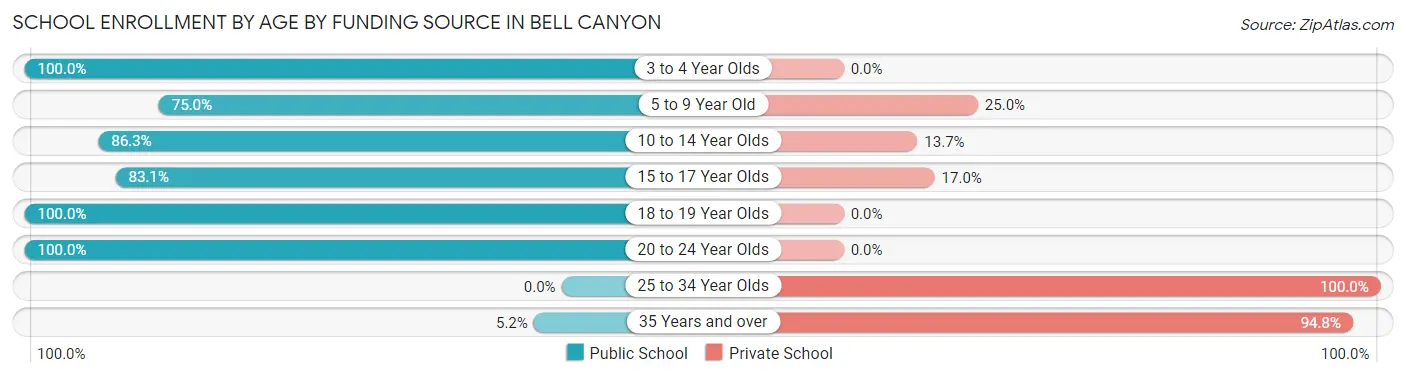
School Enrollment by Age by Funding Source in Bell Canyon
Out of a total of 540 students who are enrolled in schools in Bell Canyon, 132 (24.4%) attend a private institution, while the remaining 408 (75.6%) are enrolled in public schools. The age group of 25 to 34 year olds has the highest likelihood of being enrolled in private schools, with 12 (100.0% in the age bracket) enrolled. Conversely, the age group of 3 to 4 year olds has the lowest likelihood of being enrolled in a private school, with 8 (100.0% in the age bracket) attending a public institution.
| Age Bracket | Public School | Private School |
| 3 to 4 Year Olds | 8 (100.0%) | 0 (0.0%) |
| 5 to 9 Year Old | 48 (75.0%) | 16 (25.0%) |
| 10 to 14 Year Olds | 132 (86.3%) | 21 (13.7%) |
| 15 to 17 Year Olds | 49 (83.1%) | 10 (17.0%) |
| 18 to 19 Year Olds | 97 (100.0%) | 0 (0.0%) |
| 20 to 24 Year Olds | 70 (100.0%) | 0 (0.0%) |
| 25 to 34 Year Olds | 0 (0.0%) | 12 (100.0%) |
| 35 Years and over | 4 (5.2%) | 73 (94.8%) |
| Total | 408 (75.6%) | 132 (24.4%) |
Educational Attainment by Field of Study in Bell Canyon
Business (170 | 19.5%), social sciences (116 | 13.3%), visual & performing arts (114 | 13.1%), bio, nature & agricultural (108 | 12.4%), and science & technology (82 | 9.4%) are the most common fields of study among 871 individuals in Bell Canyon who have obtained a bachelor's degree or higher.
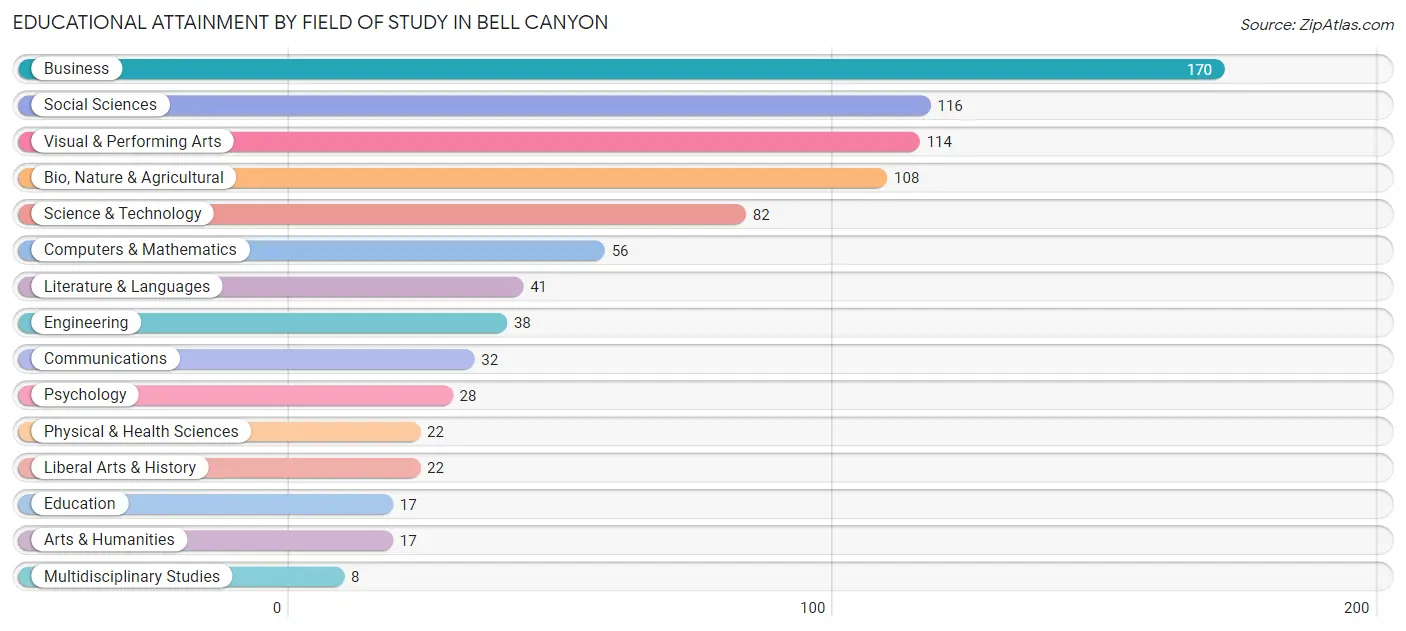
| Field of Study | # Graduates | % Graduates |
| Computers & Mathematics | 56 | 6.4% |
| Bio, Nature & Agricultural | 108 | 12.4% |
| Physical & Health Sciences | 22 | 2.5% |
| Psychology | 28 | 3.2% |
| Social Sciences | 116 | 13.3% |
| Engineering | 38 | 4.4% |
| Multidisciplinary Studies | 8 | 0.9% |
| Science & Technology | 82 | 9.4% |
| Business | 170 | 19.5% |
| Education | 17 | 1.9% |
| Literature & Languages | 41 | 4.7% |
| Liberal Arts & History | 22 | 2.5% |
| Visual & Performing Arts | 114 | 13.1% |
| Communications | 32 | 3.7% |
| Arts & Humanities | 17 | 1.9% |
| Total | 871 | 100.0% |
Transportation & Commute in Bell Canyon
Vehicle Availability by Sex in Bell Canyon
The most prevalent vehicle ownership categories in Bell Canyon are males with 3 vehicles (159, accounting for 35.7%) and females with 3 vehicles (83, making up 44.7%).
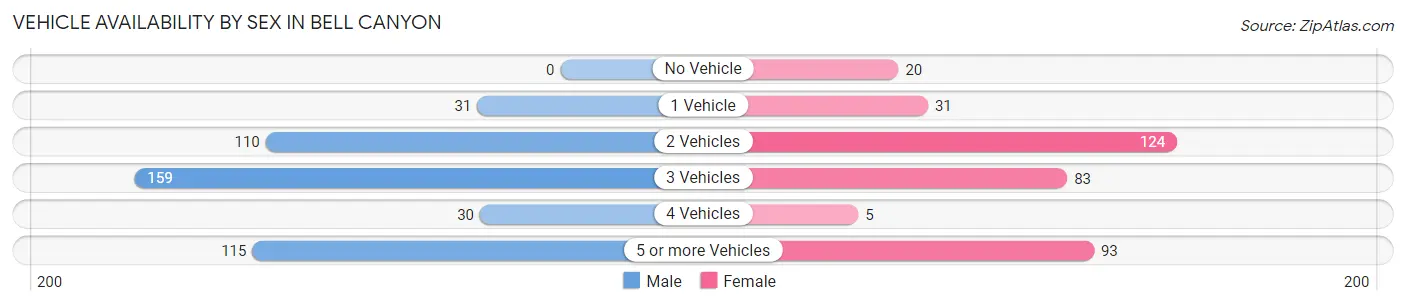
| Vehicles Available | Male | Female |
| No Vehicle | 0 (0.0%) | 20 (5.6%) |
| 1 Vehicle | 31 (7.0%) | 31 (8.7%) |
| 2 Vehicles | 110 (24.7%) | 124 (34.8%) |
| 3 Vehicles | 159 (35.7%) | 83 (23.3%) |
| 4 Vehicles | 30 (6.7%) | 5 (1.4%) |
| 5 or more Vehicles | 115 (25.8%) | 93 (26.1%) |
| Total | 445 (100.0%) | 356 (100.0%) |
Commute Time in Bell Canyon
The most frequently occuring commute durations in Bell Canyon are 45 to 59 minutes (119 commuters, 18.5%), 60 to 89 minutes (110 commuters, 17.1%), and 15 to 19 minutes (71 commuters, 11.0%).
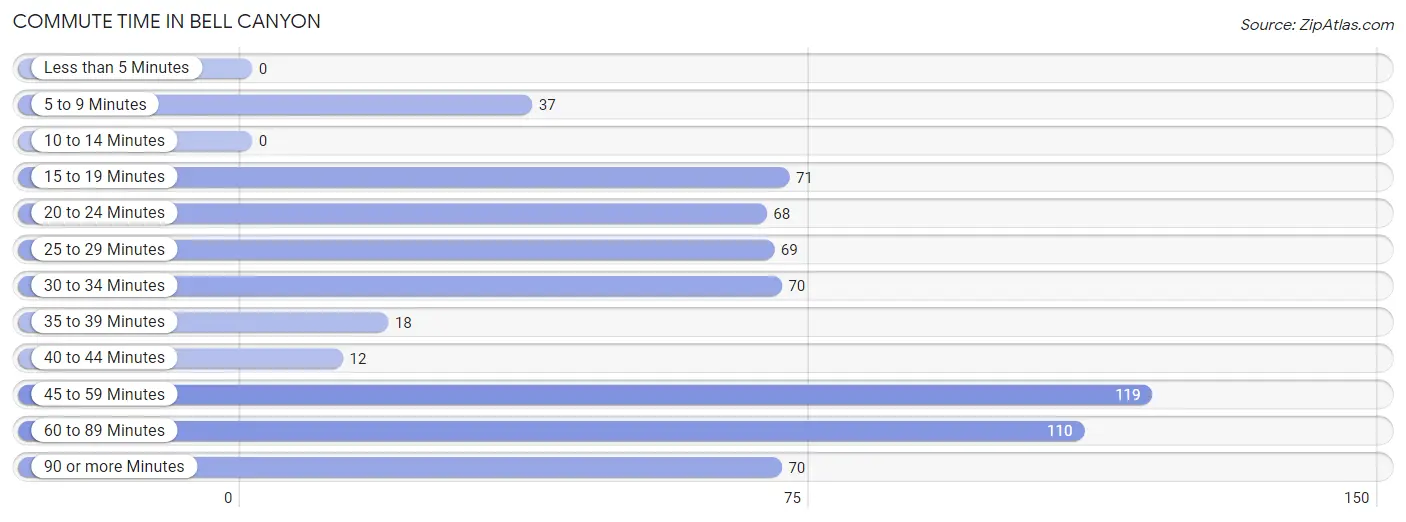
| Commute Time | # Commuters | % Commuters |
| Less than 5 Minutes | 0 | 0.0% |
| 5 to 9 Minutes | 37 | 5.8% |
| 10 to 14 Minutes | 0 | 0.0% |
| 15 to 19 Minutes | 71 | 11.0% |
| 20 to 24 Minutes | 68 | 10.6% |
| 25 to 29 Minutes | 69 | 10.7% |
| 30 to 34 Minutes | 70 | 10.9% |
| 35 to 39 Minutes | 18 | 2.8% |
| 40 to 44 Minutes | 12 | 1.9% |
| 45 to 59 Minutes | 119 | 18.5% |
| 60 to 89 Minutes | 110 | 17.1% |
| 90 or more Minutes | 70 | 10.9% |
Commute Time by Sex in Bell Canyon
The most common commute times in Bell Canyon are 60 to 89 minutes (84 commuters, 23.1%) for males and 90 or more minutes (51 commuters, 18.1%) for females.
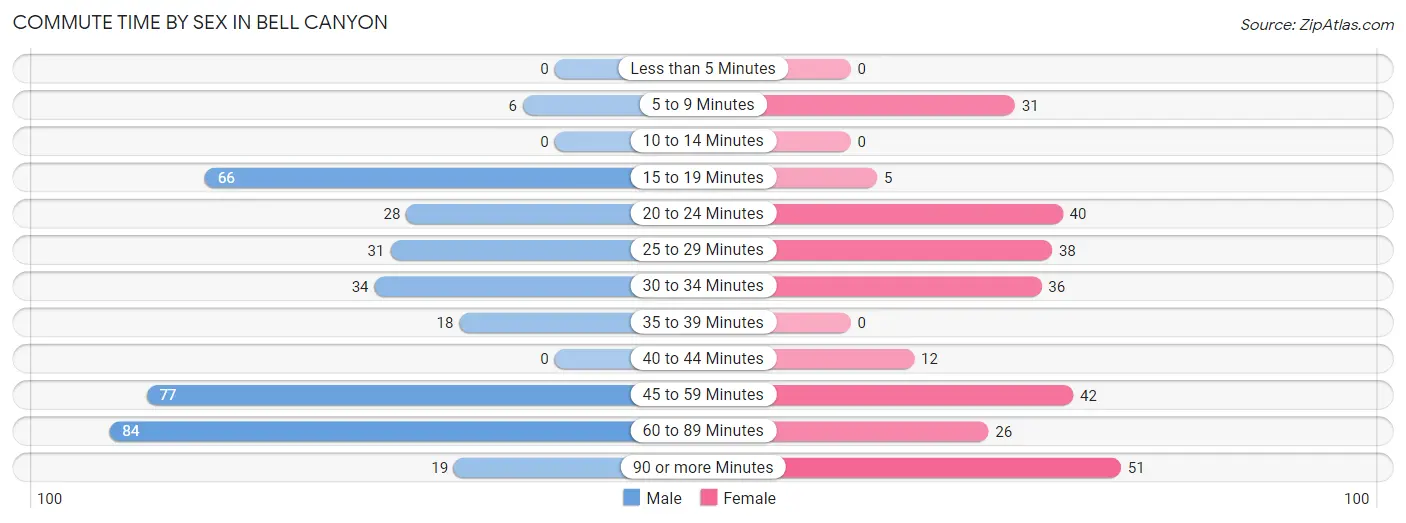
| Commute Time | Male | Female |
| Less than 5 Minutes | 0 (0.0%) | 0 (0.0%) |
| 5 to 9 Minutes | 6 (1.7%) | 31 (11.0%) |
| 10 to 14 Minutes | 0 (0.0%) | 0 (0.0%) |
| 15 to 19 Minutes | 66 (18.2%) | 5 (1.8%) |
| 20 to 24 Minutes | 28 (7.7%) | 40 (14.2%) |
| 25 to 29 Minutes | 31 (8.5%) | 38 (13.5%) |
| 30 to 34 Minutes | 34 (9.4%) | 36 (12.8%) |
| 35 to 39 Minutes | 18 (5.0%) | 0 (0.0%) |
| 40 to 44 Minutes | 0 (0.0%) | 12 (4.3%) |
| 45 to 59 Minutes | 77 (21.2%) | 42 (14.9%) |
| 60 to 89 Minutes | 84 (23.1%) | 26 (9.2%) |
| 90 or more Minutes | 19 (5.2%) | 51 (18.1%) |
Time of Departure to Work by Sex in Bell Canyon
The most frequent times of departure to work in Bell Canyon are 9:00 AM to 9:59 AM (95, 26.2%) for males and 7:30 AM to 7:59 AM (71, 25.3%) for females.
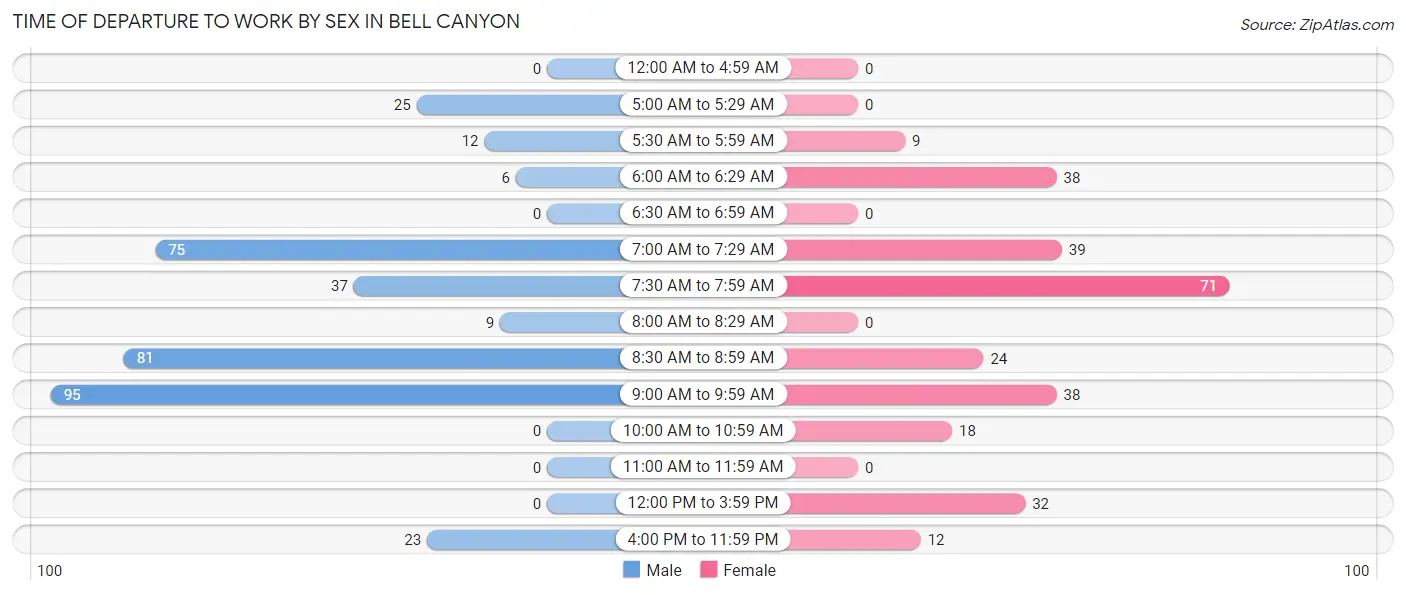
| Time of Departure | Male | Female |
| 12:00 AM to 4:59 AM | 0 (0.0%) | 0 (0.0%) |
| 5:00 AM to 5:29 AM | 25 (6.9%) | 0 (0.0%) |
| 5:30 AM to 5:59 AM | 12 (3.3%) | 9 (3.2%) |
| 6:00 AM to 6:29 AM | 6 (1.7%) | 38 (13.5%) |
| 6:30 AM to 6:59 AM | 0 (0.0%) | 0 (0.0%) |
| 7:00 AM to 7:29 AM | 75 (20.7%) | 39 (13.9%) |
| 7:30 AM to 7:59 AM | 37 (10.2%) | 71 (25.3%) |
| 8:00 AM to 8:29 AM | 9 (2.5%) | 0 (0.0%) |
| 8:30 AM to 8:59 AM | 81 (22.3%) | 24 (8.5%) |
| 9:00 AM to 9:59 AM | 95 (26.2%) | 38 (13.5%) |
| 10:00 AM to 10:59 AM | 0 (0.0%) | 18 (6.4%) |
| 11:00 AM to 11:59 AM | 0 (0.0%) | 0 (0.0%) |
| 12:00 PM to 3:59 PM | 0 (0.0%) | 32 (11.4%) |
| 4:00 PM to 11:59 PM | 23 (6.3%) | 12 (4.3%) |
| Total | 363 (100.0%) | 281 (100.0%) |
Housing Occupancy in Bell Canyon
Occupancy by Ownership in Bell Canyon
Of the total 528 dwellings in Bell Canyon, owner-occupied units account for 517 (97.9%), while renter-occupied units make up 11 (2.1%).
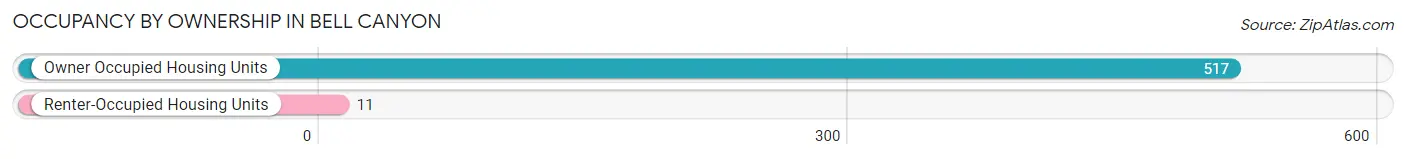
| Occupancy | # Housing Units | % Housing Units |
| Owner Occupied Housing Units | 517 | 97.9% |
| Renter-Occupied Housing Units | 11 | 2.1% |
| Total Occupied Housing Units | 528 | 100.0% |
Occupancy by Household Size in Bell Canyon
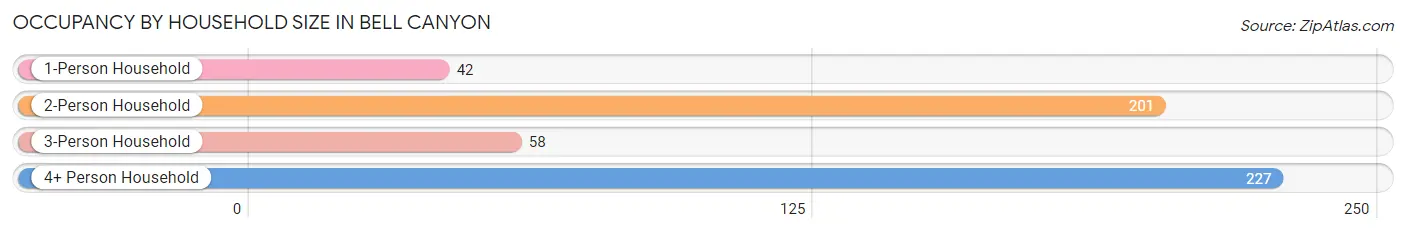
| Household Size | # Housing Units | % Housing Units |
| 1-Person Household | 42 | 8.0% |
| 2-Person Household | 201 | 38.1% |
| 3-Person Household | 58 | 11.0% |
| 4+ Person Household | 227 | 43.0% |
| Total Housing Units | 528 | 100.0% |
Occupancy by Ownership by Household Size in Bell Canyon
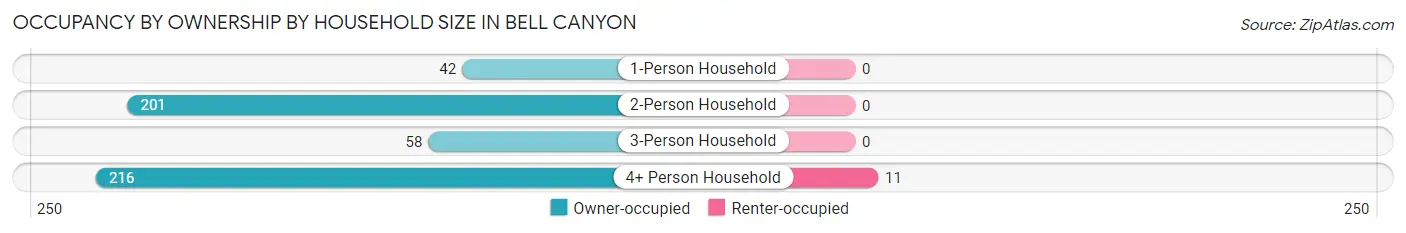
| Household Size | Owner-occupied | Renter-occupied |
| 1-Person Household | 42 (100.0%) | 0 (0.0%) |
| 2-Person Household | 201 (100.0%) | 0 (0.0%) |
| 3-Person Household | 58 (100.0%) | 0 (0.0%) |
| 4+ Person Household | 216 (95.2%) | 11 (4.9%) |
| Total Housing Units | 517 (97.9%) | 11 (2.1%) |
Occupancy by Educational Attainment in Bell Canyon
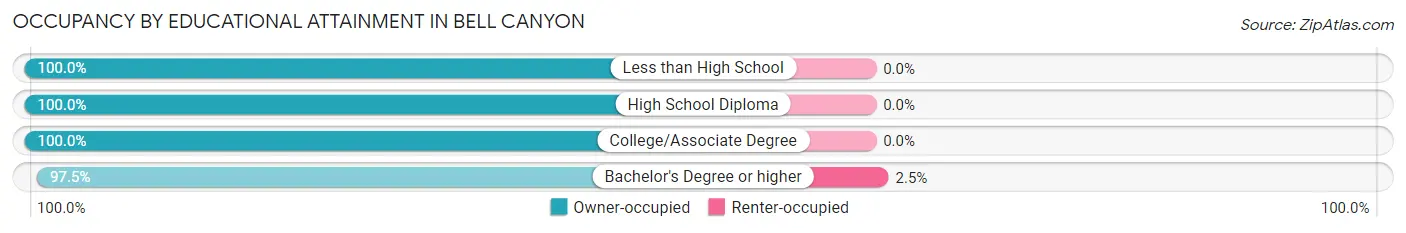
| Household Size | Owner-occupied | Renter-occupied |
| Less than High School | 28 (100.0%) | 0 (0.0%) |
| High School Diploma | 20 (100.0%) | 0 (0.0%) |
| College/Associate Degree | 33 (100.0%) | 0 (0.0%) |
| Bachelor's Degree or higher | 436 (97.5%) | 11 (2.5%) |
Occupancy by Age of Householder in Bell Canyon
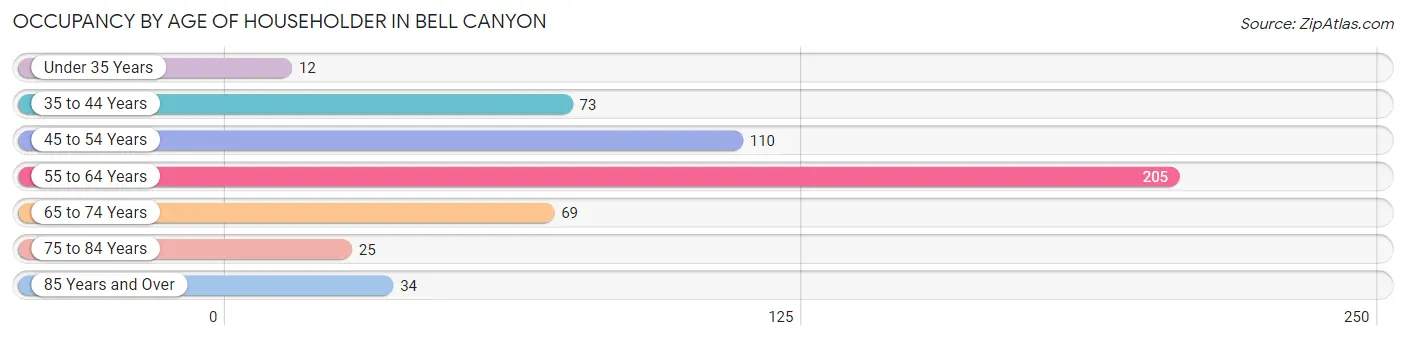
| Age Bracket | # Households | % Households |
| Under 35 Years | 12 | 2.3% |
| 35 to 44 Years | 73 | 13.8% |
| 45 to 54 Years | 110 | 20.8% |
| 55 to 64 Years | 205 | 38.8% |
| 65 to 74 Years | 69 | 13.1% |
| 75 to 84 Years | 25 | 4.7% |
| 85 Years and Over | 34 | 6.4% |
| Total | 528 | 100.0% |
Housing Finances in Bell Canyon
Median Income by Occupancy in Bell Canyon
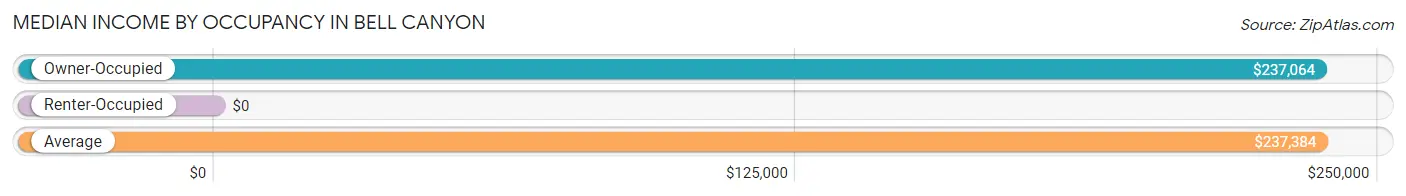
| Occupancy Type | # Households | Median Income |
| Owner-Occupied | 517 (97.9%) | $237,064 |
| Renter-Occupied | 11 (2.1%) | $0 |
| Average | 528 (100.0%) | $237,384 |
Occupancy by Householder Income Bracket in Bell Canyon
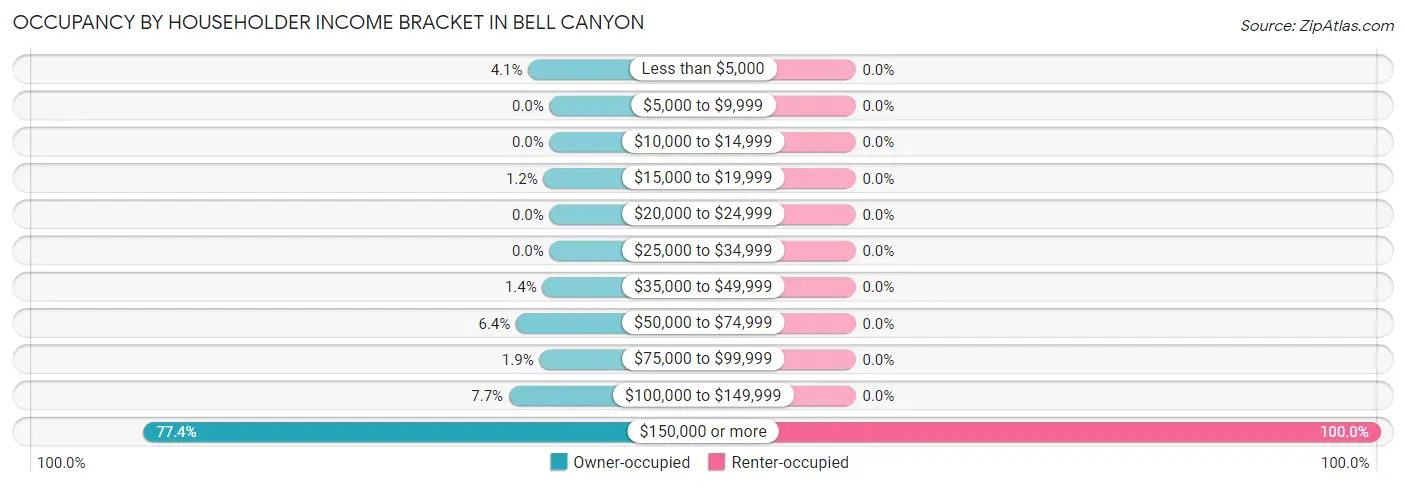
| Income Bracket | Owner-occupied | Renter-occupied |
| Less than $5,000 | 21 (4.1%) | 0 (0.0%) |
| $5,000 to $9,999 | 0 (0.0%) | 0 (0.0%) |
| $10,000 to $14,999 | 0 (0.0%) | 0 (0.0%) |
| $15,000 to $19,999 | 6 (1.2%) | 0 (0.0%) |
| $20,000 to $24,999 | 0 (0.0%) | 0 (0.0%) |
| $25,000 to $34,999 | 0 (0.0%) | 0 (0.0%) |
| $35,000 to $49,999 | 7 (1.3%) | 0 (0.0%) |
| $50,000 to $74,999 | 33 (6.4%) | 0 (0.0%) |
| $75,000 to $99,999 | 10 (1.9%) | 0 (0.0%) |
| $100,000 to $149,999 | 40 (7.7%) | 0 (0.0%) |
| $150,000 or more | 400 (77.4%) | 11 (100.0%) |
| Total | 517 (100.0%) | 11 (100.0%) |
Monthly Housing Cost Tiers in Bell Canyon
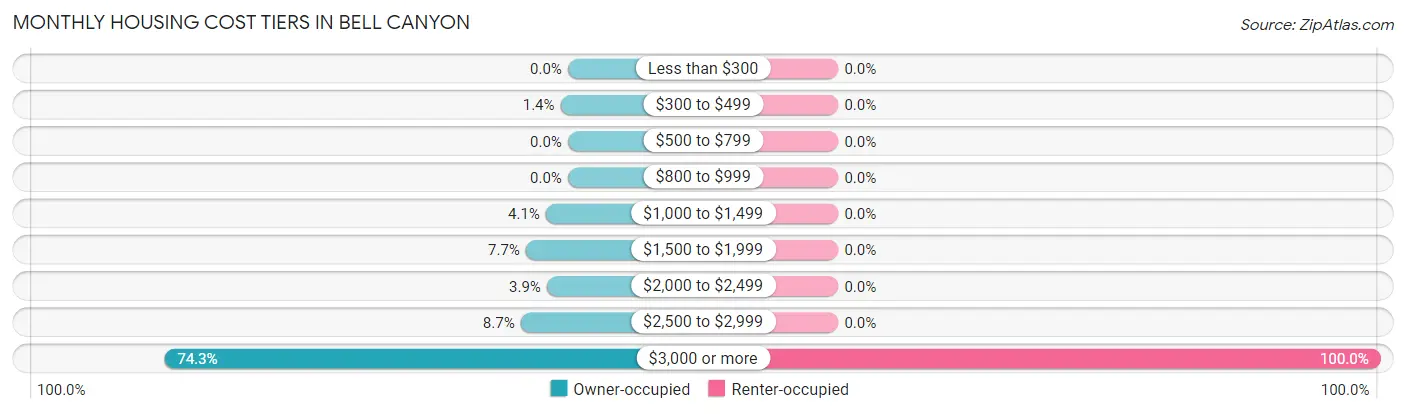
| Monthly Cost | Owner-occupied | Renter-occupied |
| Less than $300 | 0 (0.0%) | 0 (0.0%) |
| $300 to $499 | 7 (1.3%) | 0 (0.0%) |
| $500 to $799 | 0 (0.0%) | 0 (0.0%) |
| $800 to $999 | 0 (0.0%) | 0 (0.0%) |
| $1,000 to $1,499 | 21 (4.1%) | 0 (0.0%) |
| $1,500 to $1,999 | 40 (7.7%) | 0 (0.0%) |
| $2,000 to $2,499 | 20 (3.9%) | 0 (0.0%) |
| $2,500 to $2,999 | 45 (8.7%) | 0 (0.0%) |
| $3,000 or more | 384 (74.3%) | 11 (100.0%) |
| Total | 517 (100.0%) | 11 (100.0%) |
Physical Housing Characteristics in Bell Canyon
Housing Structures in Bell Canyon
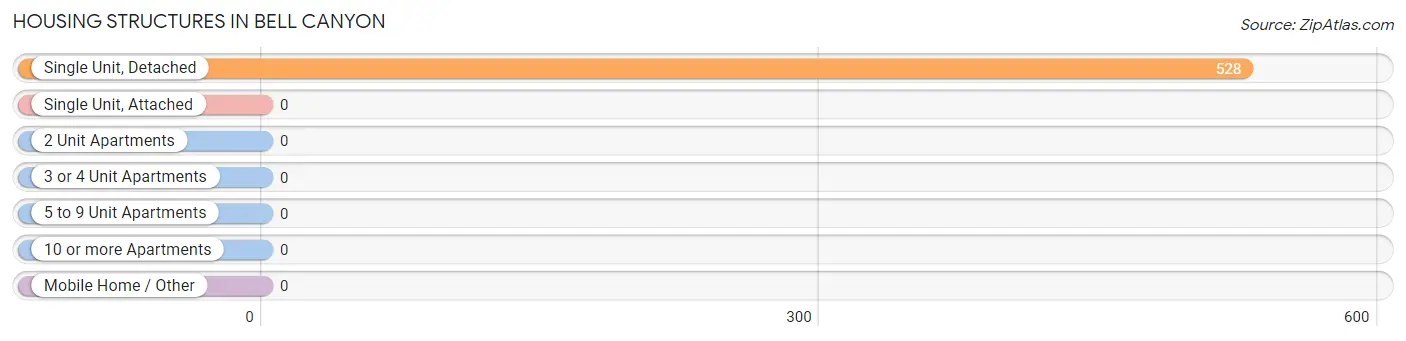
| Structure Type | # Housing Units | % Housing Units |
| Single Unit, Detached | 528 | 100.0% |
| Single Unit, Attached | 0 | 0.0% |
| 2 Unit Apartments | 0 | 0.0% |
| 3 or 4 Unit Apartments | 0 | 0.0% |
| 5 to 9 Unit Apartments | 0 | 0.0% |
| 10 or more Apartments | 0 | 0.0% |
| Mobile Home / Other | 0 | 0.0% |
| Total | 528 | 100.0% |
Housing Structures by Occupancy in Bell Canyon
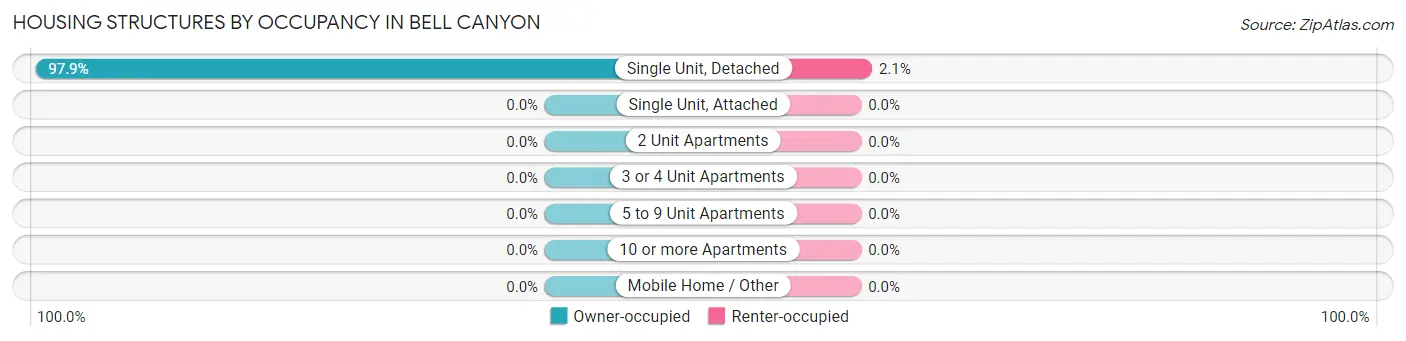
| Structure Type | Owner-occupied | Renter-occupied |
| Single Unit, Detached | 517 (97.9%) | 11 (2.1%) |
| Single Unit, Attached | 0 (0.0%) | 0 (0.0%) |
| 2 Unit Apartments | 0 (0.0%) | 0 (0.0%) |
| 3 or 4 Unit Apartments | 0 (0.0%) | 0 (0.0%) |
| 5 to 9 Unit Apartments | 0 (0.0%) | 0 (0.0%) |
| 10 or more Apartments | 0 (0.0%) | 0 (0.0%) |
| Mobile Home / Other | 0 (0.0%) | 0 (0.0%) |
| Total | 517 (97.9%) | 11 (2.1%) |
Housing Structures by Number of Rooms in Bell Canyon
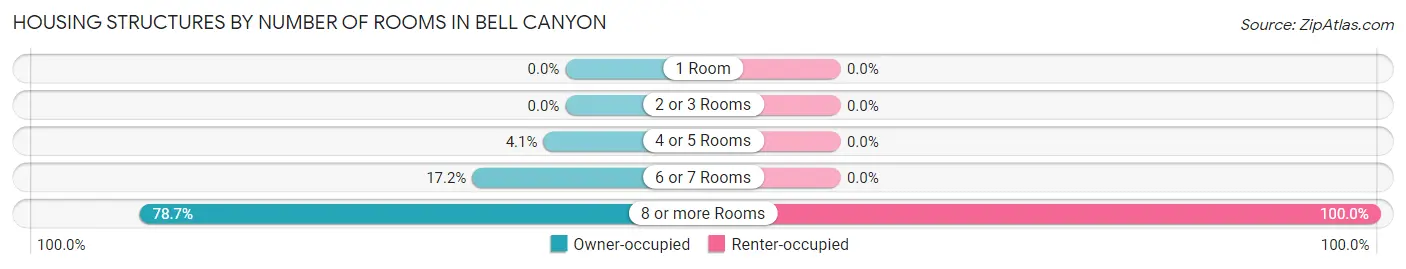
| Number of Rooms | Owner-occupied | Renter-occupied |
| 1 Room | 0 (0.0%) | 0 (0.0%) |
| 2 or 3 Rooms | 0 (0.0%) | 0 (0.0%) |
| 4 or 5 Rooms | 21 (4.1%) | 0 (0.0%) |
| 6 or 7 Rooms | 89 (17.2%) | 0 (0.0%) |
| 8 or more Rooms | 407 (78.7%) | 11 (100.0%) |
| Total | 517 (100.0%) | 11 (100.0%) |
Housing Structure by Heating Type in Bell Canyon
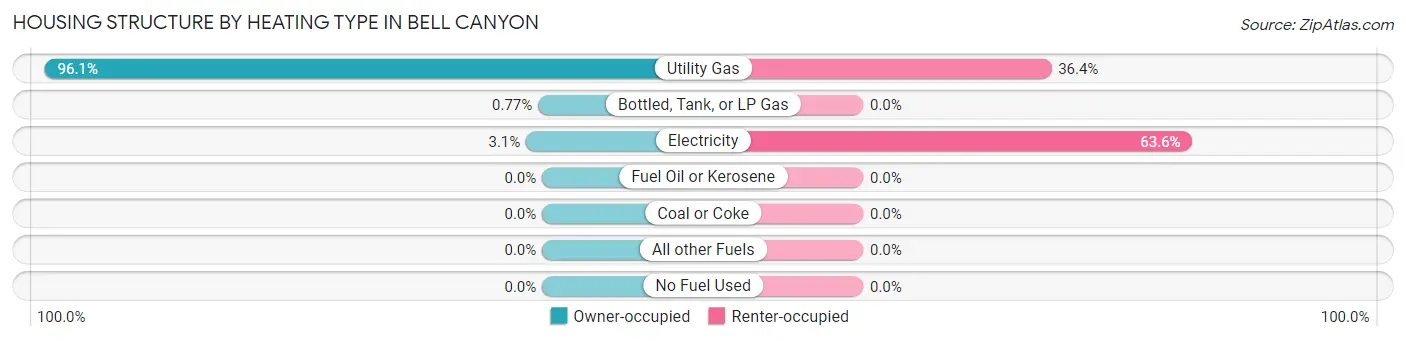
| Heating Type | Owner-occupied | Renter-occupied |
| Utility Gas | 497 (96.1%) | 4 (36.4%) |
| Bottled, Tank, or LP Gas | 4 (0.8%) | 0 (0.0%) |
| Electricity | 16 (3.1%) | 7 (63.6%) |
| Fuel Oil or Kerosene | 0 (0.0%) | 0 (0.0%) |
| Coal or Coke | 0 (0.0%) | 0 (0.0%) |
| All other Fuels | 0 (0.0%) | 0 (0.0%) |
| No Fuel Used | 0 (0.0%) | 0 (0.0%) |
| Total | 517 (100.0%) | 11 (100.0%) |
Household Vehicle Usage in Bell Canyon
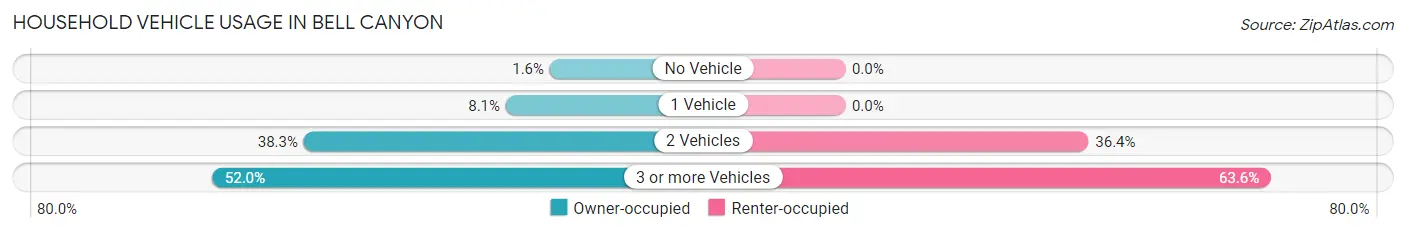
| Vehicles per Household | Owner-occupied | Renter-occupied |
| No Vehicle | 8 (1.5%) | 0 (0.0%) |
| 1 Vehicle | 42 (8.1%) | 0 (0.0%) |
| 2 Vehicles | 198 (38.3%) | 4 (36.4%) |
| 3 or more Vehicles | 269 (52.0%) | 7 (63.6%) |
| Total | 517 (100.0%) | 11 (100.0%) |
Real Estate & Mortgages in Bell Canyon
Real Estate and Mortgage Overview in Bell Canyon
| Characteristic | Without Mortgage | With Mortgage |
| Housing Units | 113 | 404 |
| Median Property Value | $1,917,700 | $1,894,700 |
| Median Household Income | $208,375 | $309 |
| Monthly Housing Costs | $1,501 | $358 |
| Real Estate Taxes | $10,001 | $0 |
Property Value by Mortgage Status in Bell Canyon
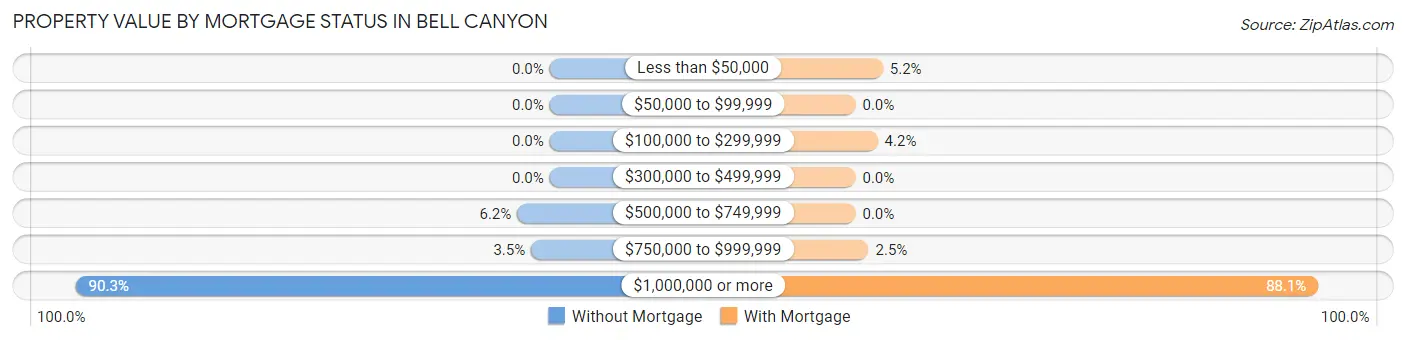
| Property Value | Without Mortgage | With Mortgage |
| Less than $50,000 | 0 (0.0%) | 21 (5.2%) |
| $50,000 to $99,999 | 0 (0.0%) | 0 (0.0%) |
| $100,000 to $299,999 | 0 (0.0%) | 17 (4.2%) |
| $300,000 to $499,999 | 0 (0.0%) | 0 (0.0%) |
| $500,000 to $749,999 | 7 (6.2%) | 0 (0.0%) |
| $750,000 to $999,999 | 4 (3.5%) | 10 (2.5%) |
| $1,000,000 or more | 102 (90.3%) | 356 (88.1%) |
| Total | 113 (100.0%) | 404 (100.0%) |
Household Income by Mortgage Status in Bell Canyon
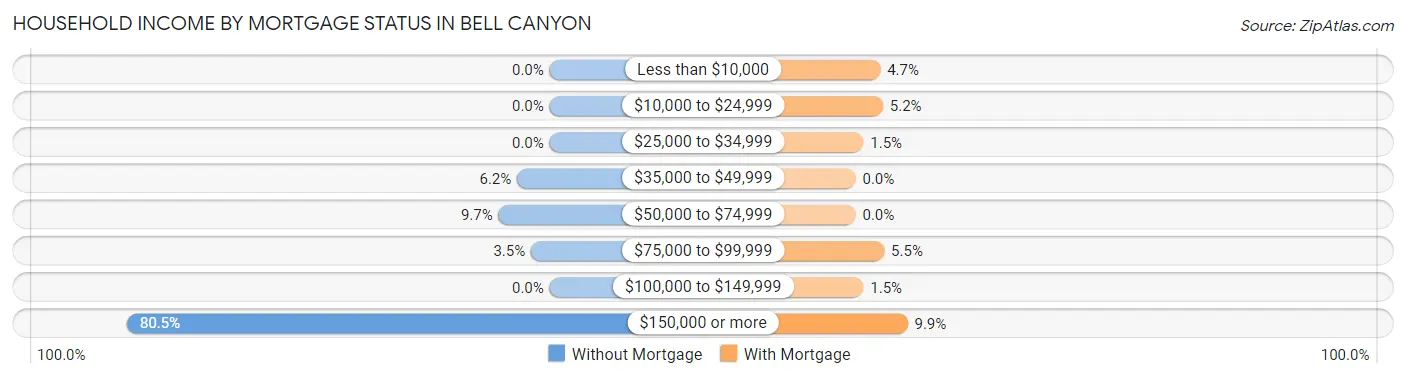
| Household Income | Without Mortgage | With Mortgage |
| Less than $10,000 | 0 (0.0%) | 19 (4.7%) |
| $10,000 to $24,999 | 0 (0.0%) | 21 (5.2%) |
| $25,000 to $34,999 | 0 (0.0%) | 6 (1.5%) |
| $35,000 to $49,999 | 7 (6.2%) | 0 (0.0%) |
| $50,000 to $74,999 | 11 (9.7%) | 0 (0.0%) |
| $75,000 to $99,999 | 4 (3.5%) | 22 (5.4%) |
| $100,000 to $149,999 | 0 (0.0%) | 6 (1.5%) |
| $150,000 or more | 91 (80.5%) | 40 (9.9%) |
| Total | 113 (100.0%) | 404 (100.0%) |
Property Value to Household Income Ratio in Bell Canyon
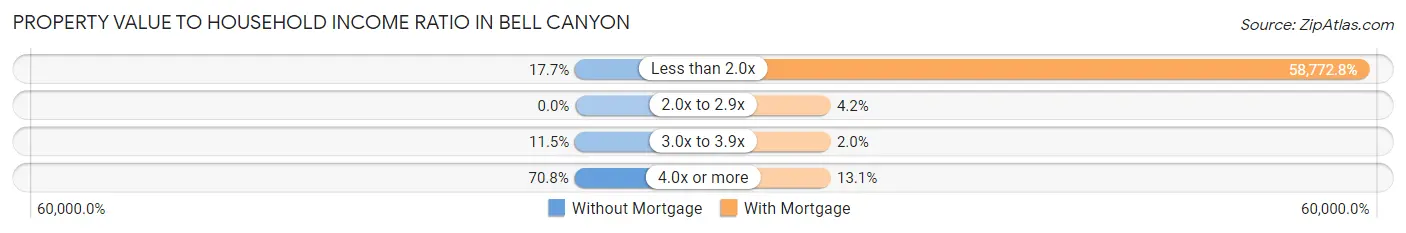
| Value-to-Income Ratio | Without Mortgage | With Mortgage |
| Less than 2.0x | 20 (17.7%) | 237,442 (58,772.8%) |
| 2.0x to 2.9x | 0 (0.0%) | 17 (4.2%) |
| 3.0x to 3.9x | 13 (11.5%) | 8 (2.0%) |
| 4.0x or more | 80 (70.8%) | 53 (13.1%) |
| Total | 113 (100.0%) | 404 (100.0%) |
Real Estate Taxes by Mortgage Status in Bell Canyon
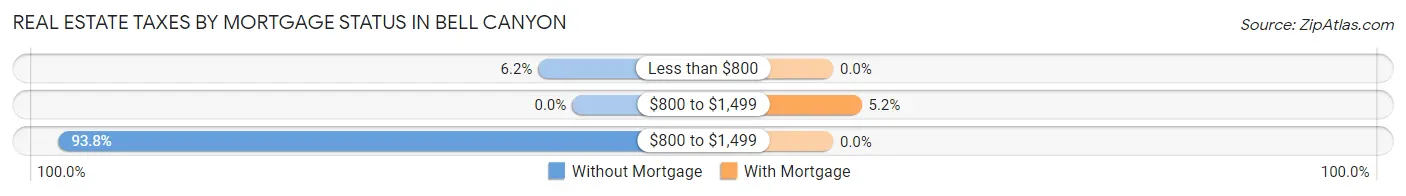
| Property Taxes | Without Mortgage | With Mortgage |
| Less than $800 | 7 (6.2%) | 0 (0.0%) |
| $800 to $1,499 | 0 (0.0%) | 21 (5.2%) |
| $800 to $1,499 | 106 (93.8%) | 0 (0.0%) |
| Total | 113 (100.0%) | 404 (100.0%) |
Health & Disability in Bell Canyon
Health Insurance Coverage by Age in Bell Canyon
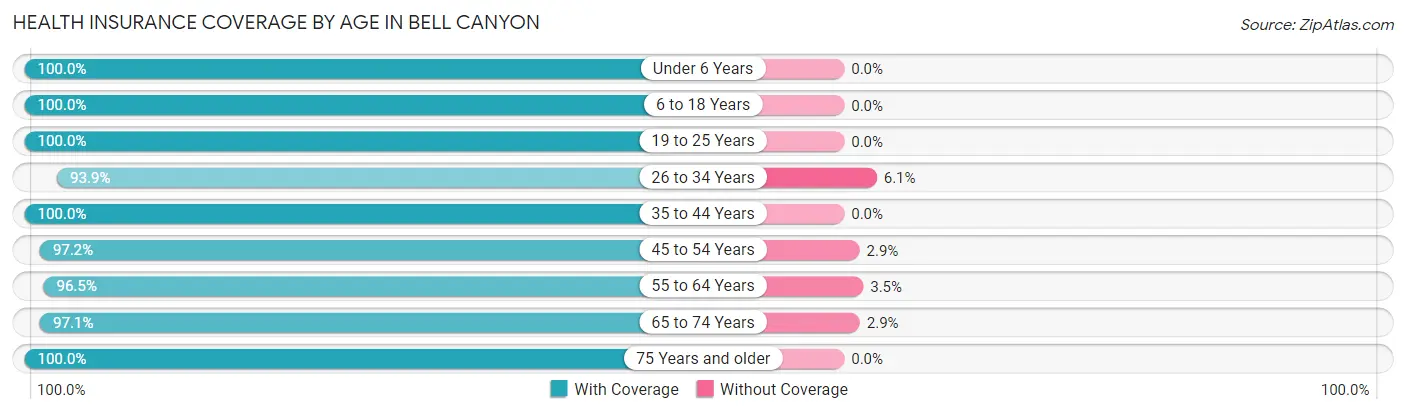
| Age Bracket | With Coverage | Without Coverage |
| Under 6 Years | 53 (100.0%) | 0 (0.0%) |
| 6 to 18 Years | 360 (100.0%) | 0 (0.0%) |
| 19 to 25 Years | 189 (100.0%) | 0 (0.0%) |
| 26 to 34 Years | 62 (93.9%) | 4 (6.1%) |
| 35 to 44 Years | 181 (100.0%) | 0 (0.0%) |
| 45 to 54 Years | 239 (97.2%) | 7 (2.9%) |
| 55 to 64 Years | 354 (96.5%) | 13 (3.5%) |
| 65 to 74 Years | 134 (97.1%) | 4 (2.9%) |
| 75 Years and older | 168 (100.0%) | 0 (0.0%) |
| Total | 1,740 (98.4%) | 28 (1.6%) |
Health Insurance Coverage by Citizenship Status in Bell Canyon
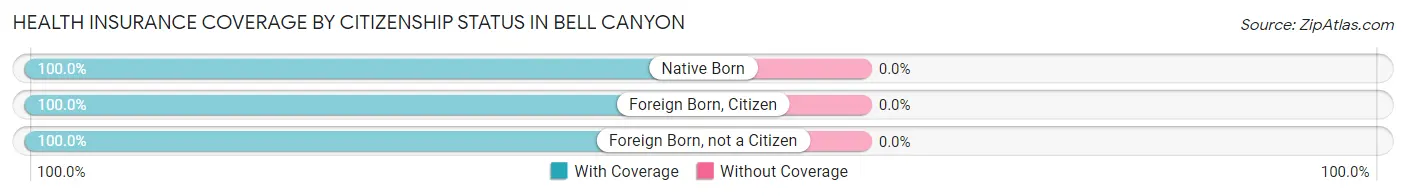
| Citizenship Status | With Coverage | Without Coverage |
| Native Born | 53 (100.0%) | 0 (0.0%) |
| Foreign Born, Citizen | 360 (100.0%) | 0 (0.0%) |
| Foreign Born, not a Citizen | 189 (100.0%) | 0 (0.0%) |
Health Insurance Coverage by Household Income in Bell Canyon
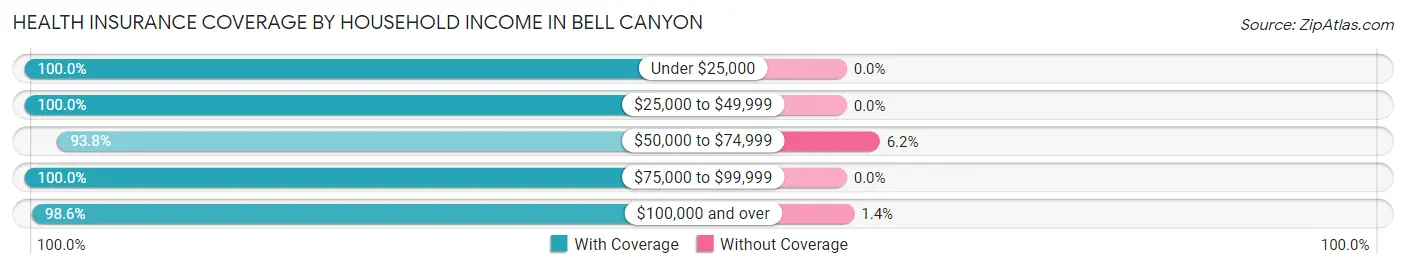
| Household Income | With Coverage | Without Coverage |
| Under $25,000 | 27 (100.0%) | 0 (0.0%) |
| $25,000 to $49,999 | 7 (100.0%) | 0 (0.0%) |
| $50,000 to $74,999 | 76 (93.8%) | 5 (6.2%) |
| $75,000 to $99,999 | 18 (100.0%) | 0 (0.0%) |
| $100,000 and over | 1,612 (98.6%) | 23 (1.4%) |
Public vs Private Health Insurance Coverage by Age in Bell Canyon
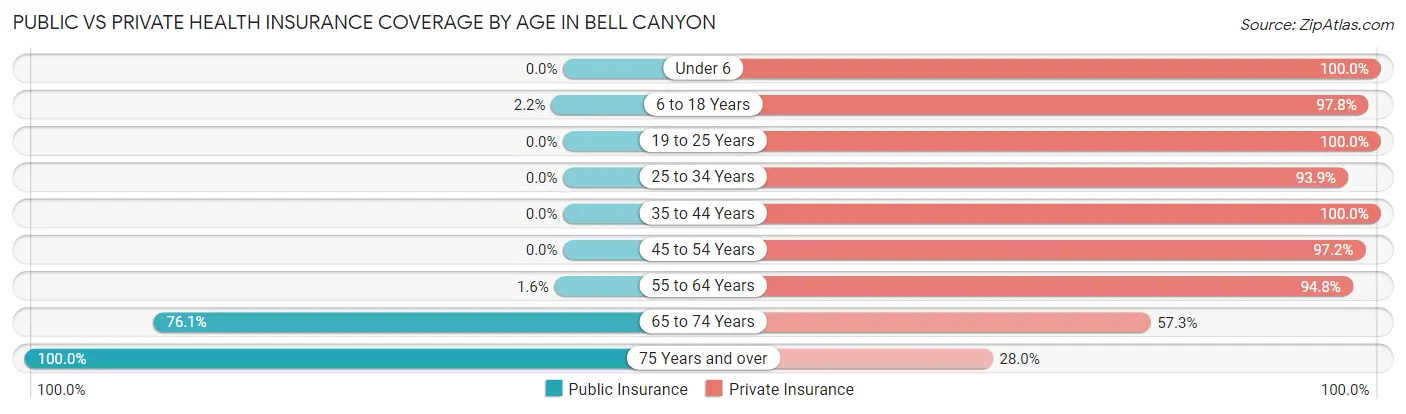
| Age Bracket | Public Insurance | Private Insurance |
| Under 6 | 0 (0.0%) | 53 (100.0%) |
| 6 to 18 Years | 8 (2.2%) | 352 (97.8%) |
| 19 to 25 Years | 0 (0.0%) | 189 (100.0%) |
| 25 to 34 Years | 0 (0.0%) | 62 (93.9%) |
| 35 to 44 Years | 0 (0.0%) | 181 (100.0%) |
| 45 to 54 Years | 0 (0.0%) | 239 (97.2%) |
| 55 to 64 Years | 6 (1.6%) | 348 (94.8%) |
| 65 to 74 Years | 105 (76.1%) | 79 (57.3%) |
| 75 Years and over | 168 (100.0%) | 47 (28.0%) |
| Total | 287 (16.2%) | 1,550 (87.7%) |
Disability Status by Sex by Age in Bell Canyon
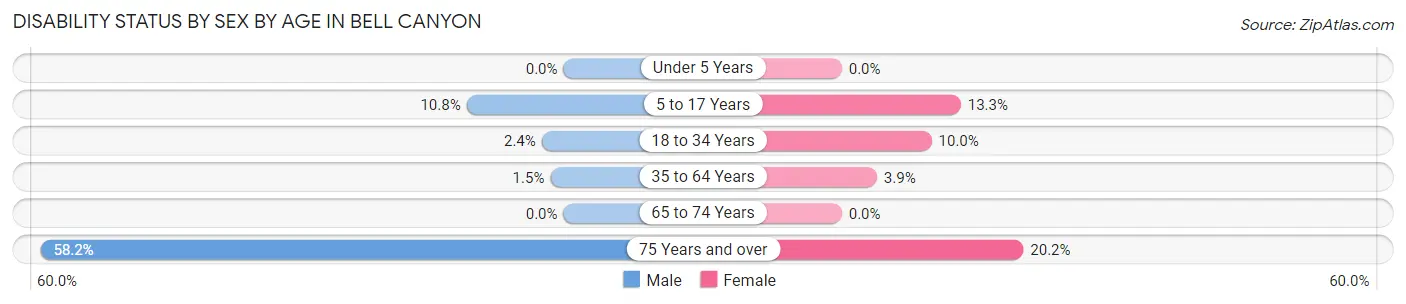
| Age Bracket | Male | Female |
| Under 5 Years | 0 (0.0%) | 0 (0.0%) |
| 5 to 17 Years | 15 (10.8%) | 22 (13.3%) |
| 18 to 34 Years | 5 (2.4%) | 12 (10.0%) |
| 35 to 64 Years | 6 (1.5%) | 15 (3.9%) |
| 65 to 74 Years | 0 (0.0%) | 0 (0.0%) |
| 75 Years and over | 46 (58.2%) | 18 (20.2%) |
Disability Class by Sex by Age in Bell Canyon
Disability Class: Hearing Difficulty
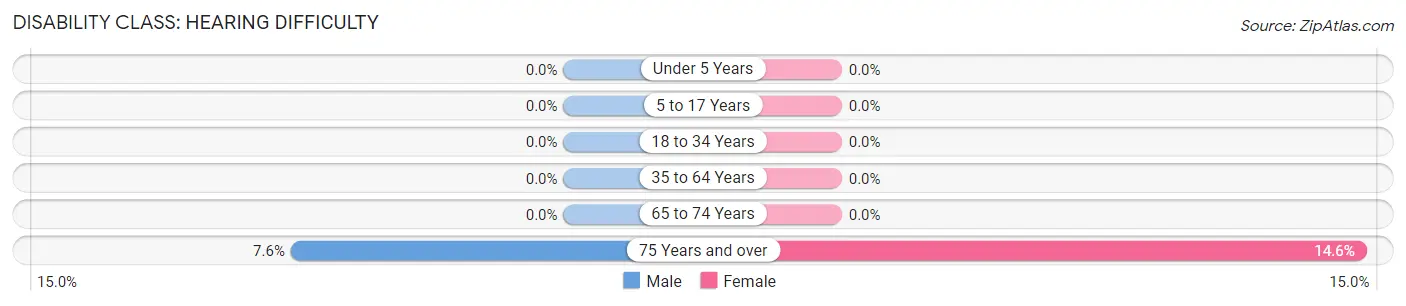
| Age Bracket | Male | Female |
| Under 5 Years | 0 (0.0%) | 0 (0.0%) |
| 5 to 17 Years | 0 (0.0%) | 0 (0.0%) |
| 18 to 34 Years | 0 (0.0%) | 0 (0.0%) |
| 35 to 64 Years | 0 (0.0%) | 0 (0.0%) |
| 65 to 74 Years | 0 (0.0%) | 0 (0.0%) |
| 75 Years and over | 6 (7.6%) | 13 (14.6%) |
Disability Class: Vision Difficulty
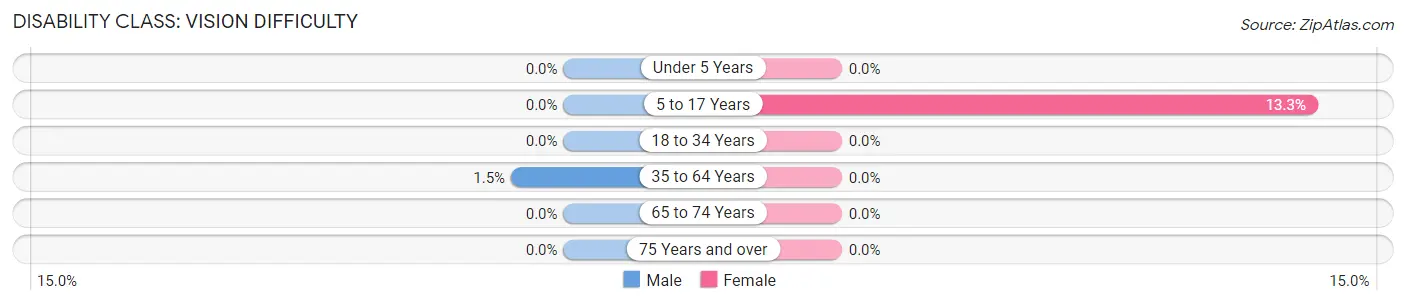
| Age Bracket | Male | Female |
| Under 5 Years | 0 (0.0%) | 0 (0.0%) |
| 5 to 17 Years | 0 (0.0%) | 22 (13.3%) |
| 18 to 34 Years | 0 (0.0%) | 0 (0.0%) |
| 35 to 64 Years | 6 (1.5%) | 0 (0.0%) |
| 65 to 74 Years | 0 (0.0%) | 0 (0.0%) |
| 75 Years and over | 0 (0.0%) | 0 (0.0%) |
Disability Class: Cognitive Difficulty
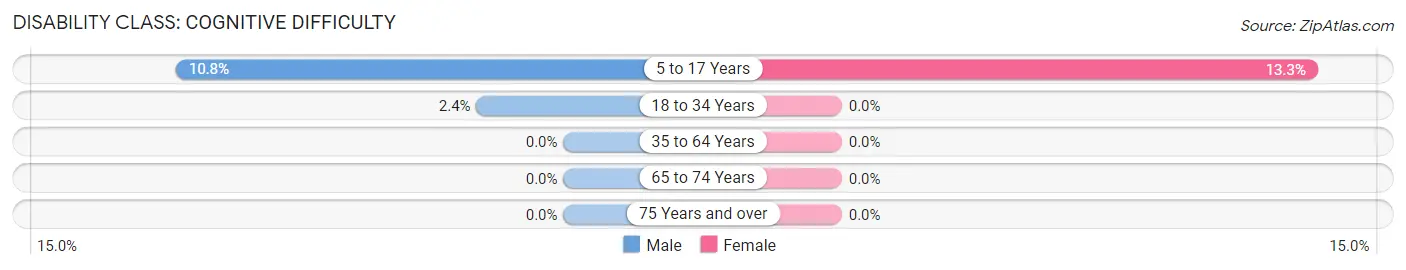
| Age Bracket | Male | Female |
| 5 to 17 Years | 15 (10.8%) | 22 (13.3%) |
| 18 to 34 Years | 5 (2.4%) | 0 (0.0%) |
| 35 to 64 Years | 0 (0.0%) | 0 (0.0%) |
| 65 to 74 Years | 0 (0.0%) | 0 (0.0%) |
| 75 Years and over | 0 (0.0%) | 0 (0.0%) |
Disability Class: Ambulatory Difficulty
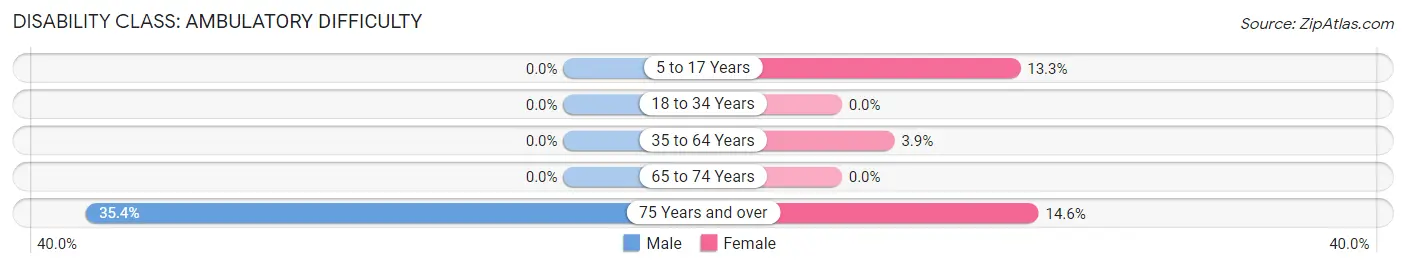
| Age Bracket | Male | Female |
| 5 to 17 Years | 0 (0.0%) | 22 (13.3%) |
| 18 to 34 Years | 0 (0.0%) | 0 (0.0%) |
| 35 to 64 Years | 0 (0.0%) | 15 (3.9%) |
| 65 to 74 Years | 0 (0.0%) | 0 (0.0%) |
| 75 Years and over | 28 (35.4%) | 13 (14.6%) |
Disability Class: Self-Care Difficulty
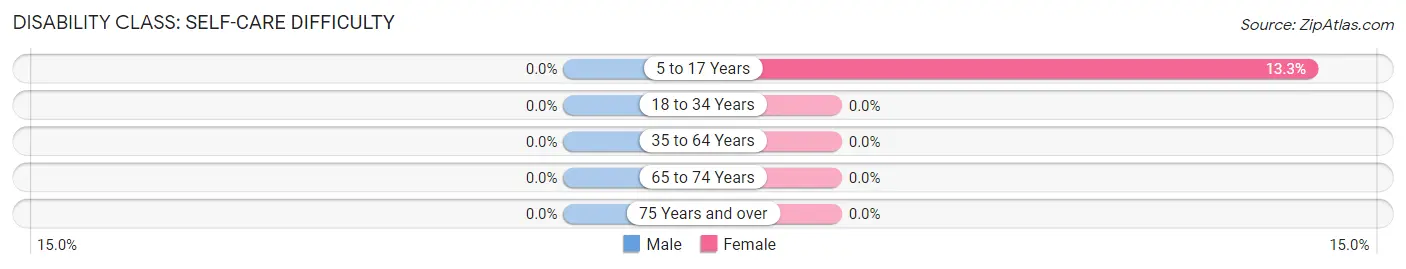
| Age Bracket | Male | Female |
| 5 to 17 Years | 0 (0.0%) | 22 (13.3%) |
| 18 to 34 Years | 0 (0.0%) | 0 (0.0%) |
| 35 to 64 Years | 0 (0.0%) | 0 (0.0%) |
| 65 to 74 Years | 0 (0.0%) | 0 (0.0%) |
| 75 Years and over | 0 (0.0%) | 0 (0.0%) |
Technology Access in Bell Canyon
Computing Device Access in Bell Canyon
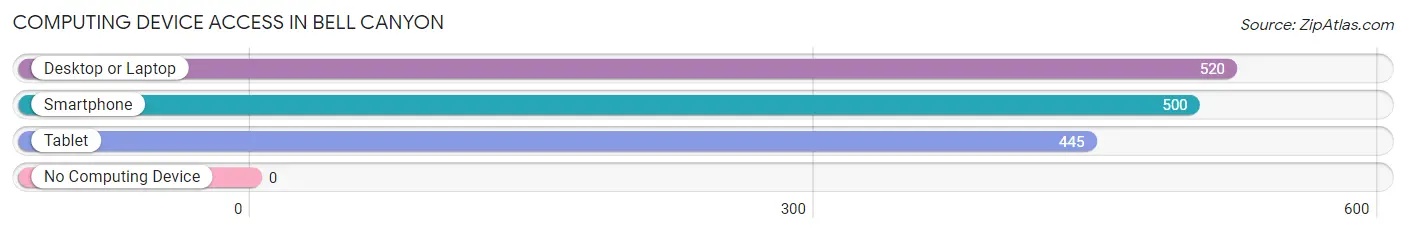
| Device Type | # Households | % Households |
| Desktop or Laptop | 520 | 98.5% |
| Smartphone | 500 | 94.7% |
| Tablet | 445 | 84.3% |
| No Computing Device | 0 | 0.0% |
| Total | 528 | 100.0% |
Internet Access in Bell Canyon
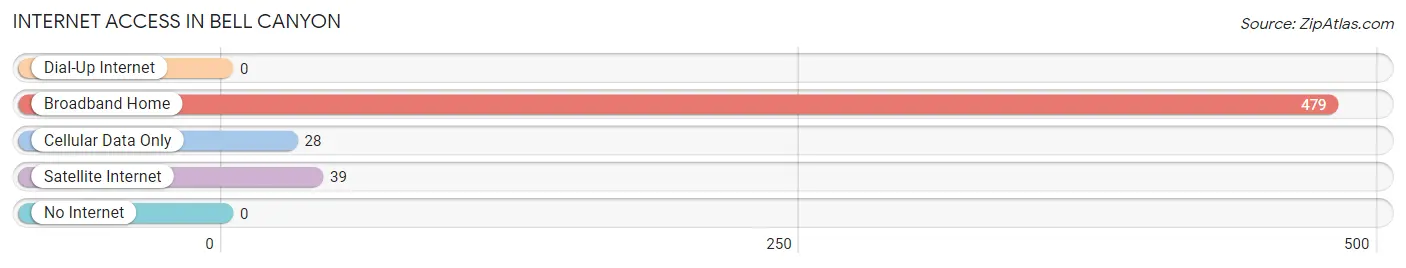
| Internet Type | # Households | % Households |
| Dial-Up Internet | 0 | 0.0% |
| Broadband Home | 479 | 90.7% |
| Cellular Data Only | 28 | 5.3% |
| Satellite Internet | 39 | 7.4% |
| No Internet | 0 | 0.0% |
| Total | 528 | 100.0% |
Bell Canyon Summary
History
Bell Canyon is an unincorporated community located in Ventura County, California. It is situated in the Santa Monica Mountains, and is part of the Conejo Valley. The area was originally inhabited by the Chumash people, who lived in the area for thousands of years before the arrival of Europeans. The first Europeans to settle in the area were Spanish missionaries, who established the Mission San Buenaventura in 1782. The area was later settled by ranchers, who established large cattle ranches in the area.
In the late 19th century, the area was developed as a residential community. The first homes were built in the early 1900s, and the community was officially established in 1912. The community was named after the Bell family, who were among the first settlers in the area.
Geography
Bell Canyon is located in the Santa Monica Mountains, in Ventura County, California. It is situated in the Conejo Valley, and is bordered by the cities of Thousand Oaks and Westlake Village. The area is characterized by rolling hills and canyons, and is home to a variety of wildlife, including deer, coyotes, and mountain lions.
The climate in Bell Canyon is Mediterranean, with hot, dry summers and mild, wet winters. The average annual temperature is around 65°F (18°C), and the average annual precipitation is around 20 inches (51 cm).
Economy
The economy of Bell Canyon is largely based on the service industry. The area is home to a variety of businesses, including restaurants, retail stores, and professional services. The area is also home to a number of technology companies, including Apple, Microsoft, and Oracle.
The area is also home to a number of wineries, which produce a variety of wines, including Cabernet Sauvignon, Chardonnay, and Pinot Noir. The area is also home to a number of horse ranches, which offer horseback riding lessons and trail rides.
Demographics
As of the 2010 census, the population of Bell Canyon was 4,837. The racial makeup of the area was 87.3% White, 4.2% Asian, 2.2% African American, 0.7% Native American, and 0.5% Pacific Islander. The median household income was $118,945, and the median family income was $133,945.
The area is home to a variety of religious denominations, including Catholic, Protestant, and Jewish. The area is also home to a number of private schools, including Oaks Christian School and Westlake Christian Academy.
Conclusion
Bell Canyon is an unincorporated community located in Ventura County, California. It is situated in the Santa Monica Mountains, and is part of the Conejo Valley. The area was originally inhabited by the Chumash people, and was later settled by ranchers and developers. The economy of Bell Canyon is largely based on the service industry, and the area is home to a variety of businesses, wineries, and horse ranches. As of the 2010 census, the population of Bell Canyon was 4,837, and the median household income was $118,945.
Common Questions
What is Per Capita Income in Bell Canyon?
Per Capita income in Bell Canyon is $106,511.
What is the Median Family Income in Bell Canyon?
Median Family Income in Bell Canyon is $250,001.
What is the Median Household income in Bell Canyon?
Median Household Income in Bell Canyon is $237,384.
What is Income or Wage Gap in Bell Canyon?
Income or Wage Gap in Bell Canyon is 54.2%.
Women in Bell Canyon earn 45.8 cents for every dollar earned by a man.
What is Inequality or Gini Index in Bell Canyon?
Inequality or Gini Index in Bell Canyon is 0.46.
What is the Total Population of Bell Canyon?
Total Population of Bell Canyon is 1,768.
What is the Total Male Population of Bell Canyon?
Total Male Population of Bell Canyon is 921.
What is the Total Female Population of Bell Canyon?
Total Female Population of Bell Canyon is 847.
What is the Ratio of Males per 100 Females in Bell Canyon?
There are 108.74 Males per 100 Females in Bell Canyon.
What is the Ratio of Females per 100 Males in Bell Canyon?
There are 91.97 Females per 100 Males in Bell Canyon.
What is the Median Population Age in Bell Canyon?
Median Population Age in Bell Canyon is 48.2 Years.
What is the Average Family Size in Bell Canyon
Average Family Size in Bell Canyon is 3.6 People.
What is the Average Household Size in Bell Canyon
Average Household Size in Bell Canyon is 3.4 People.
How Large is the Labor Force in Bell Canyon?
There are 823 People in the Labor Forcein in Bell Canyon.
What is the Percentage of People in the Labor Force in Bell Canyon?
55.0% of People are in the Labor Force in Bell Canyon.
What is the Unemployment Rate in Bell Canyon?
Unemployment Rate in Bell Canyon is 1.6%.