Zip Codes with the Highest Percentage of Population Employed in Health Diagnosing & Treating in San Jose, CA
RELATED REPORTS & OPTIONS
Health Diagnosing & Treating
San Jose
Compare Zip Codes
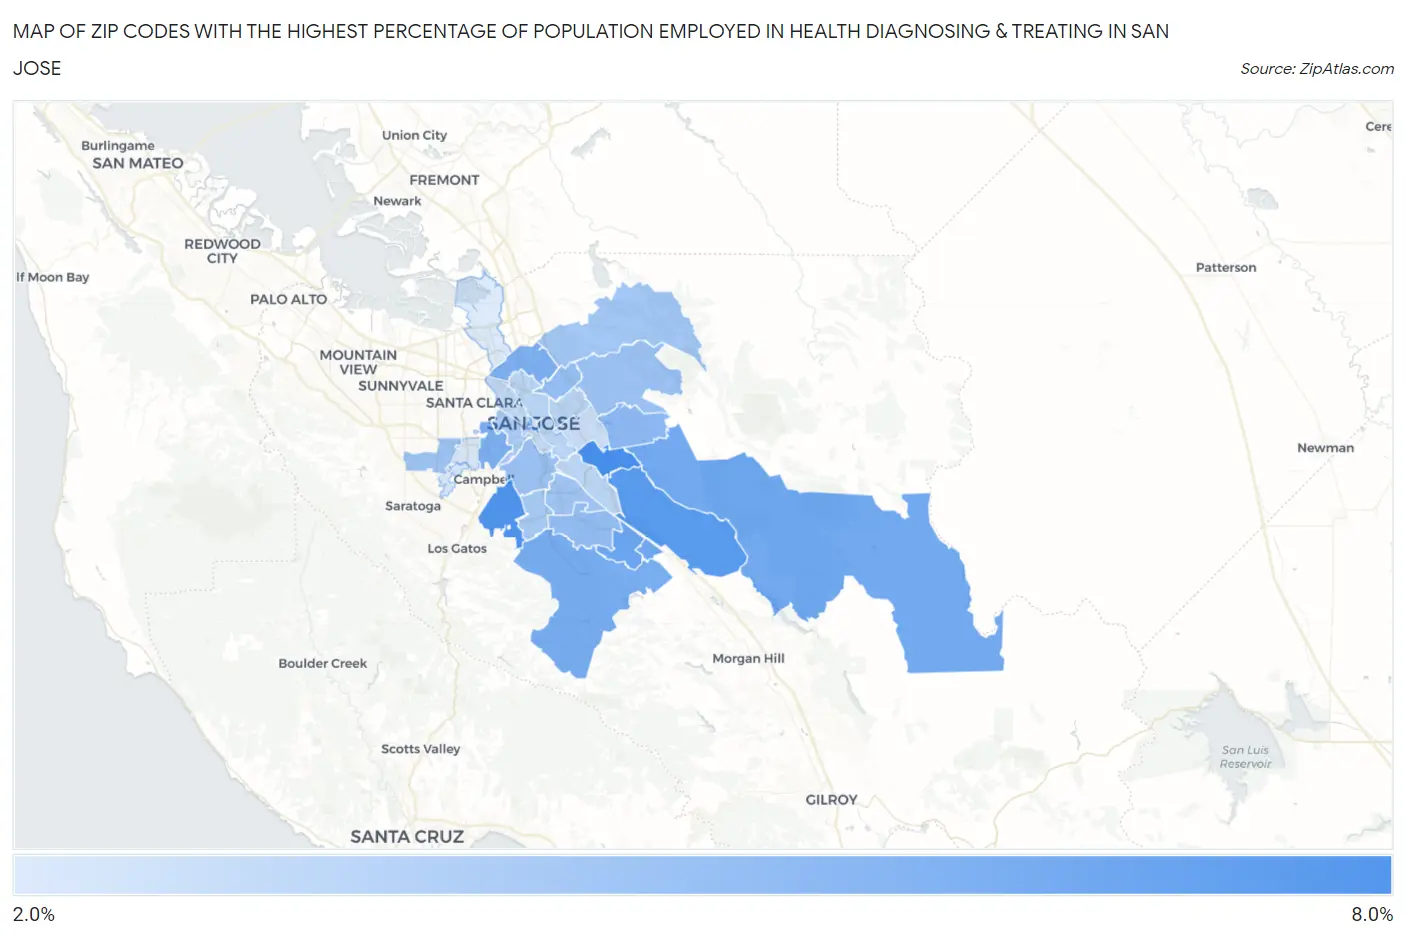
Map of Zip Codes with the Highest Percentage of Population Employed in Health Diagnosing & Treating in San Jose
2.3%
6.7%
Zip Codes with the Highest Percentage of Population Employed in Health Diagnosing & Treating in San Jose, CA
| Zip Code | % Employed | vs State | vs National | |
| 1. | 95121 | 6.7% | 5.3%(+1.37)#437 | 6.2%(+0.440)#11,360 |
| 2. | 95124 | 6.4% | 5.3%(+1.08)#489 | 6.2%(+0.147)#12,411 |
| 3. | 95138 | 6.2% | 5.3%(+0.920)#522 | 6.2%(-0.014)#13,041 |
| 4. | 95119 | 5.6% | 5.3%(+0.247)#665 | 6.2%(-0.687)#15,552 |
| 5. | 95139 | 5.4% | 5.3%(+0.069)#699 | 6.2%(-0.865)#16,241 |
| 6. | 95135 | 5.4% | 5.3%(+0.061)#700 | 6.2%(-0.873)#16,278 |
| 7. | 95120 | 5.2% | 5.3%(-0.076)#727 | 6.2%(-1.01)#16,812 |
| 8. | 95131 | 5.1% | 5.3%(-0.259)#771 | 6.2%(-1.19)#17,487 |
| 9. | 95128 | 5.0% | 5.3%(-0.278)#779 | 6.2%(-1.21)#17,571 |
| 10. | 95148 | 4.7% | 5.3%(-0.658)#861 | 6.2%(-1.59)#19,040 |
| 11. | 95123 | 4.5% | 5.3%(-0.850)#903 | 6.2%(-1.78)#19,772 |
| 12. | 95133 | 4.4% | 5.3%(-0.922)#922 | 6.2%(-1.86)#20,035 |
| 13. | 95125 | 4.3% | 5.3%(-1.05)#958 | 6.2%(-1.99)#20,486 |
| 14. | 95127 | 4.2% | 5.3%(-1.14)#972 | 6.2%(-2.08)#20,812 |
| 15. | 95129 | 4.1% | 5.3%(-1.20)#995 | 6.2%(-2.13)#21,026 |
| 16. | 95136 | 4.0% | 5.3%(-1.29)#1,009 | 6.2%(-2.22)#21,300 |
| 17. | 95132 | 3.9% | 5.3%(-1.37)#1,028 | 6.2%(-2.30)#21,544 |
| 18. | 95118 | 3.8% | 5.3%(-1.47)#1,045 | 6.2%(-2.40)#21,869 |
| 19. | 95126 | 3.7% | 5.3%(-1.61)#1,065 | 6.2%(-2.55)#22,300 |
| 20. | 95112 | 3.3% | 5.3%(-1.99)#1,139 | 6.2%(-2.92)#23,402 |
| 21. | 95116 | 3.3% | 5.3%(-2.02)#1,143 | 6.2%(-2.95)#23,493 |
| 22. | 95111 | 3.2% | 5.3%(-2.09)#1,155 | 6.2%(-3.02)#23,711 |
| 23. | 95110 | 2.9% | 5.3%(-2.37)#1,205 | 6.2%(-3.31)#24,480 |
| 24. | 95122 | 2.9% | 5.3%(-2.45)#1,224 | 6.2%(-3.39)#24,694 |
| 25. | 95113 | 2.5% | 5.3%(-2.81)#1,272 | 6.2%(-3.74)#25,503 |
| 26. | 95117 | 2.5% | 5.3%(-2.84)#1,282 | 6.2%(-3.78)#25,591 |
| 27. | 95130 | 2.4% | 5.3%(-2.95)#1,297 | 6.2%(-3.89)#25,809 |
| 28. | 95134 | 2.3% | 5.3%(-3.00)#1,311 | 6.2%(-3.94)#25,915 |
1
Common Questions
What are the Top 10 Zip Codes with the Highest Percentage of Population Employed in Health Diagnosing & Treating in San Jose, CA?
Top 10 Zip Codes with the Highest Percentage of Population Employed in Health Diagnosing & Treating in San Jose, CA are:
What zip code has the Highest Percentage of Population Employed in Health Diagnosing & Treating in San Jose, CA?
95121 has the Highest Percentage of Population Employed in Health Diagnosing & Treating in San Jose, CA with 6.7%.
What is the Percentage of Population Employed in Health Diagnosing & Treating in San Jose, CA?
Percentage of Population Employed in Health Diagnosing & Treating in San Jose is 4.1%.
What is the Percentage of Population Employed in Health Diagnosing & Treating in California?
Percentage of Population Employed in Health Diagnosing & Treating in California is 5.3%.
What is the Percentage of Population Employed in Health Diagnosing & Treating in the United States?
Percentage of Population Employed in Health Diagnosing & Treating in the United States is 6.2%.