Cities with the Highest Percentage of Population Employed in Health Diagnosing & Treating in Kansas
RELATED REPORTS & OPTIONS
Health Diagnosing & Treating
Kansas
Compare Cities
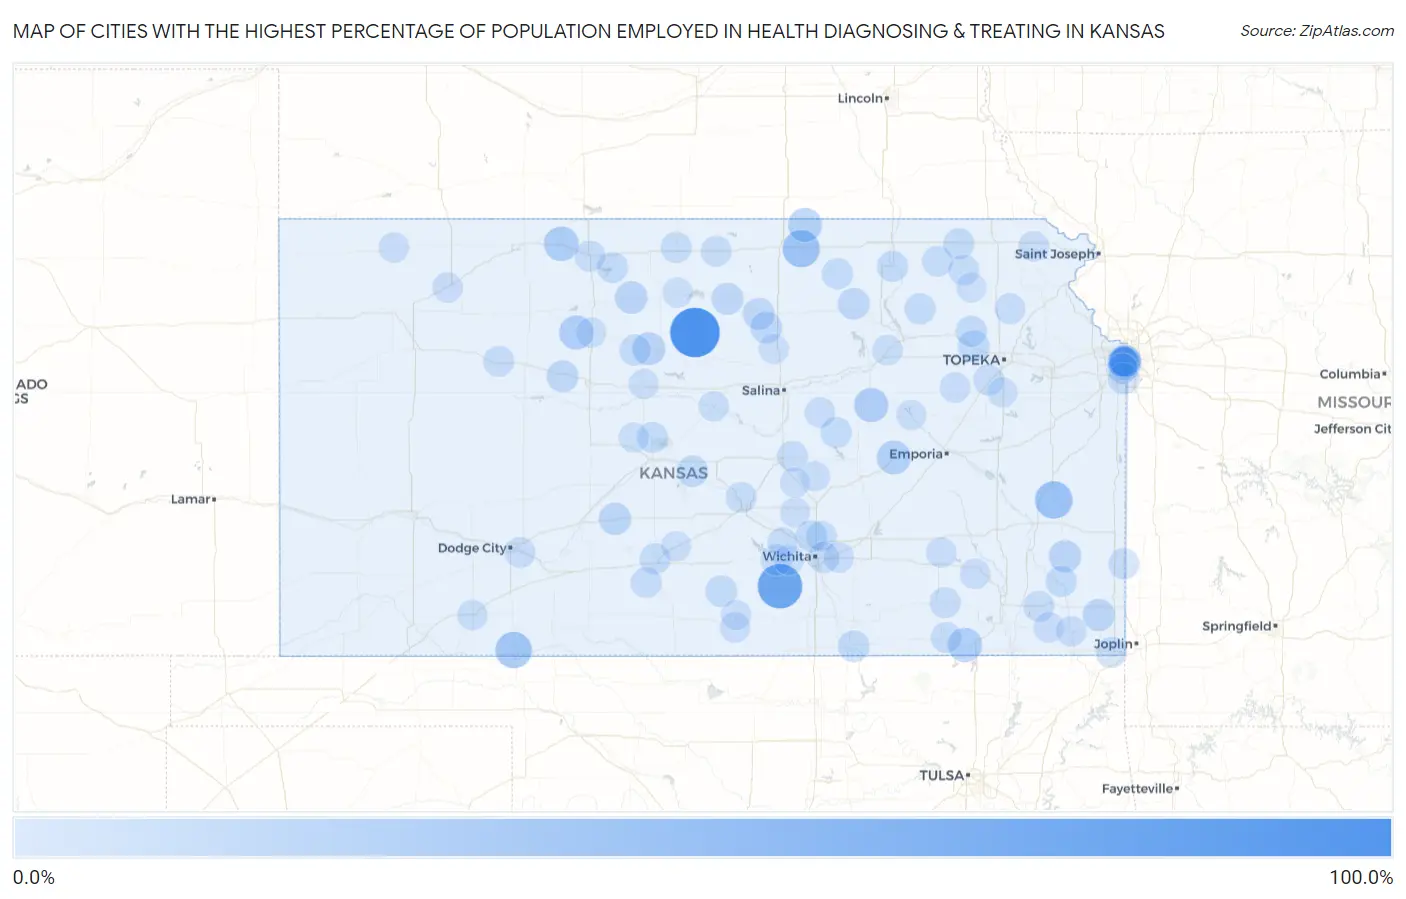
Map of Cities with the Highest Percentage of Population Employed in Health Diagnosing & Treating in Kansas
0.0%
100.0%
Cities with the Highest Percentage of Population Employed in Health Diagnosing & Treating in Kansas
| City | % Employed | vs State | vs National | |
| 1. | Hunter | 85.7% | 6.6%(+79.1)#1 | 6.2%(+79.5)#23 |
| 2. | Viola | 65.4% | 6.6%(+58.8)#2 | 6.2%(+59.1)#37 |
| 3. | Devon | 45.7% | 6.6%(+39.1)#3 | 6.2%(+39.4)#103 |
| 4. | Lone Elm | 37.5% | 6.6%(+30.9)#4 | 6.2%(+31.3)#165 |
| 5. | Cuba | 36.1% | 6.6%(+29.5)#5 | 6.2%(+29.8)#181 |
| 6. | Elyria | 36.0% | 6.6%(+29.4)#6 | 6.2%(+29.8)#182 |
| 7. | Englewood | 33.3% | 6.6%(+26.7)#7 | 6.2%(+27.1)#231 |
| 8. | Bremen | 32.0% | 6.6%(+25.4)#8 | 6.2%(+25.8)#267 |
| 9. | Radley | 28.3% | 6.6%(+21.7)#9 | 6.2%(+22.1)#346 |
| 10. | Prairie View | 26.6% | 6.6%(+20.0)#10 | 6.2%(+20.4)#386 |
| 11. | Niotaze | 25.0% | 6.6%(+18.4)#11 | 6.2%(+18.8)#441 |
| 12. | Zurich | 25.0% | 6.6%(+18.4)#12 | 6.2%(+18.8)#445 |
| 13. | Latimer | 25.0% | 6.6%(+18.4)#13 | 6.2%(+18.8)#449 |
| 14. | Narka | 24.4% | 6.6%(+17.8)#14 | 6.2%(+18.1)#473 |
| 15. | Elmdale | 23.5% | 6.6%(+16.9)#15 | 6.2%(+17.3)#521 |
| 16. | Waldo | 20.0% | 6.6%(+13.4)#16 | 6.2%(+13.8)#752 |
| 17. | Mission Woods | 19.8% | 6.6%(+13.2)#17 | 6.2%(+13.5)#771 |
| 18. | Alton | 18.9% | 6.6%(+12.3)#18 | 6.2%(+12.7)#851 |
| 19. | Mission Hills | 18.7% | 6.6%(+12.2)#19 | 6.2%(+12.5)#870 |
| 20. | Belpre | 18.2% | 6.6%(+11.6)#20 | 6.2%(+11.9)#940 |
| 21. | Stark | 17.9% | 6.6%(+11.4)#21 | 6.2%(+11.7)#962 |
| 22. | Roseland | 17.2% | 6.6%(+10.6)#22 | 6.2%(+11.0)#1,046 |
| 23. | Westwood Hills | 17.1% | 6.6%(+10.5)#23 | 6.2%(+10.9)#1,061 |
| 24. | Keats | 17.1% | 6.6%(+10.5)#24 | 6.2%(+10.8)#1,075 |
| 25. | Beloit | 16.5% | 6.6%(+9.94)#25 | 6.2%(+10.3)#1,173 |
| 26. | Glasco | 16.4% | 6.6%(+9.81)#26 | 6.2%(+10.2)#1,199 |
| 27. | Ellis | 16.2% | 6.6%(+9.65)#27 | 6.2%(+10.0)#1,230 |
| 28. | Delphos | 16.2% | 6.6%(+9.64)#28 | 6.2%(+9.99)#1,235 |
| 29. | Tecumseh | 15.8% | 6.6%(+9.23)#29 | 6.2%(+9.58)#1,319 |
| 30. | Green | 15.8% | 6.6%(+9.19)#30 | 6.2%(+9.54)#1,327 |
| 31. | Spivey | 15.4% | 6.6%(+8.79)#31 | 6.2%(+9.14)#1,424 |
| 32. | Valley Center | 15.3% | 6.6%(+8.71)#32 | 6.2%(+9.06)#1,442 |
| 33. | Parkerfield | 15.3% | 6.6%(+8.68)#33 | 6.2%(+9.03)#1,452 |
| 34. | Rossville | 15.0% | 6.6%(+8.38)#34 | 6.2%(+8.73)#1,514 |
| 35. | Fairway | 14.6% | 6.6%(+8.05)#35 | 6.2%(+8.40)#1,595 |
| 36. | Raymond | 14.6% | 6.6%(+8.04)#36 | 6.2%(+8.39)#1,602 |
| 37. | Garden Plain | 14.3% | 6.6%(+7.72)#37 | 6.2%(+8.07)#1,693 |
| 38. | Delia | 13.9% | 6.6%(+7.27)#38 | 6.2%(+7.62)#1,839 |
| 39. | Leawood | 13.8% | 6.6%(+7.22)#39 | 6.2%(+7.57)#1,857 |
| 40. | Westmoreland | 13.8% | 6.6%(+7.21)#40 | 6.2%(+7.56)#1,863 |
| 41. | Paradise | 13.8% | 6.6%(+7.20)#41 | 6.2%(+7.55)#1,875 |
| 42. | Blue Rapids | 13.7% | 6.6%(+7.06)#42 | 6.2%(+7.41)#1,929 |
| 43. | Palmer | 13.6% | 6.6%(+7.04)#43 | 6.2%(+7.39)#1,934 |
| 44. | St Paul | 13.5% | 6.6%(+6.88)#44 | 6.2%(+7.23)#1,989 |
| 45. | Tampa | 13.5% | 6.6%(+6.87)#45 | 6.2%(+7.22)#1,998 |
| 46. | Seneca | 13.4% | 6.6%(+6.76)#46 | 6.2%(+7.12)#2,033 |
| 47. | Kirwin | 13.3% | 6.6%(+6.74)#47 | 6.2%(+7.09)#2,049 |
| 48. | Hoisington | 13.3% | 6.6%(+6.73)#48 | 6.2%(+7.08)#2,059 |
| 49. | Pratt | 13.2% | 6.6%(+6.62)#49 | 6.2%(+6.97)#2,097 |
| 50. | Arcadia | 13.0% | 6.6%(+6.45)#50 | 6.2%(+6.80)#2,160 |
| 51. | Parsons | 13.0% | 6.6%(+6.42)#51 | 6.2%(+6.77)#2,184 |
| 52. | Lebanon | 12.9% | 6.6%(+6.35)#52 | 6.2%(+6.70)#2,224 |
| 53. | Willowbrook | 12.9% | 6.6%(+6.31)#53 | 6.2%(+6.66)#2,241 |
| 54. | Vermillion | 12.9% | 6.6%(+6.31)#54 | 6.2%(+6.66)#2,243 |
| 55. | Eastborough | 12.8% | 6.6%(+6.25)#55 | 6.2%(+6.60)#2,266 |
| 56. | Elk Falls | 12.8% | 6.6%(+6.22)#56 | 6.2%(+6.58)#2,281 |
| 57. | Coats | 12.7% | 6.6%(+6.13)#57 | 6.2%(+6.48)#2,322 |
| 58. | Auburn | 12.7% | 6.6%(+6.11)#58 | 6.2%(+6.46)#2,329 |
| 59. | Denison | 12.7% | 6.6%(+6.08)#59 | 6.2%(+6.43)#2,345 |
| 60. | Mankato | 12.6% | 6.6%(+6.04)#60 | 6.2%(+6.39)#2,361 |
| 61. | Galva | 12.6% | 6.6%(+5.97)#61 | 6.2%(+6.32)#2,394 |
| 62. | Collyer | 12.5% | 6.6%(+5.90)#62 | 6.2%(+6.26)#2,440 |
| 63. | Roeland Park | 12.4% | 6.6%(+5.81)#63 | 6.2%(+6.16)#2,477 |
| 64. | Phillipsburg | 12.4% | 6.6%(+5.80)#64 | 6.2%(+6.15)#2,484 |
| 65. | Corning | 12.4% | 6.6%(+5.76)#65 | 6.2%(+6.11)#2,502 |
| 66. | Baxter Springs | 12.2% | 6.6%(+5.59)#66 | 6.2%(+5.94)#2,587 |
| 67. | Wilroads Gardens | 12.2% | 6.6%(+5.57)#67 | 6.2%(+5.92)#2,596 |
| 68. | Westwood | 12.2% | 6.6%(+5.56)#68 | 6.2%(+5.91)#2,604 |
| 69. | Sedan | 12.2% | 6.6%(+5.56)#69 | 6.2%(+5.91)#2,606 |
| 70. | Kechi | 12.1% | 6.6%(+5.48)#70 | 6.2%(+5.84)#2,640 |
| 71. | Prairie Village | 11.8% | 6.6%(+5.25)#71 | 6.2%(+5.60)#2,747 |
| 72. | Eskridge | 11.8% | 6.6%(+5.24)#72 | 6.2%(+5.59)#2,755 |
| 73. | Ogden | 11.8% | 6.6%(+5.17)#73 | 6.2%(+5.52)#2,787 |
| 74. | Robinson | 11.7% | 6.6%(+5.07)#74 | 6.2%(+5.42)#2,858 |
| 75. | Andover | 11.6% | 6.6%(+4.97)#75 | 6.2%(+5.32)#2,938 |
| 76. | New Albany | 11.5% | 6.6%(+4.94)#76 | 6.2%(+5.29)#2,962 |
| 77. | Altamont | 11.2% | 6.6%(+4.61)#77 | 6.2%(+4.96)#3,186 |
| 78. | Oswego | 11.1% | 6.6%(+4.53)#78 | 6.2%(+4.88)#3,233 |
| 79. | Climax | 11.1% | 6.6%(+4.52)#79 | 6.2%(+4.87)#3,267 |
| 80. | Carlton | 11.1% | 6.6%(+4.52)#80 | 6.2%(+4.87)#3,272 |
| 81. | Goddard | 10.9% | 6.6%(+4.34)#81 | 6.2%(+4.69)#3,371 |
| 82. | Anthony | 10.9% | 6.6%(+4.30)#82 | 6.2%(+4.65)#3,390 |
| 83. | Atwood | 10.8% | 6.6%(+4.19)#83 | 6.2%(+4.55)#3,477 |
| 84. | Meade | 10.8% | 6.6%(+4.18)#84 | 6.2%(+4.53)#3,492 |
| 85. | Andale | 10.8% | 6.6%(+4.17)#85 | 6.2%(+4.52)#3,500 |
| 86. | Ellsworth | 10.7% | 6.6%(+4.12)#86 | 6.2%(+4.47)#3,544 |
| 87. | Selden | 10.7% | 6.6%(+4.08)#87 | 6.2%(+4.43)#3,574 |
| 88. | Preston | 10.6% | 6.6%(+4.01)#88 | 6.2%(+4.36)#3,633 |
| 89. | Goessel | 10.5% | 6.6%(+3.93)#89 | 6.2%(+4.28)#3,710 |
| 90. | Plainville | 10.5% | 6.6%(+3.90)#90 | 6.2%(+4.25)#3,745 |
| 91. | Olmitz | 10.4% | 6.6%(+3.82)#91 | 6.2%(+4.17)#3,811 |
| 92. | Carbondale | 10.4% | 6.6%(+3.77)#92 | 6.2%(+4.12)#3,854 |
| 93. | Harper | 10.3% | 6.6%(+3.67)#93 | 6.2%(+4.02)#3,954 |
| 94. | Council Grove | 10.2% | 6.6%(+3.64)#94 | 6.2%(+3.99)#3,983 |
| 95. | Halstead | 10.2% | 6.6%(+3.60)#95 | 6.2%(+3.95)#4,019 |
| 96. | Downs | 10.2% | 6.6%(+3.60)#96 | 6.2%(+3.95)#4,028 |
| 97. | Moundridge | 10.1% | 6.6%(+3.47)#97 | 6.2%(+3.82)#4,135 |
| 98. | Russell | 10.1% | 6.6%(+3.47)#98 | 6.2%(+3.82)#4,138 |
| 99. | Soldier | 10.0% | 6.6%(+3.40)#99 | 6.2%(+3.76)#4,219 |
| 100. | Minneapolis | 10.0% | 6.6%(+3.38)#100 | 6.2%(+3.74)#4,241 |
Common Questions
What are the Top 10 Cities with the Highest Percentage of Population Employed in Health Diagnosing & Treating in Kansas?
Top 10 Cities with the Highest Percentage of Population Employed in Health Diagnosing & Treating in Kansas are:
What city has the Highest Percentage of Population Employed in Health Diagnosing & Treating in Kansas?
Hunter has the Highest Percentage of Population Employed in Health Diagnosing & Treating in Kansas with 85.7%.
What is the Percentage of Population Employed in Health Diagnosing & Treating in the State of Kansas?
Percentage of Population Employed in Health Diagnosing & Treating in Kansas is 6.6%.
What is the Percentage of Population Employed in Health Diagnosing & Treating in the United States?
Percentage of Population Employed in Health Diagnosing & Treating in the United States is 6.2%.