Homestead Valley, CA Map & Demographics
Homestead Valley Map
Homestead Valley Overview
$25,260
PER CAPITA INCOME
$39,591
AVG FAMILY INCOME
$38,834
AVG HOUSEHOLD INCOME
46.8%
WAGE / INCOME GAP [ % ]
53.2¢/ $1
WAGE / INCOME GAP [ $ ]
$9,751
FAMILY INCOME DEFICIT
0.46
INEQUALITY / GINI INDEX
2,546
TOTAL POPULATION
1,350
MALE POPULATION
1,196
FEMALE POPULATION
112.88
MALES / 100 FEMALES
88.59
FEMALES / 100 MALES
54.4
MEDIAN AGE
2.7
AVG FAMILY SIZE
2.0
AVG HOUSEHOLD SIZE
917
LABOR FORCE [ PEOPLE ]
39.9%
PERCENT IN LABOR FORCE
16.0%
UNEMPLOYMENT RATE
Income in Homestead Valley
Income Overview in Homestead Valley
Per Capita Income in Homestead Valley is $25,260, while median incomes of families and households are $39,591 and $38,834 respectively.
| Characteristic | Number | Measure |
| Per Capita Income | 2,546 | $25,260 |
| Median Family Income | 592 | $39,591 |
| Mean Family Income | 592 | $66,145 |
| Median Household Income | 1,241 | $38,834 |
| Mean Household Income | 1,241 | $51,884 |
| Income Deficit | 592 | $9,751 |
| Wage / Income Gap (%) | 2,546 | 46.84% |
| Wage / Income Gap ($) | 2,546 | 53.16¢ per $1 |
| Gini / Inequality Index | 2,546 | 0.46 |
Earnings by Sex in Homestead Valley
Average Earnings in Homestead Valley are $19,688, $28,603 for men and $15,205 for women, a difference of 46.8%.
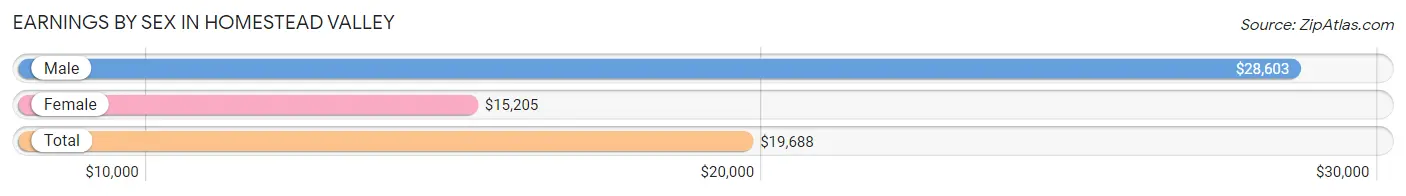
| Sex | Number | Average Earnings |
| Male | 514 (52.4%) | $28,603 |
| Female | 466 (47.5%) | $15,205 |
| Total | 980 (100.0%) | $19,688 |
Earnings by Sex by Income Bracket in Homestead Valley
The most common earnings brackets in Homestead Valley are $35,000 to $39,999 for men (58 | 11.3%) and $2,499 or less for women (76 | 16.3%).
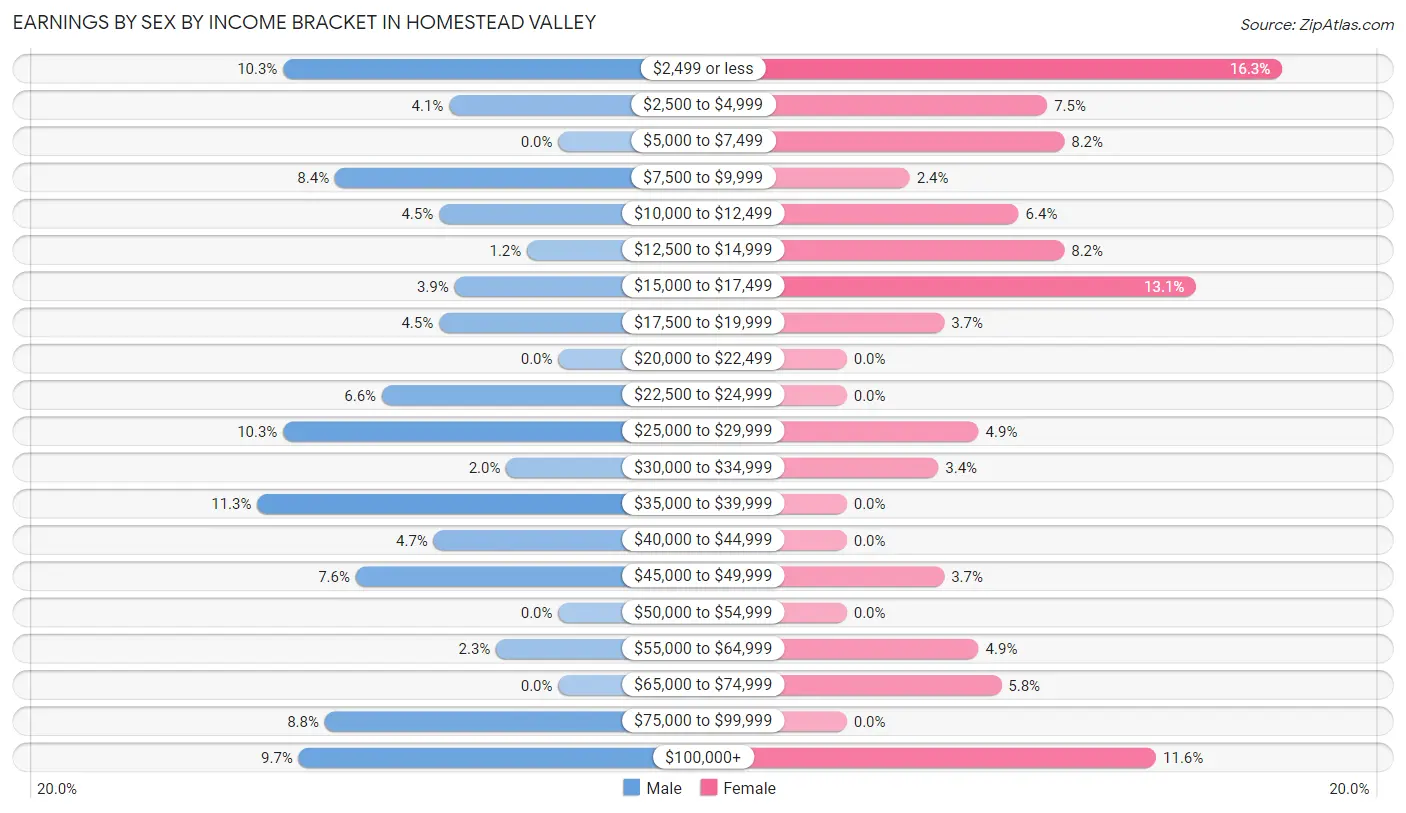
| Income | Male | Female |
| $2,499 or less | 53 (10.3%) | 76 (16.3%) |
| $2,500 to $4,999 | 21 (4.1%) | 35 (7.5%) |
| $5,000 to $7,499 | 0 (0.0%) | 38 (8.2%) |
| $7,500 to $9,999 | 43 (8.4%) | 11 (2.4%) |
| $10,000 to $12,499 | 23 (4.5%) | 30 (6.4%) |
| $12,500 to $14,999 | 6 (1.2%) | 38 (8.2%) |
| $15,000 to $17,499 | 20 (3.9%) | 61 (13.1%) |
| $17,500 to $19,999 | 23 (4.5%) | 17 (3.6%) |
| $20,000 to $22,499 | 0 (0.0%) | 0 (0.0%) |
| $22,500 to $24,999 | 34 (6.6%) | 0 (0.0%) |
| $25,000 to $29,999 | 53 (10.3%) | 23 (4.9%) |
| $30,000 to $34,999 | 10 (1.9%) | 16 (3.4%) |
| $35,000 to $39,999 | 58 (11.3%) | 0 (0.0%) |
| $40,000 to $44,999 | 24 (4.7%) | 0 (0.0%) |
| $45,000 to $49,999 | 39 (7.6%) | 17 (3.6%) |
| $50,000 to $54,999 | 0 (0.0%) | 0 (0.0%) |
| $55,000 to $64,999 | 12 (2.3%) | 23 (4.9%) |
| $65,000 to $74,999 | 0 (0.0%) | 27 (5.8%) |
| $75,000 to $99,999 | 45 (8.7%) | 0 (0.0%) |
| $100,000+ | 50 (9.7%) | 54 (11.6%) |
| Total | 514 (100.0%) | 466 (100.0%) |
Earnings by Sex by Educational Attainment in Homestead Valley
Average earnings in Homestead Valley are $29,449 for men and $15,205 for women, a difference of 48.4%. Men with an educational attainment of less than high school enjoy the highest average annual earnings of $30,125, while those with less than high school education earn the least with $30,125. Women with an educational attainment of college or associate's degree earn the most with the average annual earnings of $16,250, while those with college or associate's degree education have the smallest earnings of $16,250.
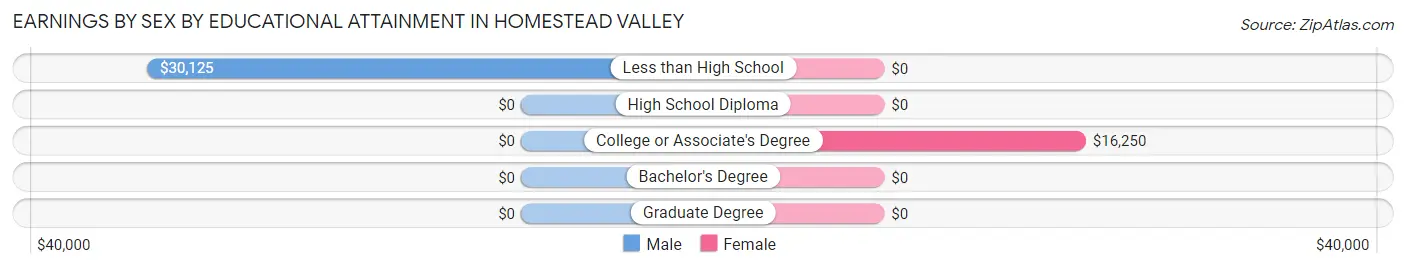
| Educational Attainment | Male Income | Female Income |
| Less than High School | $30,125 | $0 |
| High School Diploma | - | - |
| College or Associate's Degree | - | - |
| Bachelor's Degree | - | - |
| Graduate Degree | - | - |
| Total | $29,449 | $15,205 |
Family Income in Homestead Valley
Family Income Brackets in Homestead Valley
According to the Homestead Valley family income data, there are 185 families falling into the $35,000 to $49,999 income range, which is the most common income bracket and makes up 31.2% of all families.
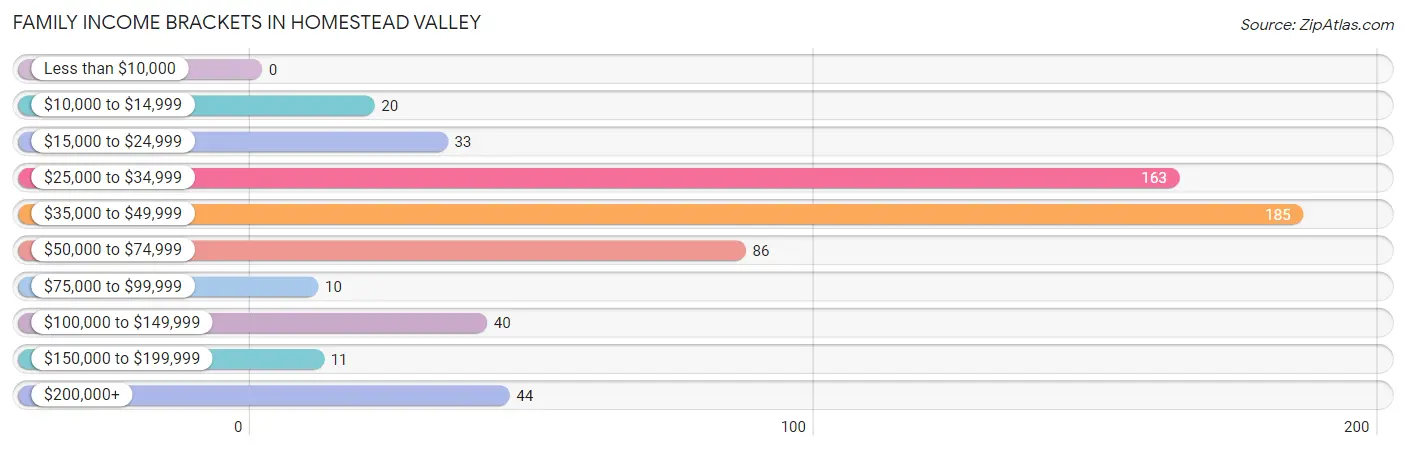
| Income Bracket | # Families | % Families |
| Less than $10,000 | 0 | 0.0% |
| $10,000 to $14,999 | 20 | 3.4% |
| $15,000 to $24,999 | 33 | 5.6% |
| $25,000 to $34,999 | 163 | 27.5% |
| $35,000 to $49,999 | 185 | 31.3% |
| $50,000 to $74,999 | 86 | 14.5% |
| $75,000 to $99,999 | 10 | 1.7% |
| $100,000 to $149,999 | 40 | 6.8% |
| $150,000 to $199,999 | 11 | 1.9% |
| $200,000+ | 44 | 7.4% |
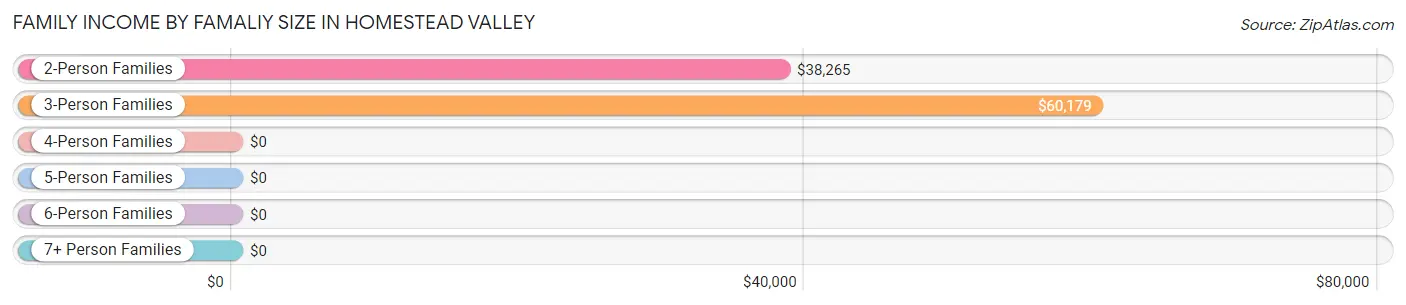
Family Income by Famaliy Size in Homestead Valley
3-person families (122 | 20.6%) account for the highest median family income in Homestead Valley with $60,179 per family, while 3-person families (122 | 20.6%) have the highest median income of $20,060 per family member.
| Income Bracket | # Families | Median Income |
| 2-Person Families | 358 (60.5%) | $38,265 |
| 3-Person Families | 122 (20.6%) | $60,179 |
| 4-Person Families | 93 (15.7%) | $0 |
| 5-Person Families | 10 (1.7%) | $0 |
| 6-Person Families | 9 (1.5%) | $0 |
| 7+ Person Families | 0 (0.0%) | $0 |
| Total | 592 (100.0%) | $39,591 |
Family Income by Number of Earners in Homestead Valley
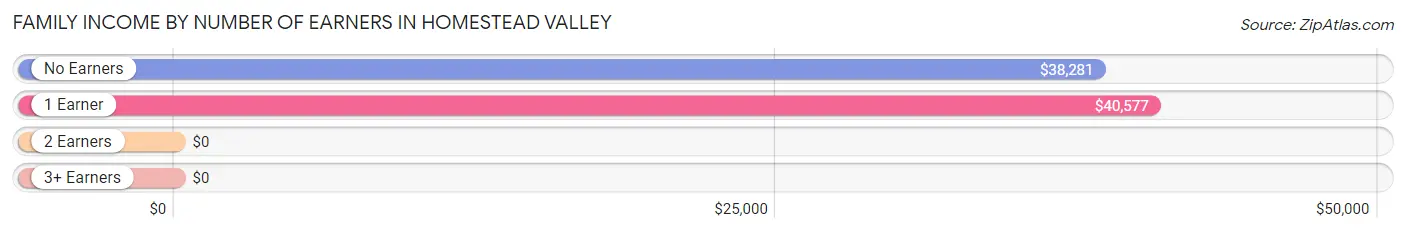
| Number of Earners | # Families | Median Income |
| No Earners | 188 (31.8%) | $38,281 |
| 1 Earner | 236 (39.9%) | $40,577 |
| 2 Earners | 168 (28.4%) | $0 |
| 3+ Earners | 0 (0.0%) | $0 |
| Total | 592 (100.0%) | $39,591 |
Household Income in Homestead Valley
Household Income Brackets in Homestead Valley
With 372 households falling in the category, the $35,000 to $49,999 income range is the most frequent in Homestead Valley, accounting for 30.0% of all households. In contrast, only 16 households (1.3%) fall into the $150,000 to $199,999 income bracket, making it the least populous group.
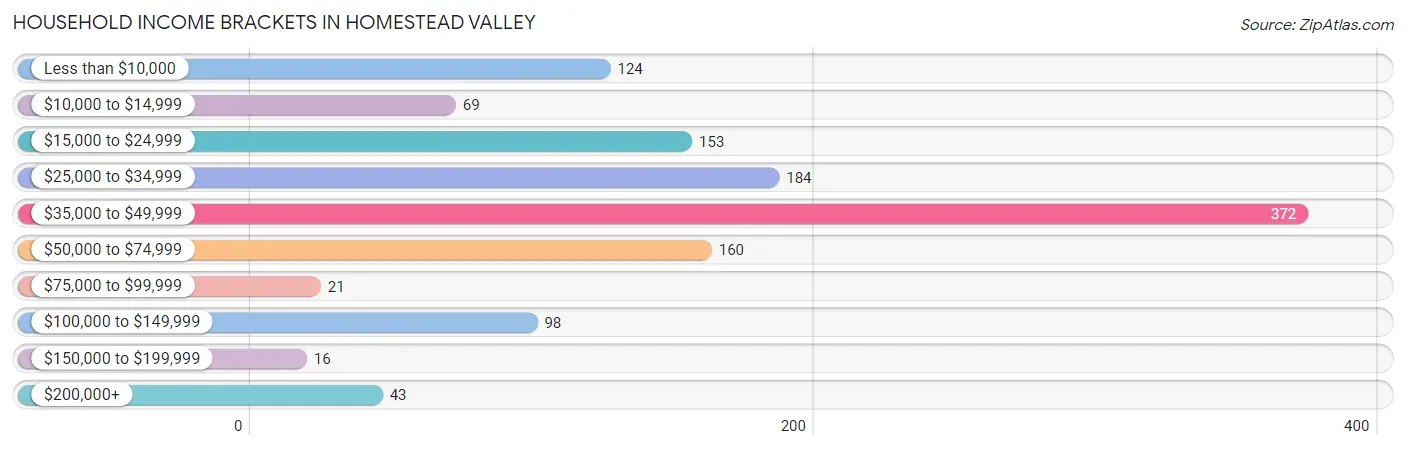
| Income Bracket | # Households | % Households |
| Less than $10,000 | 124 | 10.0% |
| $10,000 to $14,999 | 69 | 5.6% |
| $15,000 to $24,999 | 153 | 12.3% |
| $25,000 to $34,999 | 184 | 14.8% |
| $35,000 to $49,999 | 372 | 30.0% |
| $50,000 to $74,999 | 160 | 12.9% |
| $75,000 to $99,999 | 21 | 1.7% |
| $100,000 to $149,999 | 98 | 7.9% |
| $150,000 to $199,999 | 16 | 1.3% |
| $200,000+ | 43 | 3.5% |
Household Income by Householder Age in Homestead Valley
The median household income in Homestead Valley is $38,834, with the highest median household income of $42,344 found in the 45 to 64 years age bracket for the primary householder. A total of 519 households (41.8%) fall into this category.
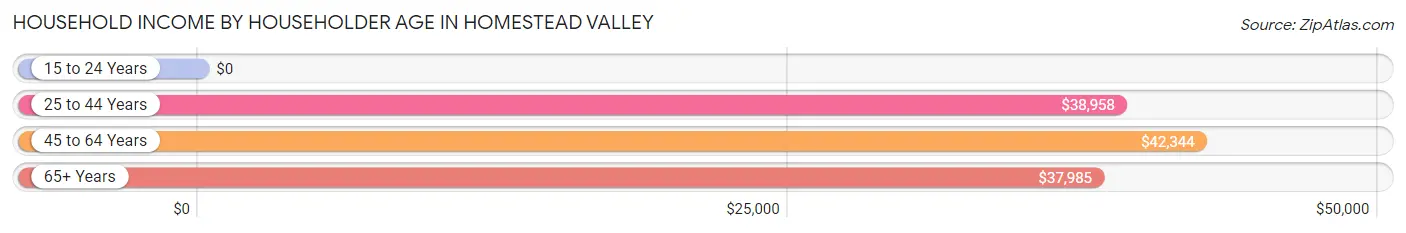
| Income Bracket | # Households | Median Income |
| 15 to 24 Years | 0 (0.0%) | $0 |
| 25 to 44 Years | 245 (19.7%) | $38,958 |
| 45 to 64 Years | 519 (41.8%) | $42,344 |
| 65+ Years | 477 (38.4%) | $37,985 |
| Total | 1,241 (100.0%) | $38,834 |
Poverty in Homestead Valley
Income Below Poverty by Sex and Age in Homestead Valley
With 25.6% poverty level for males and 21.3% for females among the residents of Homestead Valley, under 5 year old males and 16 and 17 year old females are the most vulnerable to poverty, with 22 males (100.0%) and 10 females (100.0%) in their respective age groups living below the poverty level.
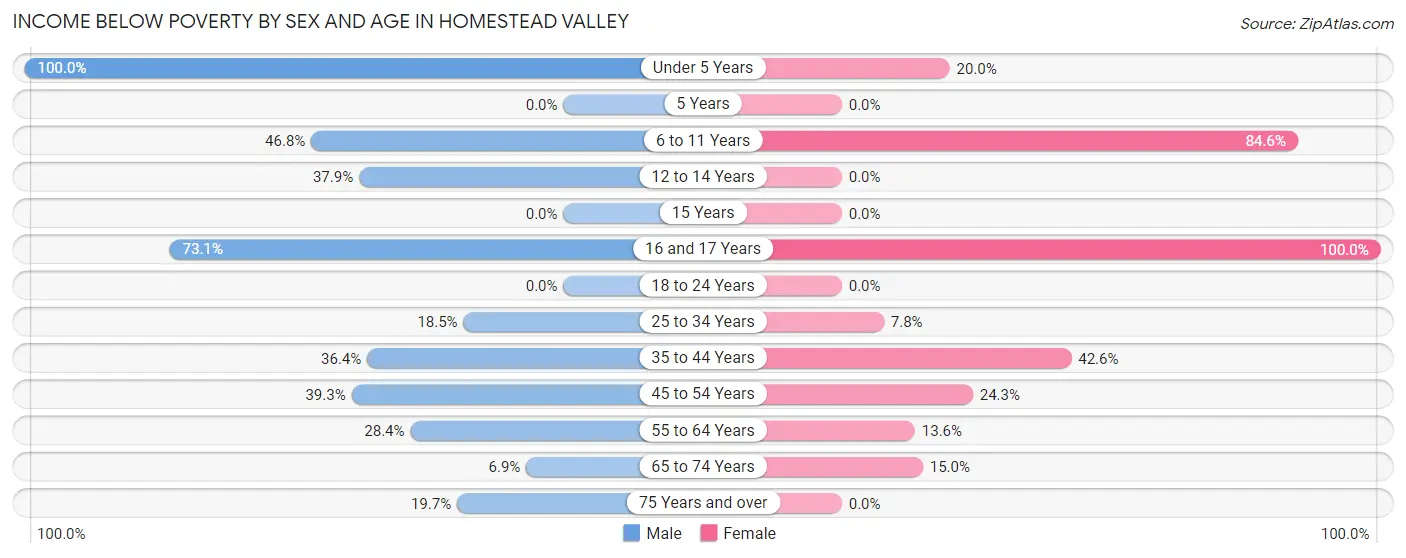
| Age Bracket | Male | Female |
| Under 5 Years | 22 (100.0%) | 12 (20.0%) |
| 5 Years | 0 (0.0%) | 0 (0.0%) |
| 6 to 11 Years | 22 (46.8%) | 33 (84.6%) |
| 12 to 14 Years | 11 (37.9%) | 0 (0.0%) |
| 15 Years | 0 (0.0%) | 0 (0.0%) |
| 16 and 17 Years | 19 (73.1%) | 10 (100.0%) |
| 18 to 24 Years | 0 (0.0%) | 0 (0.0%) |
| 25 to 34 Years | 28 (18.5%) | 10 (7.8%) |
| 35 to 44 Years | 59 (36.4%) | 69 (42.6%) |
| 45 to 54 Years | 59 (39.3%) | 53 (24.3%) |
| 55 to 64 Years | 73 (28.4%) | 32 (13.6%) |
| 65 to 74 Years | 20 (6.9%) | 34 (15.0%) |
| 75 Years and over | 30 (19.7%) | 0 (0.0%) |
| Total | 343 (25.6%) | 253 (21.3%) |
Income Above Poverty by Sex and Age in Homestead Valley
According to the poverty statistics in Homestead Valley, males aged 18 to 24 years and females aged 5 years are the age groups that are most secure financially, with 100.0% of males and 100.0% of females in these age groups living above the poverty line.
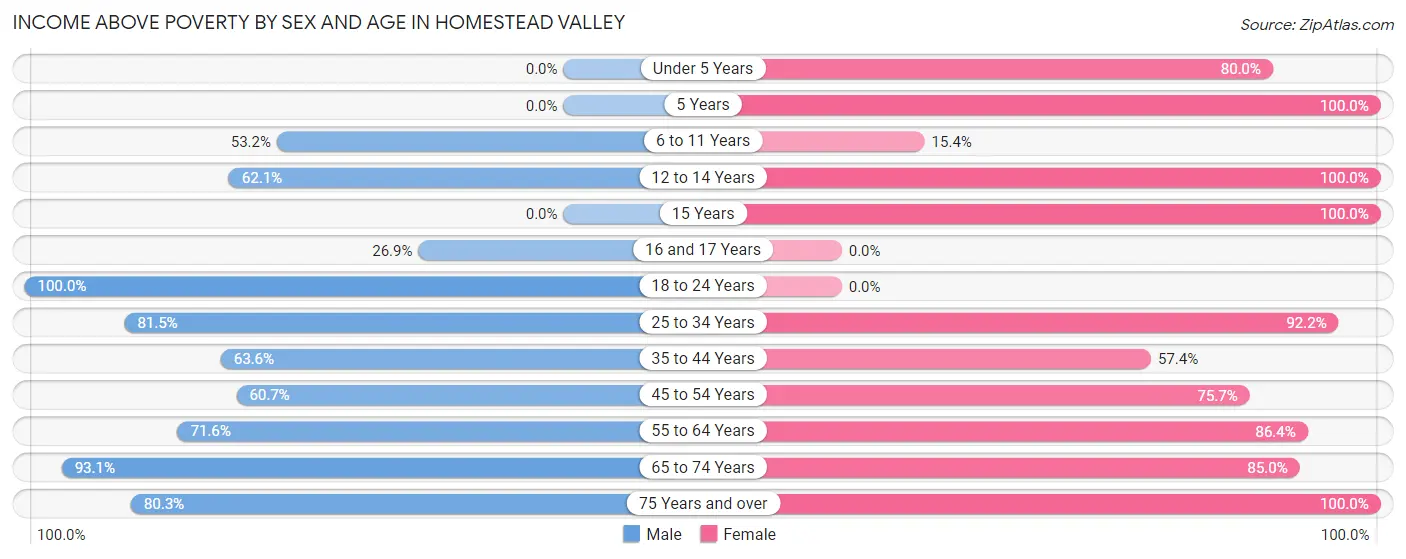
| Age Bracket | Male | Female |
| Under 5 Years | 0 (0.0%) | 48 (80.0%) |
| 5 Years | 0 (0.0%) | 5 (100.0%) |
| 6 to 11 Years | 25 (53.2%) | 6 (15.4%) |
| 12 to 14 Years | 18 (62.1%) | 21 (100.0%) |
| 15 Years | 0 (0.0%) | 2 (100.0%) |
| 16 and 17 Years | 7 (26.9%) | 0 (0.0%) |
| 18 to 24 Years | 52 (100.0%) | 0 (0.0%) |
| 25 to 34 Years | 123 (81.5%) | 118 (92.2%) |
| 35 to 44 Years | 103 (63.6%) | 93 (57.4%) |
| 45 to 54 Years | 91 (60.7%) | 165 (75.7%) |
| 55 to 64 Years | 184 (71.6%) | 204 (86.4%) |
| 65 to 74 Years | 270 (93.1%) | 192 (85.0%) |
| 75 Years and over | 122 (80.3%) | 78 (100.0%) |
| Total | 995 (74.4%) | 932 (78.6%) |
Income Below Poverty Among Married-Couple Families in Homestead Valley
The poverty statistics for married-couple families in Homestead Valley show that 9.7% or 39 of the total 401 families live below the poverty line. Families with 3 or 4 children have the highest poverty rate of 100.0%, comprising of 19 families. On the other hand, families with no children have the lowest poverty rate of 0.0%, which includes 0 families.
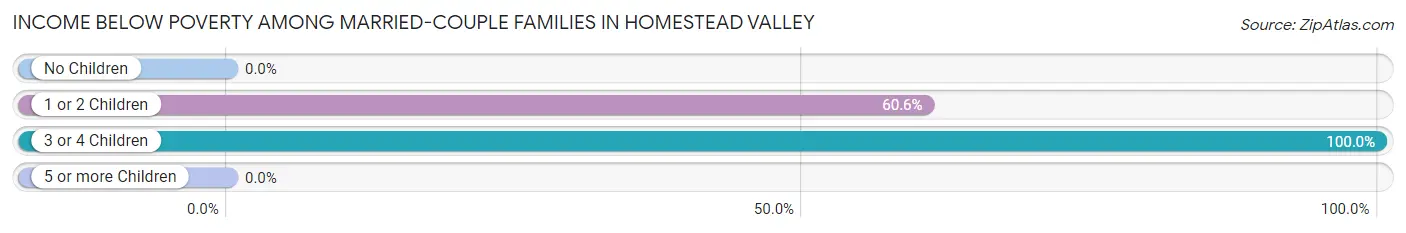
| Children | Above Poverty | Below Poverty |
| No Children | 349 (100.0%) | 0 (0.0%) |
| 1 or 2 Children | 13 (39.4%) | 20 (60.6%) |
| 3 or 4 Children | 0 (0.0%) | 19 (100.0%) |
| 5 or more Children | 0 (0.0%) | 0 (0.0%) |
| Total | 362 (90.3%) | 39 (9.7%) |
Income Below Poverty Among Single-Parent Households in Homestead Valley
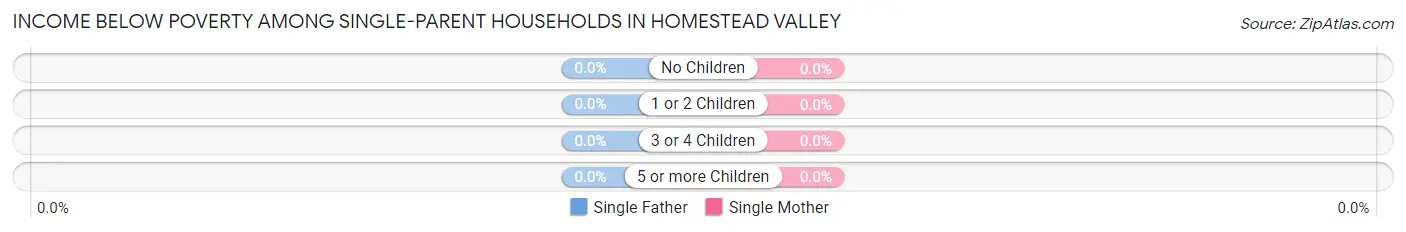
| Children | Single Father | Single Mother |
| No Children | 0 (0.0%) | 0 (0.0%) |
| 1 or 2 Children | 0 (0.0%) | 0 (0.0%) |
| 3 or 4 Children | 0 (0.0%) | 0 (0.0%) |
| 5 or more Children | 0 (0.0%) | 0 (0.0%) |
| Total | 0 (0.0%) | 0 (0.0%) |
Income Below Poverty Among Married-Couple vs Single-Parent Households in Homestead Valley
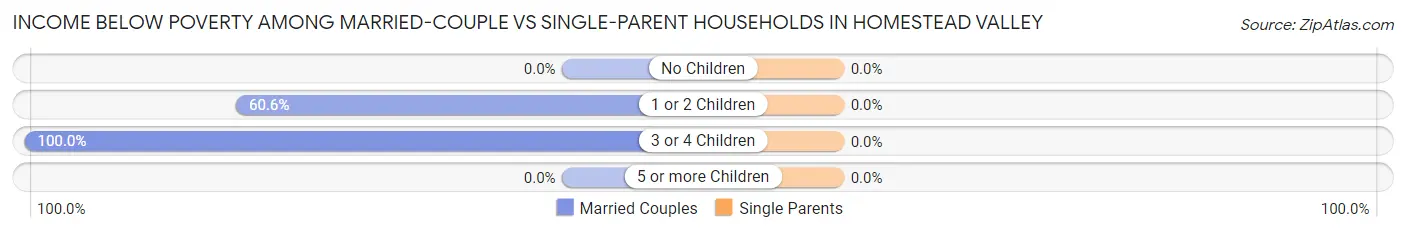
| Children | Married-Couple Families | Single-Parent Households |
| No Children | 0 (0.0%) | 0 (0.0%) |
| 1 or 2 Children | 20 (60.6%) | 0 (0.0%) |
| 3 or 4 Children | 19 (100.0%) | 0 (0.0%) |
| 5 or more Children | 0 (0.0%) | 0 (0.0%) |
| Total | 39 (9.7%) | 0 (0.0%) |
Race in Homestead Valley
The most populous races in Homestead Valley are White / Caucasian (2,126 | 83.5%), Hispanic or Latino (438 | 17.2%), and Two or more Races (236 | 9.3%).
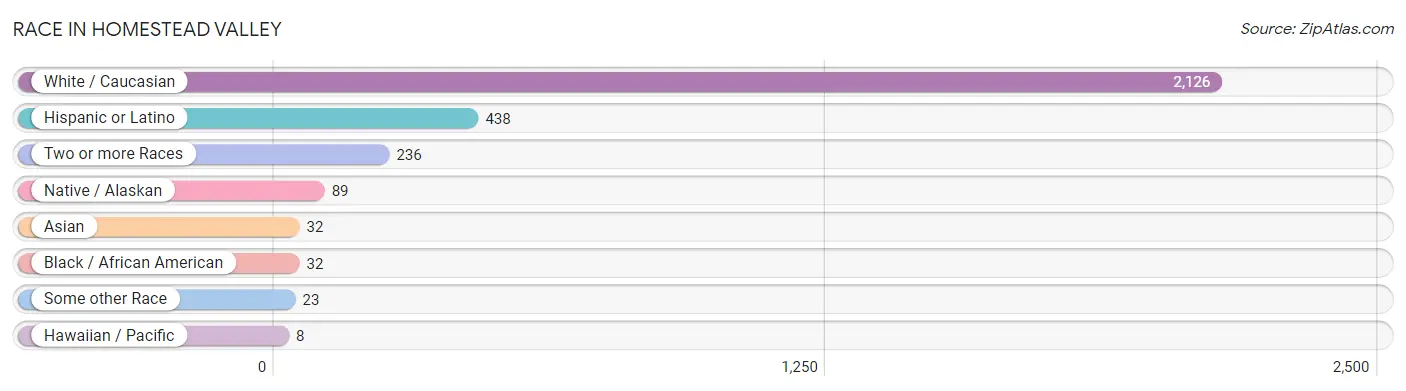
| Race | # Population | % Population |
| Asian | 32 | 1.3% |
| Black / African American | 32 | 1.3% |
| Hawaiian / Pacific | 8 | 0.3% |
| Hispanic or Latino | 438 | 17.2% |
| Native / Alaskan | 89 | 3.5% |
| White / Caucasian | 2,126 | 83.5% |
| Two or more Races | 236 | 9.3% |
| Some other Race | 23 | 0.9% |
| Total | 2,546 | 100.0% |
Ancestry in Homestead Valley
The most populous ancestries reported in Homestead Valley are German (464 | 18.2%), English (449 | 17.6%), Irish (449 | 17.6%), Mexican (375 | 14.7%), and European (137 | 5.4%), together accounting for 73.6% of all Homestead Valley residents.
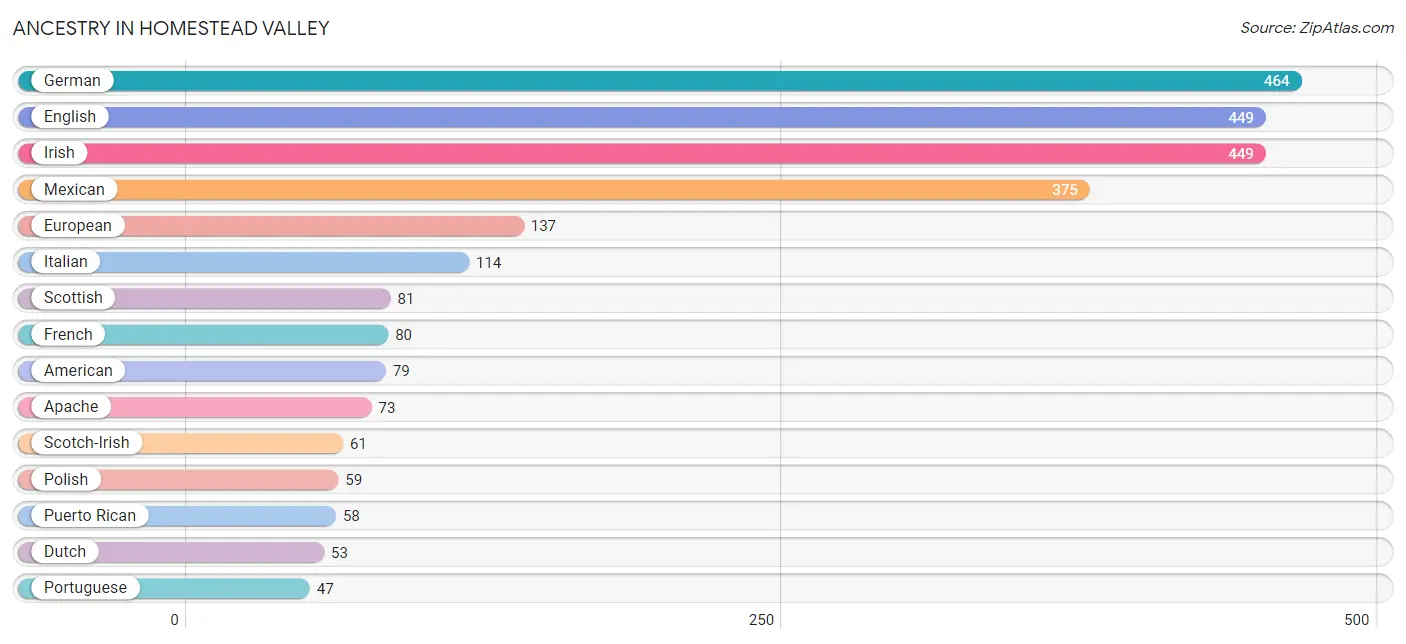
| Ancestry | # Population | % Population |
| American | 79 | 3.1% |
| Apache | 73 | 2.9% |
| Armenian | 24 | 0.9% |
| Belizean | 32 | 1.3% |
| Burmese | 5 | 0.2% |
| Cajun | 12 | 0.5% |
| Central American | 5 | 0.2% |
| Cherokee | 38 | 1.5% |
| Comanche | 30 | 1.2% |
| Czechoslovakian | 44 | 1.7% |
| Danish | 45 | 1.8% |
| Dutch | 53 | 2.1% |
| English | 449 | 17.6% |
| European | 137 | 5.4% |
| Finnish | 22 | 0.9% |
| French | 80 | 3.1% |
| German | 464 | 18.2% |
| Greek | 9 | 0.4% |
| Guamanian / Chamorro | 8 | 0.3% |
| Irish | 449 | 17.6% |
| Italian | 114 | 4.5% |
| Malaysian | 8 | 0.3% |
| Mexican | 375 | 14.7% |
| Norwegian | 31 | 1.2% |
| Pakistani | 37 | 1.5% |
| Polish | 59 | 2.3% |
| Portuguese | 47 | 1.8% |
| Puerto Rican | 58 | 2.3% |
| Salvadoran | 5 | 0.2% |
| Scandinavian | 10 | 0.4% |
| Scotch-Irish | 61 | 2.4% |
| Scottish | 81 | 3.2% |
| Slavic | 15 | 0.6% |
| Welsh | 13 | 0.5% |
| Yugoslavian | 15 | 0.6% | View All 35 Rows |
Immigrants in Homestead Valley
The most numerous immigrant groups reported in Homestead Valley came from Central America (86 | 3.4%), Latin America (86 | 3.4%), Mexico (81 | 3.2%), Asia (27 | 1.1%), and South Eastern Asia (27 | 1.1%), together accounting for 12.1% of all Homestead Valley residents.
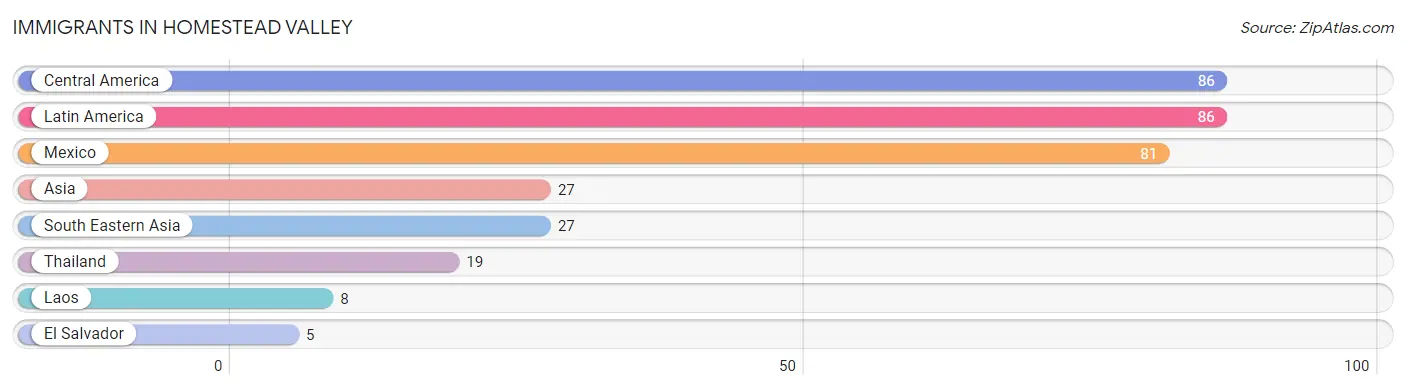
| Immigration Origin | # Population | % Population |
| Asia | 27 | 1.1% |
| Central America | 86 | 3.4% |
| El Salvador | 5 | 0.2% |
| Laos | 8 | 0.3% |
| Latin America | 86 | 3.4% |
| Mexico | 81 | 3.2% |
| South Eastern Asia | 27 | 1.1% |
| Thailand | 19 | 0.7% | View All 8 Rows |
Sex and Age in Homestead Valley
Sex and Age in Homestead Valley
The most populous age groups in Homestead Valley are 60 to 64 Years (200 | 14.8%) for men and 65 to 69 Years (180 | 15.0%) for women.
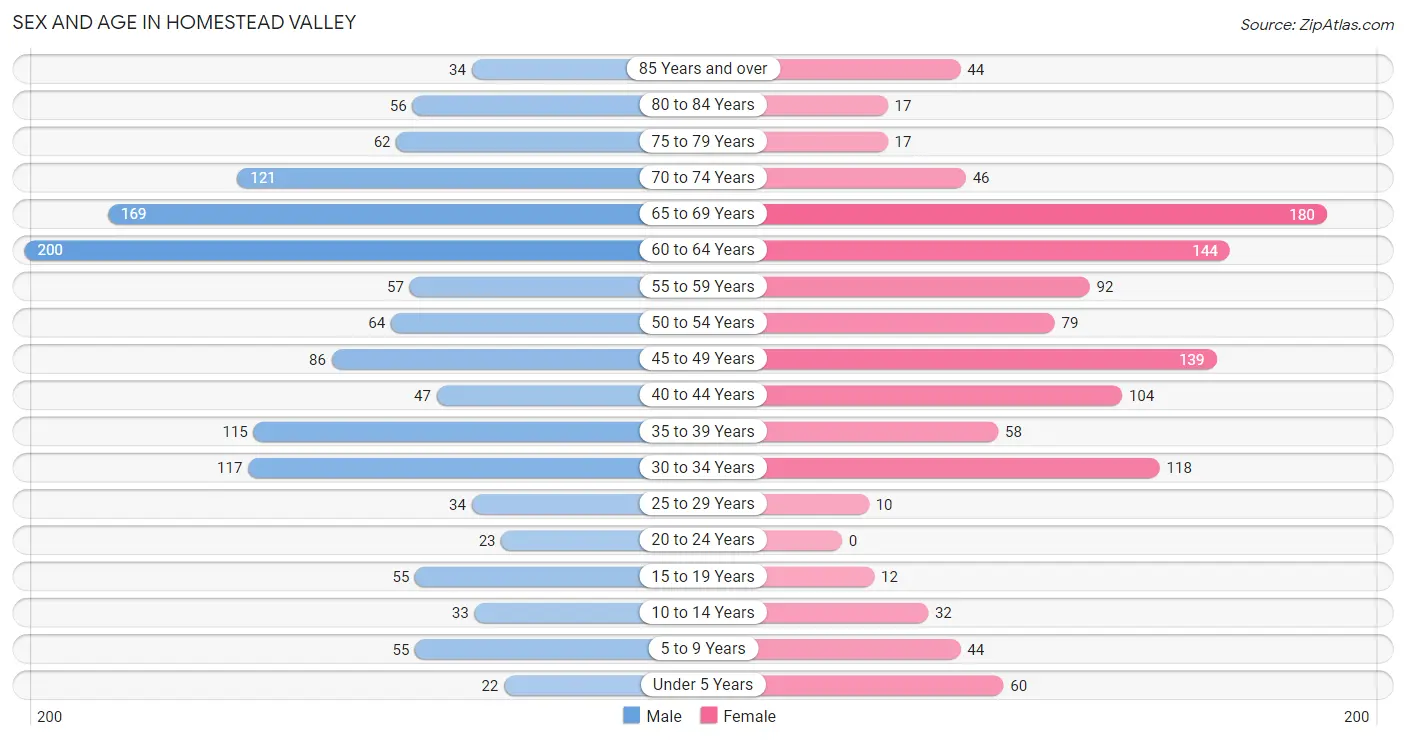
| Age Bracket | Male | Female |
| Under 5 Years | 22 (1.6%) | 60 (5.0%) |
| 5 to 9 Years | 55 (4.1%) | 44 (3.7%) |
| 10 to 14 Years | 33 (2.4%) | 32 (2.7%) |
| 15 to 19 Years | 55 (4.1%) | 12 (1.0%) |
| 20 to 24 Years | 23 (1.7%) | 0 (0.0%) |
| 25 to 29 Years | 34 (2.5%) | 10 (0.8%) |
| 30 to 34 Years | 117 (8.7%) | 118 (9.9%) |
| 35 to 39 Years | 115 (8.5%) | 58 (4.9%) |
| 40 to 44 Years | 47 (3.5%) | 104 (8.7%) |
| 45 to 49 Years | 86 (6.4%) | 139 (11.6%) |
| 50 to 54 Years | 64 (4.7%) | 79 (6.6%) |
| 55 to 59 Years | 57 (4.2%) | 92 (7.7%) |
| 60 to 64 Years | 200 (14.8%) | 144 (12.0%) |
| 65 to 69 Years | 169 (12.5%) | 180 (15.0%) |
| 70 to 74 Years | 121 (9.0%) | 46 (3.8%) |
| 75 to 79 Years | 62 (4.6%) | 17 (1.4%) |
| 80 to 84 Years | 56 (4.2%) | 17 (1.4%) |
| 85 Years and over | 34 (2.5%) | 44 (3.7%) |
| Total | 1,350 (100.0%) | 1,196 (100.0%) |
Families and Households in Homestead Valley
Median Family Size in Homestead Valley
The median family size in Homestead Valley is 2.72 persons per family, with married-couple families (401 | 67.7%) accounting for the largest median family size of 2.79 persons per family. On the other hand, single male/father families (134 | 22.6%) represent the smallest median family size with 2.56 persons per family.
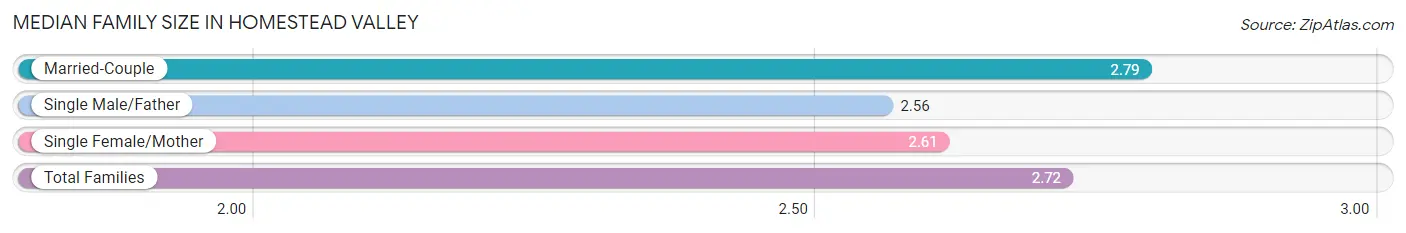
| Family Type | # Families | Family Size |
| Married-Couple | 401 (67.7%) | 2.79 |
| Single Male/Father | 134 (22.6%) | 2.56 |
| Single Female/Mother | 57 (9.6%) | 2.61 |
| Total Families | 592 (100.0%) | 2.72 |
Median Household Size in Homestead Valley
The median household size in Homestead Valley is 2.05 persons per household, with single male/father households (134 | 10.8%) accounting for the largest median household size of 3.01 persons per household. non-family households (649 | 52.3%) represent the smallest median household size with 1.25 persons per household.
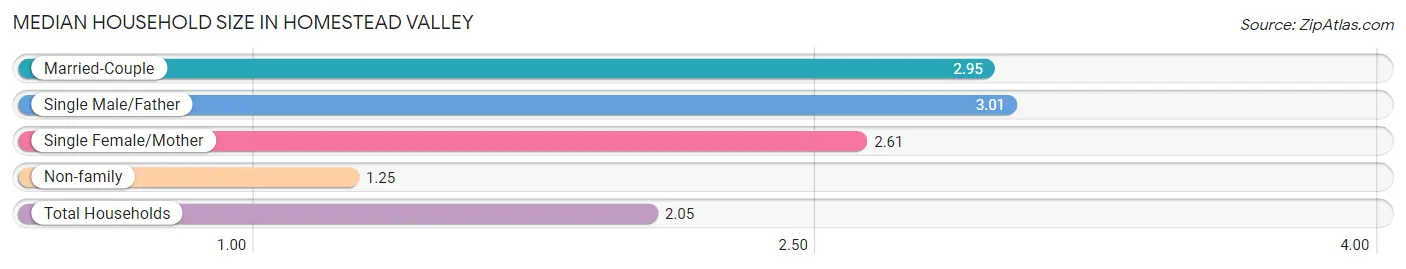
| Household Type | # Households | Household Size |
| Married-Couple | 401 (32.3%) | 2.95 |
| Single Male/Father | 134 (10.8%) | 3.01 |
| Single Female/Mother | 57 (4.6%) | 2.61 |
| Non-family | 649 (52.3%) | 1.25 |
| Total Households | 1,241 (100.0%) | 2.05 |
Household Size by Marriage Status in Homestead Valley
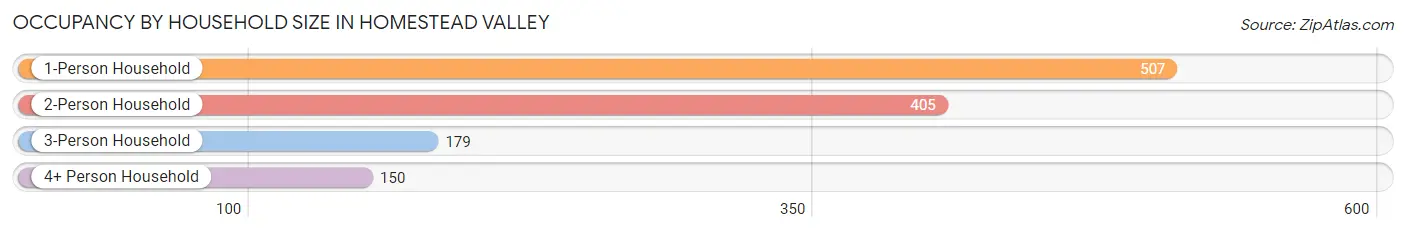
Out of a total of 1,241 households in Homestead Valley, 592 (47.7%) are family households, while 649 (52.3%) are nonfamily households. The most numerous type of family households are 2-person households, comprising 274, and the most common type of nonfamily households are 1-person households, comprising 507.
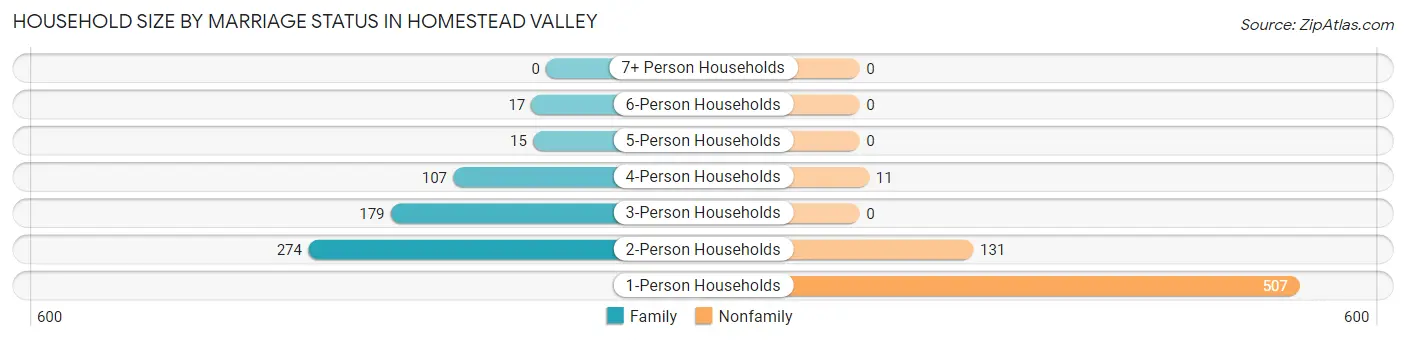
| Household Size | Family Households | Nonfamily Households |
| 1-Person Households | - | 507 (40.8%) |
| 2-Person Households | 274 (22.1%) | 131 (10.6%) |
| 3-Person Households | 179 (14.4%) | 0 (0.0%) |
| 4-Person Households | 107 (8.6%) | 11 (0.9%) |
| 5-Person Households | 15 (1.2%) | 0 (0.0%) |
| 6-Person Households | 17 (1.4%) | 0 (0.0%) |
| 7+ Person Households | 0 (0.0%) | 0 (0.0%) |
| Total | 592 (47.7%) | 649 (52.3%) |
Female Fertility in Homestead Valley
Fertility by Age in Homestead Valley
Average fertility rate in Homestead Valley is 12.0 births per 1,000 women. Women in the age bracket of 20 to 34 years have the highest fertility rate with 47.0 births per 1,000 women. Women in the age bracket of 20 to 34 years acount for 100.0% of all women with births.
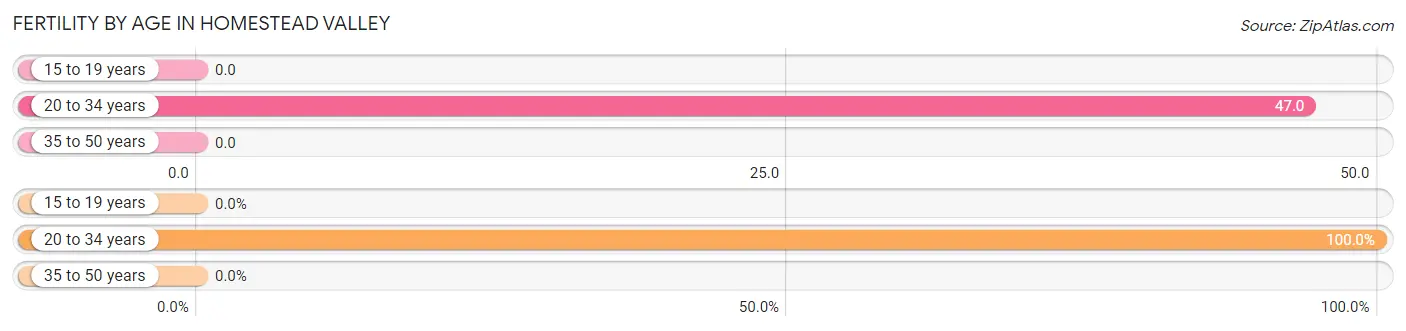
| Age Bracket | Women with Births | Births / 1,000 Women |
| 15 to 19 years | 0 (0.0%) | 0.0 |
| 20 to 34 years | 6 (100.0%) | 47.0 |
| 35 to 50 years | 0 (0.0%) | 0.0 |
| Total | 6 (100.0%) | 12.0 |
Fertility by Age by Marriage Status in Homestead Valley
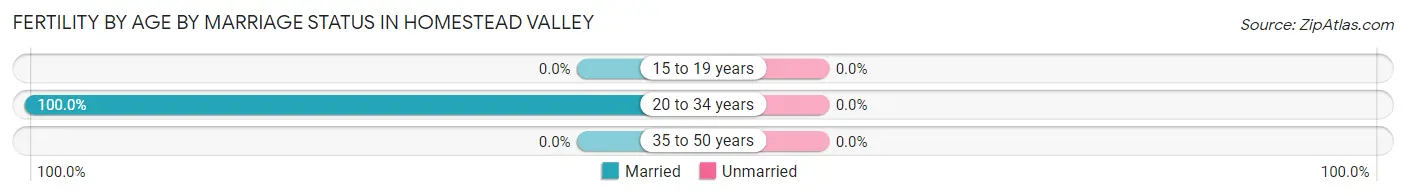
| Age Bracket | Married | Unmarried |
| 15 to 19 years | 0 (0.0%) | 0 (0.0%) |
| 20 to 34 years | 6 (100.0%) | 0 (0.0%) |
| 35 to 50 years | 0 (0.0%) | 0 (0.0%) |
| Total | 6 (100.0%) | 0 (0.0%) |
Fertility by Education in Homestead Valley
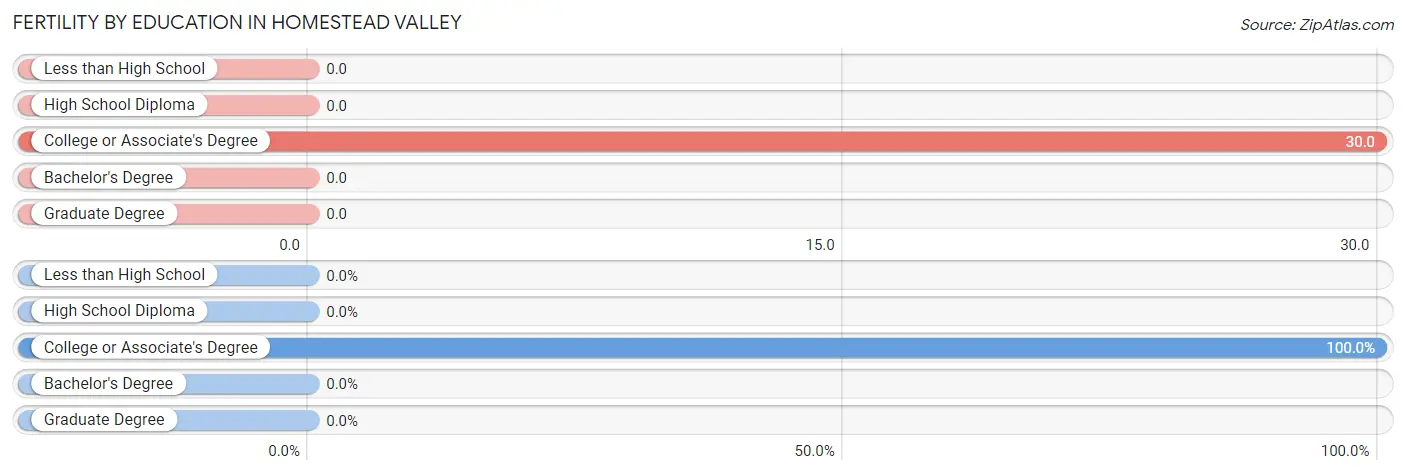
| Educational Attainment | Women with Births | Births / 1,000 Women |
| Less than High School | 0 (0.0%) | 0.0 |
| High School Diploma | 0 (0.0%) | 0.0 |
| College or Associate's Degree | 6 (100.0%) | 30.0 |
| Bachelor's Degree | 0 (0.0%) | 0.0 |
| Graduate Degree | 0 (0.0%) | 0.0 |
| Total | 6 (100.0%) | 12.0 |
Fertility by Education by Marriage Status in Homestead Valley
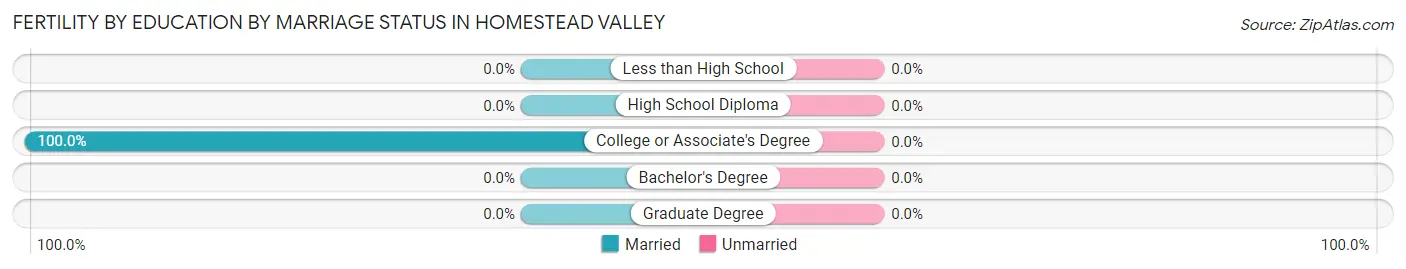
| Educational Attainment | Married | Unmarried |
| Less than High School | 0 (0.0%) | 0 (0.0%) |
| High School Diploma | 0 (0.0%) | 0 (0.0%) |
| College or Associate's Degree | 6 (100.0%) | 0 (0.0%) |
| Bachelor's Degree | 0 (0.0%) | 0 (0.0%) |
| Graduate Degree | 0 (0.0%) | 0 (0.0%) |
| Total | 6 (100.0%) | 0 (0.0%) |
Employment Characteristics in Homestead Valley
Employment by Class of Employer in Homestead Valley
Among the 770 employed individuals in Homestead Valley, private company employees (363 | 47.1%), self-employed (not incorporated) (220 | 28.6%), and local government employees (72 | 9.3%) make up the most common classes of employment.
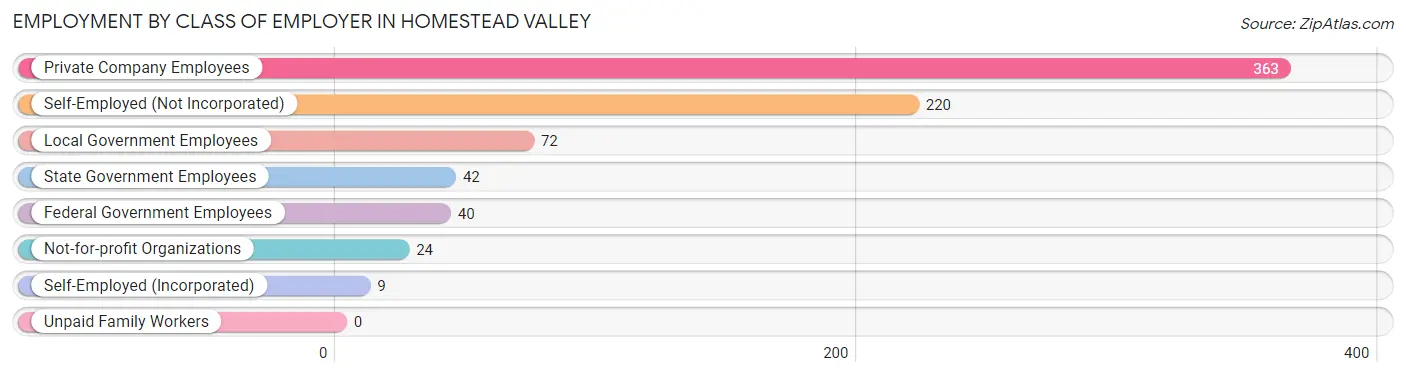
| Employer Class | # Employees | % Employees |
| Private Company Employees | 363 | 47.1% |
| Self-Employed (Incorporated) | 9 | 1.2% |
| Self-Employed (Not Incorporated) | 220 | 28.6% |
| Not-for-profit Organizations | 24 | 3.1% |
| Local Government Employees | 72 | 9.3% |
| State Government Employees | 42 | 5.4% |
| Federal Government Employees | 40 | 5.2% |
| Unpaid Family Workers | 0 | 0.0% |
| Total | 770 | 100.0% |
Employment Status by Age in Homestead Valley
According to the labor force statistics for Homestead Valley, out of the total population over 16 years of age (2,298), 39.9% or 917 individuals are in the labor force, with 16.0% or 147 of them unemployed. The age group with the highest labor force participation rate is 20 to 24 years, with 100.0% or 23 individuals in the labor force. Within the labor force, the 30 to 34 years age range has the highest percentage of unemployed individuals, with 44.1% or 83 of them being unemployed.
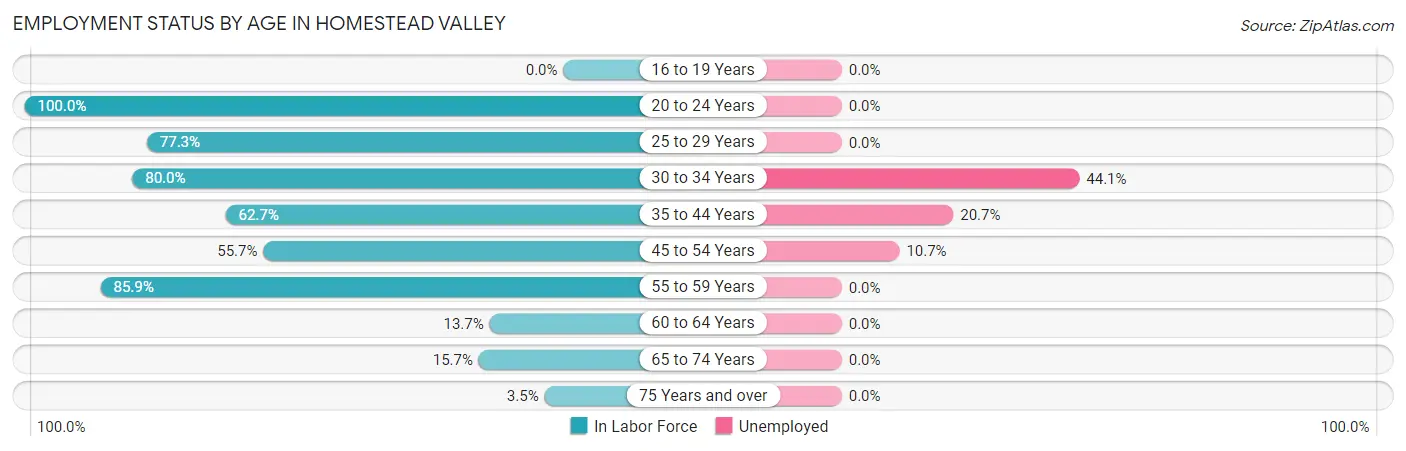
| Age Bracket | In Labor Force | Unemployed |
| 16 to 19 Years | 0 (0.0%) | 0 (0.0%) |
| 20 to 24 Years | 23 (100.0%) | 0 (0.0%) |
| 25 to 29 Years | 34 (77.3%) | 0 (0.0%) |
| 30 to 34 Years | 188 (80.0%) | 83 (44.1%) |
| 35 to 44 Years | 203 (62.7%) | 42 (20.7%) |
| 45 to 54 Years | 205 (55.7%) | 22 (10.7%) |
| 55 to 59 Years | 128 (85.9%) | 0 (0.0%) |
| 60 to 64 Years | 47 (13.7%) | 0 (0.0%) |
| 65 to 74 Years | 81 (15.7%) | 0 (0.0%) |
| 75 Years and over | 8 (3.5%) | 0 (0.0%) |
| Total | 917 (39.9%) | 147 (16.0%) |
Employment Status by Educational Attainment in Homestead Valley
According to labor force statistics for Homestead Valley, 55.0% of individuals (805) out of the total population between 25 and 64 years of age (1,464) are in the labor force, with 18.3% or 147 of them being unemployed. The group with the highest labor force participation rate are those with the educational attainment of bachelor's degree or higher, with 73.9% or 198 individuals in the labor force. Within the labor force, individuals with less than high school education have the highest percentage of unemployment, with 29.9% or 40 of them being unemployed.
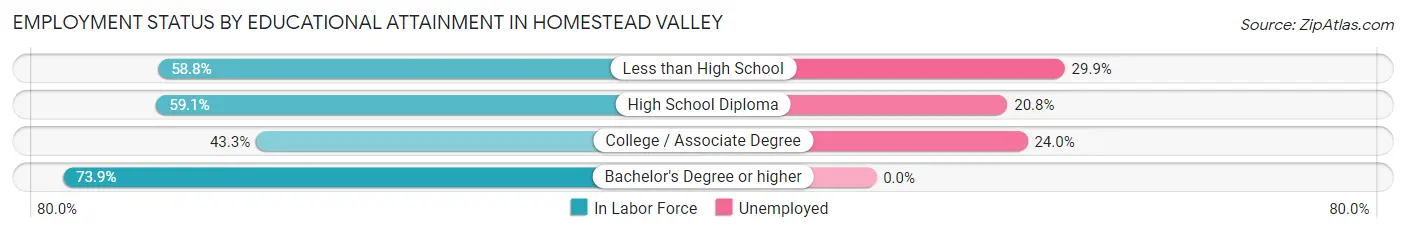
| Educational Attainment | In Labor Force | Unemployed |
| Less than High School | 134 (58.8%) | 68 (29.9%) |
| High School Diploma | 202 (59.1%) | 71 (20.8%) |
| College / Associate Degree | 271 (43.3%) | 150 (24.0%) |
| Bachelor's Degree or higher | 198 (73.9%) | 0 (0.0%) |
| Total | 805 (55.0%) | 268 (18.3%) |
Employment Occupations by Sex in Homestead Valley
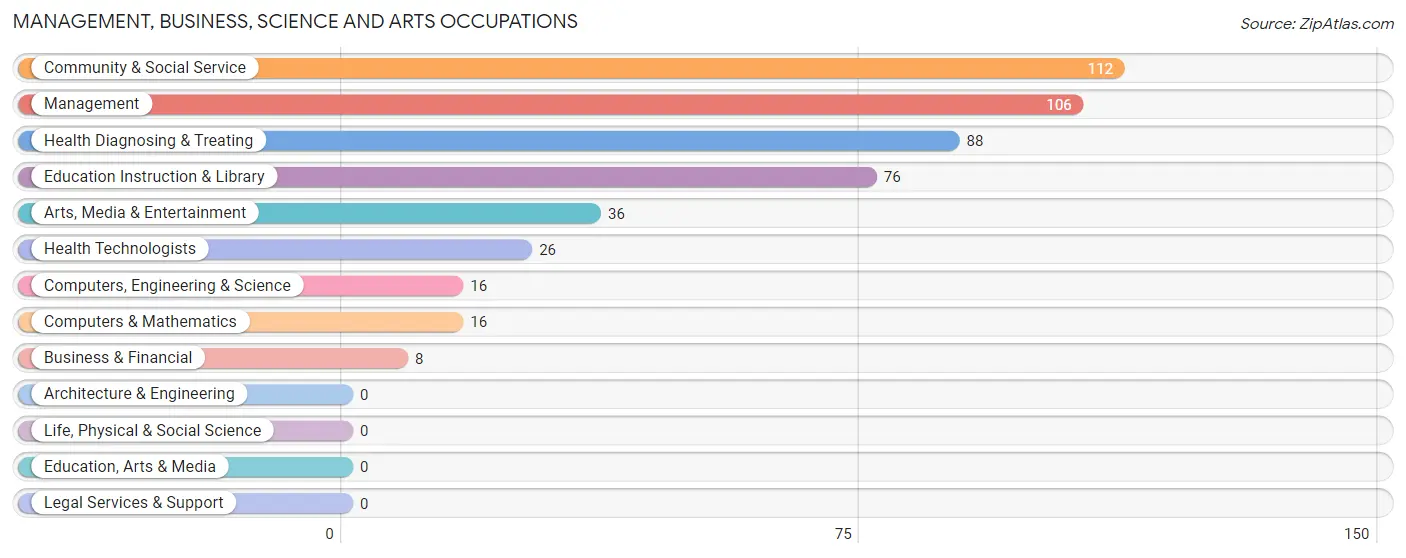
Management, Business, Science and Arts Occupations
The most common Management, Business, Science and Arts occupations in Homestead Valley are Community & Social Service (112 | 14.5%), Management (106 | 13.8%), Health Diagnosing & Treating (88 | 11.4%), Education Instruction & Library (76 | 9.9%), and Arts, Media & Entertainment (36 | 4.7%).
Management, Business, Science and Arts Occupations by Sex
Within the Management, Business, Science and Arts occupations in Homestead Valley, the most male-oriented occupations are Management (100.0%), Arts, Media & Entertainment (41.7%), and Health Diagnosing & Treating (20.4%), while the most female-oriented occupations are Business & Financial (100.0%), Computers, Engineering & Science (100.0%), and Computers & Mathematics (100.0%).
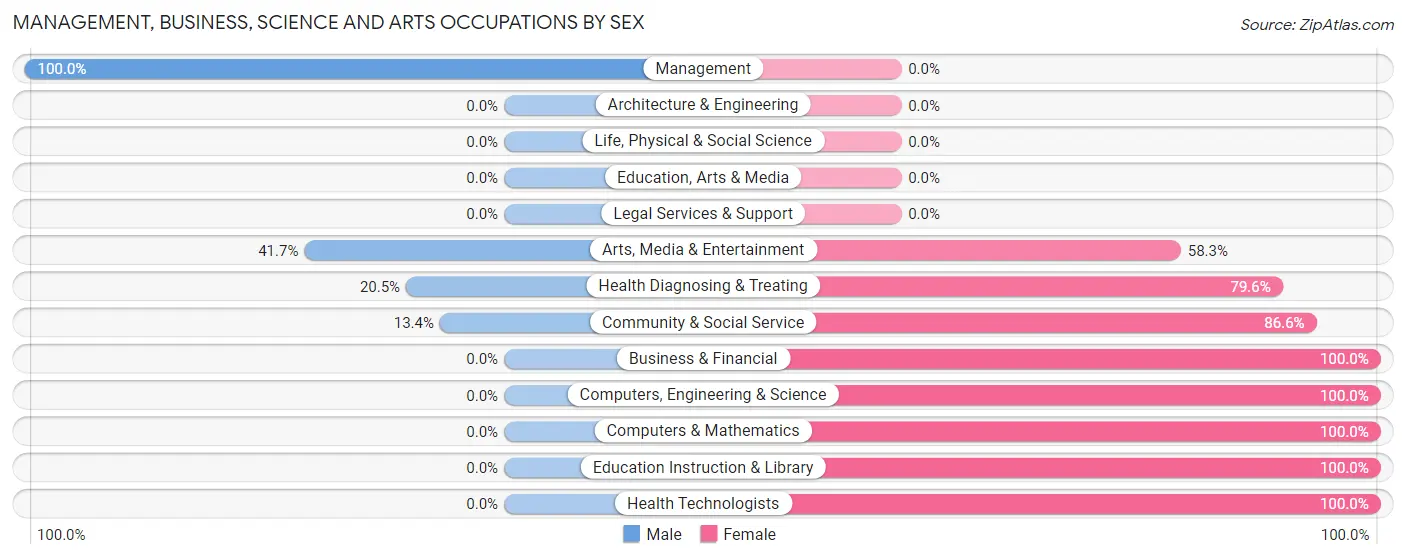
| Occupation | Male | Female |
| Management | 106 (100.0%) | 0 (0.0%) |
| Business & Financial | 0 (0.0%) | 8 (100.0%) |
| Computers, Engineering & Science | 0 (0.0%) | 16 (100.0%) |
| Computers & Mathematics | 0 (0.0%) | 16 (100.0%) |
| Architecture & Engineering | 0 (0.0%) | 0 (0.0%) |
| Life, Physical & Social Science | 0 (0.0%) | 0 (0.0%) |
| Community & Social Service | 15 (13.4%) | 97 (86.6%) |
| Education, Arts & Media | 0 (0.0%) | 0 (0.0%) |
| Legal Services & Support | 0 (0.0%) | 0 (0.0%) |
| Education Instruction & Library | 0 (0.0%) | 76 (100.0%) |
| Arts, Media & Entertainment | 15 (41.7%) | 21 (58.3%) |
| Health Diagnosing & Treating | 18 (20.4%) | 70 (79.5%) |
| Health Technologists | 0 (0.0%) | 26 (100.0%) |
| Total (Category) | 139 (42.1%) | 191 (57.9%) |
| Total (Overall) | 430 (55.8%) | 340 (44.2%) |
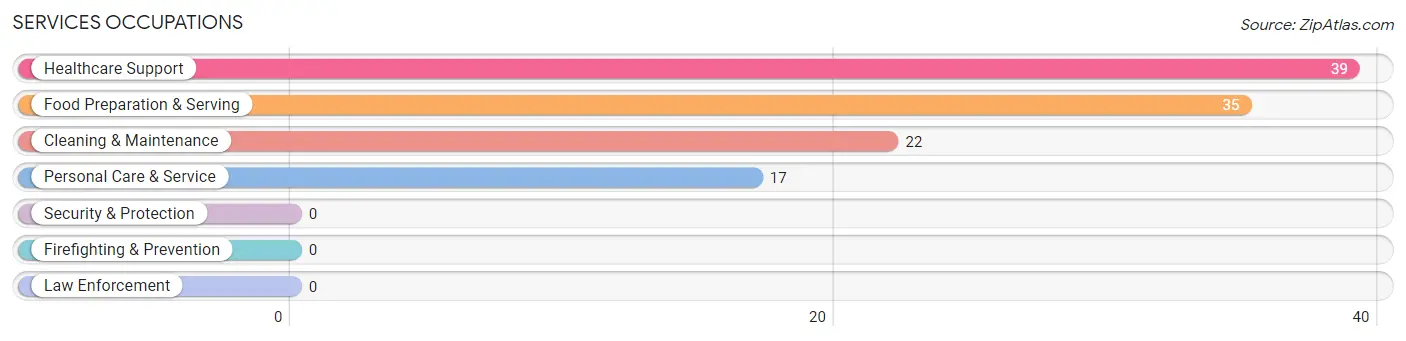
Services Occupations
The most common Services occupations in Homestead Valley are Healthcare Support (39 | 5.1%), Food Preparation & Serving (35 | 4.5%), Cleaning & Maintenance (22 | 2.9%), and Personal Care & Service (17 | 2.2%).
Services Occupations by Sex
Within the Services occupations in Homestead Valley, the most male-oriented occupations are Cleaning & Maintenance (100.0%), Food Preparation & Serving (68.6%), and Healthcare Support (51.3%), while the most female-oriented occupations are Personal Care & Service (100.0%), Healthcare Support (48.7%), and Food Preparation & Serving (31.4%).
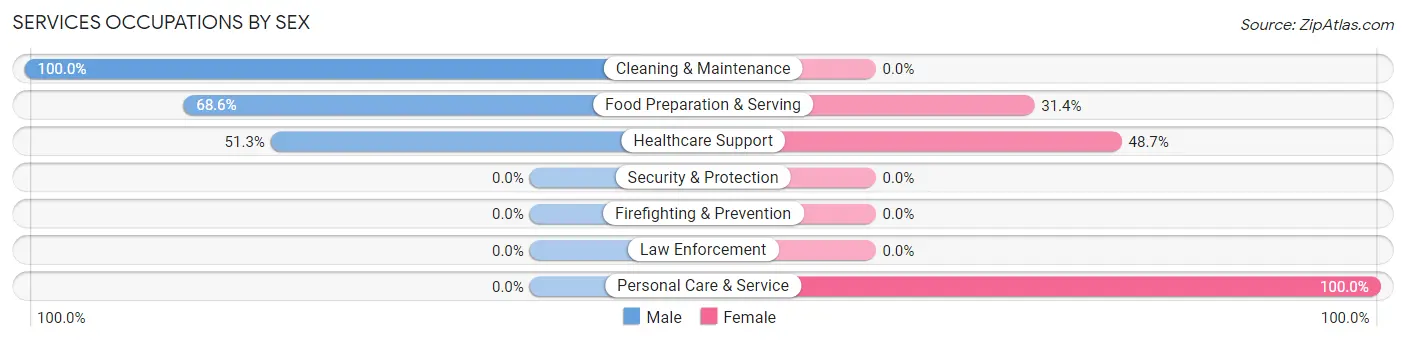
| Occupation | Male | Female |
| Healthcare Support | 20 (51.3%) | 19 (48.7%) |
| Security & Protection | 0 (0.0%) | 0 (0.0%) |
| Firefighting & Prevention | 0 (0.0%) | 0 (0.0%) |
| Law Enforcement | 0 (0.0%) | 0 (0.0%) |
| Food Preparation & Serving | 24 (68.6%) | 11 (31.4%) |
| Cleaning & Maintenance | 22 (100.0%) | 0 (0.0%) |
| Personal Care & Service | 0 (0.0%) | 17 (100.0%) |
| Total (Category) | 66 (58.4%) | 47 (41.6%) |
| Total (Overall) | 430 (55.8%) | 340 (44.2%) |
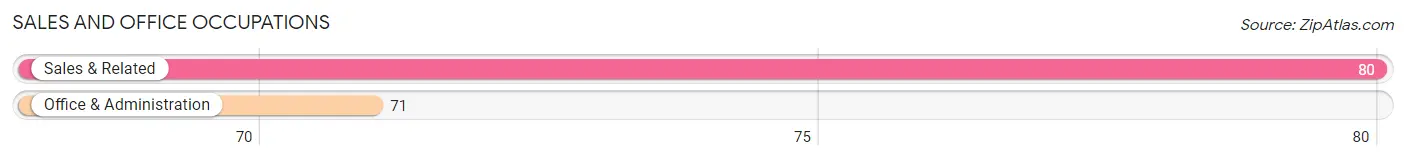
Sales and Office Occupations
The most common Sales and Office occupations in Homestead Valley are Sales & Related (80 | 10.4%), and Office & Administration (71 | 9.2%).
Sales and Office Occupations by Sex
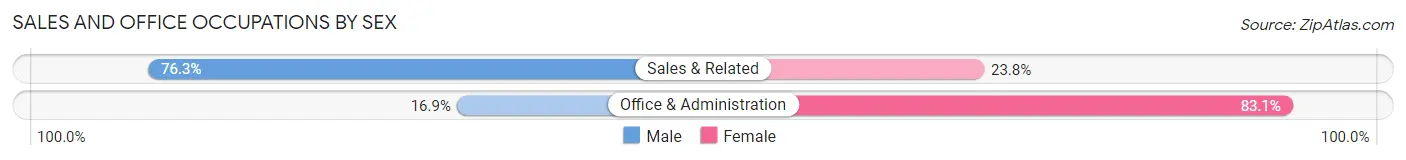
| Occupation | Male | Female |
| Sales & Related | 61 (76.2%) | 19 (23.7%) |
| Office & Administration | 12 (16.9%) | 59 (83.1%) |
| Total (Category) | 73 (48.3%) | 78 (51.7%) |
| Total (Overall) | 430 (55.8%) | 340 (44.2%) |
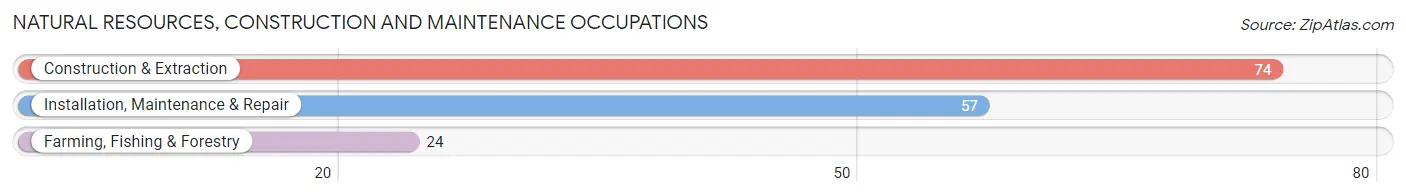
Natural Resources, Construction and Maintenance Occupations
The most common Natural Resources, Construction and Maintenance occupations in Homestead Valley are Construction & Extraction (74 | 9.6%), Installation, Maintenance & Repair (57 | 7.4%), and Farming, Fishing & Forestry (24 | 3.1%).
Natural Resources, Construction and Maintenance Occupations by Sex
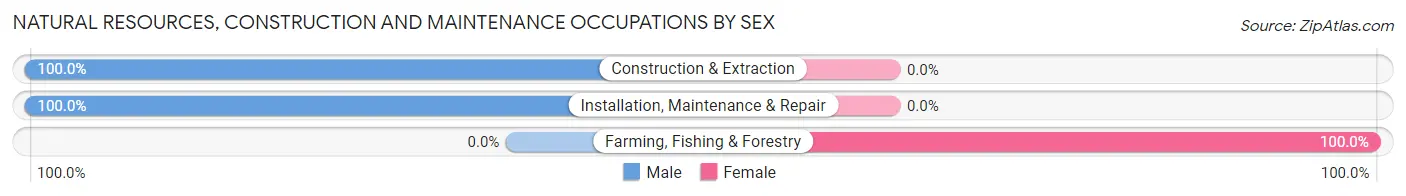
| Occupation | Male | Female |
| Farming, Fishing & Forestry | 0 (0.0%) | 24 (100.0%) |
| Construction & Extraction | 74 (100.0%) | 0 (0.0%) |
| Installation, Maintenance & Repair | 57 (100.0%) | 0 (0.0%) |
| Total (Category) | 131 (84.5%) | 24 (15.5%) |
| Total (Overall) | 430 (55.8%) | 340 (44.2%) |
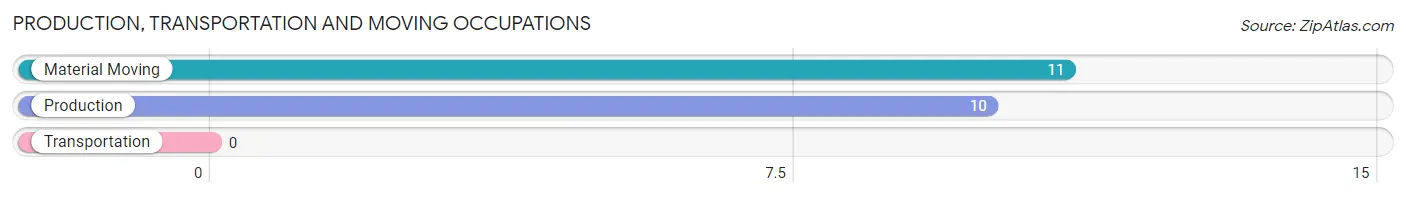
Production, Transportation and Moving Occupations
The most common Production, Transportation and Moving occupations in Homestead Valley are Material Moving (11 | 1.4%), and Production (10 | 1.3%).
Production, Transportation and Moving Occupations by Sex
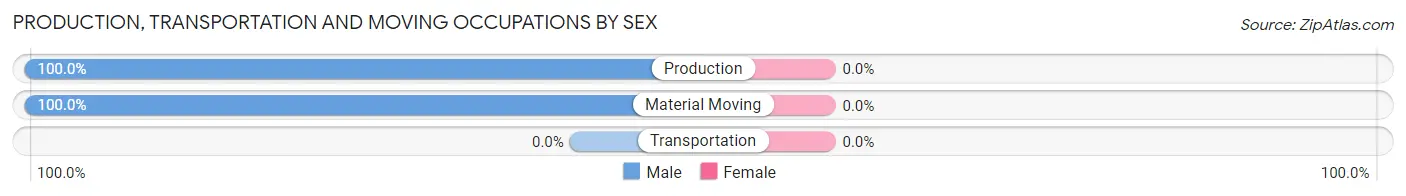
| Occupation | Male | Female |
| Production | 10 (100.0%) | 0 (0.0%) |
| Transportation | 0 (0.0%) | 0 (0.0%) |
| Material Moving | 11 (100.0%) | 0 (0.0%) |
| Total (Category) | 21 (100.0%) | 0 (0.0%) |
| Total (Overall) | 430 (55.8%) | 340 (44.2%) |
Employment Industries by Sex in Homestead Valley
Employment Industries in Homestead Valley
The major employment industries in Homestead Valley include Health Care & Social Assistance (122 | 15.8%), Construction (118 | 15.3%), Retail Trade (96 | 12.5%), Educational Services (95 | 12.3%), and Accommodation & Food Services (88 | 11.4%).
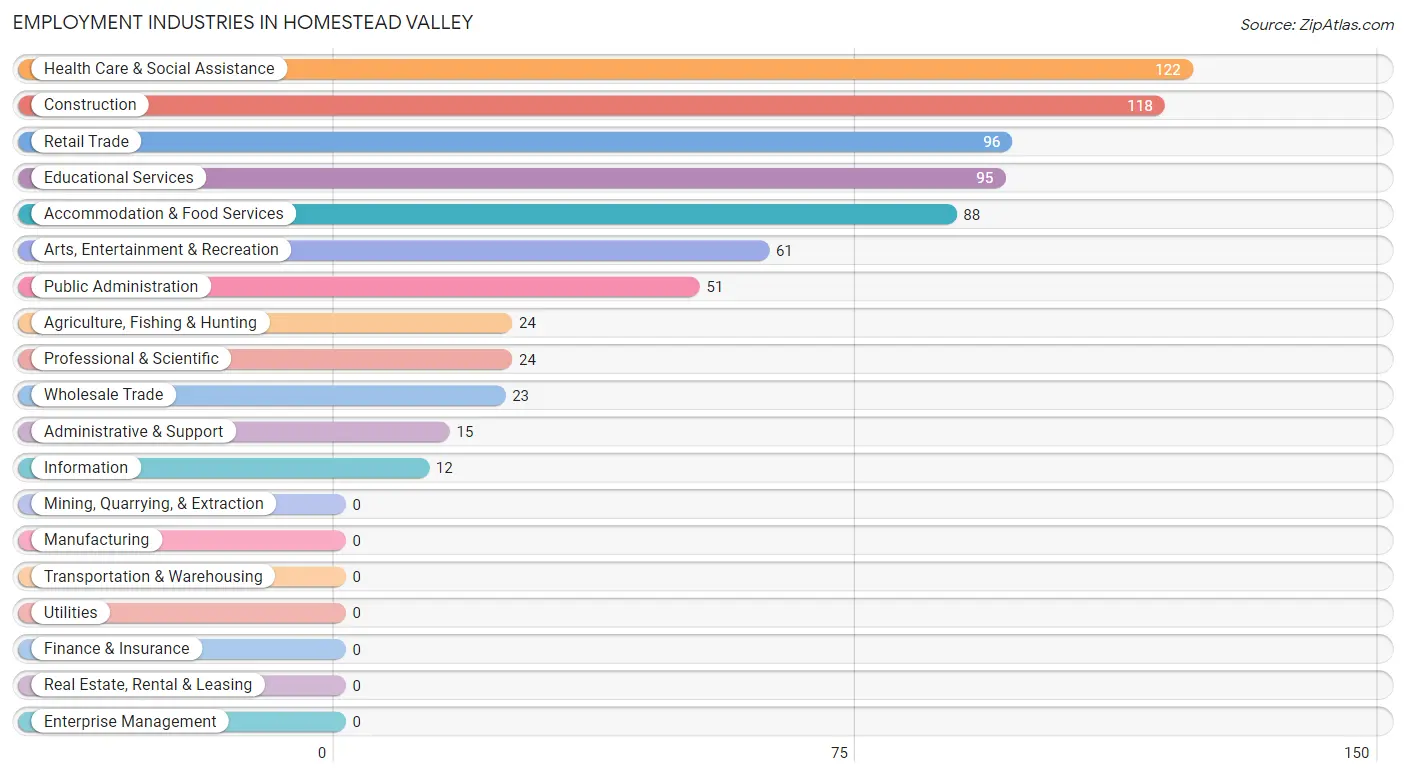
Employment Industries by Sex in Homestead Valley
The Homestead Valley industries that see more men than women are Construction (100.0%), Wholesale Trade (100.0%), and Information (100.0%), whereas the industries that tend to have a higher number of women are Agriculture, Fishing & Hunting (100.0%), Professional & Scientific (100.0%), and Health Care & Social Assistance (94.3%).
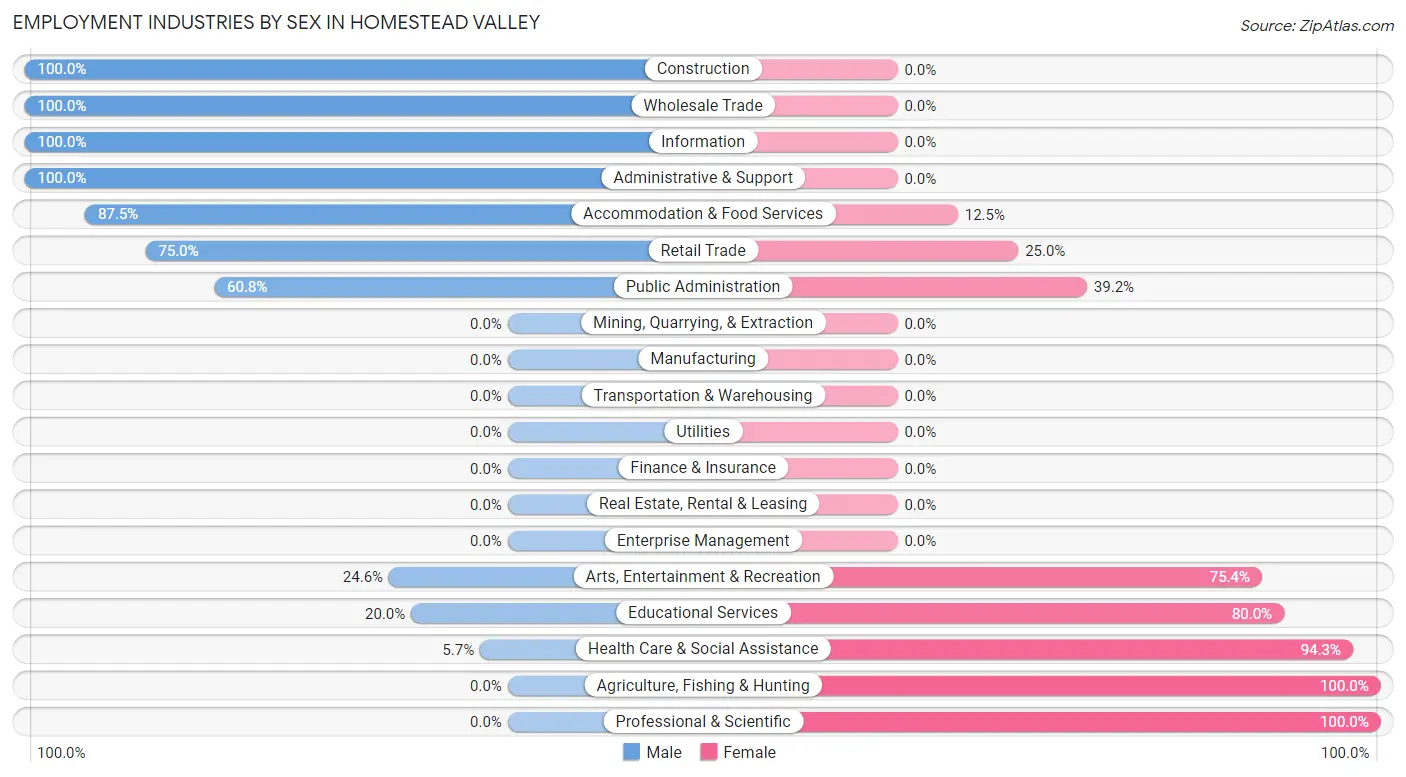
| Industry | Male | Female |
| Agriculture, Fishing & Hunting | 0 (0.0%) | 24 (100.0%) |
| Mining, Quarrying, & Extraction | 0 (0.0%) | 0 (0.0%) |
| Construction | 118 (100.0%) | 0 (0.0%) |
| Manufacturing | 0 (0.0%) | 0 (0.0%) |
| Wholesale Trade | 23 (100.0%) | 0 (0.0%) |
| Retail Trade | 72 (75.0%) | 24 (25.0%) |
| Transportation & Warehousing | 0 (0.0%) | 0 (0.0%) |
| Utilities | 0 (0.0%) | 0 (0.0%) |
| Information | 12 (100.0%) | 0 (0.0%) |
| Finance & Insurance | 0 (0.0%) | 0 (0.0%) |
| Real Estate, Rental & Leasing | 0 (0.0%) | 0 (0.0%) |
| Professional & Scientific | 0 (0.0%) | 24 (100.0%) |
| Enterprise Management | 0 (0.0%) | 0 (0.0%) |
| Administrative & Support | 15 (100.0%) | 0 (0.0%) |
| Educational Services | 19 (20.0%) | 76 (80.0%) |
| Health Care & Social Assistance | 7 (5.7%) | 115 (94.3%) |
| Arts, Entertainment & Recreation | 15 (24.6%) | 46 (75.4%) |
| Accommodation & Food Services | 77 (87.5%) | 11 (12.5%) |
| Public Administration | 31 (60.8%) | 20 (39.2%) |
| Total | 430 (55.8%) | 340 (44.2%) |
Education in Homestead Valley
School Enrollment in Homestead Valley
The most common levels of schooling among the 361 students in Homestead Valley are middle school (78 | 21.6%), college / undergraduate (73 | 20.2%), and elementary school (71 | 19.7%).
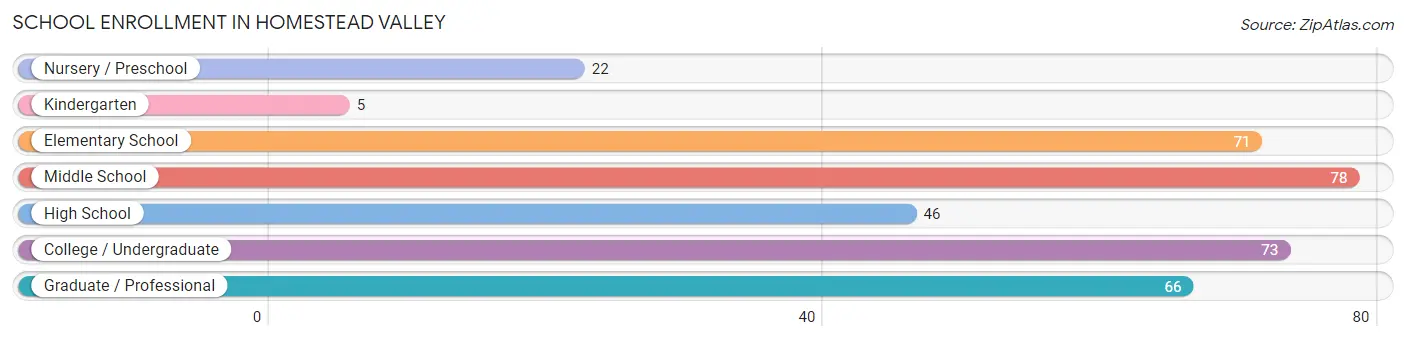
| School Level | # Students | % Students |
| Nursery / Preschool | 22 | 6.1% |
| Kindergarten | 5 | 1.4% |
| Elementary School | 71 | 19.7% |
| Middle School | 78 | 21.6% |
| High School | 46 | 12.7% |
| College / Undergraduate | 73 | 20.2% |
| Graduate / Professional | 66 | 18.3% |
| Total | 361 | 100.0% |
School Enrollment by Age by Funding Source in Homestead Valley
Out of a total of 361 students who are enrolled in schools in Homestead Valley, 56 (15.5%) attend a private institution, while the remaining 305 (84.5%) are enrolled in public schools. The age group of 25 to 34 year olds has the highest likelihood of being enrolled in private schools, with 17 (63.0% in the age bracket) enrolled. Conversely, the age group of 3 to 4 year olds has the lowest likelihood of being enrolled in a private school, with 22 (100.0% in the age bracket) attending a public institution.
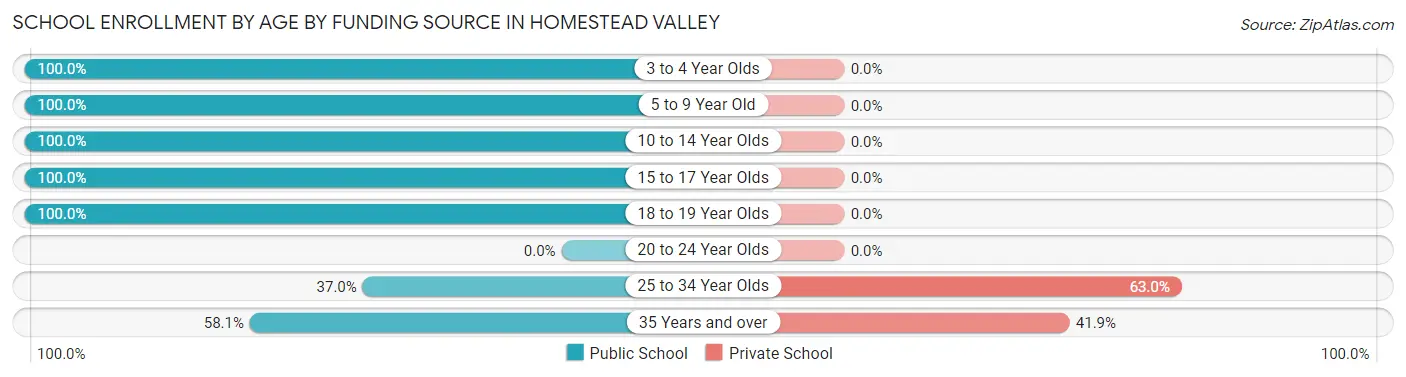
| Age Bracket | Public School | Private School |
| 3 to 4 Year Olds | 22 (100.0%) | 0 (0.0%) |
| 5 to 9 Year Old | 87 (100.0%) | 0 (0.0%) |
| 10 to 14 Year Olds | 65 (100.0%) | 0 (0.0%) |
| 15 to 17 Year Olds | 38 (100.0%) | 0 (0.0%) |
| 18 to 19 Year Olds | 29 (100.0%) | 0 (0.0%) |
| 20 to 24 Year Olds | 0 (0.0%) | 0 (0.0%) |
| 25 to 34 Year Olds | 10 (37.0%) | 17 (63.0%) |
| 35 Years and over | 54 (58.1%) | 39 (41.9%) |
| Total | 305 (84.5%) | 56 (15.5%) |
Educational Attainment by Field of Study in Homestead Valley
Science & technology (132 | 28.5%), visual & performing arts (66 | 14.2%), bio, nature & agricultural (47 | 10.2%), literature & languages (47 | 10.2%), and social sciences (36 | 7.8%) are the most common fields of study among 463 individuals in Homestead Valley who have obtained a bachelor's degree or higher.
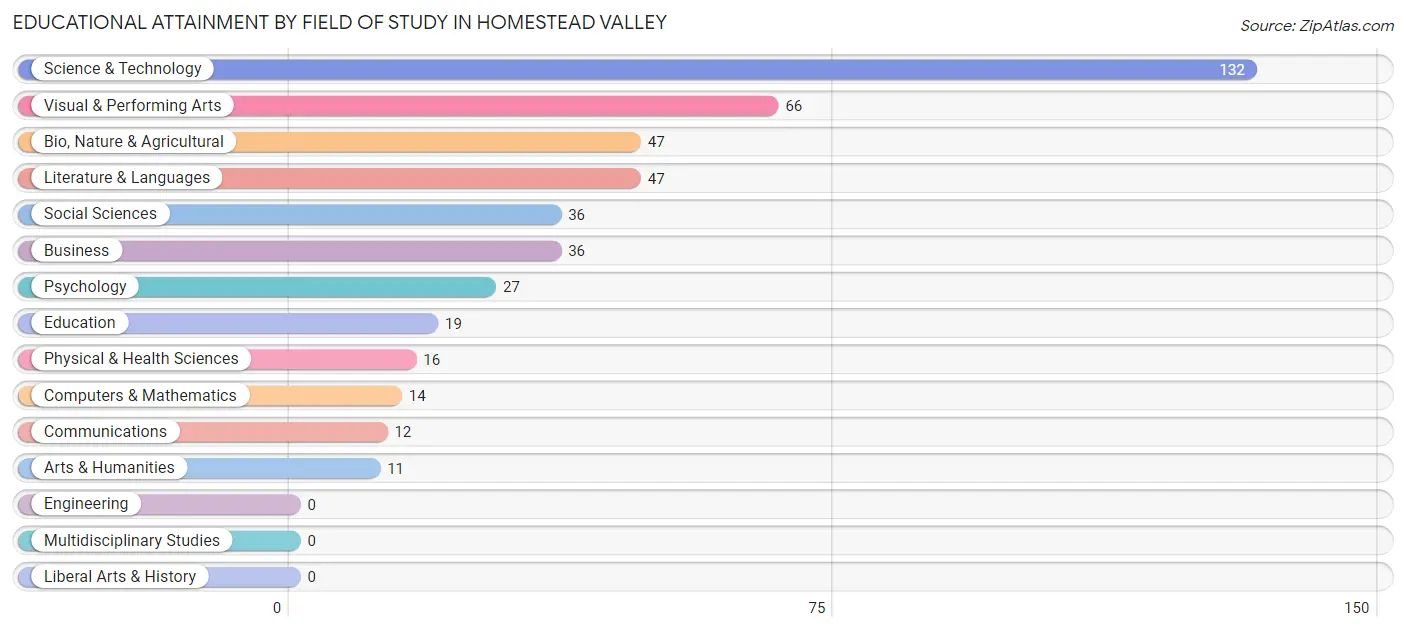
| Field of Study | # Graduates | % Graduates |
| Computers & Mathematics | 14 | 3.0% |
| Bio, Nature & Agricultural | 47 | 10.2% |
| Physical & Health Sciences | 16 | 3.5% |
| Psychology | 27 | 5.8% |
| Social Sciences | 36 | 7.8% |
| Engineering | 0 | 0.0% |
| Multidisciplinary Studies | 0 | 0.0% |
| Science & Technology | 132 | 28.5% |
| Business | 36 | 7.8% |
| Education | 19 | 4.1% |
| Literature & Languages | 47 | 10.2% |
| Liberal Arts & History | 0 | 0.0% |
| Visual & Performing Arts | 66 | 14.2% |
| Communications | 12 | 2.6% |
| Arts & Humanities | 11 | 2.4% |
| Total | 463 | 100.0% |
Transportation & Commute in Homestead Valley
Vehicle Availability by Sex in Homestead Valley
The most prevalent vehicle ownership categories in Homestead Valley are males with 2 vehicles (190, accounting for 44.2%) and females with 2 vehicles (56, making up 55.9%).
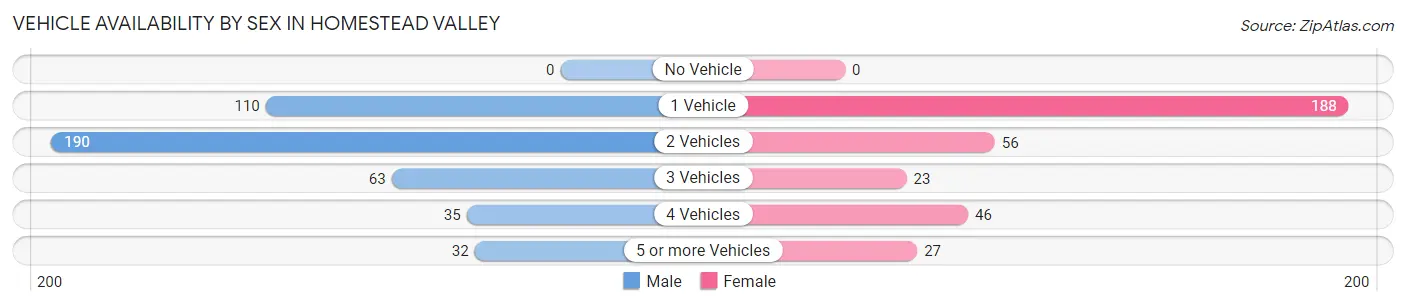
| Vehicles Available | Male | Female |
| No Vehicle | 0 (0.0%) | 0 (0.0%) |
| 1 Vehicle | 110 (25.6%) | 188 (55.3%) |
| 2 Vehicles | 190 (44.2%) | 56 (16.5%) |
| 3 Vehicles | 63 (14.6%) | 23 (6.8%) |
| 4 Vehicles | 35 (8.1%) | 46 (13.5%) |
| 5 or more Vehicles | 32 (7.4%) | 27 (7.9%) |
| Total | 430 (100.0%) | 340 (100.0%) |
Commute Time in Homestead Valley
The most frequently occuring commute durations in Homestead Valley are 45 to 59 minutes (132 commuters, 21.4%), less than 5 minutes (113 commuters, 18.3%), and 20 to 24 minutes (78 commuters, 12.6%).
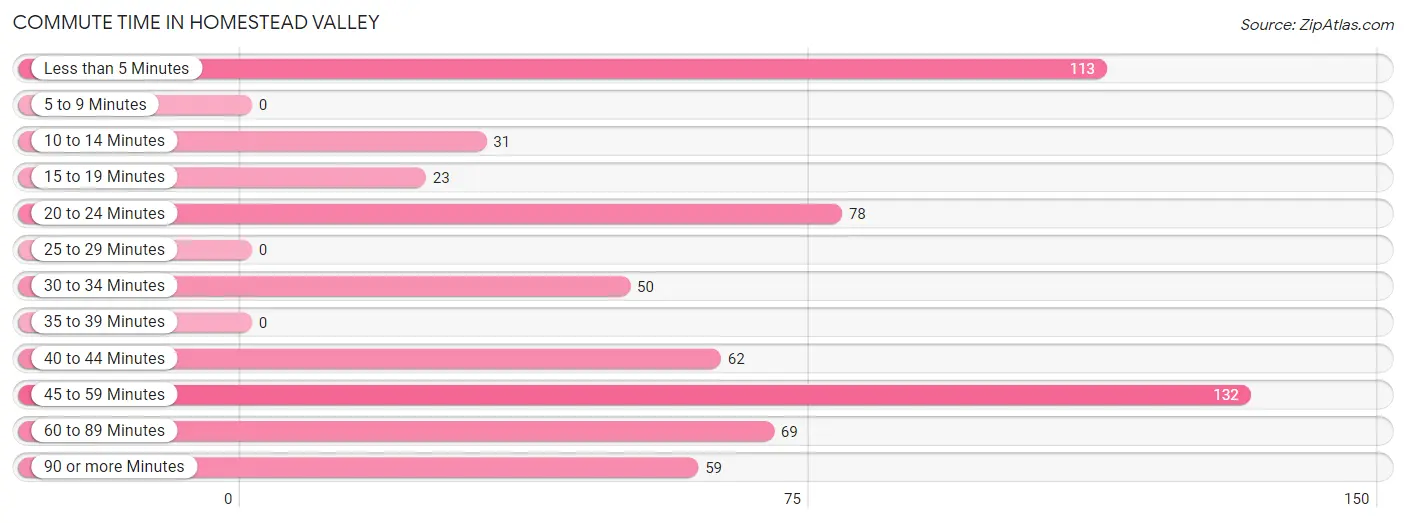
| Commute Time | # Commuters | % Commuters |
| Less than 5 Minutes | 113 | 18.3% |
| 5 to 9 Minutes | 0 | 0.0% |
| 10 to 14 Minutes | 31 | 5.0% |
| 15 to 19 Minutes | 23 | 3.7% |
| 20 to 24 Minutes | 78 | 12.6% |
| 25 to 29 Minutes | 0 | 0.0% |
| 30 to 34 Minutes | 50 | 8.1% |
| 35 to 39 Minutes | 0 | 0.0% |
| 40 to 44 Minutes | 62 | 10.1% |
| 45 to 59 Minutes | 132 | 21.4% |
| 60 to 89 Minutes | 69 | 11.2% |
| 90 or more Minutes | 59 | 9.6% |
Commute Time by Sex in Homestead Valley
The most common commute times in Homestead Valley are 45 to 59 minutes (101 commuters, 26.6%) for males and 40 to 44 minutes (62 commuters, 26.2%) for females.
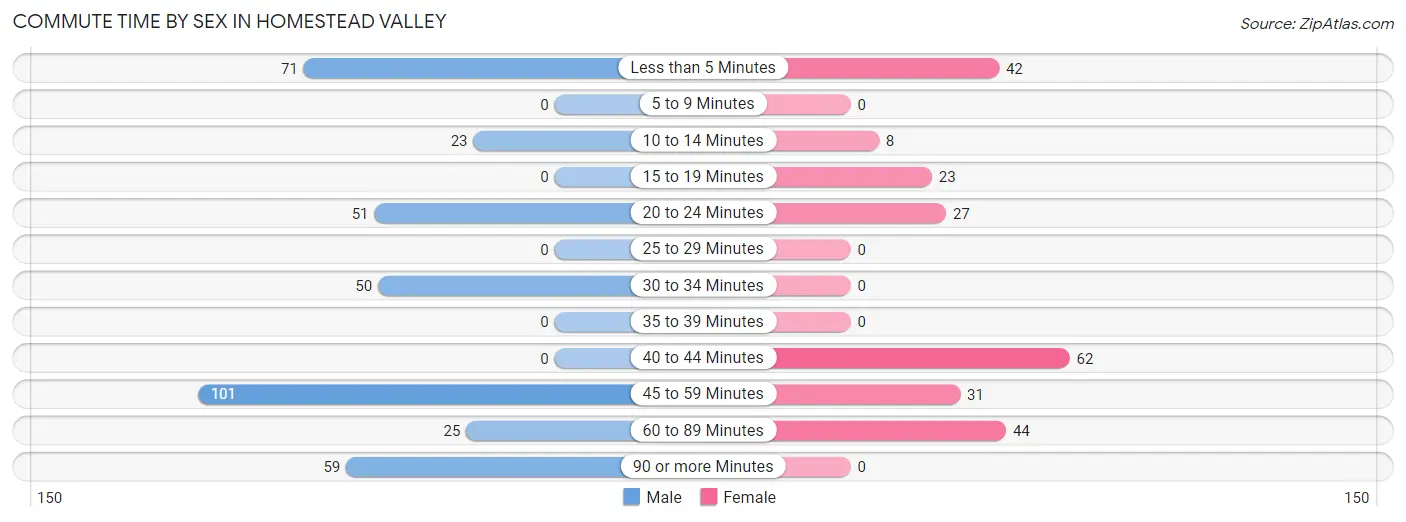
| Commute Time | Male | Female |
| Less than 5 Minutes | 71 (18.7%) | 42 (17.7%) |
| 5 to 9 Minutes | 0 (0.0%) | 0 (0.0%) |
| 10 to 14 Minutes | 23 (6.0%) | 8 (3.4%) |
| 15 to 19 Minutes | 0 (0.0%) | 23 (9.7%) |
| 20 to 24 Minutes | 51 (13.4%) | 27 (11.4%) |
| 25 to 29 Minutes | 0 (0.0%) | 0 (0.0%) |
| 30 to 34 Minutes | 50 (13.2%) | 0 (0.0%) |
| 35 to 39 Minutes | 0 (0.0%) | 0 (0.0%) |
| 40 to 44 Minutes | 0 (0.0%) | 62 (26.2%) |
| 45 to 59 Minutes | 101 (26.6%) | 31 (13.1%) |
| 60 to 89 Minutes | 25 (6.6%) | 44 (18.6%) |
| 90 or more Minutes | 59 (15.5%) | 0 (0.0%) |
Time of Departure to Work by Sex in Homestead Valley
The most frequent times of departure to work in Homestead Valley are 12:00 PM to 3:59 PM (61, 16.1%) for males and 6:00 AM to 6:29 AM (61, 25.7%) for females.
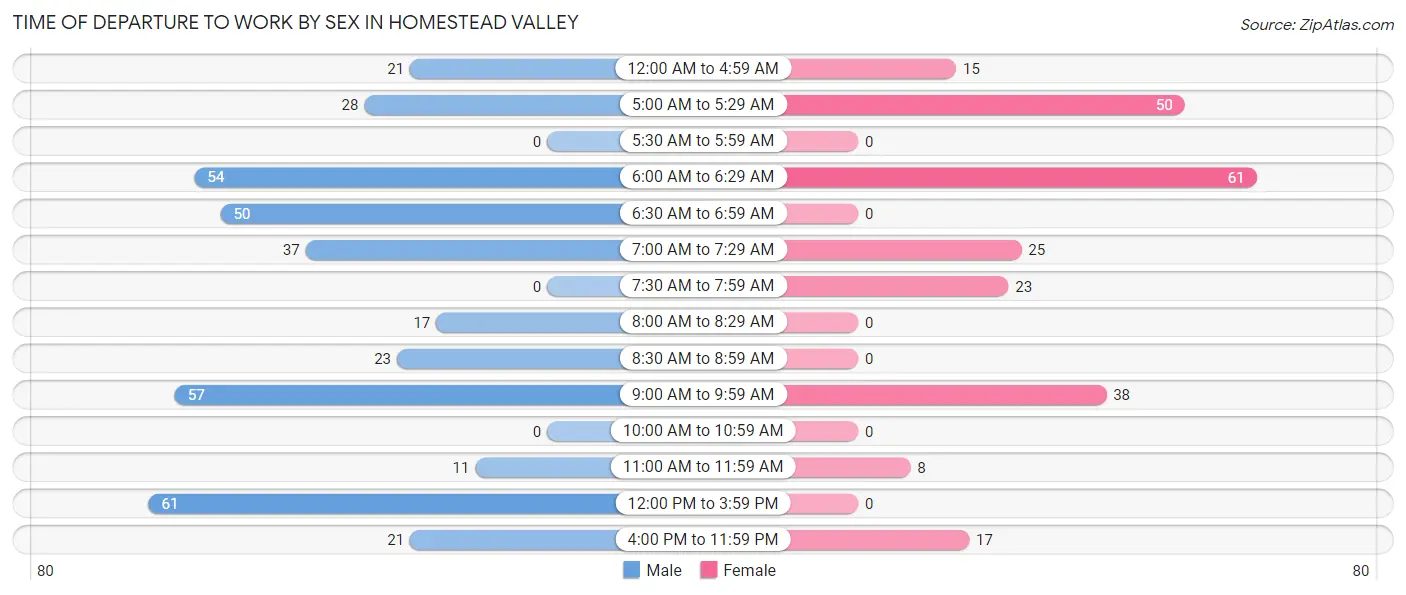
| Time of Departure | Male | Female |
| 12:00 AM to 4:59 AM | 21 (5.5%) | 15 (6.3%) |
| 5:00 AM to 5:29 AM | 28 (7.4%) | 50 (21.1%) |
| 5:30 AM to 5:59 AM | 0 (0.0%) | 0 (0.0%) |
| 6:00 AM to 6:29 AM | 54 (14.2%) | 61 (25.7%) |
| 6:30 AM to 6:59 AM | 50 (13.2%) | 0 (0.0%) |
| 7:00 AM to 7:29 AM | 37 (9.7%) | 25 (10.5%) |
| 7:30 AM to 7:59 AM | 0 (0.0%) | 23 (9.7%) |
| 8:00 AM to 8:29 AM | 17 (4.5%) | 0 (0.0%) |
| 8:30 AM to 8:59 AM | 23 (6.0%) | 0 (0.0%) |
| 9:00 AM to 9:59 AM | 57 (15.0%) | 38 (16.0%) |
| 10:00 AM to 10:59 AM | 0 (0.0%) | 0 (0.0%) |
| 11:00 AM to 11:59 AM | 11 (2.9%) | 8 (3.4%) |
| 12:00 PM to 3:59 PM | 61 (16.1%) | 0 (0.0%) |
| 4:00 PM to 11:59 PM | 21 (5.5%) | 17 (7.2%) |
| Total | 380 (100.0%) | 237 (100.0%) |
Housing Occupancy in Homestead Valley
Occupancy by Ownership in Homestead Valley
Of the total 1,241 dwellings in Homestead Valley, owner-occupied units account for 1,021 (82.3%), while renter-occupied units make up 220 (17.7%).
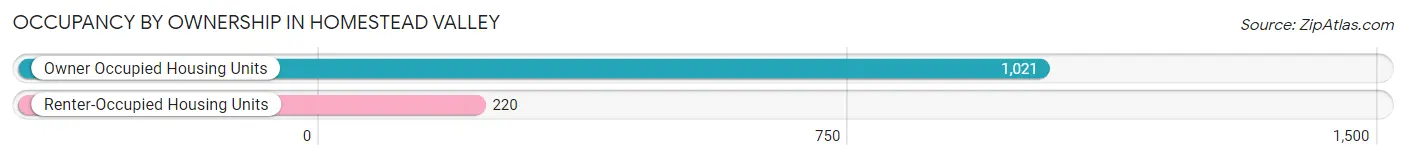
| Occupancy | # Housing Units | % Housing Units |
| Owner Occupied Housing Units | 1,021 | 82.3% |
| Renter-Occupied Housing Units | 220 | 17.7% |
| Total Occupied Housing Units | 1,241 | 100.0% |
Occupancy by Household Size in Homestead Valley
| Household Size | # Housing Units | % Housing Units |
| 1-Person Household | 507 | 40.8% |
| 2-Person Household | 405 | 32.6% |
| 3-Person Household | 179 | 14.4% |
| 4+ Person Household | 150 | 12.1% |
| Total Housing Units | 1,241 | 100.0% |
Occupancy by Ownership by Household Size in Homestead Valley
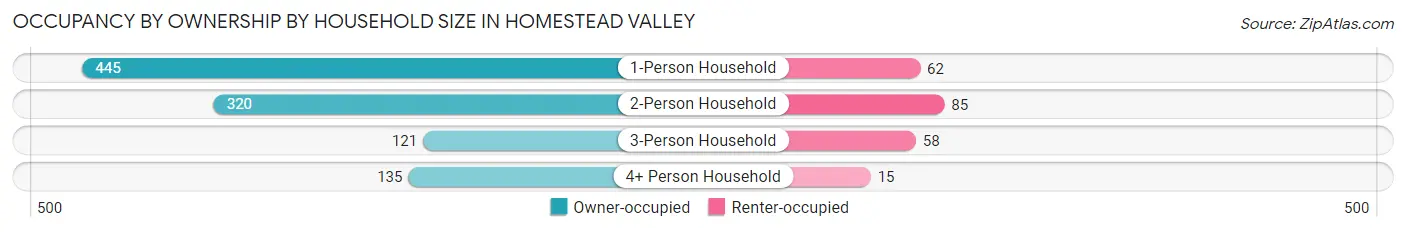
| Household Size | Owner-occupied | Renter-occupied |
| 1-Person Household | 445 (87.8%) | 62 (12.2%) |
| 2-Person Household | 320 (79.0%) | 85 (21.0%) |
| 3-Person Household | 121 (67.6%) | 58 (32.4%) |
| 4+ Person Household | 135 (90.0%) | 15 (10.0%) |
| Total Housing Units | 1,021 (82.3%) | 220 (17.7%) |
Occupancy by Educational Attainment in Homestead Valley
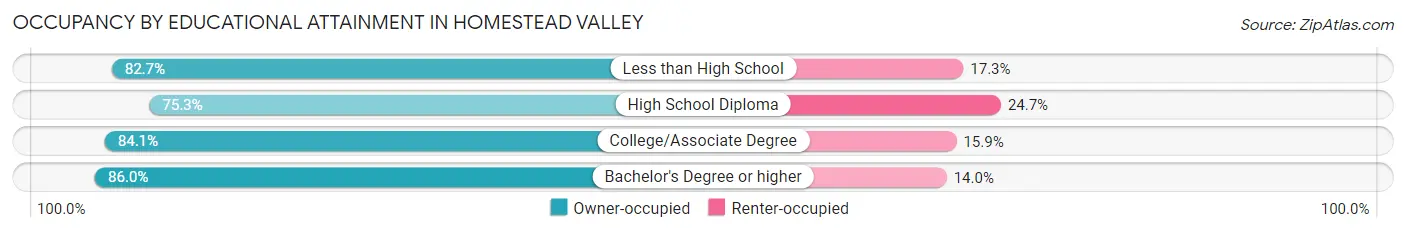
| Household Size | Owner-occupied | Renter-occupied |
| Less than High School | 110 (82.7%) | 23 (17.3%) |
| High School Diploma | 216 (75.3%) | 71 (24.7%) |
| College/Associate Degree | 486 (84.1%) | 92 (15.9%) |
| Bachelor's Degree or higher | 209 (86.0%) | 34 (14.0%) |
Occupancy by Age of Householder in Homestead Valley
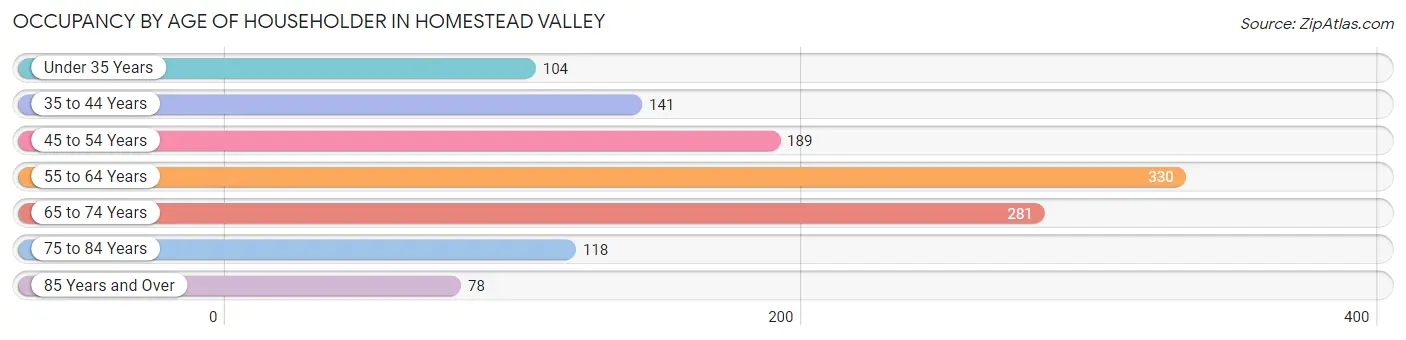
| Age Bracket | # Households | % Households |
| Under 35 Years | 104 | 8.4% |
| 35 to 44 Years | 141 | 11.4% |
| 45 to 54 Years | 189 | 15.2% |
| 55 to 64 Years | 330 | 26.6% |
| 65 to 74 Years | 281 | 22.6% |
| 75 to 84 Years | 118 | 9.5% |
| 85 Years and Over | 78 | 6.3% |
| Total | 1,241 | 100.0% |
Housing Finances in Homestead Valley
Median Income by Occupancy in Homestead Valley
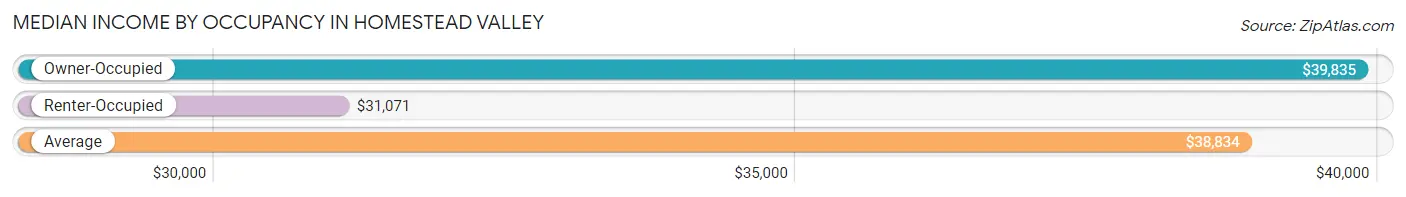
| Occupancy Type | # Households | Median Income |
| Owner-Occupied | 1,021 (82.3%) | $39,835 |
| Renter-Occupied | 220 (17.7%) | $31,071 |
| Average | 1,241 (100.0%) | $38,834 |
Occupancy by Householder Income Bracket in Homestead Valley
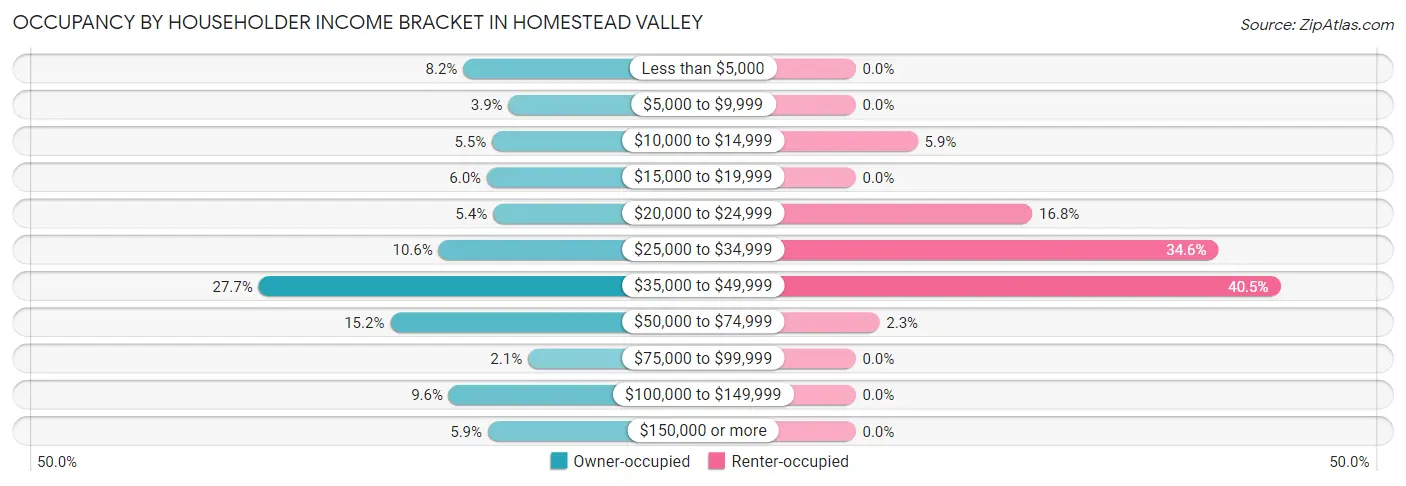
| Income Bracket | Owner-occupied | Renter-occupied |
| Less than $5,000 | 84 (8.2%) | 0 (0.0%) |
| $5,000 to $9,999 | 40 (3.9%) | 0 (0.0%) |
| $10,000 to $14,999 | 56 (5.5%) | 13 (5.9%) |
| $15,000 to $19,999 | 61 (6.0%) | 0 (0.0%) |
| $20,000 to $24,999 | 55 (5.4%) | 37 (16.8%) |
| $25,000 to $34,999 | 108 (10.6%) | 76 (34.5%) |
| $35,000 to $49,999 | 283 (27.7%) | 89 (40.5%) |
| $50,000 to $74,999 | 155 (15.2%) | 5 (2.3%) |
| $75,000 to $99,999 | 21 (2.1%) | 0 (0.0%) |
| $100,000 to $149,999 | 98 (9.6%) | 0 (0.0%) |
| $150,000 or more | 60 (5.9%) | 0 (0.0%) |
| Total | 1,021 (100.0%) | 220 (100.0%) |
Monthly Housing Cost Tiers in Homestead Valley
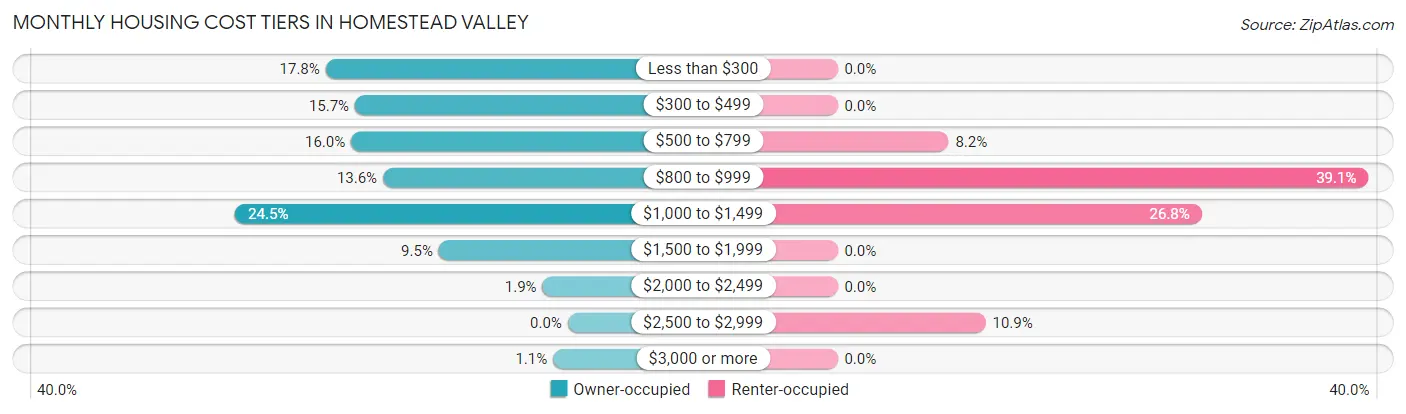
| Monthly Cost | Owner-occupied | Renter-occupied |
| Less than $300 | 182 (17.8%) | 0 (0.0%) |
| $300 to $499 | 160 (15.7%) | 0 (0.0%) |
| $500 to $799 | 163 (16.0%) | 18 (8.2%) |
| $800 to $999 | 139 (13.6%) | 86 (39.1%) |
| $1,000 to $1,499 | 250 (24.5%) | 59 (26.8%) |
| $1,500 to $1,999 | 97 (9.5%) | 0 (0.0%) |
| $2,000 to $2,499 | 19 (1.9%) | 0 (0.0%) |
| $2,500 to $2,999 | 0 (0.0%) | 24 (10.9%) |
| $3,000 or more | 11 (1.1%) | 0 (0.0%) |
| Total | 1,021 (100.0%) | 220 (100.0%) |
Physical Housing Characteristics in Homestead Valley
Housing Structures in Homestead Valley
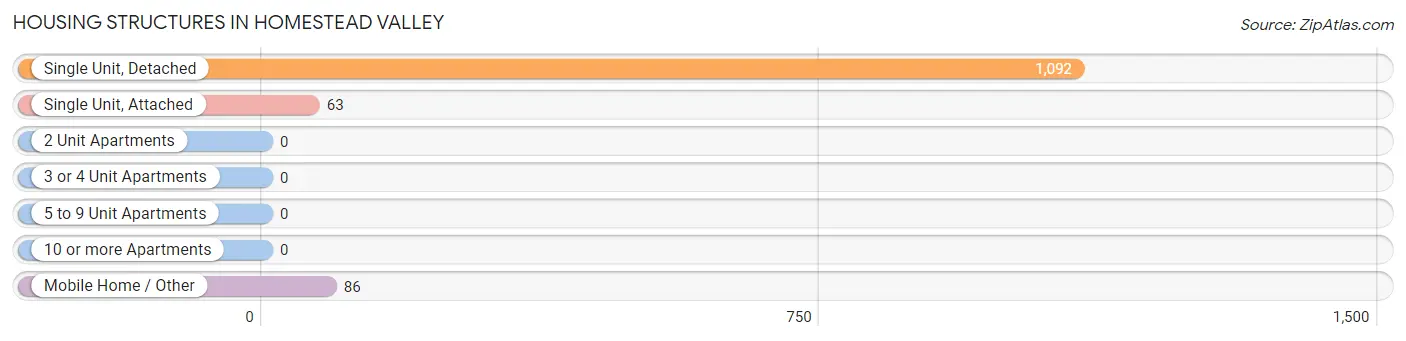
| Structure Type | # Housing Units | % Housing Units |
| Single Unit, Detached | 1,092 | 88.0% |
| Single Unit, Attached | 63 | 5.1% |
| 2 Unit Apartments | 0 | 0.0% |
| 3 or 4 Unit Apartments | 0 | 0.0% |
| 5 to 9 Unit Apartments | 0 | 0.0% |
| 10 or more Apartments | 0 | 0.0% |
| Mobile Home / Other | 86 | 6.9% |
| Total | 1,241 | 100.0% |
Housing Structures by Occupancy in Homestead Valley
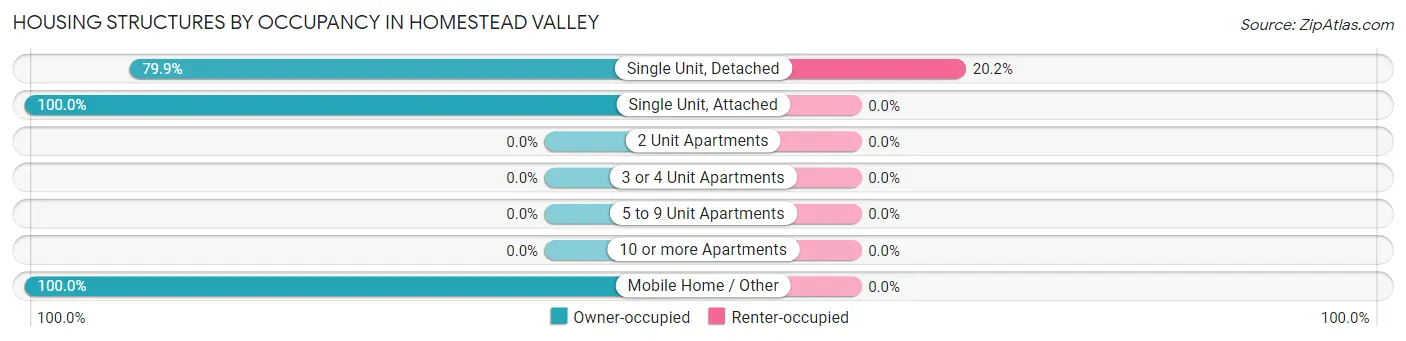
| Structure Type | Owner-occupied | Renter-occupied |
| Single Unit, Detached | 872 (79.8%) | 220 (20.2%) |
| Single Unit, Attached | 63 (100.0%) | 0 (0.0%) |
| 2 Unit Apartments | 0 (0.0%) | 0 (0.0%) |
| 3 or 4 Unit Apartments | 0 (0.0%) | 0 (0.0%) |
| 5 to 9 Unit Apartments | 0 (0.0%) | 0 (0.0%) |
| 10 or more Apartments | 0 (0.0%) | 0 (0.0%) |
| Mobile Home / Other | 86 (100.0%) | 0 (0.0%) |
| Total | 1,021 (82.3%) | 220 (17.7%) |
Housing Structures by Number of Rooms in Homestead Valley
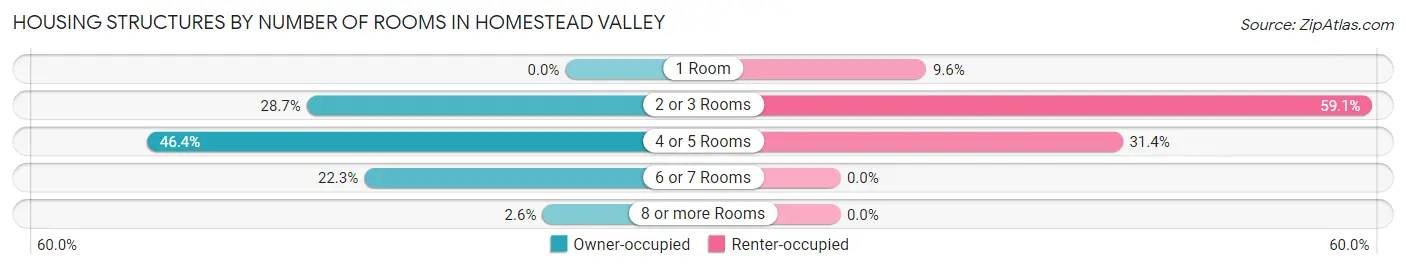
| Number of Rooms | Owner-occupied | Renter-occupied |
| 1 Room | 0 (0.0%) | 21 (9.6%) |
| 2 or 3 Rooms | 293 (28.7%) | 130 (59.1%) |
| 4 or 5 Rooms | 474 (46.4%) | 69 (31.4%) |
| 6 or 7 Rooms | 228 (22.3%) | 0 (0.0%) |
| 8 or more Rooms | 26 (2.5%) | 0 (0.0%) |
| Total | 1,021 (100.0%) | 220 (100.0%) |
Housing Structure by Heating Type in Homestead Valley
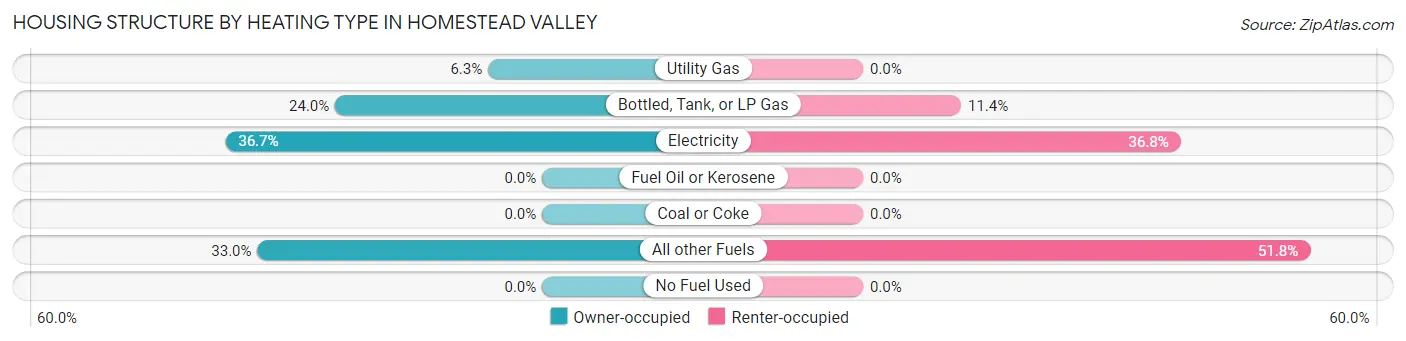
| Heating Type | Owner-occupied | Renter-occupied |
| Utility Gas | 64 (6.3%) | 0 (0.0%) |
| Bottled, Tank, or LP Gas | 245 (24.0%) | 25 (11.4%) |
| Electricity | 375 (36.7%) | 81 (36.8%) |
| Fuel Oil or Kerosene | 0 (0.0%) | 0 (0.0%) |
| Coal or Coke | 0 (0.0%) | 0 (0.0%) |
| All other Fuels | 337 (33.0%) | 114 (51.8%) |
| No Fuel Used | 0 (0.0%) | 0 (0.0%) |
| Total | 1,021 (100.0%) | 220 (100.0%) |
Household Vehicle Usage in Homestead Valley
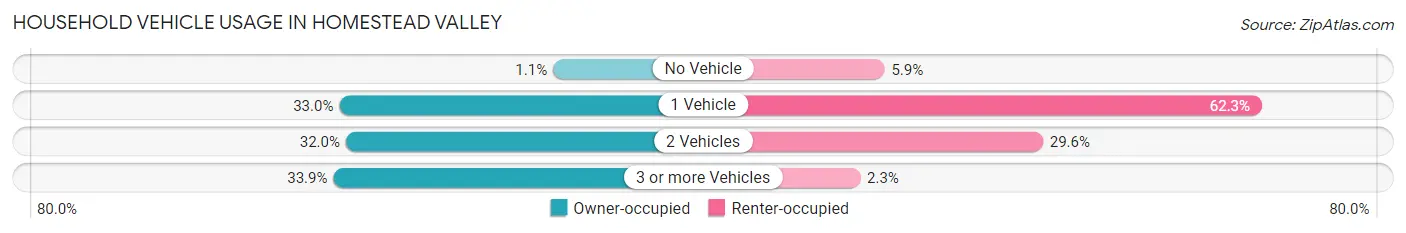
| Vehicles per Household | Owner-occupied | Renter-occupied |
| No Vehicle | 11 (1.1%) | 13 (5.9%) |
| 1 Vehicle | 337 (33.0%) | 137 (62.3%) |
| 2 Vehicles | 327 (32.0%) | 65 (29.5%) |
| 3 or more Vehicles | 346 (33.9%) | 5 (2.3%) |
| Total | 1,021 (100.0%) | 220 (100.0%) |
Real Estate & Mortgages in Homestead Valley
Real Estate and Mortgage Overview in Homestead Valley
| Characteristic | Without Mortgage | With Mortgage |
| Housing Units | 575 | 446 |
| Median Property Value | $188,400 | $184,200 |
| Median Household Income | $39,805 | $11 |
| Monthly Housing Costs | $437 | $11 |
| Real Estate Taxes | $1,208 | $0 |
Property Value by Mortgage Status in Homestead Valley
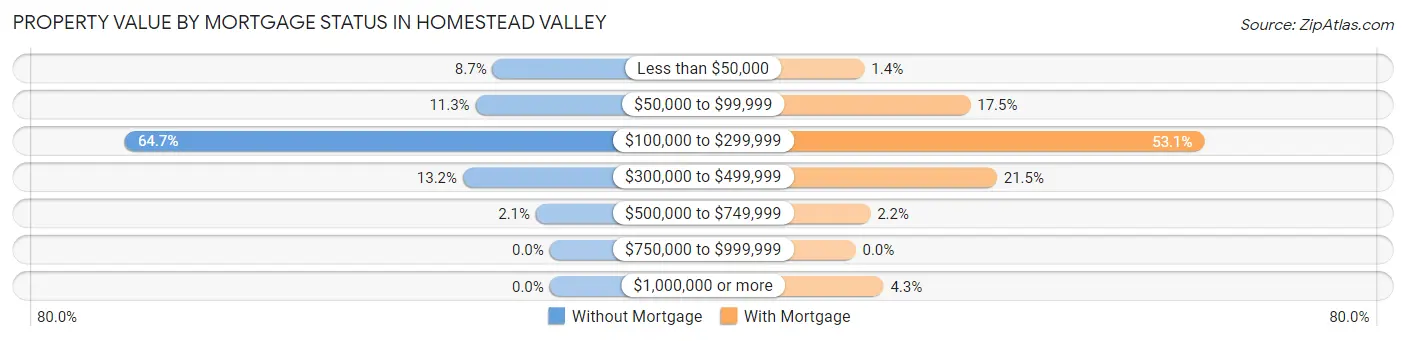
| Property Value | Without Mortgage | With Mortgage |
| Less than $50,000 | 50 (8.7%) | 6 (1.3%) |
| $50,000 to $99,999 | 65 (11.3%) | 78 (17.5%) |
| $100,000 to $299,999 | 372 (64.7%) | 237 (53.1%) |
| $300,000 to $499,999 | 76 (13.2%) | 96 (21.5%) |
| $500,000 to $749,999 | 12 (2.1%) | 10 (2.2%) |
| $750,000 to $999,999 | 0 (0.0%) | 0 (0.0%) |
| $1,000,000 or more | 0 (0.0%) | 19 (4.3%) |
| Total | 575 (100.0%) | 446 (100.0%) |
Household Income by Mortgage Status in Homestead Valley
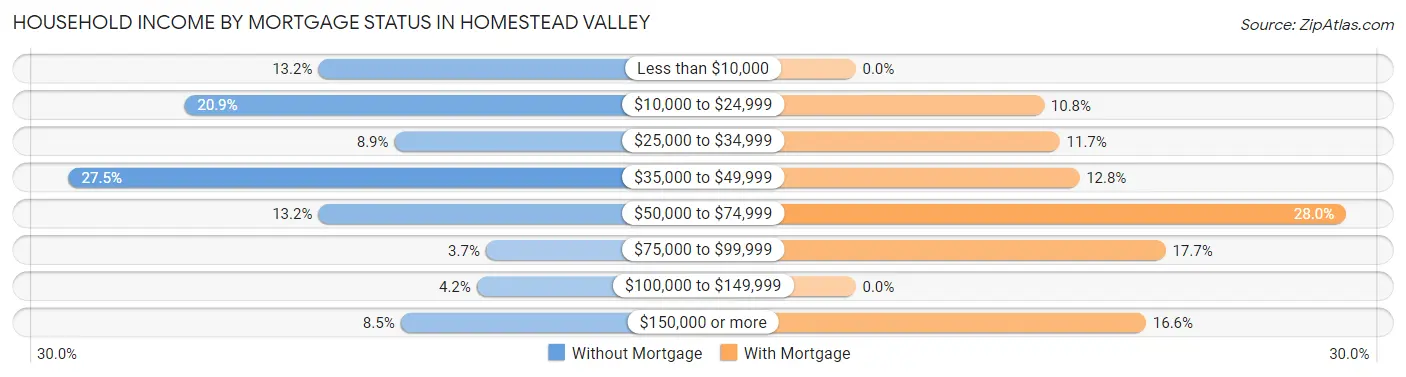
| Household Income | Without Mortgage | With Mortgage |
| Less than $10,000 | 76 (13.2%) | 0 (0.0%) |
| $10,000 to $24,999 | 120 (20.9%) | 48 (10.8%) |
| $25,000 to $34,999 | 51 (8.9%) | 52 (11.7%) |
| $35,000 to $49,999 | 158 (27.5%) | 57 (12.8%) |
| $50,000 to $74,999 | 76 (13.2%) | 125 (28.0%) |
| $75,000 to $99,999 | 21 (3.6%) | 79 (17.7%) |
| $100,000 to $149,999 | 24 (4.2%) | 0 (0.0%) |
| $150,000 or more | 49 (8.5%) | 74 (16.6%) |
| Total | 575 (100.0%) | 446 (100.0%) |
Property Value to Household Income Ratio in Homestead Valley
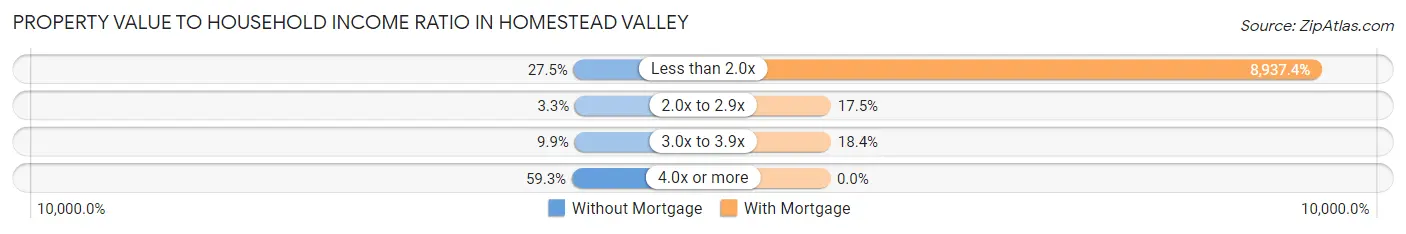
| Value-to-Income Ratio | Without Mortgage | With Mortgage |
| Less than 2.0x | 158 (27.5%) | 39,861 (8,937.4%) |
| 2.0x to 2.9x | 19 (3.3%) | 78 (17.5%) |
| 3.0x to 3.9x | 57 (9.9%) | 82 (18.4%) |
| 4.0x or more | 341 (59.3%) | 0 (0.0%) |
| Total | 575 (100.0%) | 446 (100.0%) |
Real Estate Taxes by Mortgage Status in Homestead Valley
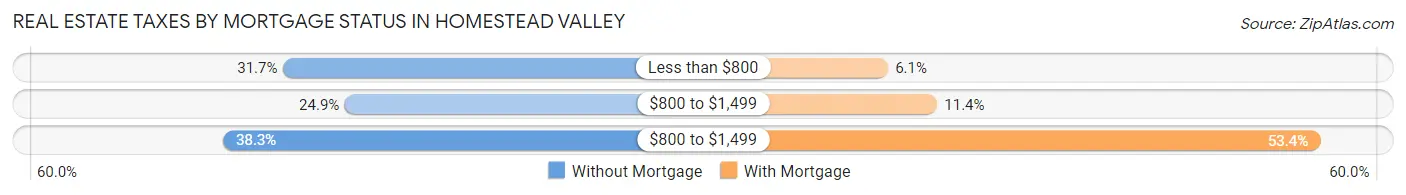
| Property Taxes | Without Mortgage | With Mortgage |
| Less than $800 | 182 (31.7%) | 27 (6.0%) |
| $800 to $1,499 | 143 (24.9%) | 51 (11.4%) |
| $800 to $1,499 | 220 (38.3%) | 238 (53.4%) |
| Total | 575 (100.0%) | 446 (100.0%) |
Health & Disability in Homestead Valley
Health Insurance Coverage by Age in Homestead Valley
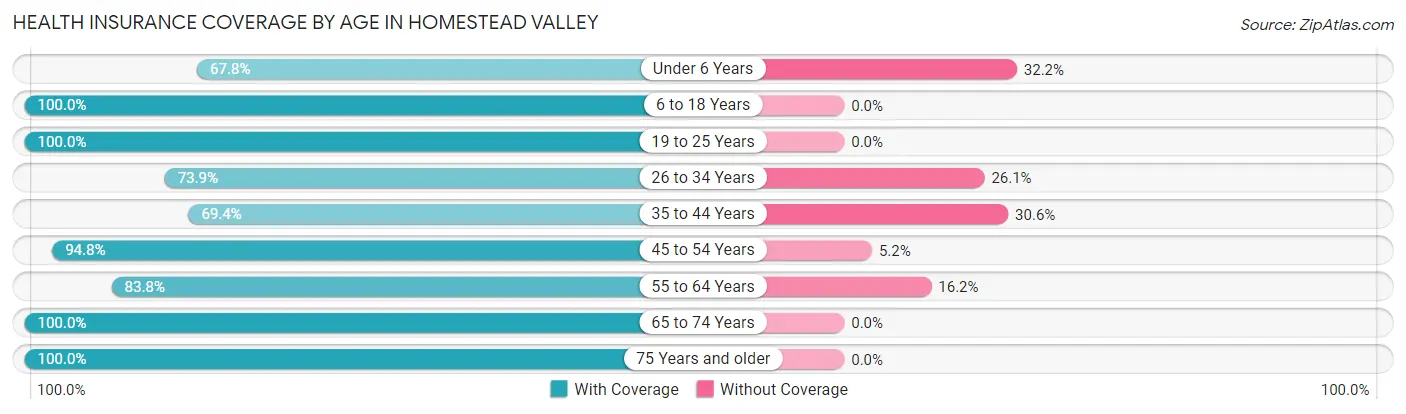
| Age Bracket | With Coverage | Without Coverage |
| Under 6 Years | 59 (67.8%) | 28 (32.2%) |
| 6 to 18 Years | 226 (100.0%) | 0 (0.0%) |
| 19 to 25 Years | 38 (100.0%) | 0 (0.0%) |
| 26 to 34 Years | 195 (73.9%) | 69 (26.1%) |
| 35 to 44 Years | 225 (69.4%) | 99 (30.6%) |
| 45 to 54 Years | 349 (94.8%) | 19 (5.2%) |
| 55 to 64 Years | 413 (83.8%) | 80 (16.2%) |
| 65 to 74 Years | 516 (100.0%) | 0 (0.0%) |
| 75 Years and older | 230 (100.0%) | 0 (0.0%) |
| Total | 2,251 (88.4%) | 295 (11.6%) |
Health Insurance Coverage by Citizenship Status in Homestead Valley
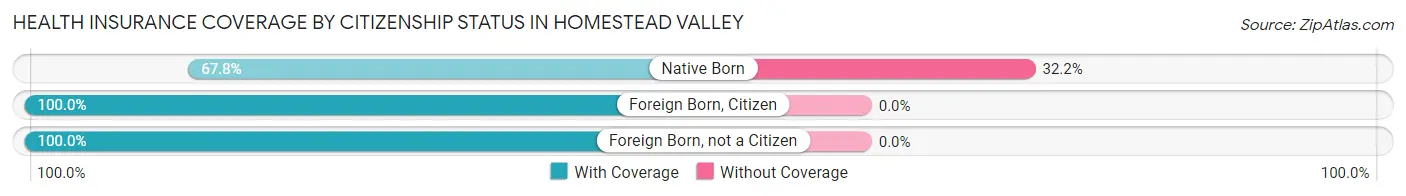
| Citizenship Status | With Coverage | Without Coverage |
| Native Born | 59 (67.8%) | 28 (32.2%) |
| Foreign Born, Citizen | 226 (100.0%) | 0 (0.0%) |
| Foreign Born, not a Citizen | 38 (100.0%) | 0 (0.0%) |
Health Insurance Coverage by Household Income in Homestead Valley
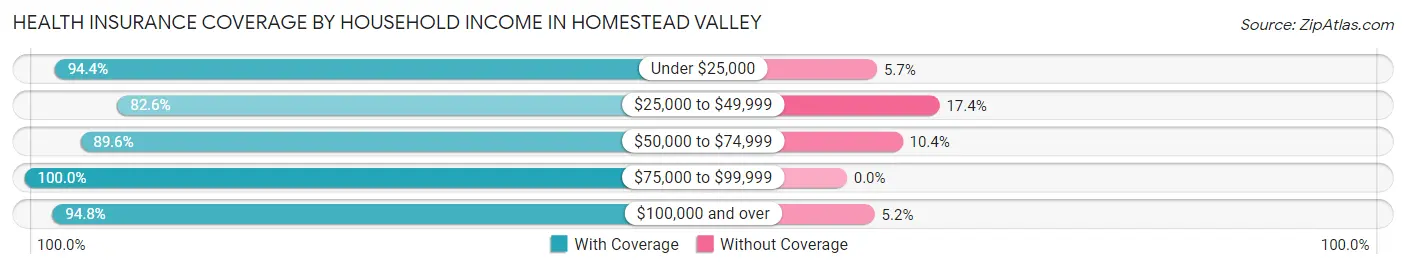
| Household Income | With Coverage | Without Coverage |
| Under $25,000 | 451 (94.4%) | 27 (5.7%) |
| $25,000 to $49,999 | 942 (82.6%) | 198 (17.4%) |
| $50,000 to $74,999 | 429 (89.6%) | 50 (10.4%) |
| $75,000 to $99,999 | 66 (100.0%) | 0 (0.0%) |
| $100,000 and over | 363 (94.8%) | 20 (5.2%) |
Public vs Private Health Insurance Coverage by Age in Homestead Valley
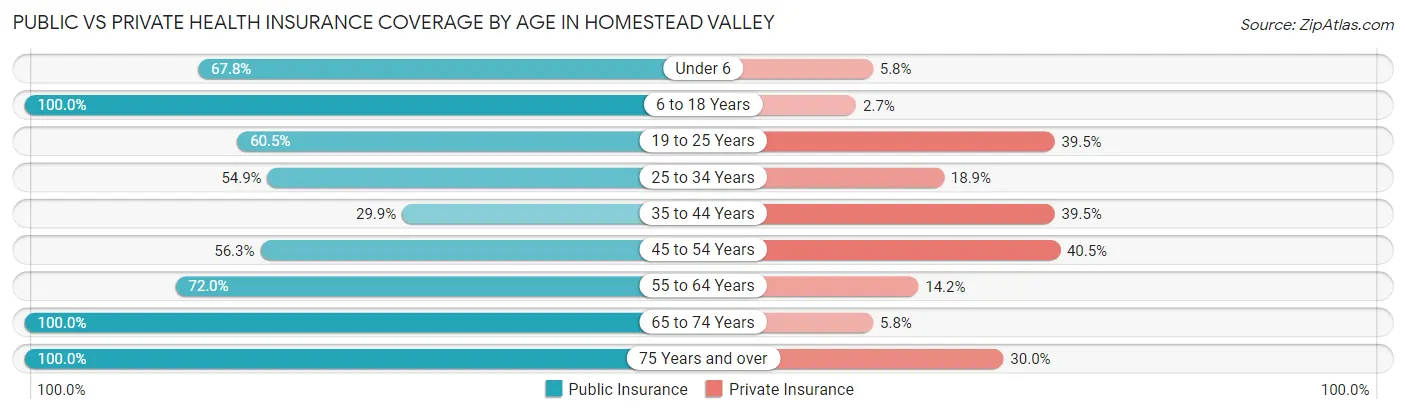
| Age Bracket | Public Insurance | Private Insurance |
| Under 6 | 59 (67.8%) | 5 (5.8%) |
| 6 to 18 Years | 226 (100.0%) | 6 (2.6%) |
| 19 to 25 Years | 23 (60.5%) | 15 (39.5%) |
| 25 to 34 Years | 145 (54.9%) | 50 (18.9%) |
| 35 to 44 Years | 97 (29.9%) | 128 (39.5%) |
| 45 to 54 Years | 207 (56.2%) | 149 (40.5%) |
| 55 to 64 Years | 355 (72.0%) | 70 (14.2%) |
| 65 to 74 Years | 516 (100.0%) | 30 (5.8%) |
| 75 Years and over | 230 (100.0%) | 69 (30.0%) |
| Total | 1,858 (73.0%) | 522 (20.5%) |
Disability Status by Sex by Age in Homestead Valley
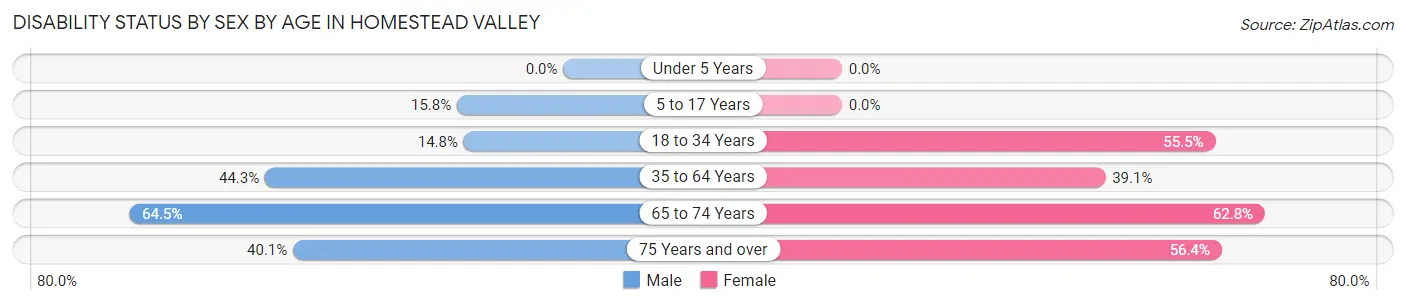
| Age Bracket | Male | Female |
| Under 5 Years | 0 (0.0%) | 0 (0.0%) |
| 5 to 17 Years | 18 (15.8%) | 0 (0.0%) |
| 18 to 34 Years | 30 (14.8%) | 71 (55.5%) |
| 35 to 64 Years | 252 (44.3%) | 241 (39.1%) |
| 65 to 74 Years | 187 (64.5%) | 142 (62.8%) |
| 75 Years and over | 61 (40.1%) | 44 (56.4%) |
Disability Class by Sex by Age in Homestead Valley
Disability Class: Hearing Difficulty
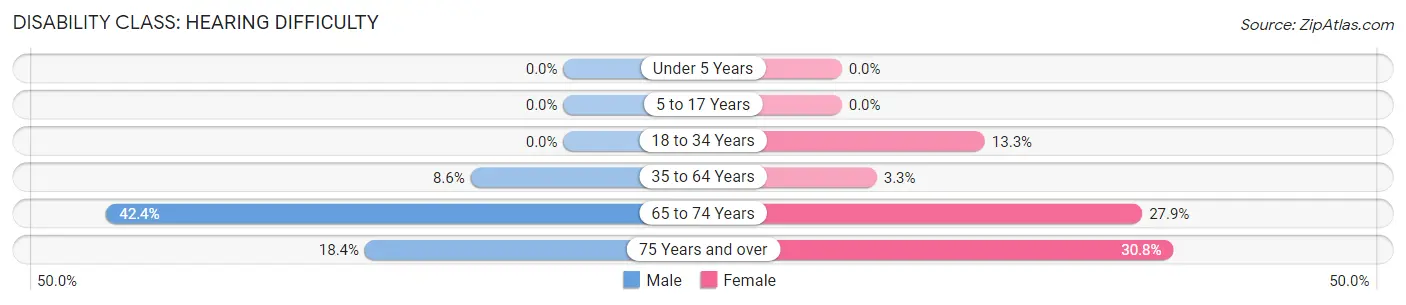
| Age Bracket | Male | Female |
| Under 5 Years | 0 (0.0%) | 0 (0.0%) |
| 5 to 17 Years | 0 (0.0%) | 0 (0.0%) |
| 18 to 34 Years | 0 (0.0%) | 17 (13.3%) |
| 35 to 64 Years | 49 (8.6%) | 20 (3.3%) |
| 65 to 74 Years | 123 (42.4%) | 63 (27.9%) |
| 75 Years and over | 28 (18.4%) | 24 (30.8%) |
Disability Class: Vision Difficulty
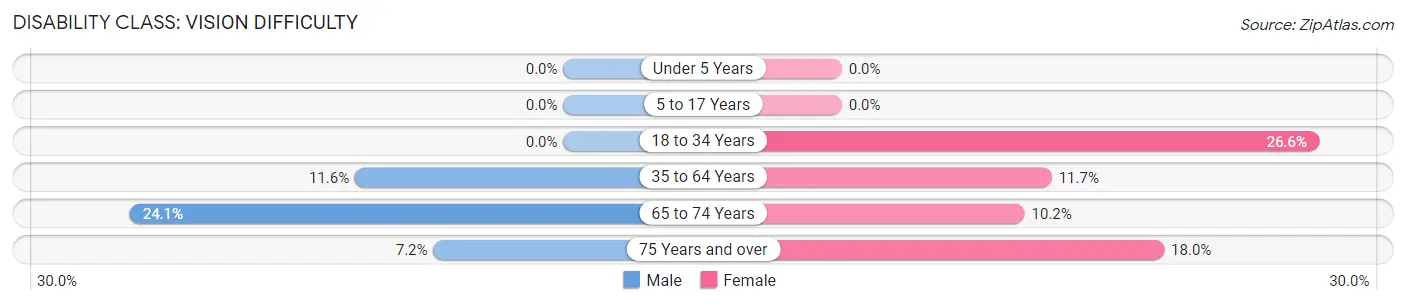
| Age Bracket | Male | Female |
| Under 5 Years | 0 (0.0%) | 0 (0.0%) |
| 5 to 17 Years | 0 (0.0%) | 0 (0.0%) |
| 18 to 34 Years | 0 (0.0%) | 34 (26.6%) |
| 35 to 64 Years | 66 (11.6%) | 72 (11.7%) |
| 65 to 74 Years | 70 (24.1%) | 23 (10.2%) |
| 75 Years and over | 11 (7.2%) | 14 (17.9%) |
Disability Class: Cognitive Difficulty
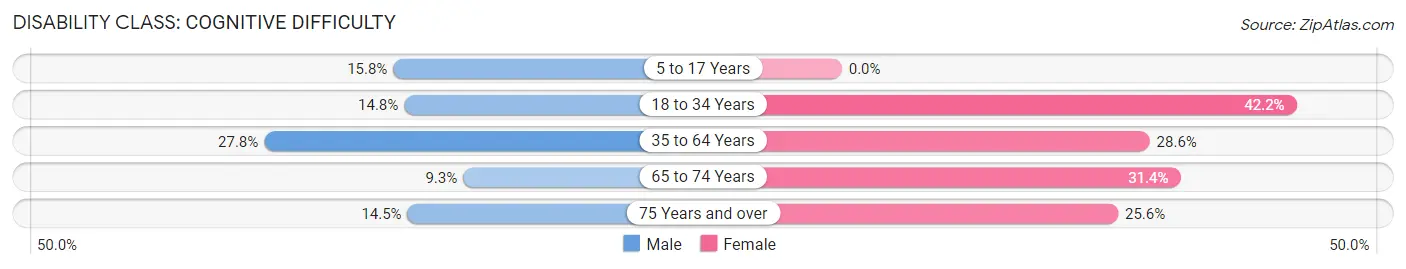
| Age Bracket | Male | Female |
| 5 to 17 Years | 18 (15.8%) | 0 (0.0%) |
| 18 to 34 Years | 30 (14.8%) | 54 (42.2%) |
| 35 to 64 Years | 158 (27.8%) | 176 (28.6%) |
| 65 to 74 Years | 27 (9.3%) | 71 (31.4%) |
| 75 Years and over | 22 (14.5%) | 20 (25.6%) |
Disability Class: Ambulatory Difficulty
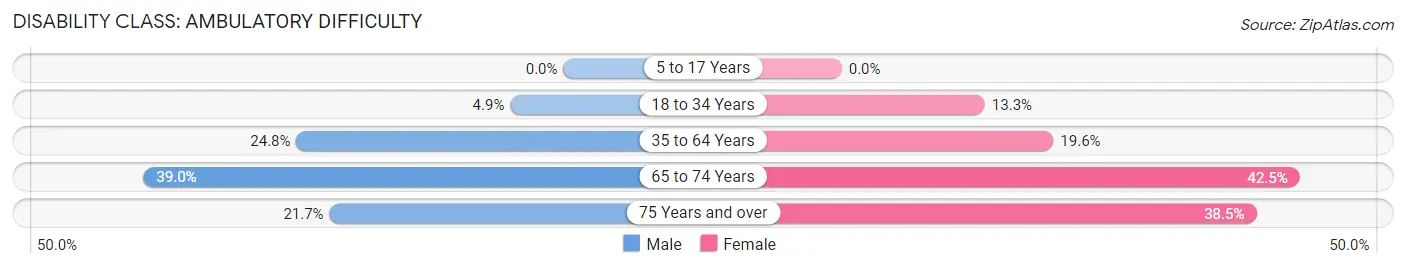
| Age Bracket | Male | Female |
| 5 to 17 Years | 0 (0.0%) | 0 (0.0%) |
| 18 to 34 Years | 10 (4.9%) | 17 (13.3%) |
| 35 to 64 Years | 141 (24.8%) | 121 (19.6%) |
| 65 to 74 Years | 113 (39.0%) | 96 (42.5%) |
| 75 Years and over | 33 (21.7%) | 30 (38.5%) |
Disability Class: Self-Care Difficulty
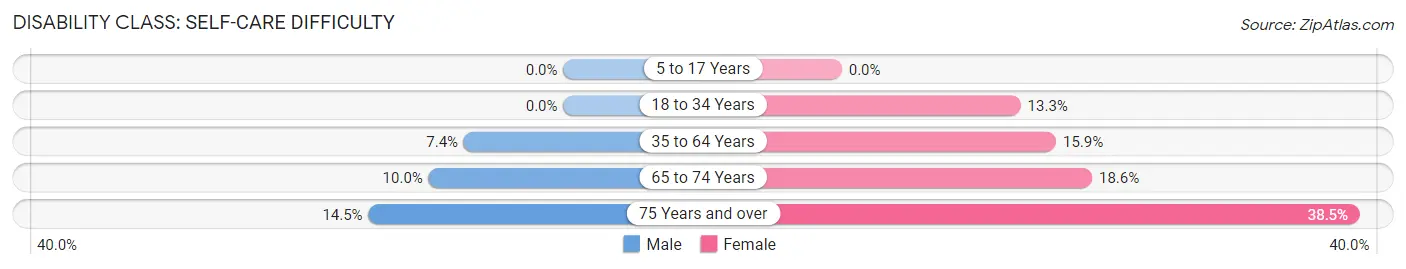
| Age Bracket | Male | Female |
| 5 to 17 Years | 0 (0.0%) | 0 (0.0%) |
| 18 to 34 Years | 0 (0.0%) | 17 (13.3%) |
| 35 to 64 Years | 42 (7.4%) | 98 (15.9%) |
| 65 to 74 Years | 29 (10.0%) | 42 (18.6%) |
| 75 Years and over | 22 (14.5%) | 30 (38.5%) |
Technology Access in Homestead Valley
Computing Device Access in Homestead Valley
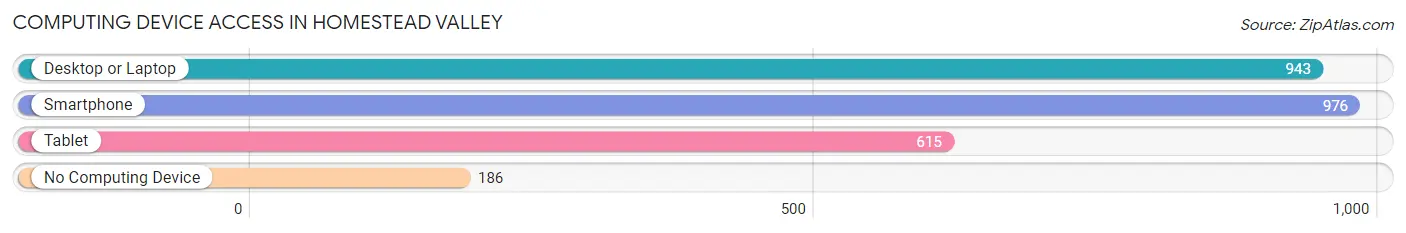
| Device Type | # Households | % Households |
| Desktop or Laptop | 943 | 76.0% |
| Smartphone | 976 | 78.6% |
| Tablet | 615 | 49.6% |
| No Computing Device | 186 | 15.0% |
| Total | 1,241 | 100.0% |
Internet Access in Homestead Valley
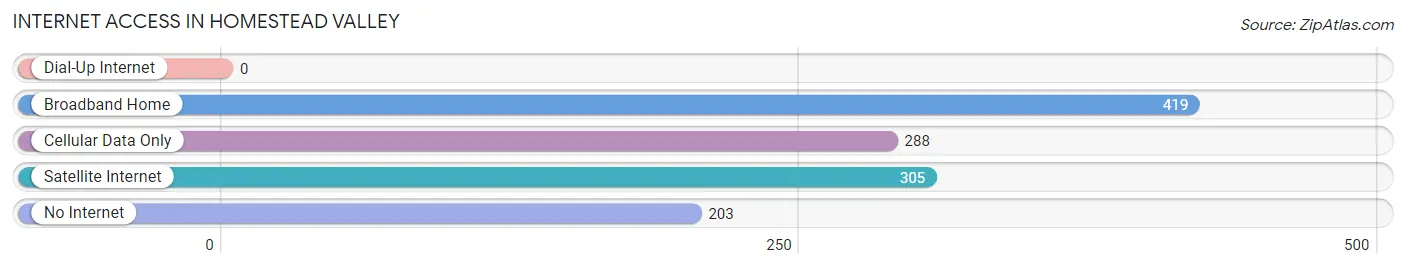
| Internet Type | # Households | % Households |
| Dial-Up Internet | 0 | 0.0% |
| Broadband Home | 419 | 33.8% |
| Cellular Data Only | 288 | 23.2% |
| Satellite Internet | 305 | 24.6% |
| No Internet | 203 | 16.4% |
| Total | 1,241 | 100.0% |
Homestead Valley Summary
Homestead Valley is a small unincorporated community located in the foothills of the Santa Cruz Mountains in Marin County, California. It is situated between the towns of Mill Valley and Fairfax, and is home to a population of approximately 1,000 people. The area is known for its rural atmosphere and stunning views of the surrounding hills and valleys.
History
The area now known as Homestead Valley was originally inhabited by the Coast Miwok Native American tribe. The first European settlers arrived in the area in the mid-1800s, and the area was eventually named after a homesteader who settled in the area in the late 1800s. The area was primarily used for ranching and farming, and the population remained relatively small until the 1950s.
In the 1950s, the area began to experience a population boom as people moved to the area to escape the hustle and bustle of the city. The population continued to grow throughout the 1960s and 1970s, and the area began to develop into a small community. In the 1980s, the area was officially recognized as an unincorporated community, and the population has remained relatively stable since then.
Geography
Homestead Valley is located in the foothills of the Santa Cruz Mountains in Marin County, California. The area is known for its rural atmosphere and stunning views of the surrounding hills and valleys. The area is bordered by the towns of Mill Valley and Fairfax, and is situated between the cities of San Francisco and San Rafael. The area is home to a variety of wildlife, including deer, coyotes, and mountain lions.
Economy
The economy of Homestead Valley is primarily based on small businesses and local services. The area is home to a variety of small businesses, including restaurants, cafes, and retail stores. The area is also home to a number of professional services, such as lawyers, accountants, and real estate agents. The area is also home to a number of small farms and ranches, which provide fresh produce and other goods to the local community.
Demographics
As of the 2010 census, the population of Homestead Valley was 1,000 people. The population is primarily white (90%), with a small percentage of Hispanic (4%) and Asian (3%) residents. The median household income is $90,000, and the median age is 44 years old. The area is home to a variety of religious denominations, including Catholic, Protestant, and Jewish.
Conclusion
Homestead Valley is a small unincorporated community located in the foothills of the Santa Cruz Mountains in Marin County, California. The area is known for its rural atmosphere and stunning views of the surrounding hills and valleys. The area is home to a population of approximately 1,000 people, and the economy is primarily based on small businesses and local services. The population is primarily white, with a small percentage of Hispanic and Asian residents. The area is home to a variety of religious denominations, and the median household income is $90,000.
Common Questions
What is Per Capita Income in Homestead Valley?
Per Capita income in Homestead Valley is $25,260.
What is the Median Family Income in Homestead Valley?
Median Family Income in Homestead Valley is $39,591.
What is the Median Household income in Homestead Valley?
Median Household Income in Homestead Valley is $38,834.
What is Income or Wage Gap in Homestead Valley?
Income or Wage Gap in Homestead Valley is 46.8%.
Women in Homestead Valley earn 53.2 cents for every dollar earned by a man.
What is Family Income Deficit in Homestead Valley?
Family Income Deficit in Homestead Valley is $9,751.
Families that are below poverty line in Homestead Valley earn $9,751 less on average than the poverty threshold level.
What is Inequality or Gini Index in Homestead Valley?
Inequality or Gini Index in Homestead Valley is 0.46.
What is the Total Population of Homestead Valley?
Total Population of Homestead Valley is 2,546.
What is the Total Male Population of Homestead Valley?
Total Male Population of Homestead Valley is 1,350.
What is the Total Female Population of Homestead Valley?
Total Female Population of Homestead Valley is 1,196.
What is the Ratio of Males per 100 Females in Homestead Valley?
There are 112.88 Males per 100 Females in Homestead Valley.
What is the Ratio of Females per 100 Males in Homestead Valley?
There are 88.59 Females per 100 Males in Homestead Valley.
What is the Median Population Age in Homestead Valley?
Median Population Age in Homestead Valley is 54.4 Years.
What is the Average Family Size in Homestead Valley
Average Family Size in Homestead Valley is 2.7 People.
What is the Average Household Size in Homestead Valley
Average Household Size in Homestead Valley is 2.0 People.
How Large is the Labor Force in Homestead Valley?
There are 917 People in the Labor Forcein in Homestead Valley.
What is the Percentage of People in the Labor Force in Homestead Valley?
39.9% of People are in the Labor Force in Homestead Valley.
What is the Unemployment Rate in Homestead Valley?
Unemployment Rate in Homestead Valley is 16.0%.