Mountain Mesa, CA Map & Demographics
Mountain Mesa Map
Mountain Mesa Overview
$26,019
PER CAPITA INCOME
$47,432
AVG FAMILY INCOME
$47,068
AVG HOUSEHOLD INCOME
0.34
INEQUALITY / GINI INDEX
572
TOTAL POPULATION
274
MALE POPULATION
298
FEMALE POPULATION
91.95
MALES / 100 FEMALES
108.76
FEMALES / 100 MALES
70.3
MEDIAN AGE
2.4
AVG FAMILY SIZE
2.0
AVG HOUSEHOLD SIZE
60
LABOR FORCE [ PEOPLE ]
11.7%
PERCENT IN LABOR FORCE
Mountain Mesa Area Codes
Income in Mountain Mesa
Income Overview in Mountain Mesa
Per Capita Income in Mountain Mesa is $26,019, while median incomes of families and households are $47,432 and $47,068 respectively.
| Characteristic | Number | Measure |
| Per Capita Income | 572 | $26,019 |
| Median Family Income | 189 | $47,432 |
| Mean Family Income | 189 | $62,493 |
| Median Household Income | 253 | $47,068 |
| Mean Household Income | 253 | $56,473 |
| Income Deficit | 189 | $0 |
| Wage / Income Gap (%) | 572 | 0.00% |
| Wage / Income Gap ($) | 572 | 100.00¢ per $1 |
| Gini / Inequality Index | 572 | 0.34 |
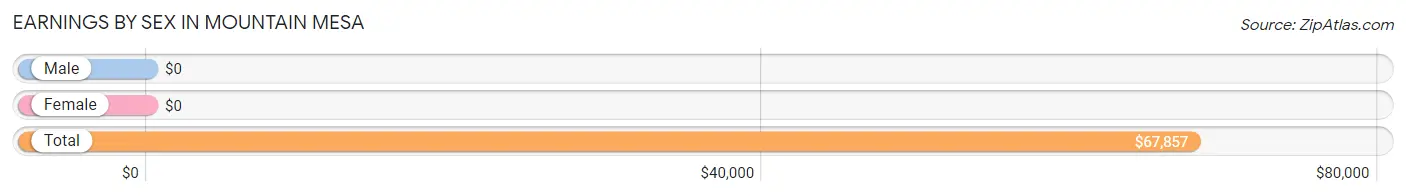
Earnings by Sex in Mountain Mesa
| Sex | Number | Average Earnings |
| Male | 49 (81.7%) | $0 |
| Female | 11 (18.3%) | $0 |
| Total | 60 (100.0%) | $67,857 |
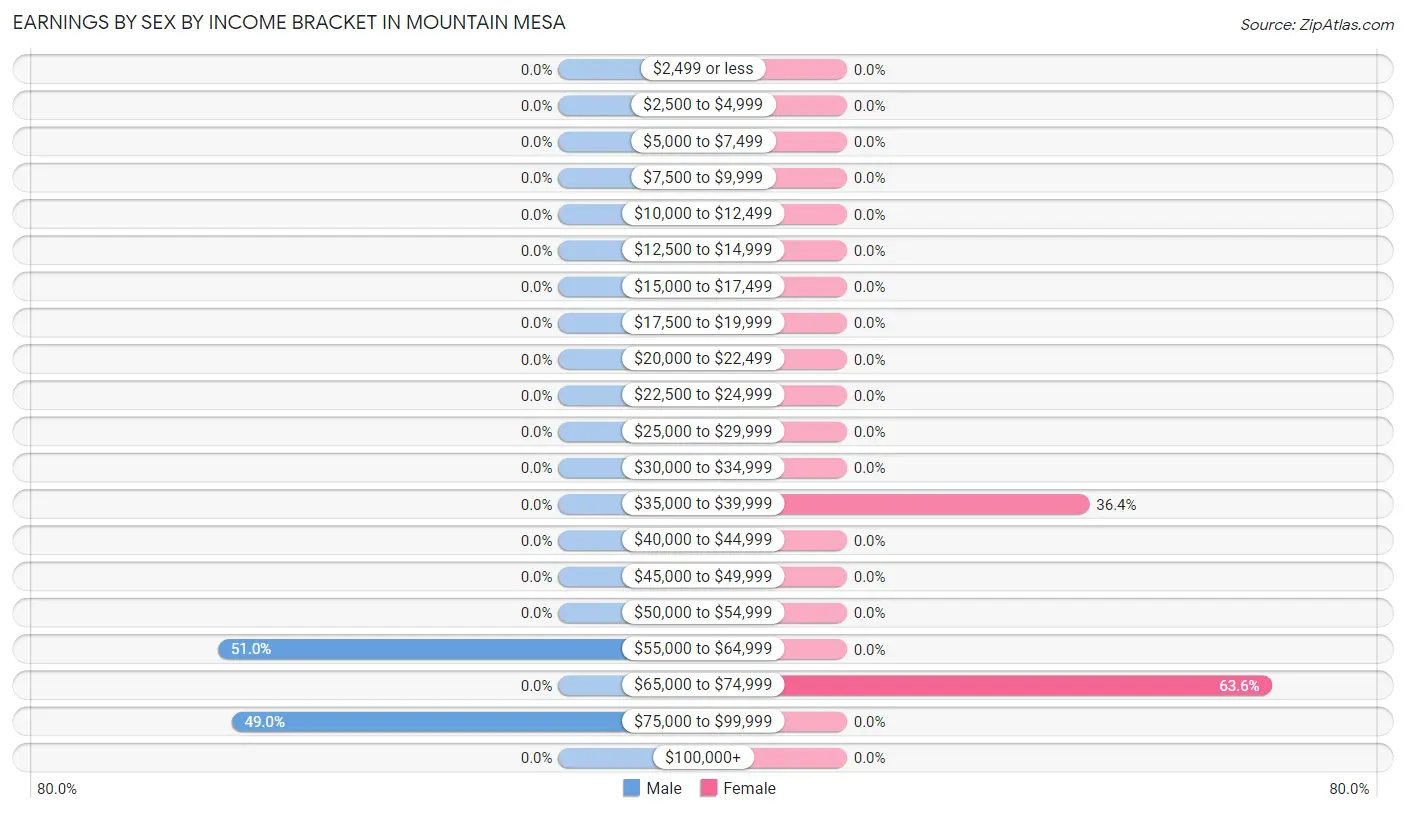
Earnings by Sex by Income Bracket in Mountain Mesa
The most common earnings brackets in Mountain Mesa are $55,000 to $64,999 for men (25 | 51.0%) and $65,000 to $74,999 for women (7 | 63.6%).
| Income | Male | Female |
| $2,499 or less | 0 (0.0%) | 0 (0.0%) |
| $2,500 to $4,999 | 0 (0.0%) | 0 (0.0%) |
| $5,000 to $7,499 | 0 (0.0%) | 0 (0.0%) |
| $7,500 to $9,999 | 0 (0.0%) | 0 (0.0%) |
| $10,000 to $12,499 | 0 (0.0%) | 0 (0.0%) |
| $12,500 to $14,999 | 0 (0.0%) | 0 (0.0%) |
| $15,000 to $17,499 | 0 (0.0%) | 0 (0.0%) |
| $17,500 to $19,999 | 0 (0.0%) | 0 (0.0%) |
| $20,000 to $22,499 | 0 (0.0%) | 0 (0.0%) |
| $22,500 to $24,999 | 0 (0.0%) | 0 (0.0%) |
| $25,000 to $29,999 | 0 (0.0%) | 0 (0.0%) |
| $30,000 to $34,999 | 0 (0.0%) | 0 (0.0%) |
| $35,000 to $39,999 | 0 (0.0%) | 4 (36.4%) |
| $40,000 to $44,999 | 0 (0.0%) | 0 (0.0%) |
| $45,000 to $49,999 | 0 (0.0%) | 0 (0.0%) |
| $50,000 to $54,999 | 0 (0.0%) | 0 (0.0%) |
| $55,000 to $64,999 | 25 (51.0%) | 0 (0.0%) |
| $65,000 to $74,999 | 0 (0.0%) | 7 (63.6%) |
| $75,000 to $99,999 | 24 (49.0%) | 0 (0.0%) |
| $100,000+ | 0 (0.0%) | 0 (0.0%) |
| Total | 49 (100.0%) | 11 (100.0%) |
Earnings by Sex by Educational Attainment in Mountain Mesa
| Educational Attainment | Male Income | Female Income |
| Less than High School | - | - |
| High School Diploma | - | - |
| College or Associate's Degree | - | - |
| Bachelor's Degree | - | - |
| Graduate Degree | - | - |
| Total | - | - |
Family Income in Mountain Mesa
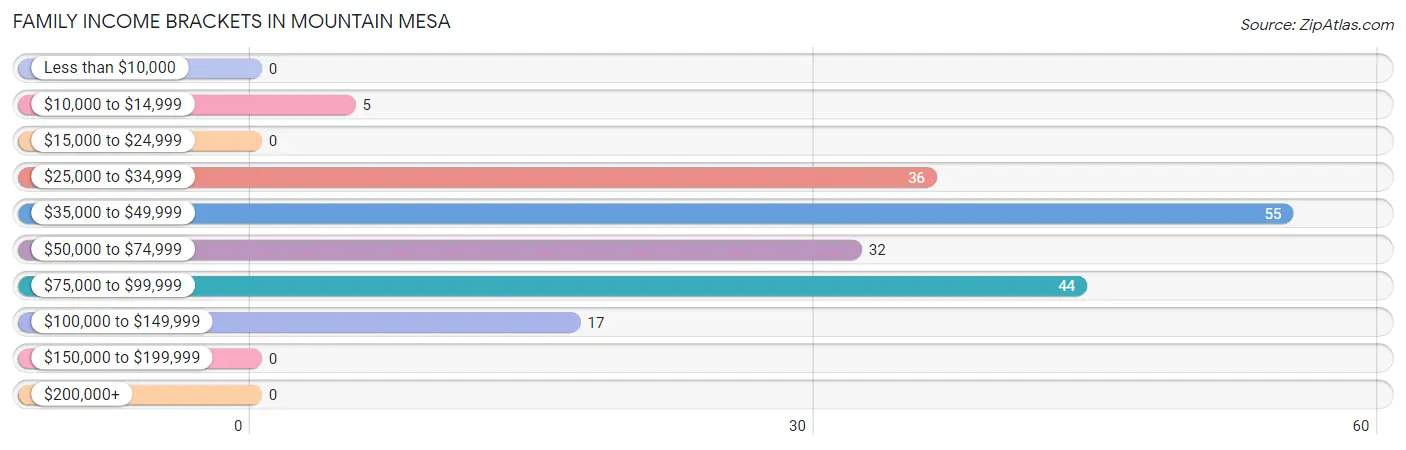
Family Income Brackets in Mountain Mesa
According to the Mountain Mesa family income data, there are 55 families falling into the $35,000 to $49,999 income range, which is the most common income bracket and makes up 29.1% of all families.
| Income Bracket | # Families | % Families |
| Less than $10,000 | 0 | 0.0% |
| $10,000 to $14,999 | 5 | 2.6% |
| $15,000 to $24,999 | 0 | 0.0% |
| $25,000 to $34,999 | 36 | 19.0% |
| $35,000 to $49,999 | 55 | 29.1% |
| $50,000 to $74,999 | 32 | 16.9% |
| $75,000 to $99,999 | 44 | 23.3% |
| $100,000 to $149,999 | 17 | 9.0% |
| $150,000 to $199,999 | 0 | 0.0% |
| $200,000+ | 0 | 0.0% |
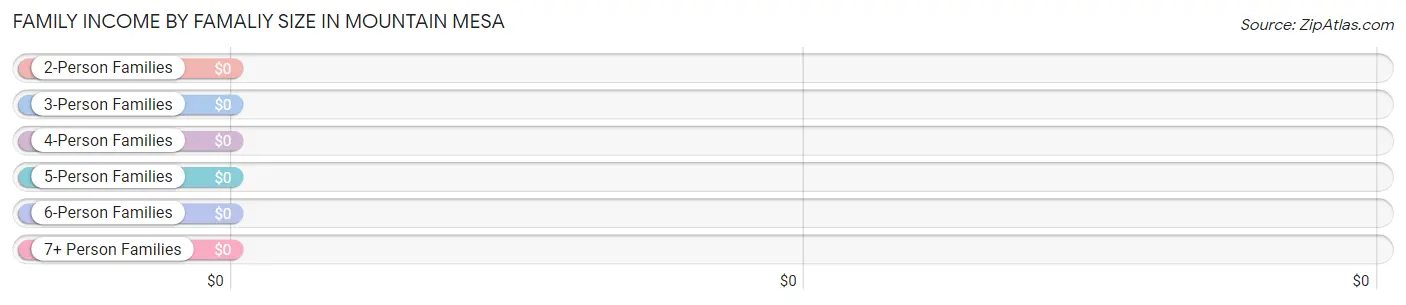
Family Income by Famaliy Size in Mountain Mesa
| Income Bracket | # Families | Median Income |
| 2-Person Families | 152 (80.4%) | $0 |
| 3-Person Families | 9 (4.8%) | $0 |
| 4-Person Families | 28 (14.8%) | $0 |
| 5-Person Families | 0 (0.0%) | $0 |
| 6-Person Families | 0 (0.0%) | $0 |
| 7+ Person Families | 0 (0.0%) | $0 |
| Total | 189 (100.0%) | $47,432 |
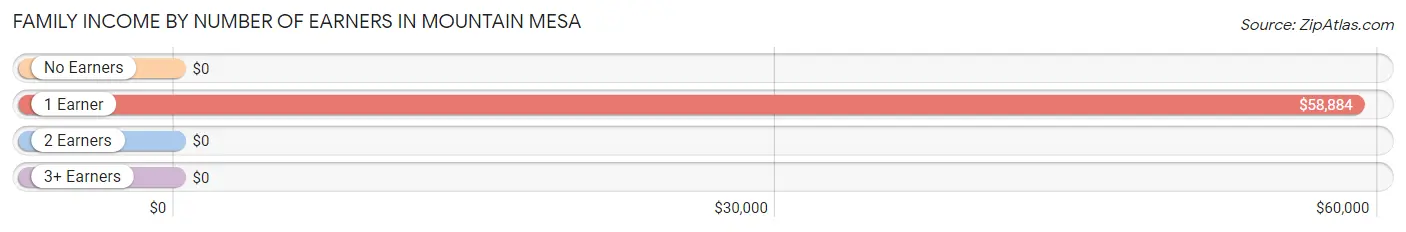
Family Income by Number of Earners in Mountain Mesa
| Number of Earners | # Families | Median Income |
| No Earners | 150 (79.4%) | $0 |
| 1 Earner | 39 (20.6%) | $58,884 |
| 2 Earners | 0 (0.0%) | $0 |
| 3+ Earners | 0 (0.0%) | $0 |
| Total | 189 (100.0%) | $47,432 |
Household Income in Mountain Mesa
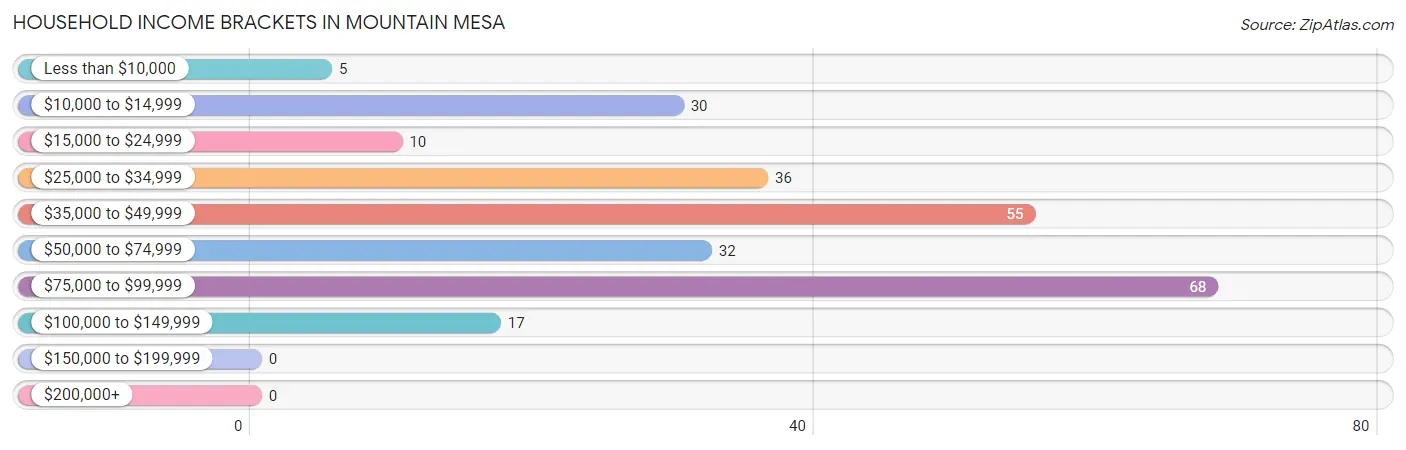
Household Income Brackets in Mountain Mesa
With 68 households falling in the category, the $75,000 to $99,999 income range is the most frequent in Mountain Mesa, accounting for 26.9% of all households.
| Income Bracket | # Households | % Households |
| Less than $10,000 | 5 | 2.0% |
| $10,000 to $14,999 | 30 | 11.9% |
| $15,000 to $24,999 | 10 | 4.0% |
| $25,000 to $34,999 | 36 | 14.2% |
| $35,000 to $49,999 | 55 | 21.7% |
| $50,000 to $74,999 | 32 | 12.6% |
| $75,000 to $99,999 | 68 | 26.9% |
| $100,000 to $149,999 | 17 | 6.7% |
| $150,000 to $199,999 | 0 | 0.0% |
| $200,000+ | 0 | 0.0% |
Household Income by Householder Age in Mountain Mesa
The median household income in Mountain Mesa is $47,068, with the highest median household income of $93,523 found in the 45 to 64 years age bracket for the primary householder. A total of 66 households (26.1%) fall into this category.
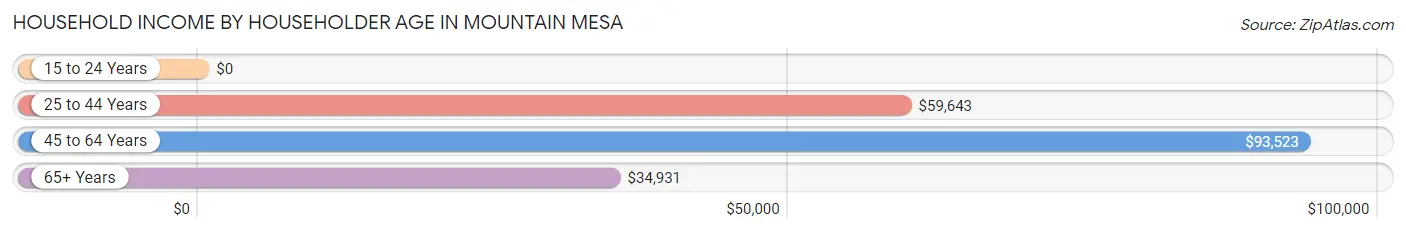
| Income Bracket | # Households | Median Income |
| 15 to 24 Years | 0 (0.0%) | $0 |
| 25 to 44 Years | 56 (22.1%) | $59,643 |
| 45 to 64 Years | 66 (26.1%) | $93,523 |
| 65+ Years | 131 (51.8%) | $34,931 |
| Total | 253 (100.0%) | $47,068 |
Poverty in Mountain Mesa
Income Below Poverty by Sex and Age in Mountain Mesa
With 16.9% poverty level for males and 3.8% for females among the residents of Mountain Mesa, 75 year old and over males and 65 to 74 year old females are the most vulnerable to poverty, with 25 males (23.6%) and 5 females (21.7%) in their respective age groups living below the poverty level.
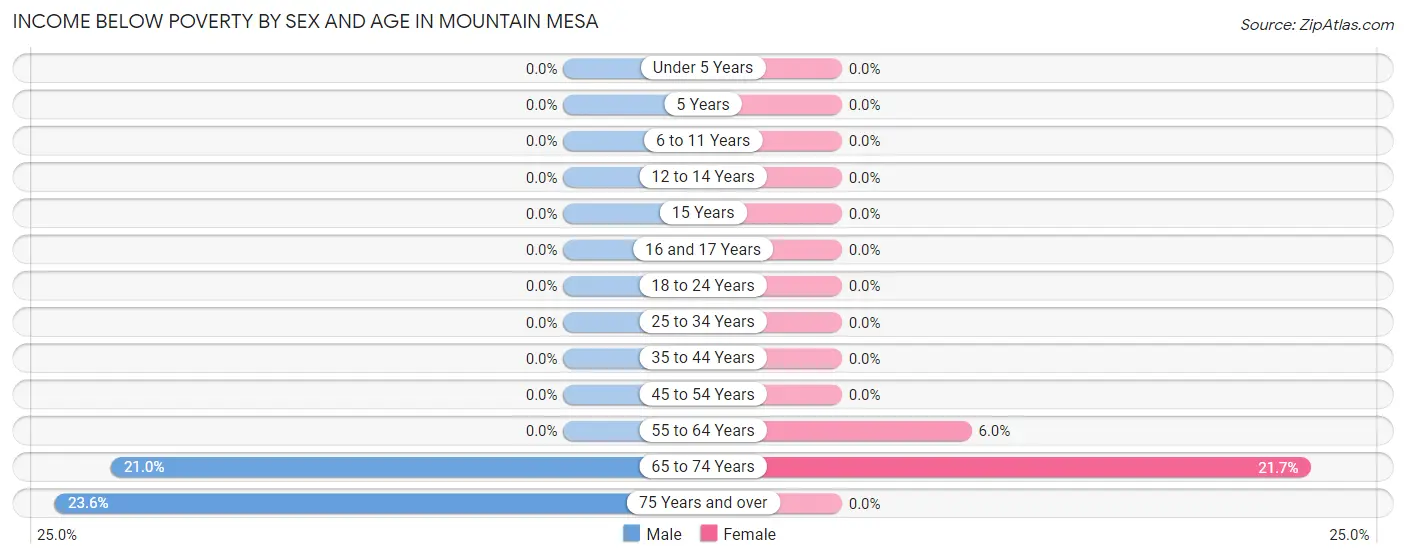
| Age Bracket | Male | Female |
| Under 5 Years | 0 (0.0%) | 0 (0.0%) |
| 5 Years | 0 (0.0%) | 0 (0.0%) |
| 6 to 11 Years | 0 (0.0%) | 0 (0.0%) |
| 12 to 14 Years | 0 (0.0%) | 0 (0.0%) |
| 15 Years | 0 (0.0%) | 0 (0.0%) |
| 16 and 17 Years | 0 (0.0%) | 0 (0.0%) |
| 18 to 24 Years | 0 (0.0%) | 0 (0.0%) |
| 25 to 34 Years | 0 (0.0%) | 0 (0.0%) |
| 35 to 44 Years | 0 (0.0%) | 0 (0.0%) |
| 45 to 54 Years | 0 (0.0%) | 0 (0.0%) |
| 55 to 64 Years | 0 (0.0%) | 5 (6.0%) |
| 65 to 74 Years | 17 (21.0%) | 5 (21.7%) |
| 75 Years and over | 25 (23.6%) | 0 (0.0%) |
| Total | 42 (16.9%) | 10 (3.8%) |
Income Above Poverty by Sex and Age in Mountain Mesa
According to the poverty statistics in Mountain Mesa, males aged 18 to 24 years and females aged 5 years are the age groups that are most secure financially, with 100.0% of males and 100.0% of females in these age groups living above the poverty line.
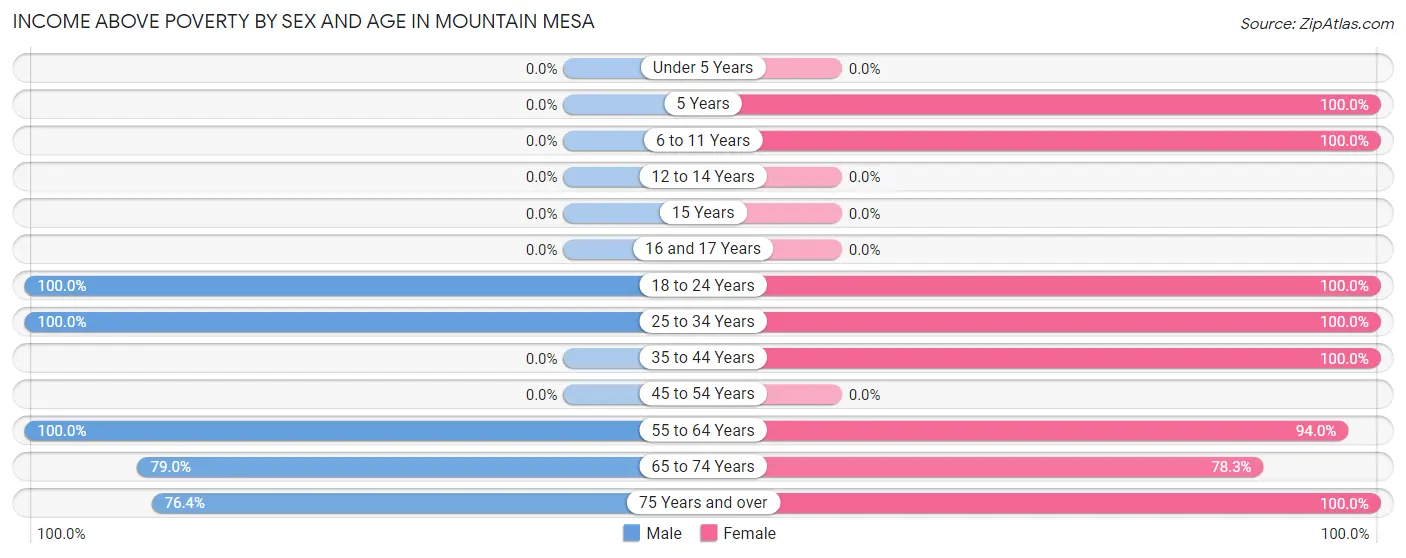
| Age Bracket | Male | Female |
| Under 5 Years | 0 (0.0%) | 0 (0.0%) |
| 5 Years | 0 (0.0%) | 29 (100.0%) |
| 6 to 11 Years | 0 (0.0%) | 29 (100.0%) |
| 12 to 14 Years | 0 (0.0%) | 0 (0.0%) |
| 15 Years | 0 (0.0%) | 0 (0.0%) |
| 16 and 17 Years | 0 (0.0%) | 0 (0.0%) |
| 18 to 24 Years | 5 (100.0%) | 4 (100.0%) |
| 25 to 34 Years | 49 (100.0%) | 28 (100.0%) |
| 35 to 44 Years | 0 (0.0%) | 4 (100.0%) |
| 45 to 54 Years | 0 (0.0%) | 0 (0.0%) |
| 55 to 64 Years | 7 (100.0%) | 78 (94.0%) |
| 65 to 74 Years | 64 (79.0%) | 18 (78.3%) |
| 75 Years and over | 81 (76.4%) | 63 (100.0%) |
| Total | 206 (83.1%) | 253 (96.2%) |
Income Below Poverty Among Married-Couple Families in Mountain Mesa
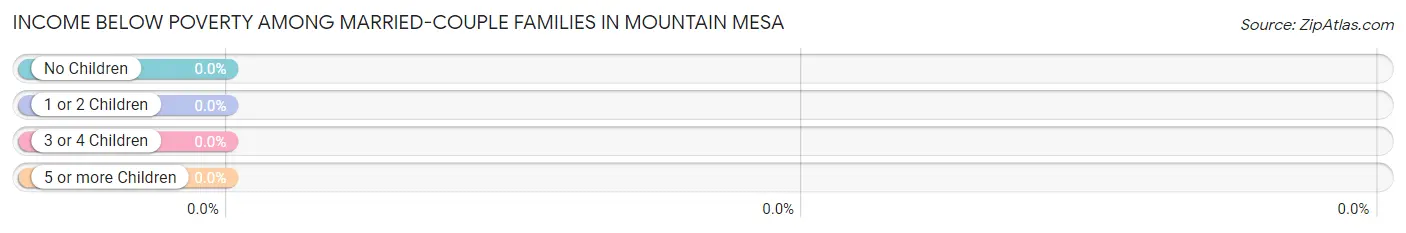
| Children | Above Poverty | Below Poverty |
| No Children | 152 (100.0%) | 0 (0.0%) |
| 1 or 2 Children | 28 (100.0%) | 0 (0.0%) |
| 3 or 4 Children | 0 (0.0%) | 0 (0.0%) |
| 5 or more Children | 0 (0.0%) | 0 (0.0%) |
| Total | 180 (100.0%) | 0 (0.0%) |
Income Below Poverty Among Single-Parent Households in Mountain Mesa
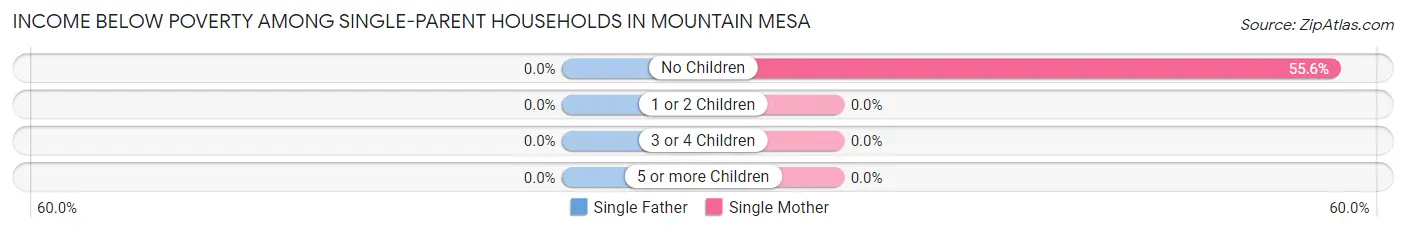
| Children | Single Father | Single Mother |
| No Children | 0 (0.0%) | 5 (55.6%) |
| 1 or 2 Children | 0 (0.0%) | 0 (0.0%) |
| 3 or 4 Children | 0 (0.0%) | 0 (0.0%) |
| 5 or more Children | 0 (0.0%) | 0 (0.0%) |
| Total | 0 (0.0%) | 5 (55.6%) |
Income Below Poverty Among Married-Couple vs Single-Parent Households in Mountain Mesa
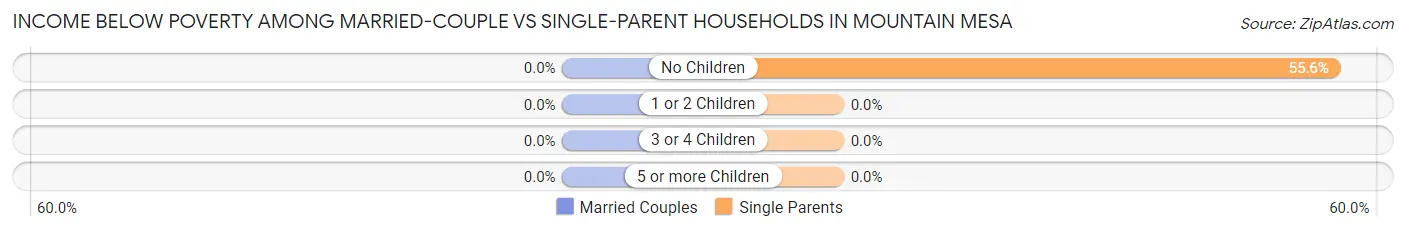
| Children | Married-Couple Families | Single-Parent Households |
| No Children | 0 (0.0%) | 5 (55.6%) |
| 1 or 2 Children | 0 (0.0%) | 0 (0.0%) |
| 3 or 4 Children | 0 (0.0%) | 0 (0.0%) |
| 5 or more Children | 0 (0.0%) | 0 (0.0%) |
| Total | 0 (0.0%) | 5 (55.6%) |
Race in Mountain Mesa
The most populous races in Mountain Mesa are White / Caucasian (553 | 96.7%), Asian (12 | 2.1%), and Two or more Races (5 | 0.9%).
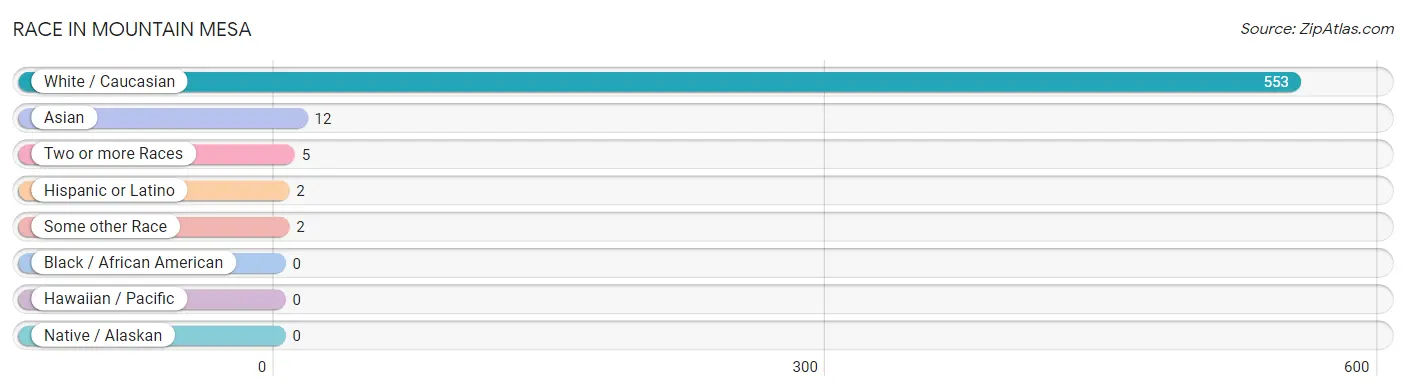
| Race | # Population | % Population |
| Asian | 12 | 2.1% |
| Black / African American | 0 | 0.0% |
| Hawaiian / Pacific | 0 | 0.0% |
| Hispanic or Latino | 2 | 0.4% |
| Native / Alaskan | 0 | 0.0% |
| White / Caucasian | 553 | 96.7% |
| Two or more Races | 5 | 0.9% |
| Some other Race | 2 | 0.4% |
| Total | 572 | 100.0% |
Ancestry in Mountain Mesa
The most populous ancestries reported in Mountain Mesa are European (132 | 23.1%), German (114 | 19.9%), Italian (46 | 8.0%), Norwegian (44 | 7.7%), and American (42 | 7.3%), together accounting for 66.1% of all Mountain Mesa residents.
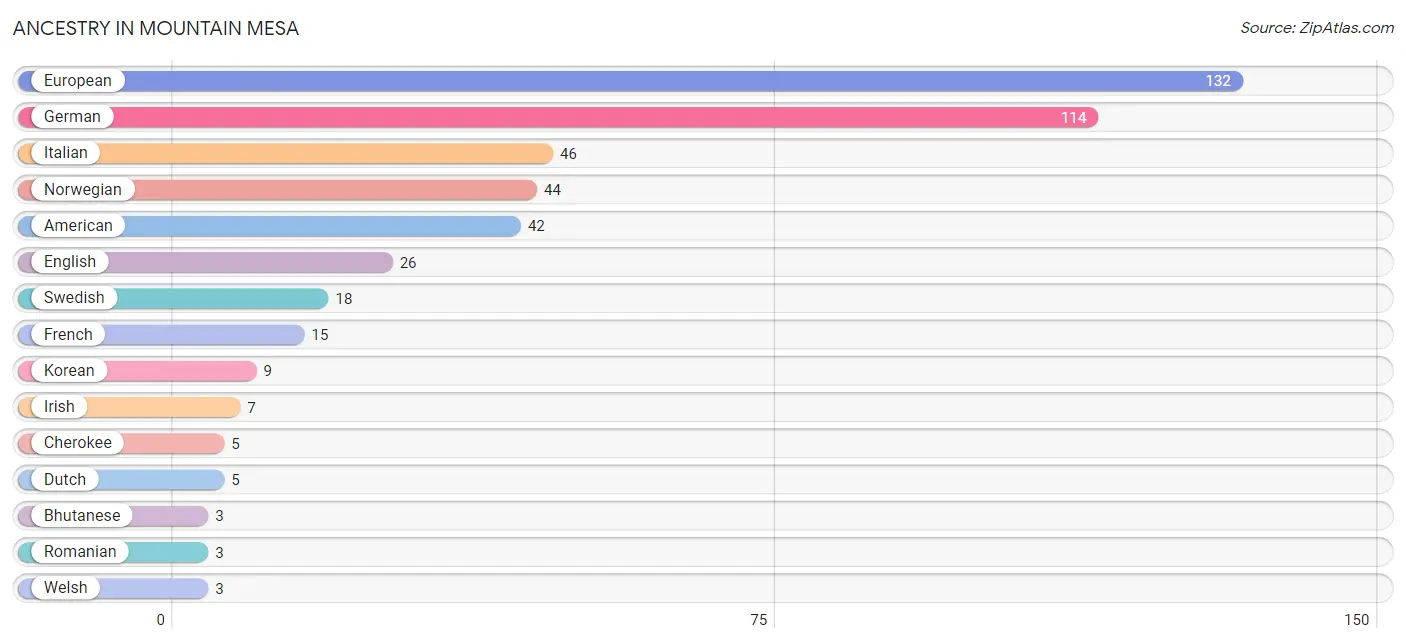
| Ancestry | # Population | % Population |
| American | 42 | 7.3% |
| Bhutanese | 3 | 0.5% |
| Cherokee | 5 | 0.9% |
| Dutch | 5 | 0.9% |
| English | 26 | 4.5% |
| European | 132 | 23.1% |
| French | 15 | 2.6% |
| German | 114 | 19.9% |
| Irish | 7 | 1.2% |
| Italian | 46 | 8.0% |
| Korean | 9 | 1.6% |
| Mexican | 2 | 0.4% |
| Norwegian | 44 | 7.7% |
| Romanian | 3 | 0.5% |
| Swedish | 18 | 3.2% |
| Welsh | 3 | 0.5% | View All 16 Rows |
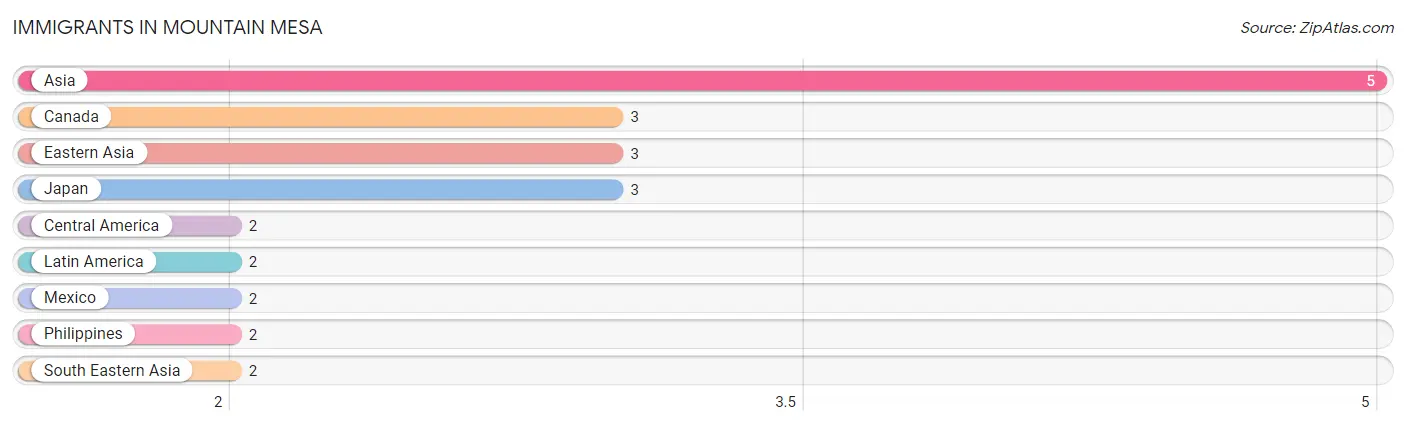
Immigrants in Mountain Mesa
The most numerous immigrant groups reported in Mountain Mesa came from Asia (5 | 0.9%), Canada (3 | 0.5%), Eastern Asia (3 | 0.5%), Japan (3 | 0.5%), and Central America (2 | 0.4%), together accounting for 2.8% of all Mountain Mesa residents.
| Immigration Origin | # Population | % Population |
| Asia | 5 | 0.9% |
| Canada | 3 | 0.5% |
| Central America | 2 | 0.4% |
| Eastern Asia | 3 | 0.5% |
| Japan | 3 | 0.5% |
| Latin America | 2 | 0.4% |
| Mexico | 2 | 0.4% |
| Philippines | 2 | 0.4% |
| South Eastern Asia | 2 | 0.4% | View All 9 Rows |
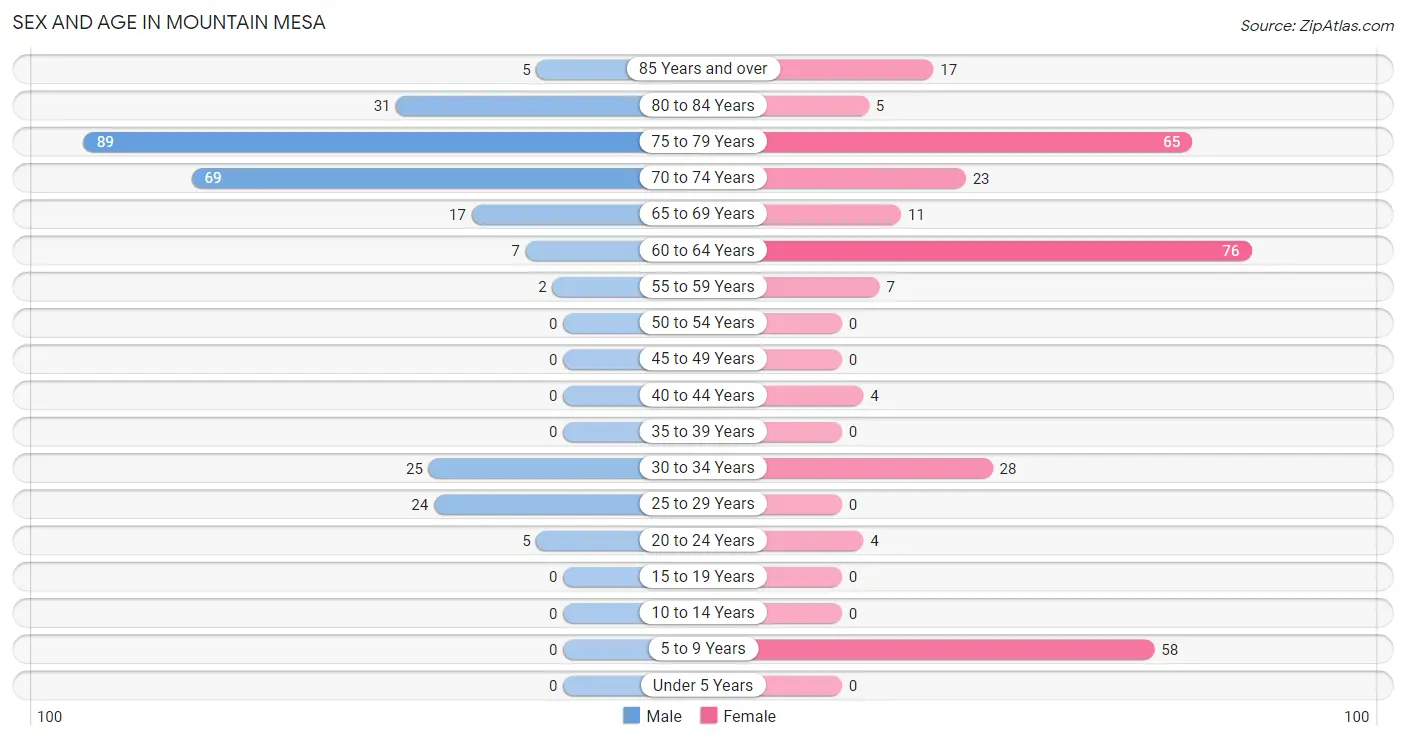
Sex and Age in Mountain Mesa
Sex and Age in Mountain Mesa
The most populous age groups in Mountain Mesa are 75 to 79 Years (89 | 32.5%) for men and 60 to 64 Years (76 | 25.5%) for women.
| Age Bracket | Male | Female |
| Under 5 Years | 0 (0.0%) | 0 (0.0%) |
| 5 to 9 Years | 0 (0.0%) | 58 (19.5%) |
| 10 to 14 Years | 0 (0.0%) | 0 (0.0%) |
| 15 to 19 Years | 0 (0.0%) | 0 (0.0%) |
| 20 to 24 Years | 5 (1.8%) | 4 (1.3%) |
| 25 to 29 Years | 24 (8.8%) | 0 (0.0%) |
| 30 to 34 Years | 25 (9.1%) | 28 (9.4%) |
| 35 to 39 Years | 0 (0.0%) | 0 (0.0%) |
| 40 to 44 Years | 0 (0.0%) | 4 (1.3%) |
| 45 to 49 Years | 0 (0.0%) | 0 (0.0%) |
| 50 to 54 Years | 0 (0.0%) | 0 (0.0%) |
| 55 to 59 Years | 2 (0.7%) | 7 (2.4%) |
| 60 to 64 Years | 7 (2.5%) | 76 (25.5%) |
| 65 to 69 Years | 17 (6.2%) | 11 (3.7%) |
| 70 to 74 Years | 69 (25.2%) | 23 (7.7%) |
| 75 to 79 Years | 89 (32.5%) | 65 (21.8%) |
| 80 to 84 Years | 31 (11.3%) | 5 (1.7%) |
| 85 Years and over | 5 (1.8%) | 17 (5.7%) |
| Total | 274 (100.0%) | 298 (100.0%) |
Families and Households in Mountain Mesa
Median Family Size in Mountain Mesa
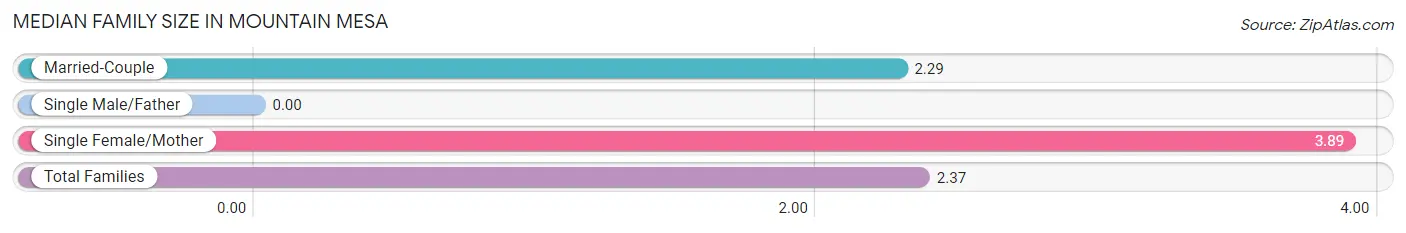
| Family Type | # Families | Family Size |
| Married-Couple | 180 (95.2%) | 2.29 |
| Single Male/Father | 0 (0.0%) | - |
| Single Female/Mother | 9 (4.8%) | 3.89 |
| Total Families | 189 (100.0%) | 2.37 |
Median Household Size in Mountain Mesa
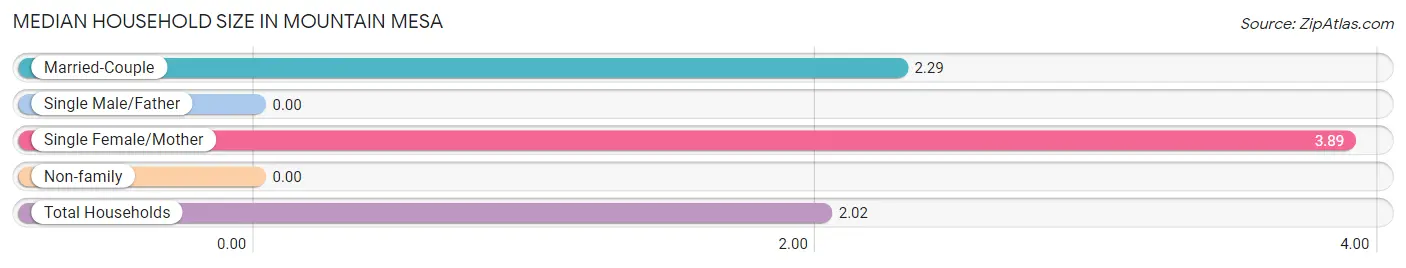
| Household Type | # Households | Household Size |
| Married-Couple | 180 (71.2%) | 2.29 |
| Single Male/Father | 0 (0.0%) | - |
| Single Female/Mother | 9 (3.6%) | 3.89 |
| Non-family | 64 (25.3%) | - |
| Total Households | 253 (100.0%) | 2.02 |
Household Size by Marriage Status in Mountain Mesa
Out of a total of 253 households in Mountain Mesa, 189 (74.7%) are family households, while 64 (25.3%) are nonfamily households. The most numerous type of family households are 2-person households, comprising 152, and the most common type of nonfamily households are 1-person households, comprising 64.
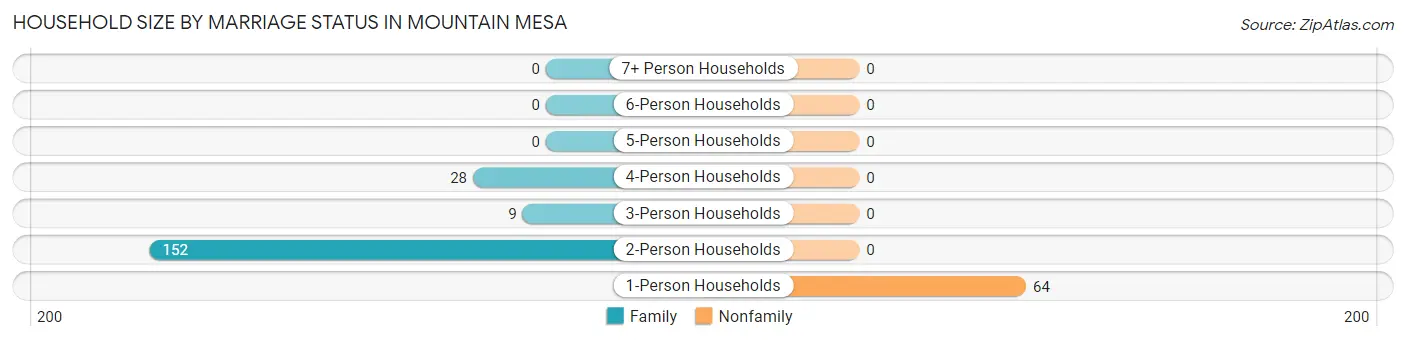
| Household Size | Family Households | Nonfamily Households |
| 1-Person Households | - | 64 (25.3%) |
| 2-Person Households | 152 (60.1%) | 0 (0.0%) |
| 3-Person Households | 9 (3.6%) | 0 (0.0%) |
| 4-Person Households | 28 (11.1%) | 0 (0.0%) |
| 5-Person Households | 0 (0.0%) | 0 (0.0%) |
| 6-Person Households | 0 (0.0%) | 0 (0.0%) |
| 7+ Person Households | 0 (0.0%) | 0 (0.0%) |
| Total | 189 (74.7%) | 64 (25.3%) |
Female Fertility in Mountain Mesa
Fertility by Age in Mountain Mesa
| Age Bracket | Women with Births | Births / 1,000 Women |
| 15 to 19 years | 0 (0.0%) | 0.0 |
| 20 to 34 years | 0 (0.0%) | 0.0 |
| 35 to 50 years | 0 (0.0%) | 0.0 |
| Total | 0 (0.0%) | 0.0 |
Fertility by Age by Marriage Status in Mountain Mesa
| Age Bracket | Married | Unmarried |
| 15 to 19 years | 0 (0.0%) | 0 (0.0%) |
| 20 to 34 years | 0 (0.0%) | 0 (0.0%) |
| 35 to 50 years | 0 (0.0%) | 0 (0.0%) |
| Total | 0 (0.0%) | 0 (0.0%) |
Fertility by Education in Mountain Mesa
| Educational Attainment | Women with Births | Births / 1,000 Women |
| Less than High School | 0 (0.0%) | 0.0 |
| High School Diploma | 0 (0.0%) | 0.0 |
| College or Associate's Degree | 0 (0.0%) | 0.0 |
| Bachelor's Degree | 0 (0.0%) | 0.0 |
| Graduate Degree | 0 (0.0%) | 0.0 |
| Total | 0 (0.0%) | 0.0 |
Fertility by Education by Marriage Status in Mountain Mesa
| Educational Attainment | Married | Unmarried |
| Less than High School | 0 (0.0%) | 0 (0.0%) |
| High School Diploma | 0 (0.0%) | 0 (0.0%) |
| College or Associate's Degree | 0 (0.0%) | 0 (0.0%) |
| Bachelor's Degree | 0 (0.0%) | 0 (0.0%) |
| Graduate Degree | 0 (0.0%) | 0 (0.0%) |
| Total | 0 (0.0%) | 0 (0.0%) |
Employment Characteristics in Mountain Mesa
Employment by Class of Employer in Mountain Mesa
Among the 60 employed individuals in Mountain Mesa, private company employees (49 | 81.7%), self-employed (incorporated) (7 | 11.7%), and state government employees (4 | 6.7%) make up the most common classes of employment.
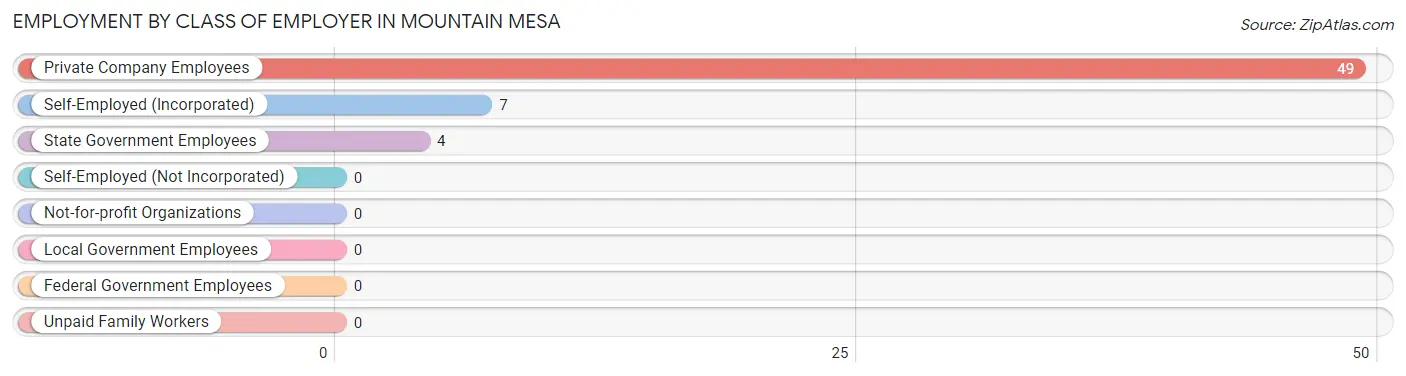
| Employer Class | # Employees | % Employees |
| Private Company Employees | 49 | 81.7% |
| Self-Employed (Incorporated) | 7 | 11.7% |
| Self-Employed (Not Incorporated) | 0 | 0.0% |
| Not-for-profit Organizations | 0 | 0.0% |
| Local Government Employees | 0 | 0.0% |
| State Government Employees | 4 | 6.7% |
| Federal Government Employees | 0 | 0.0% |
| Unpaid Family Workers | 0 | 0.0% |
| Total | 60 | 100.0% |
Employment Status by Age in Mountain Mesa
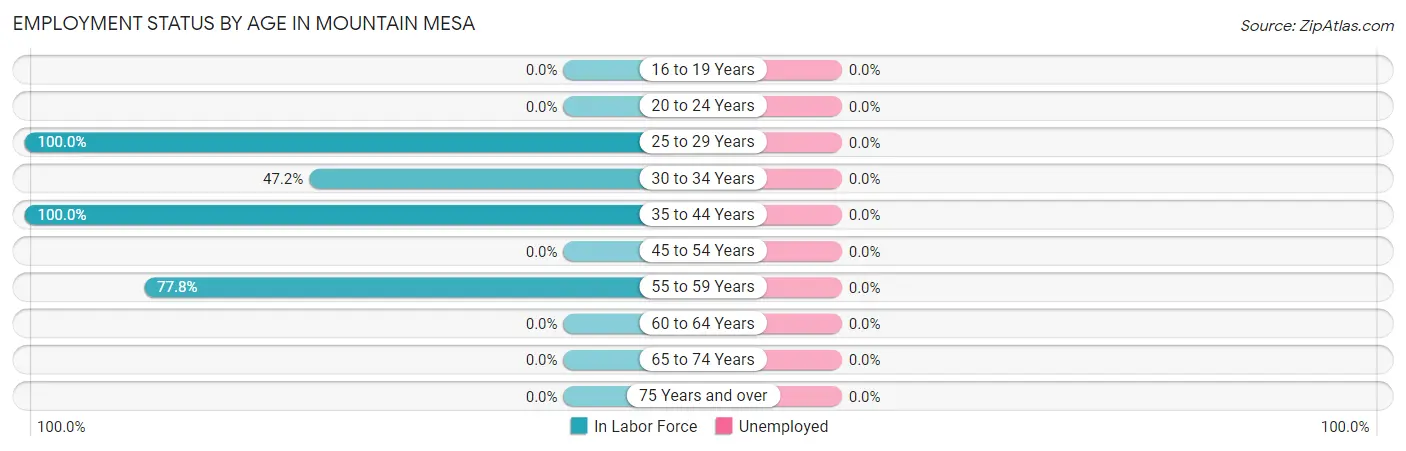
| Age Bracket | In Labor Force | Unemployed |
| 16 to 19 Years | 0 (0.0%) | 0 (0.0%) |
| 20 to 24 Years | 0 (0.0%) | 0 (0.0%) |
| 25 to 29 Years | 24 (100.0%) | 0 (0.0%) |
| 30 to 34 Years | 25 (47.2%) | 0 (0.0%) |
| 35 to 44 Years | 4 (100.0%) | 0 (0.0%) |
| 45 to 54 Years | 0 (0.0%) | 0 (0.0%) |
| 55 to 59 Years | 7 (77.8%) | 0 (0.0%) |
| 60 to 64 Years | 0 (0.0%) | 0 (0.0%) |
| 65 to 74 Years | 0 (0.0%) | 0 (0.0%) |
| 75 Years and over | 0 (0.0%) | 0 (0.0%) |
| Total | 60 (11.7%) | 0 (0.0%) |
Employment Status by Educational Attainment in Mountain Mesa
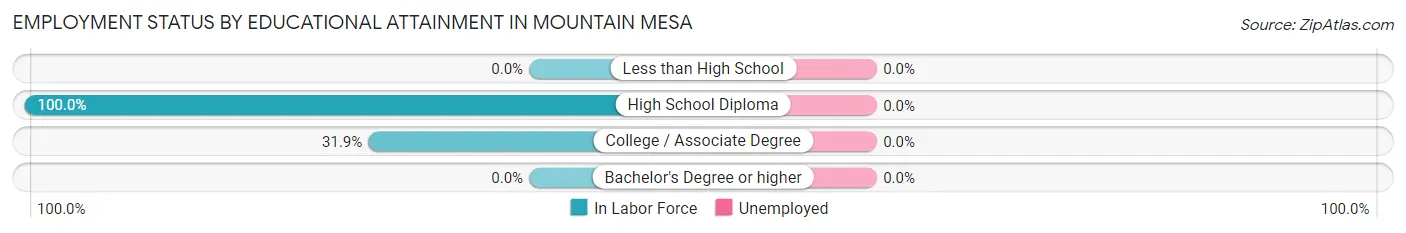
| Educational Attainment | In Labor Force | Unemployed |
| Less than High School | 0 (0.0%) | 0 (0.0%) |
| High School Diploma | 7 (100.0%) | 0 (0.0%) |
| College / Associate Degree | 53 (31.9%) | 0 (0.0%) |
| Bachelor's Degree or higher | 0 (0.0%) | 0 (0.0%) |
| Total | 60 (34.7%) | 0 (0.0%) |
Employment Occupations by Sex in Mountain Mesa
Management, Business, Science and Arts Occupations
The most common Management, Business, Science and Arts occupations in Mountain Mesa are Health Diagnosing & Treating (24 | 40.0%), and Management (7 | 11.7%).
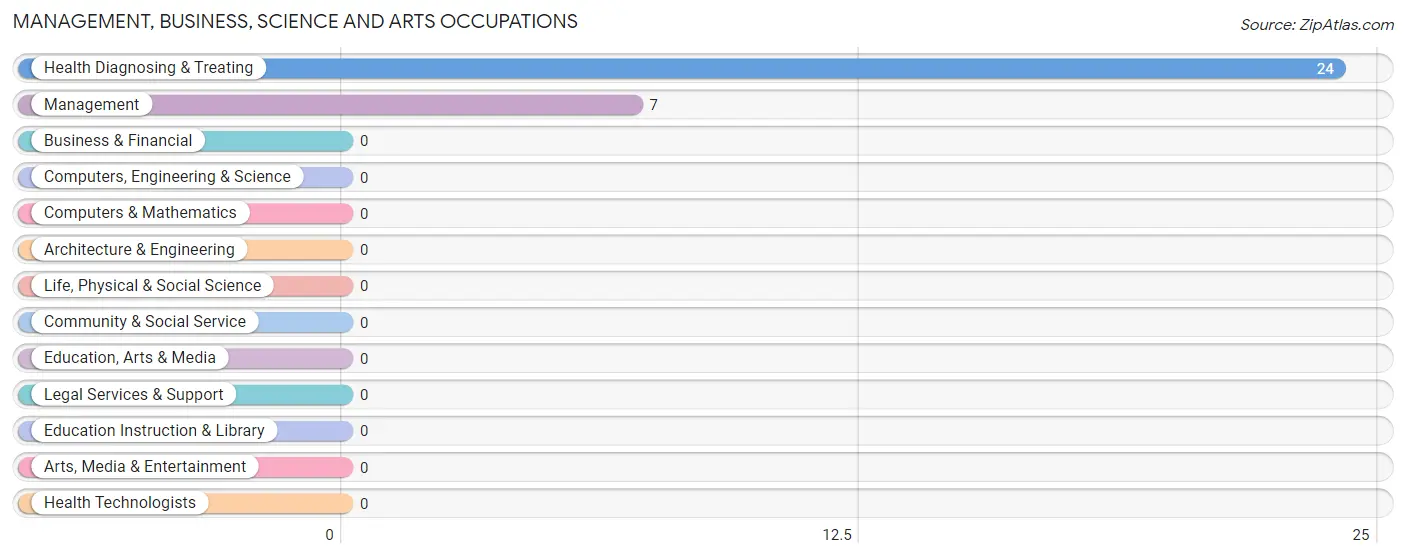
Management, Business, Science and Arts Occupations by Sex
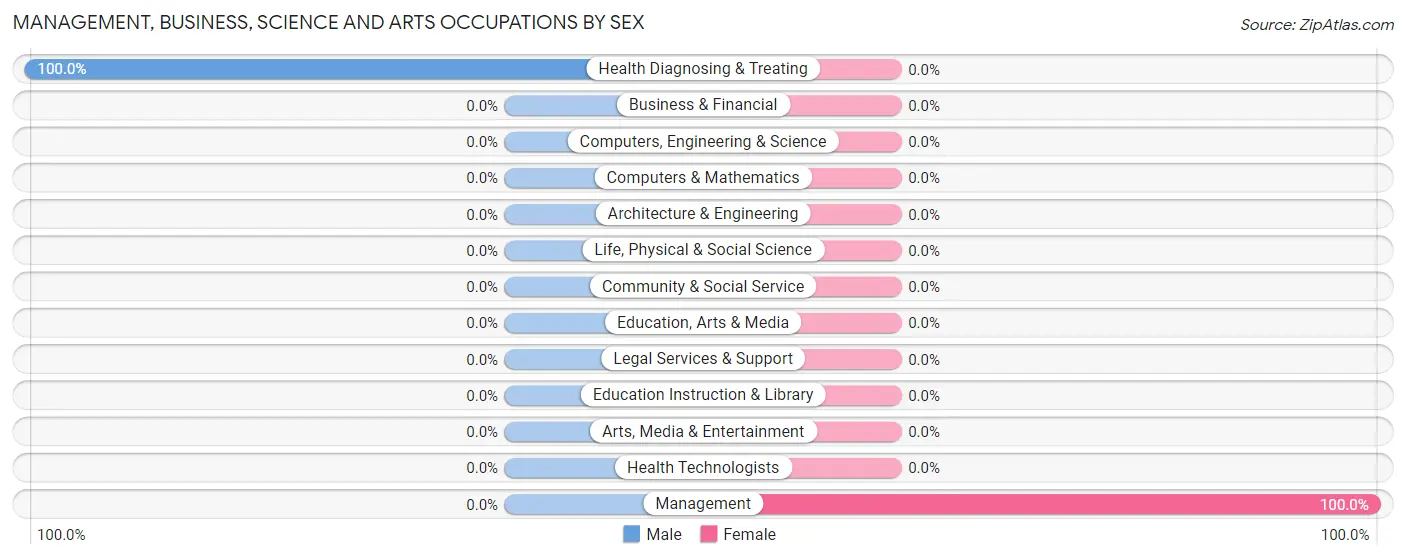
| Occupation | Male | Female |
| Management | 0 (0.0%) | 7 (100.0%) |
| Business & Financial | 0 (0.0%) | 0 (0.0%) |
| Computers, Engineering & Science | 0 (0.0%) | 0 (0.0%) |
| Computers & Mathematics | 0 (0.0%) | 0 (0.0%) |
| Architecture & Engineering | 0 (0.0%) | 0 (0.0%) |
| Life, Physical & Social Science | 0 (0.0%) | 0 (0.0%) |
| Community & Social Service | 0 (0.0%) | 0 (0.0%) |
| Education, Arts & Media | 0 (0.0%) | 0 (0.0%) |
| Legal Services & Support | 0 (0.0%) | 0 (0.0%) |
| Education Instruction & Library | 0 (0.0%) | 0 (0.0%) |
| Arts, Media & Entertainment | 0 (0.0%) | 0 (0.0%) |
| Health Diagnosing & Treating | 24 (100.0%) | 0 (0.0%) |
| Health Technologists | 0 (0.0%) | 0 (0.0%) |
| Total (Category) | 24 (77.4%) | 7 (22.6%) |
| Total (Overall) | 49 (81.7%) | 11 (18.3%) |
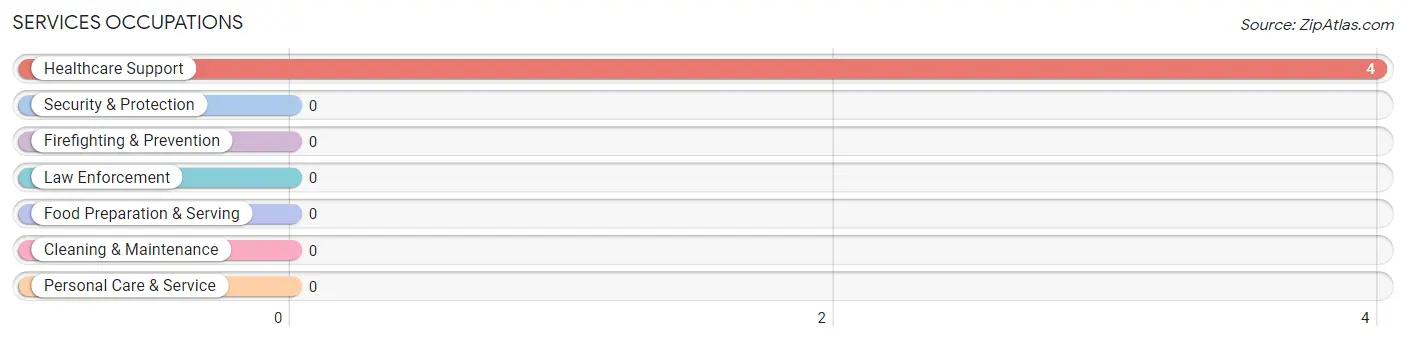
Services Occupations
The most common Services occupations in Mountain Mesa are , and Healthcare Support (4 | 6.7%).
Services Occupations by Sex
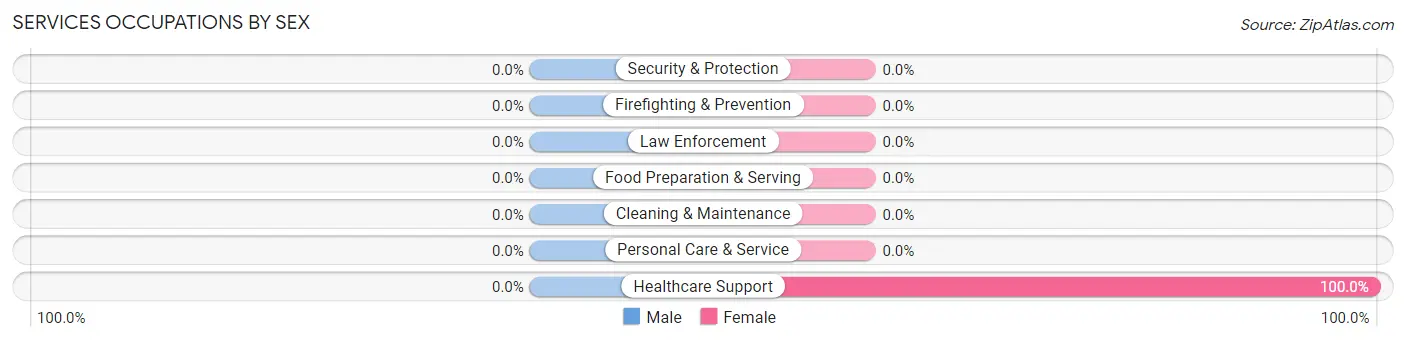
| Occupation | Male | Female |
| Healthcare Support | 0 (0.0%) | 4 (100.0%) |
| Security & Protection | 0 (0.0%) | 0 (0.0%) |
| Firefighting & Prevention | 0 (0.0%) | 0 (0.0%) |
| Law Enforcement | 0 (0.0%) | 0 (0.0%) |
| Food Preparation & Serving | 0 (0.0%) | 0 (0.0%) |
| Cleaning & Maintenance | 0 (0.0%) | 0 (0.0%) |
| Personal Care & Service | 0 (0.0%) | 0 (0.0%) |
| Total (Category) | 0 (0.0%) | 4 (100.0%) |
| Total (Overall) | 49 (81.7%) | 11 (18.3%) |
Sales and Office Occupations
Sales and Office Occupations by Sex
| Occupation | Male | Female |
| Sales & Related | 0 (0.0%) | 0 (0.0%) |
| Office & Administration | 0 (0.0%) | 0 (0.0%) |
| Total (Category) | 0 (0.0%) | 0 (0.0%) |
| Total (Overall) | 49 (81.7%) | 11 (18.3%) |
Natural Resources, Construction and Maintenance Occupations
The most common Natural Resources, Construction and Maintenance occupations in Mountain Mesa are , and Construction & Extraction (25 | 41.7%).
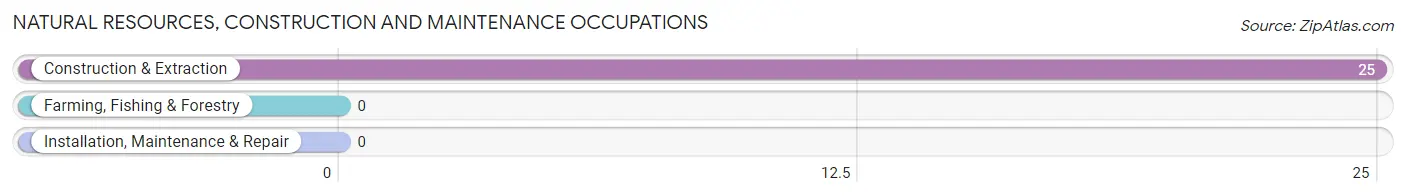
Natural Resources, Construction and Maintenance Occupations by Sex
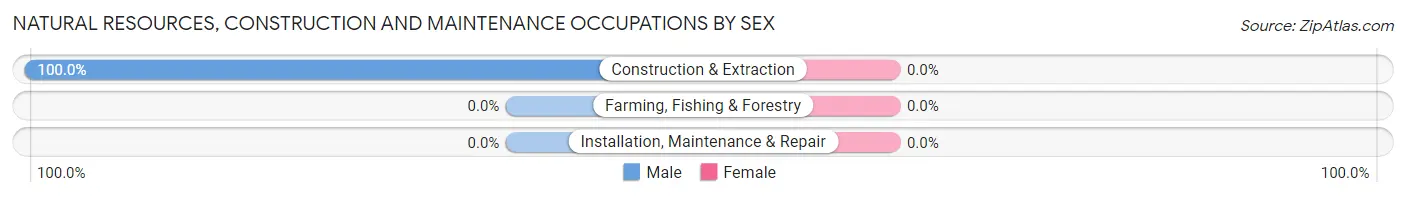
| Occupation | Male | Female |
| Farming, Fishing & Forestry | 0 (0.0%) | 0 (0.0%) |
| Construction & Extraction | 25 (100.0%) | 0 (0.0%) |
| Installation, Maintenance & Repair | 0 (0.0%) | 0 (0.0%) |
| Total (Category) | 25 (100.0%) | 0 (0.0%) |
| Total (Overall) | 49 (81.7%) | 11 (18.3%) |
Production, Transportation and Moving Occupations
Production, Transportation and Moving Occupations by Sex
| Occupation | Male | Female |
| Production | 0 (0.0%) | 0 (0.0%) |
| Transportation | 0 (0.0%) | 0 (0.0%) |
| Material Moving | 0 (0.0%) | 0 (0.0%) |
| Total (Category) | 0 (0.0%) | 0 (0.0%) |
| Total (Overall) | 49 (81.7%) | 11 (18.3%) |
Employment Industries by Sex in Mountain Mesa
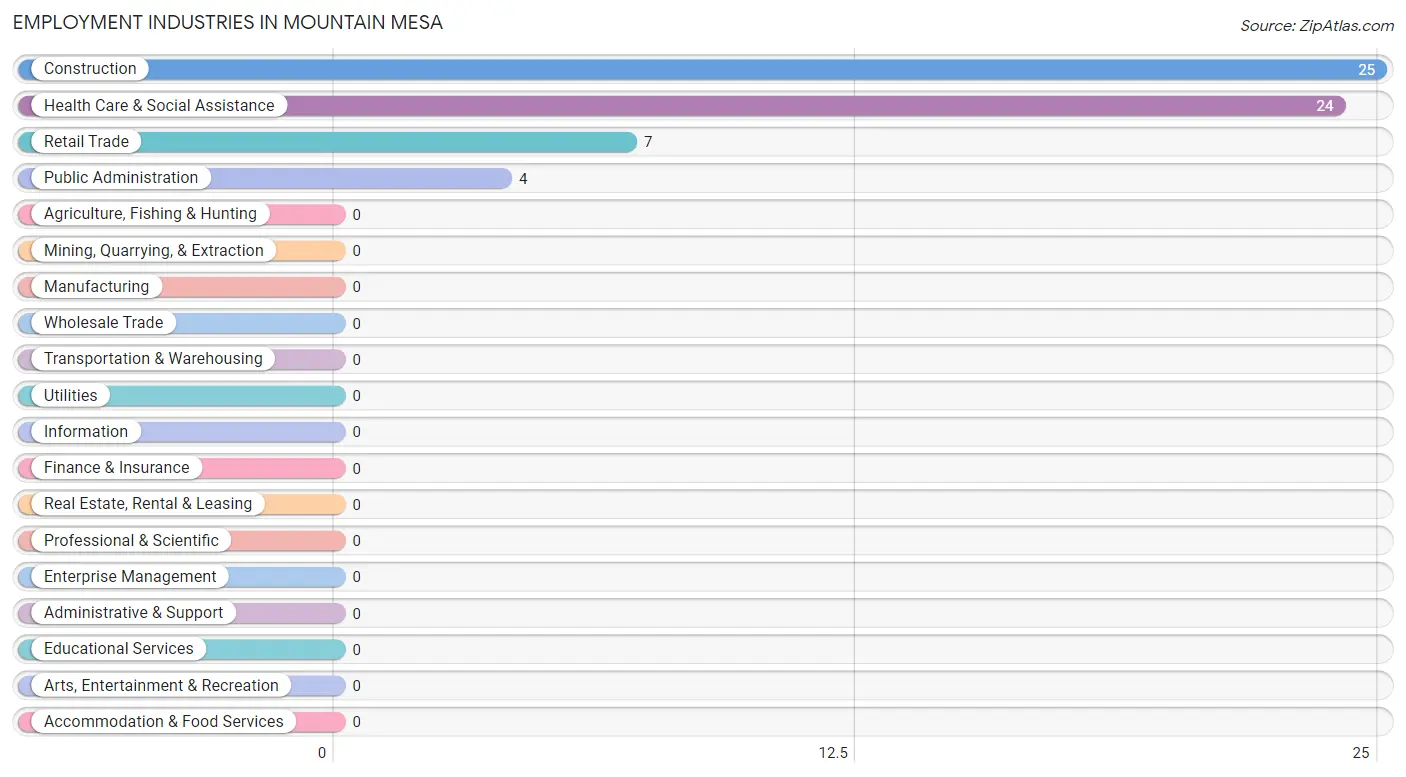
Employment Industries in Mountain Mesa
The major employment industries in Mountain Mesa include Construction (25 | 41.7%), Health Care & Social Assistance (24 | 40.0%), Retail Trade (7 | 11.7%), and Public Administration (4 | 6.7%).
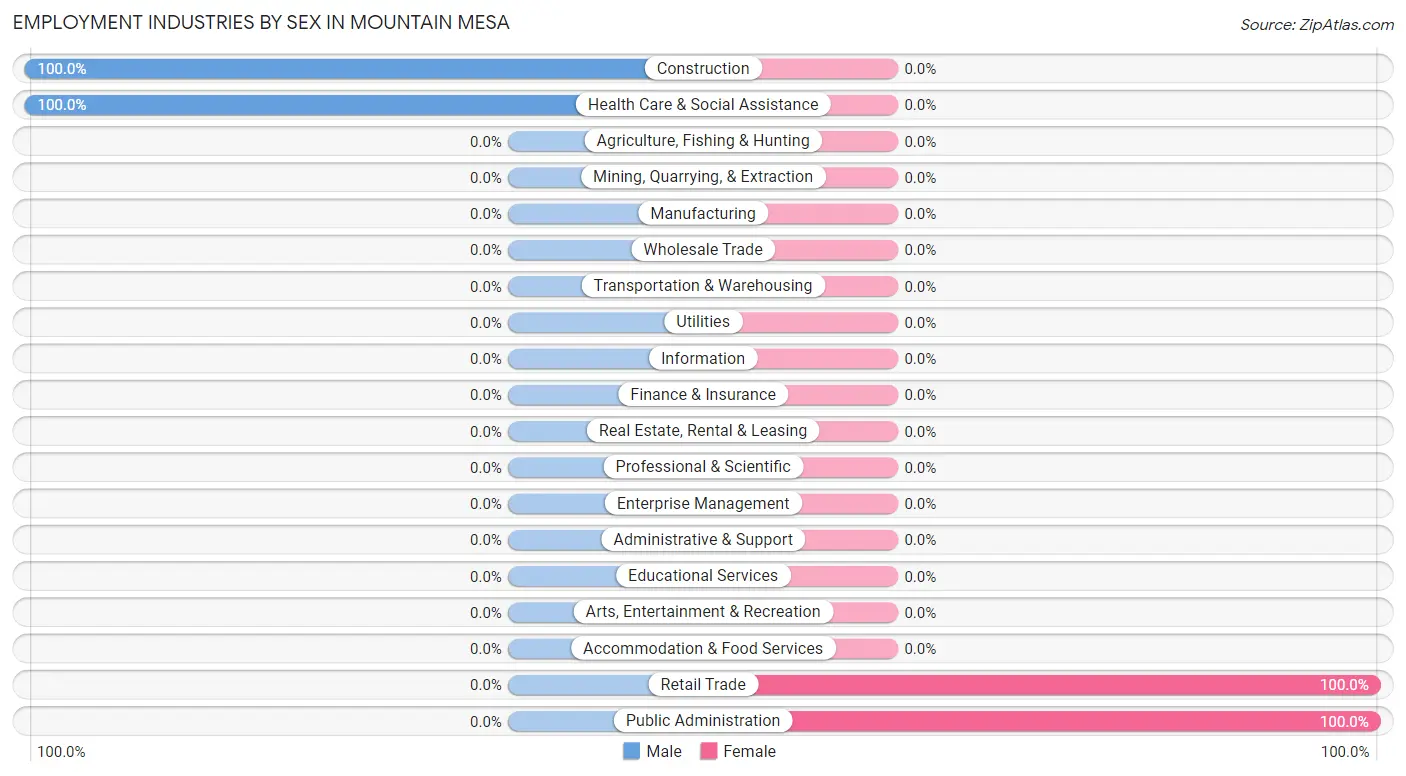
Employment Industries by Sex in Mountain Mesa
The Mountain Mesa industries that see more men than women are Construction (100.0%), and Health Care & Social Assistance (100.0%), whereas the industries that tend to have a higher number of women are Retail Trade (100.0%), and Public Administration (100.0%).
| Industry | Male | Female |
| Agriculture, Fishing & Hunting | 0 (0.0%) | 0 (0.0%) |
| Mining, Quarrying, & Extraction | 0 (0.0%) | 0 (0.0%) |
| Construction | 25 (100.0%) | 0 (0.0%) |
| Manufacturing | 0 (0.0%) | 0 (0.0%) |
| Wholesale Trade | 0 (0.0%) | 0 (0.0%) |
| Retail Trade | 0 (0.0%) | 7 (100.0%) |
| Transportation & Warehousing | 0 (0.0%) | 0 (0.0%) |
| Utilities | 0 (0.0%) | 0 (0.0%) |
| Information | 0 (0.0%) | 0 (0.0%) |
| Finance & Insurance | 0 (0.0%) | 0 (0.0%) |
| Real Estate, Rental & Leasing | 0 (0.0%) | 0 (0.0%) |
| Professional & Scientific | 0 (0.0%) | 0 (0.0%) |
| Enterprise Management | 0 (0.0%) | 0 (0.0%) |
| Administrative & Support | 0 (0.0%) | 0 (0.0%) |
| Educational Services | 0 (0.0%) | 0 (0.0%) |
| Health Care & Social Assistance | 24 (100.0%) | 0 (0.0%) |
| Arts, Entertainment & Recreation | 0 (0.0%) | 0 (0.0%) |
| Accommodation & Food Services | 0 (0.0%) | 0 (0.0%) |
| Public Administration | 0 (0.0%) | 4 (100.0%) |
| Total | 49 (81.7%) | 11 (18.3%) |
Education in Mountain Mesa
School Enrollment in Mountain Mesa
The most common levels of schooling among the 82 students in Mountain Mesa are kindergarten (29 | 35.4%), elementary school (29 | 35.4%), and college / undergraduate (24 | 29.3%).
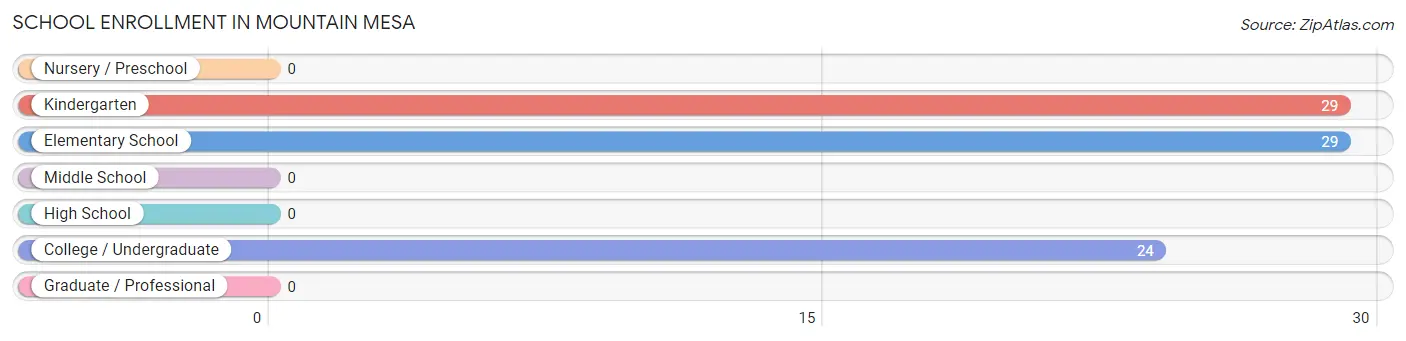
| School Level | # Students | % Students |
| Nursery / Preschool | 0 | 0.0% |
| Kindergarten | 29 | 35.4% |
| Elementary School | 29 | 35.4% |
| Middle School | 0 | 0.0% |
| High School | 0 | 0.0% |
| College / Undergraduate | 24 | 29.3% |
| Graduate / Professional | 0 | 0.0% |
| Total | 82 | 100.0% |
School Enrollment by Age by Funding Source in Mountain Mesa
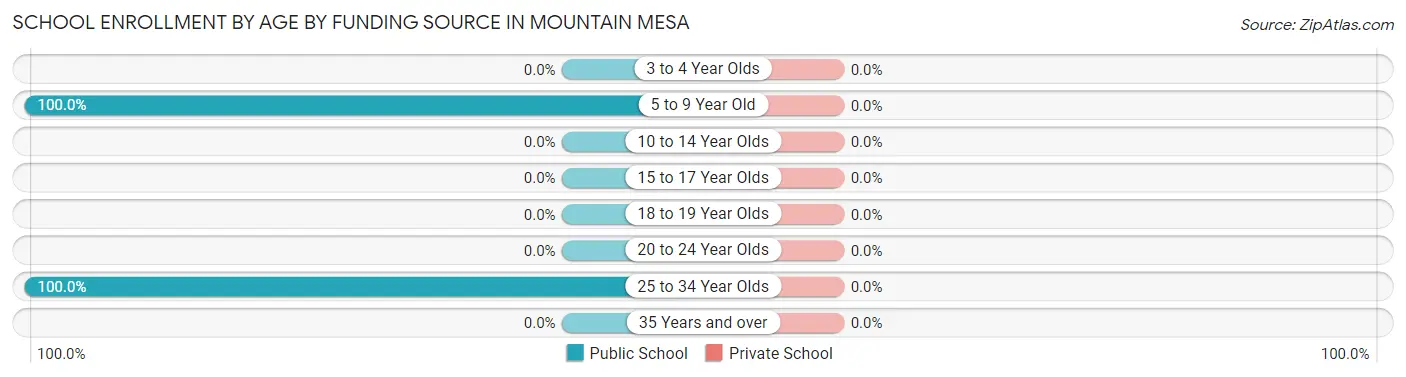
| Age Bracket | Public School | Private School |
| 3 to 4 Year Olds | 0 (0.0%) | 0 (0.0%) |
| 5 to 9 Year Old | 58 (100.0%) | 0 (0.0%) |
| 10 to 14 Year Olds | 0 (0.0%) | 0 (0.0%) |
| 15 to 17 Year Olds | 0 (0.0%) | 0 (0.0%) |
| 18 to 19 Year Olds | 0 (0.0%) | 0 (0.0%) |
| 20 to 24 Year Olds | 0 (0.0%) | 0 (0.0%) |
| 25 to 34 Year Olds | 24 (100.0%) | 0 (0.0%) |
| 35 Years and over | 0 (0.0%) | 0 (0.0%) |
| Total | 82 (100.0%) | 0 (0.0%) |
Educational Attainment by Field of Study in Mountain Mesa
Education (24 | 77.4%), business (5 | 16.1%), and visual & performing arts (2 | 6.5%) are the most common fields of study among 31 individuals in Mountain Mesa who have obtained a bachelor's degree or higher.
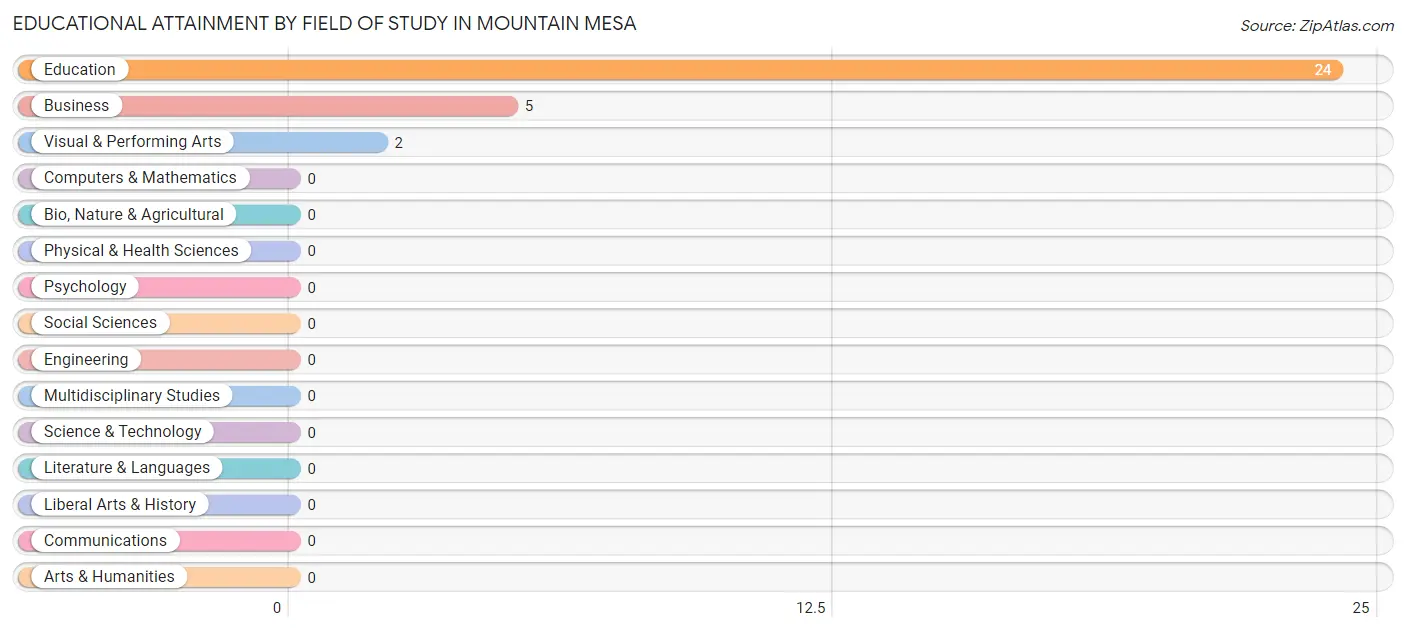
| Field of Study | # Graduates | % Graduates |
| Computers & Mathematics | 0 | 0.0% |
| Bio, Nature & Agricultural | 0 | 0.0% |
| Physical & Health Sciences | 0 | 0.0% |
| Psychology | 0 | 0.0% |
| Social Sciences | 0 | 0.0% |
| Engineering | 0 | 0.0% |
| Multidisciplinary Studies | 0 | 0.0% |
| Science & Technology | 0 | 0.0% |
| Business | 5 | 16.1% |
| Education | 24 | 77.4% |
| Literature & Languages | 0 | 0.0% |
| Liberal Arts & History | 0 | 0.0% |
| Visual & Performing Arts | 2 | 6.5% |
| Communications | 0 | 0.0% |
| Arts & Humanities | 0 | 0.0% |
| Total | 31 | 100.0% |
Transportation & Commute in Mountain Mesa
Vehicle Availability by Sex in Mountain Mesa
The most prevalent vehicle ownership categories in Mountain Mesa are males with 2 vehicles (25, accounting for 51.0%) and females with 2 vehicles (4, making up 227.3%).
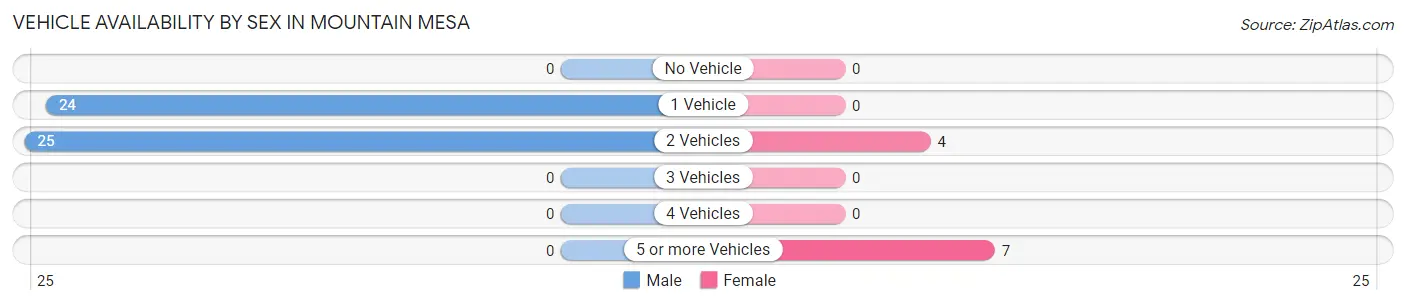
| Vehicles Available | Male | Female |
| No Vehicle | 0 (0.0%) | 0 (0.0%) |
| 1 Vehicle | 24 (49.0%) | 0 (0.0%) |
| 2 Vehicles | 25 (51.0%) | 4 (36.4%) |
| 3 Vehicles | 0 (0.0%) | 0 (0.0%) |
| 4 Vehicles | 0 (0.0%) | 0 (0.0%) |
| 5 or more Vehicles | 0 (0.0%) | 7 (63.6%) |
| Total | 49 (100.0%) | 11 (100.0%) |
Commute Time in Mountain Mesa
The most frequently occuring commute durations in Mountain Mesa are 5 to 9 minutes (24 commuters, 77.4%), 10 to 14 minutes (7 commuters, 22.6%), and less than 5 minutes (0 commuters, 0.0%).
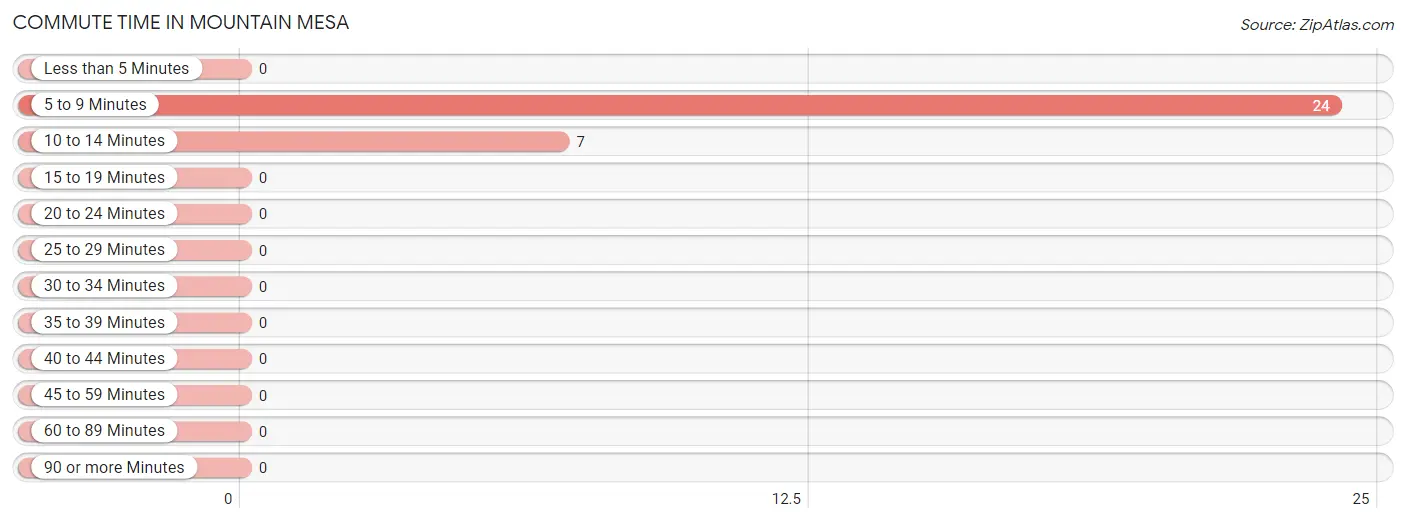
| Commute Time | # Commuters | % Commuters |
| Less than 5 Minutes | 0 | 0.0% |
| 5 to 9 Minutes | 24 | 77.4% |
| 10 to 14 Minutes | 7 | 22.6% |
| 15 to 19 Minutes | 0 | 0.0% |
| 20 to 24 Minutes | 0 | 0.0% |
| 25 to 29 Minutes | 0 | 0.0% |
| 30 to 34 Minutes | 0 | 0.0% |
| 35 to 39 Minutes | 0 | 0.0% |
| 40 to 44 Minutes | 0 | 0.0% |
| 45 to 59 Minutes | 0 | 0.0% |
| 60 to 89 Minutes | 0 | 0.0% |
| 90 or more Minutes | 0 | 0.0% |
Commute Time by Sex in Mountain Mesa
The most common commute times in Mountain Mesa are 5 to 9 minutes (24 commuters, 100.0%) for males and 10 to 14 minutes (7 commuters, 100.0%) for females.
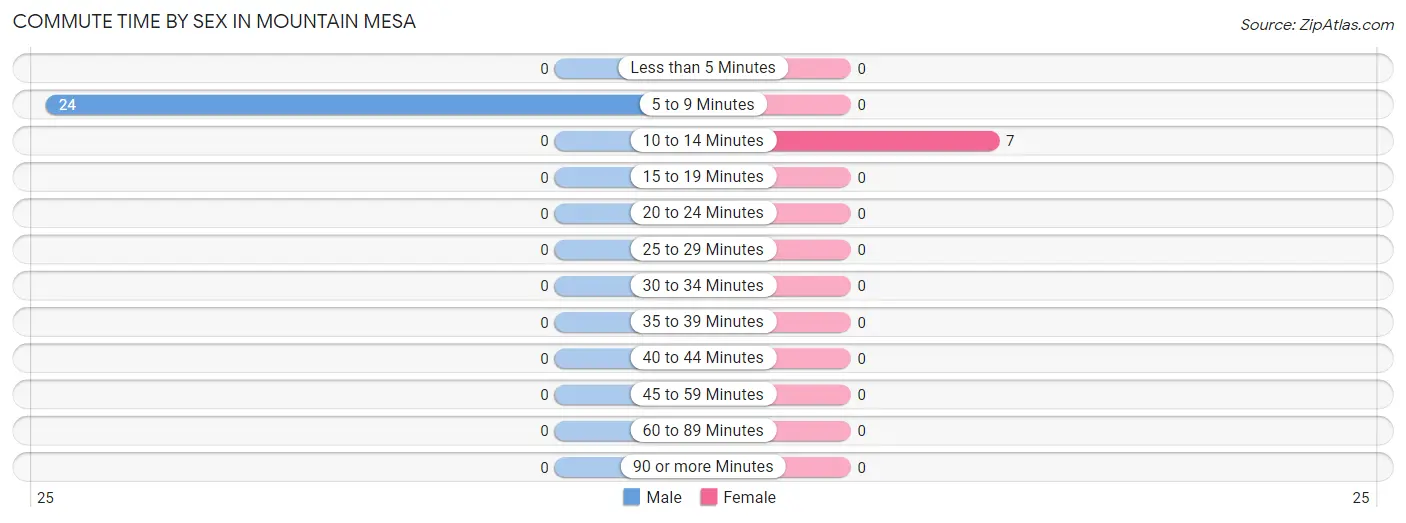
| Commute Time | Male | Female |
| Less than 5 Minutes | 0 (0.0%) | 0 (0.0%) |
| 5 to 9 Minutes | 24 (100.0%) | 0 (0.0%) |
| 10 to 14 Minutes | 0 (0.0%) | 7 (100.0%) |
| 15 to 19 Minutes | 0 (0.0%) | 0 (0.0%) |
| 20 to 24 Minutes | 0 (0.0%) | 0 (0.0%) |
| 25 to 29 Minutes | 0 (0.0%) | 0 (0.0%) |
| 30 to 34 Minutes | 0 (0.0%) | 0 (0.0%) |
| 35 to 39 Minutes | 0 (0.0%) | 0 (0.0%) |
| 40 to 44 Minutes | 0 (0.0%) | 0 (0.0%) |
| 45 to 59 Minutes | 0 (0.0%) | 0 (0.0%) |
| 60 to 89 Minutes | 0 (0.0%) | 0 (0.0%) |
| 90 or more Minutes | 0 (0.0%) | 0 (0.0%) |
Time of Departure to Work by Sex in Mountain Mesa
The most frequent times of departure to work in Mountain Mesa are 8:30 AM to 8:59 AM (24, 100.0%) for males and 7:30 AM to 7:59 AM (7, 100.0%) for females.
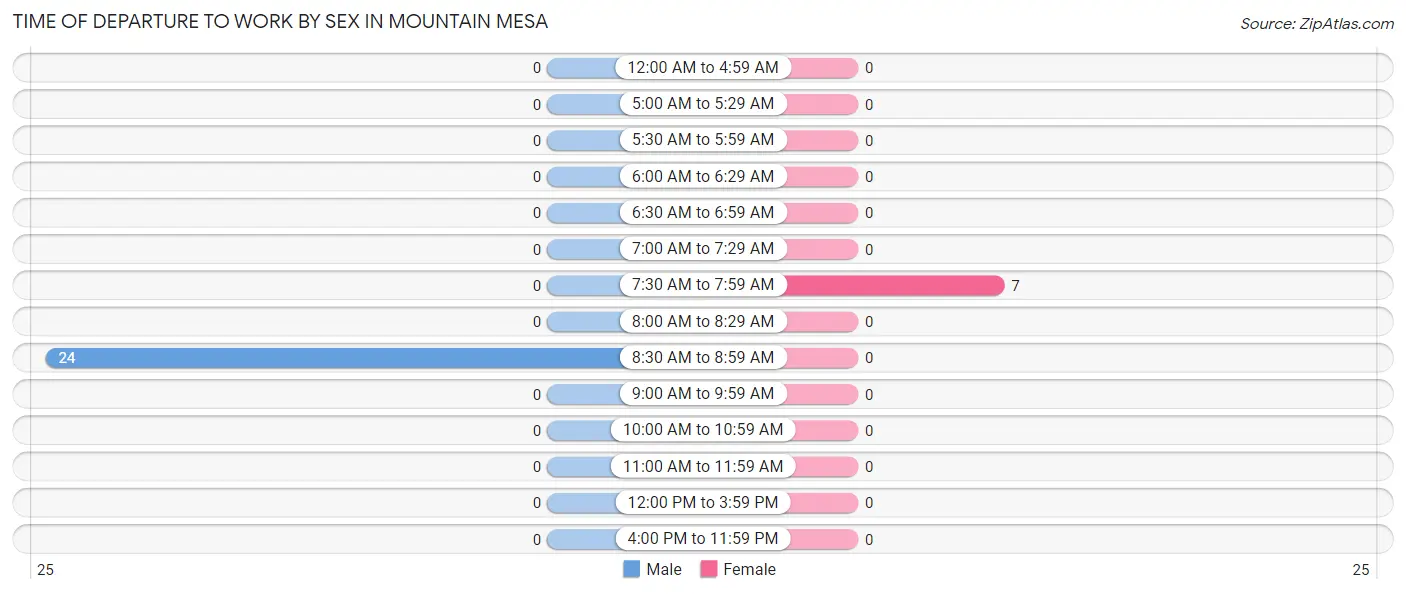
| Time of Departure | Male | Female |
| 12:00 AM to 4:59 AM | 0 (0.0%) | 0 (0.0%) |
| 5:00 AM to 5:29 AM | 0 (0.0%) | 0 (0.0%) |
| 5:30 AM to 5:59 AM | 0 (0.0%) | 0 (0.0%) |
| 6:00 AM to 6:29 AM | 0 (0.0%) | 0 (0.0%) |
| 6:30 AM to 6:59 AM | 0 (0.0%) | 0 (0.0%) |
| 7:00 AM to 7:29 AM | 0 (0.0%) | 0 (0.0%) |
| 7:30 AM to 7:59 AM | 0 (0.0%) | 7 (100.0%) |
| 8:00 AM to 8:29 AM | 0 (0.0%) | 0 (0.0%) |
| 8:30 AM to 8:59 AM | 24 (100.0%) | 0 (0.0%) |
| 9:00 AM to 9:59 AM | 0 (0.0%) | 0 (0.0%) |
| 10:00 AM to 10:59 AM | 0 (0.0%) | 0 (0.0%) |
| 11:00 AM to 11:59 AM | 0 (0.0%) | 0 (0.0%) |
| 12:00 PM to 3:59 PM | 0 (0.0%) | 0 (0.0%) |
| 4:00 PM to 11:59 PM | 0 (0.0%) | 0 (0.0%) |
| Total | 24 (100.0%) | 7 (100.0%) |
Housing Occupancy in Mountain Mesa
Occupancy by Ownership in Mountain Mesa
Of the total 253 dwellings in Mountain Mesa, owner-occupied units account for 224 (88.5%), while renter-occupied units make up 29 (11.5%).
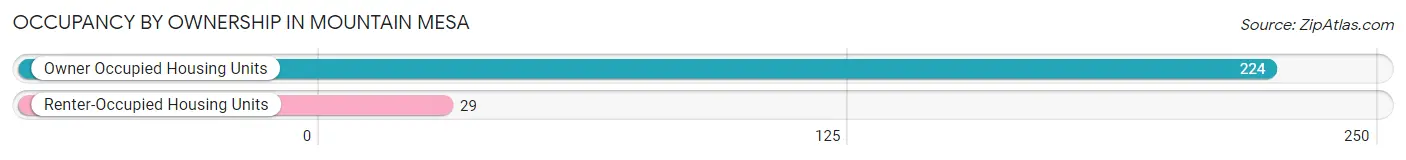
| Occupancy | # Housing Units | % Housing Units |
| Owner Occupied Housing Units | 224 | 88.5% |
| Renter-Occupied Housing Units | 29 | 11.5% |
| Total Occupied Housing Units | 253 | 100.0% |
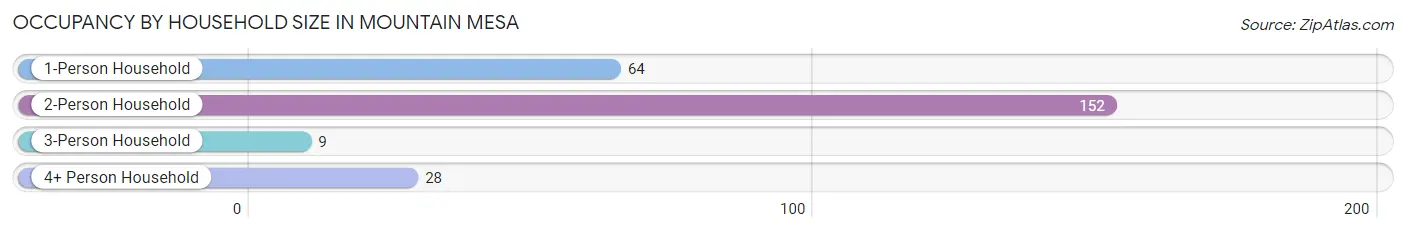
Occupancy by Household Size in Mountain Mesa
| Household Size | # Housing Units | % Housing Units |
| 1-Person Household | 64 | 25.3% |
| 2-Person Household | 152 | 60.1% |
| 3-Person Household | 9 | 3.6% |
| 4+ Person Household | 28 | 11.1% |
| Total Housing Units | 253 | 100.0% |
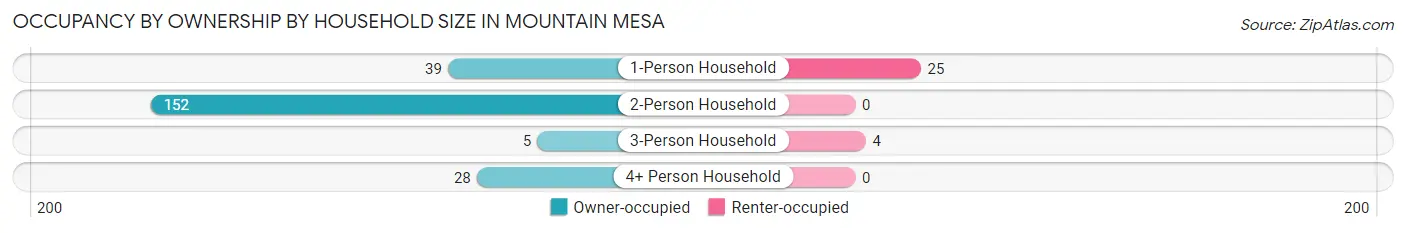
Occupancy by Ownership by Household Size in Mountain Mesa
| Household Size | Owner-occupied | Renter-occupied |
| 1-Person Household | 39 (60.9%) | 25 (39.1%) |
| 2-Person Household | 152 (100.0%) | 0 (0.0%) |
| 3-Person Household | 5 (55.6%) | 4 (44.4%) |
| 4+ Person Household | 28 (100.0%) | 0 (0.0%) |
| Total Housing Units | 224 (88.5%) | 29 (11.5%) |
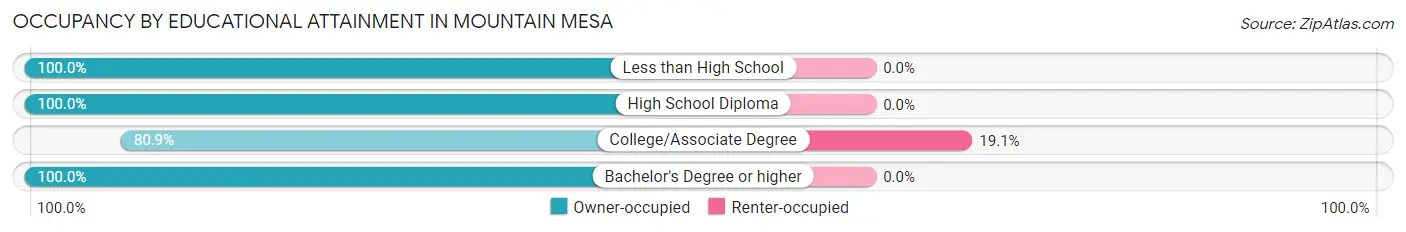
Occupancy by Educational Attainment in Mountain Mesa
| Household Size | Owner-occupied | Renter-occupied |
| Less than High School | 18 (100.0%) | 0 (0.0%) |
| High School Diploma | 73 (100.0%) | 0 (0.0%) |
| College/Associate Degree | 123 (80.9%) | 29 (19.1%) |
| Bachelor's Degree or higher | 10 (100.0%) | 0 (0.0%) |
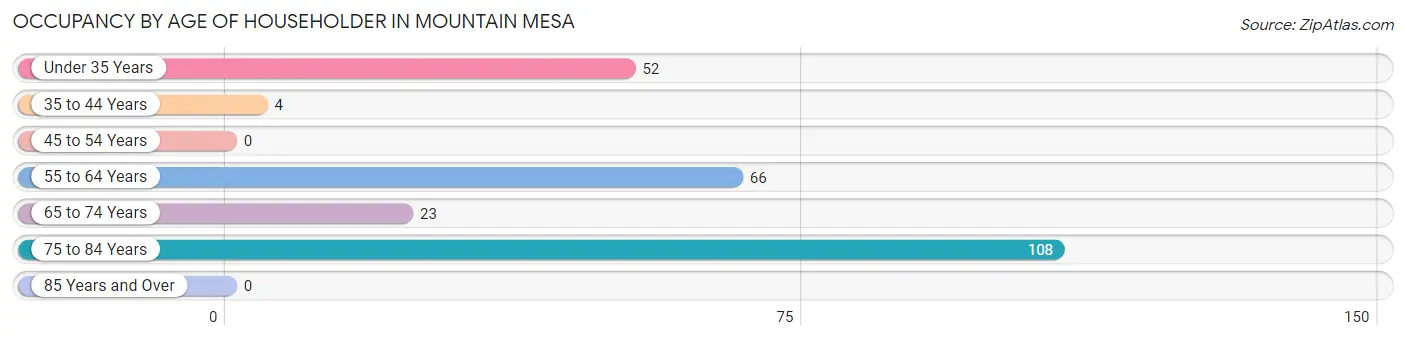
Occupancy by Age of Householder in Mountain Mesa
| Age Bracket | # Households | % Households |
| Under 35 Years | 52 | 20.5% |
| 35 to 44 Years | 4 | 1.6% |
| 45 to 54 Years | 0 | 0.0% |
| 55 to 64 Years | 66 | 26.1% |
| 65 to 74 Years | 23 | 9.1% |
| 75 to 84 Years | 108 | 42.7% |
| 85 Years and Over | 0 | 0.0% |
| Total | 253 | 100.0% |
Housing Finances in Mountain Mesa
Median Income by Occupancy in Mountain Mesa
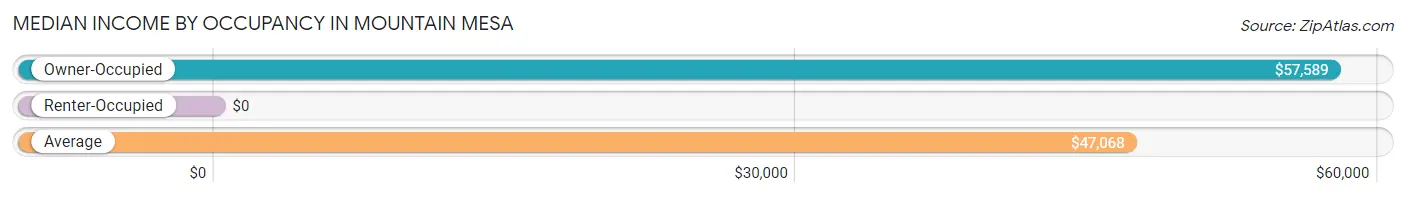
| Occupancy Type | # Households | Median Income |
| Owner-Occupied | 224 (88.5%) | $57,589 |
| Renter-Occupied | 29 (11.5%) | $0 |
| Average | 253 (100.0%) | $47,068 |
Occupancy by Householder Income Bracket in Mountain Mesa
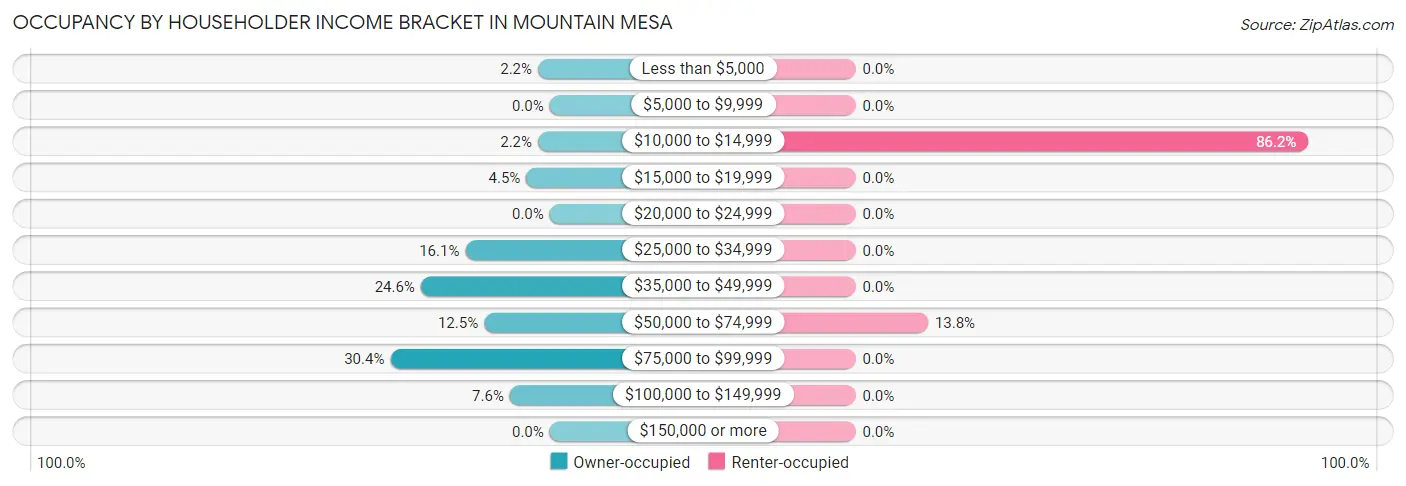
| Income Bracket | Owner-occupied | Renter-occupied |
| Less than $5,000 | 5 (2.2%) | 0 (0.0%) |
| $5,000 to $9,999 | 0 (0.0%) | 0 (0.0%) |
| $10,000 to $14,999 | 5 (2.2%) | 25 (86.2%) |
| $15,000 to $19,999 | 10 (4.5%) | 0 (0.0%) |
| $20,000 to $24,999 | 0 (0.0%) | 0 (0.0%) |
| $25,000 to $34,999 | 36 (16.1%) | 0 (0.0%) |
| $35,000 to $49,999 | 55 (24.5%) | 0 (0.0%) |
| $50,000 to $74,999 | 28 (12.5%) | 4 (13.8%) |
| $75,000 to $99,999 | 68 (30.4%) | 0 (0.0%) |
| $100,000 to $149,999 | 17 (7.6%) | 0 (0.0%) |
| $150,000 or more | 0 (0.0%) | 0 (0.0%) |
| Total | 224 (100.0%) | 29 (100.0%) |
Monthly Housing Cost Tiers in Mountain Mesa
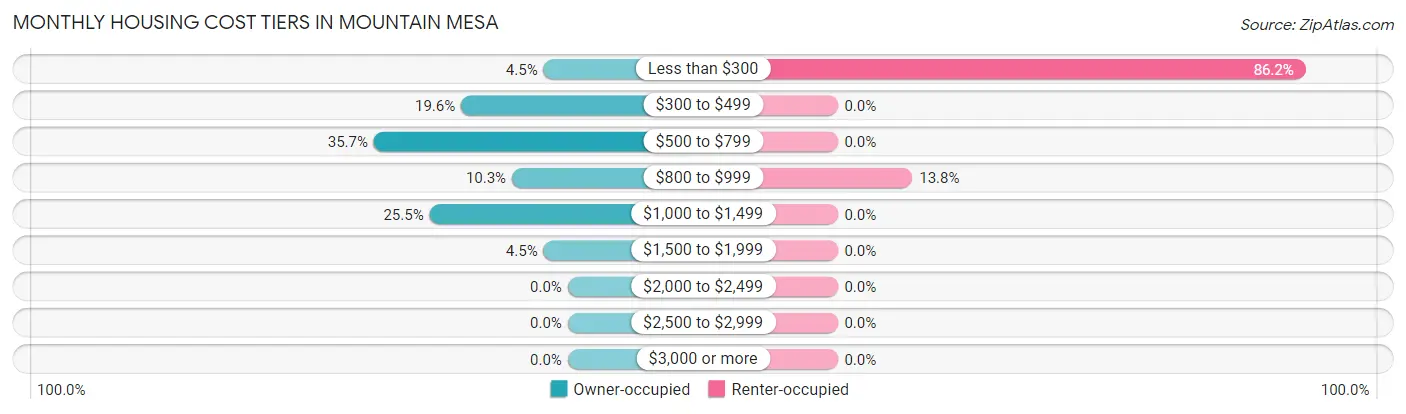
| Monthly Cost | Owner-occupied | Renter-occupied |
| Less than $300 | 10 (4.5%) | 25 (86.2%) |
| $300 to $499 | 44 (19.6%) | 0 (0.0%) |
| $500 to $799 | 80 (35.7%) | 0 (0.0%) |
| $800 to $999 | 23 (10.3%) | 4 (13.8%) |
| $1,000 to $1,499 | 57 (25.5%) | 0 (0.0%) |
| $1,500 to $1,999 | 10 (4.5%) | 0 (0.0%) |
| $2,000 to $2,499 | 0 (0.0%) | 0 (0.0%) |
| $2,500 to $2,999 | 0 (0.0%) | 0 (0.0%) |
| $3,000 or more | 0 (0.0%) | 0 (0.0%) |
| Total | 224 (100.0%) | 29 (100.0%) |
Physical Housing Characteristics in Mountain Mesa
Housing Structures in Mountain Mesa
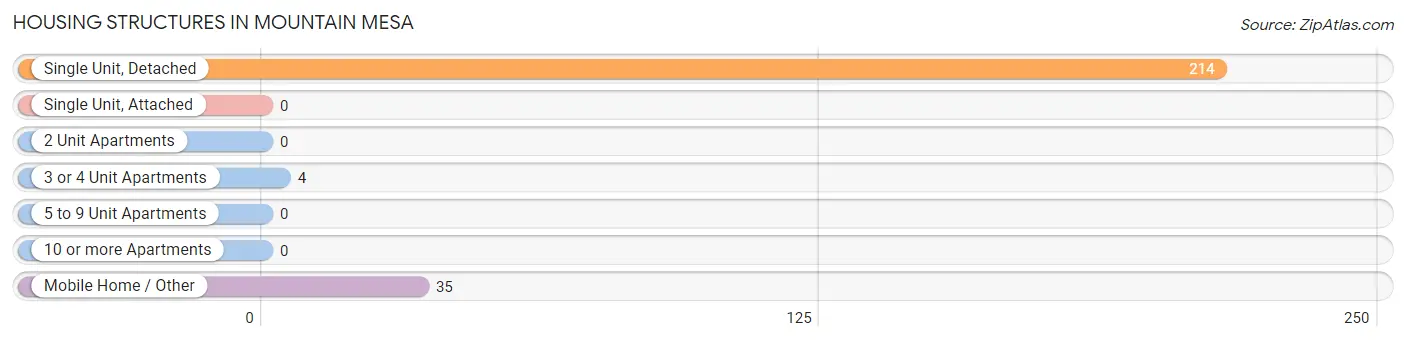
| Structure Type | # Housing Units | % Housing Units |
| Single Unit, Detached | 214 | 84.6% |
| Single Unit, Attached | 0 | 0.0% |
| 2 Unit Apartments | 0 | 0.0% |
| 3 or 4 Unit Apartments | 4 | 1.6% |
| 5 to 9 Unit Apartments | 0 | 0.0% |
| 10 or more Apartments | 0 | 0.0% |
| Mobile Home / Other | 35 | 13.8% |
| Total | 253 | 100.0% |
Housing Structures by Occupancy in Mountain Mesa
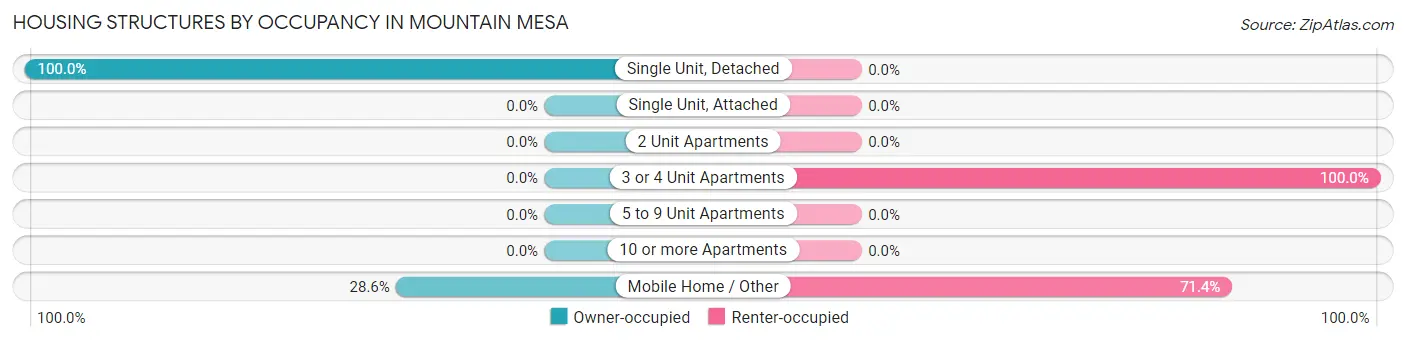
| Structure Type | Owner-occupied | Renter-occupied |
| Single Unit, Detached | 214 (100.0%) | 0 (0.0%) |
| Single Unit, Attached | 0 (0.0%) | 0 (0.0%) |
| 2 Unit Apartments | 0 (0.0%) | 0 (0.0%) |
| 3 or 4 Unit Apartments | 0 (0.0%) | 4 (100.0%) |
| 5 to 9 Unit Apartments | 0 (0.0%) | 0 (0.0%) |
| 10 or more Apartments | 0 (0.0%) | 0 (0.0%) |
| Mobile Home / Other | 10 (28.6%) | 25 (71.4%) |
| Total | 224 (88.5%) | 29 (11.5%) |
Housing Structures by Number of Rooms in Mountain Mesa
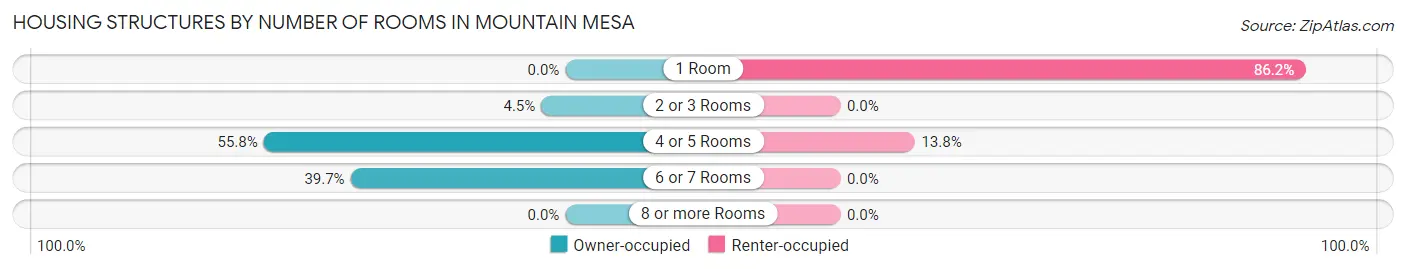
| Number of Rooms | Owner-occupied | Renter-occupied |
| 1 Room | 0 (0.0%) | 25 (86.2%) |
| 2 or 3 Rooms | 10 (4.5%) | 0 (0.0%) |
| 4 or 5 Rooms | 125 (55.8%) | 4 (13.8%) |
| 6 or 7 Rooms | 89 (39.7%) | 0 (0.0%) |
| 8 or more Rooms | 0 (0.0%) | 0 (0.0%) |
| Total | 224 (100.0%) | 29 (100.0%) |
Housing Structure by Heating Type in Mountain Mesa
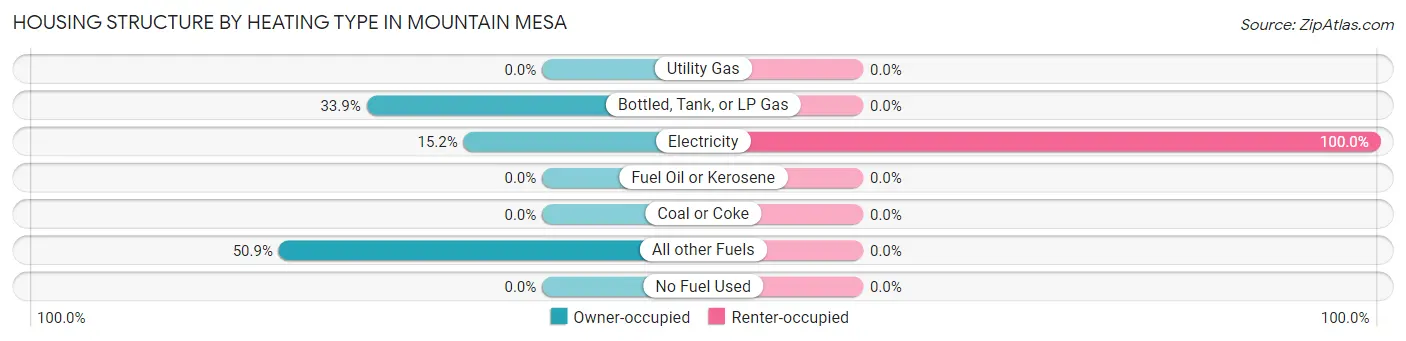
| Heating Type | Owner-occupied | Renter-occupied |
| Utility Gas | 0 (0.0%) | 0 (0.0%) |
| Bottled, Tank, or LP Gas | 76 (33.9%) | 0 (0.0%) |
| Electricity | 34 (15.2%) | 29 (100.0%) |
| Fuel Oil or Kerosene | 0 (0.0%) | 0 (0.0%) |
| Coal or Coke | 0 (0.0%) | 0 (0.0%) |
| All other Fuels | 114 (50.9%) | 0 (0.0%) |
| No Fuel Used | 0 (0.0%) | 0 (0.0%) |
| Total | 224 (100.0%) | 29 (100.0%) |
Household Vehicle Usage in Mountain Mesa
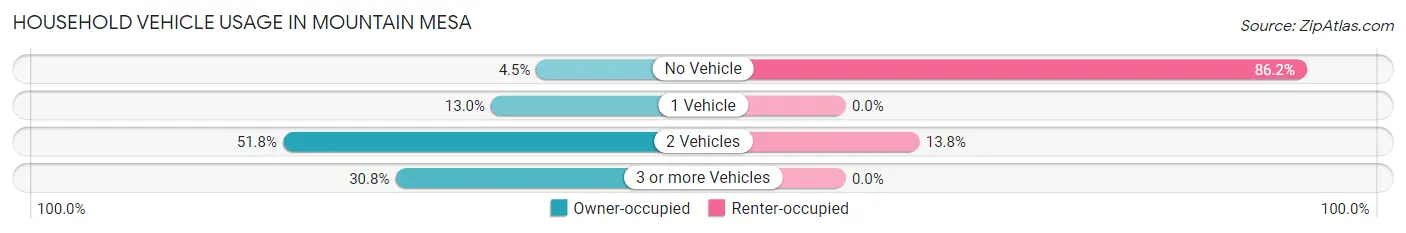
| Vehicles per Household | Owner-occupied | Renter-occupied |
| No Vehicle | 10 (4.5%) | 25 (86.2%) |
| 1 Vehicle | 29 (13.0%) | 0 (0.0%) |
| 2 Vehicles | 116 (51.8%) | 4 (13.8%) |
| 3 or more Vehicles | 69 (30.8%) | 0 (0.0%) |
| Total | 224 (100.0%) | 29 (100.0%) |
Real Estate & Mortgages in Mountain Mesa
Real Estate and Mortgage Overview in Mountain Mesa
| Characteristic | Without Mortgage | With Mortgage |
| Housing Units | 139 | 85 |
| Median Property Value | $209,500 | $193,000 |
| Median Household Income | - | - |
| Monthly Housing Costs | $621 | $0 |
| Real Estate Taxes | $1,640 | $0 |
Property Value by Mortgage Status in Mountain Mesa
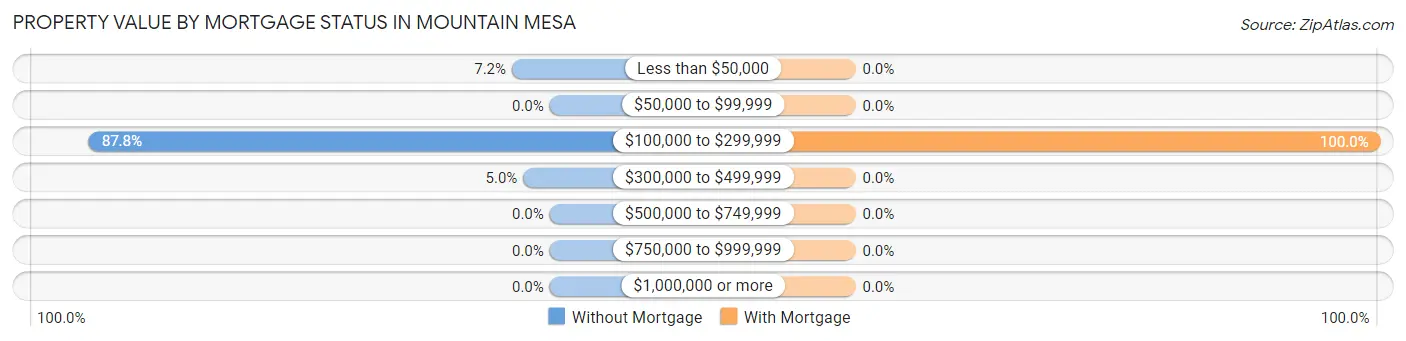
| Property Value | Without Mortgage | With Mortgage |
| Less than $50,000 | 10 (7.2%) | 0 (0.0%) |
| $50,000 to $99,999 | 0 (0.0%) | 0 (0.0%) |
| $100,000 to $299,999 | 122 (87.8%) | 85 (100.0%) |
| $300,000 to $499,999 | 7 (5.0%) | 0 (0.0%) |
| $500,000 to $749,999 | 0 (0.0%) | 0 (0.0%) |
| $750,000 to $999,999 | 0 (0.0%) | 0 (0.0%) |
| $1,000,000 or more | 0 (0.0%) | 0 (0.0%) |
| Total | 139 (100.0%) | 85 (100.0%) |
Household Income by Mortgage Status in Mountain Mesa
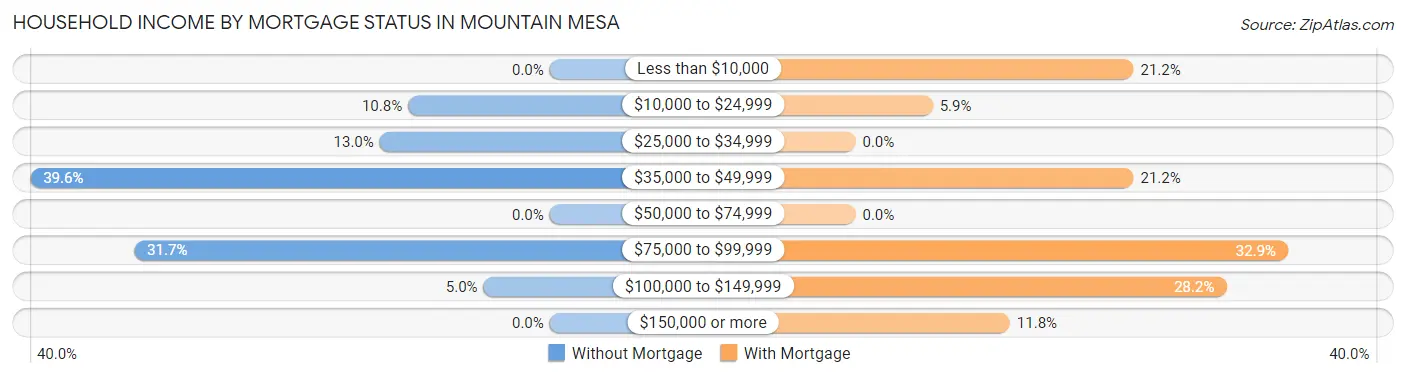
| Household Income | Without Mortgage | With Mortgage |
| Less than $10,000 | 0 (0.0%) | 18 (21.2%) |
| $10,000 to $24,999 | 15 (10.8%) | 5 (5.9%) |
| $25,000 to $34,999 | 18 (13.0%) | 0 (0.0%) |
| $35,000 to $49,999 | 55 (39.6%) | 18 (21.2%) |
| $50,000 to $74,999 | 0 (0.0%) | 0 (0.0%) |
| $75,000 to $99,999 | 44 (31.7%) | 28 (32.9%) |
| $100,000 to $149,999 | 7 (5.0%) | 24 (28.2%) |
| $150,000 or more | 0 (0.0%) | 10 (11.8%) |
| Total | 139 (100.0%) | 85 (100.0%) |
Property Value to Household Income Ratio in Mountain Mesa
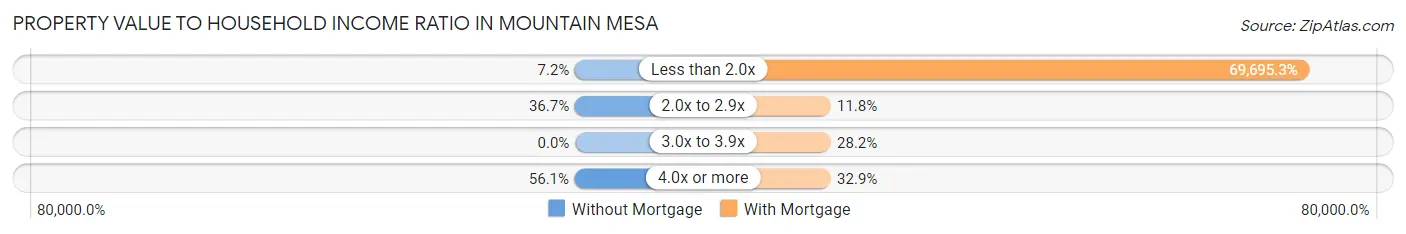
| Value-to-Income Ratio | Without Mortgage | With Mortgage |
| Less than 2.0x | 10 (7.2%) | 59,241 (69,695.3%) |
| 2.0x to 2.9x | 51 (36.7%) | 10 (11.8%) |
| 3.0x to 3.9x | 0 (0.0%) | 24 (28.2%) |
| 4.0x or more | 78 (56.1%) | 28 (32.9%) |
| Total | 139 (100.0%) | 85 (100.0%) |
Real Estate Taxes by Mortgage Status in Mountain Mesa
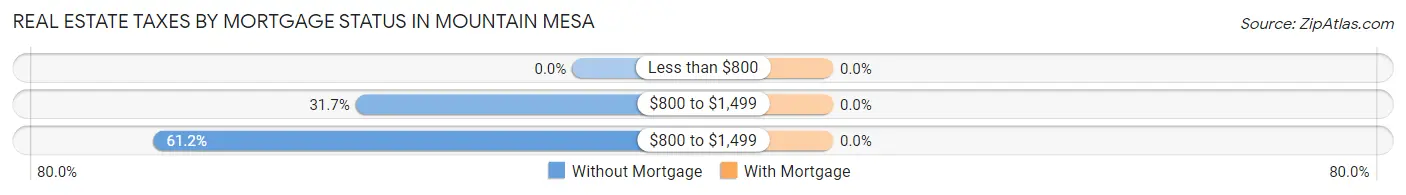
| Property Taxes | Without Mortgage | With Mortgage |
| Less than $800 | 0 (0.0%) | 0 (0.0%) |
| $800 to $1,499 | 44 (31.7%) | 0 (0.0%) |
| $800 to $1,499 | 85 (61.2%) | 0 (0.0%) |
| Total | 139 (100.0%) | 85 (100.0%) |
Health & Disability in Mountain Mesa
Health Insurance Coverage by Age in Mountain Mesa
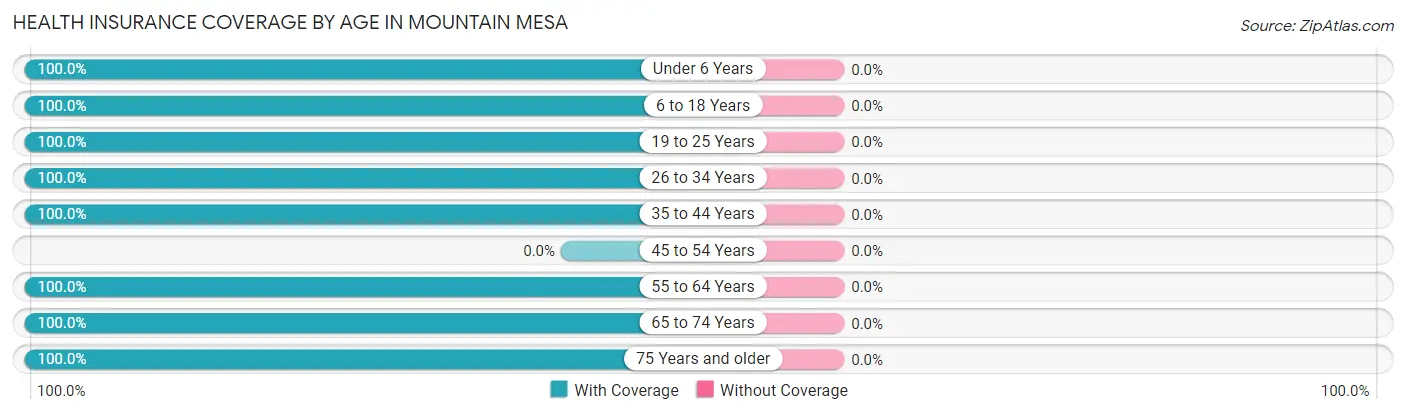
| Age Bracket | With Coverage | Without Coverage |
| Under 6 Years | 29 (100.0%) | 0 (0.0%) |
| 6 to 18 Years | 29 (100.0%) | 0 (0.0%) |
| 19 to 25 Years | 33 (100.0%) | 0 (0.0%) |
| 26 to 34 Years | 53 (100.0%) | 0 (0.0%) |
| 35 to 44 Years | 4 (100.0%) | 0 (0.0%) |
| 45 to 54 Years | 0 (0.0%) | 0 (0.0%) |
| 55 to 64 Years | 90 (100.0%) | 0 (0.0%) |
| 65 to 74 Years | 104 (100.0%) | 0 (0.0%) |
| 75 Years and older | 169 (100.0%) | 0 (0.0%) |
| Total | 511 (100.0%) | 0 (0.0%) |
Health Insurance Coverage by Citizenship Status in Mountain Mesa
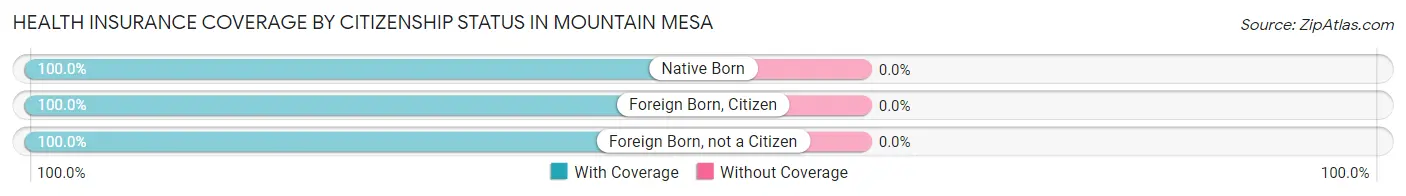
| Citizenship Status | With Coverage | Without Coverage |
| Native Born | 29 (100.0%) | 0 (0.0%) |
| Foreign Born, Citizen | 29 (100.0%) | 0 (0.0%) |
| Foreign Born, not a Citizen | 33 (100.0%) | 0 (0.0%) |
Health Insurance Coverage by Household Income in Mountain Mesa
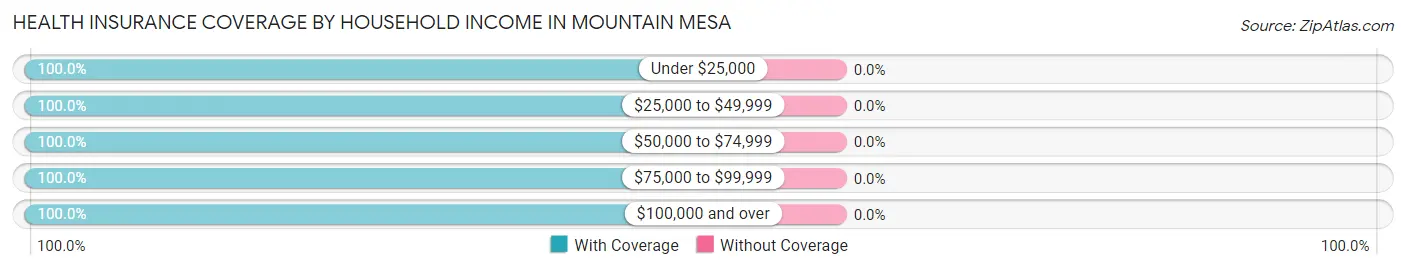
| Household Income | With Coverage | Without Coverage |
| Under $25,000 | 62 (100.0%) | 0 (0.0%) |
| $25,000 to $49,999 | 179 (100.0%) | 0 (0.0%) |
| $50,000 to $74,999 | 124 (100.0%) | 0 (0.0%) |
| $75,000 to $99,999 | 114 (100.0%) | 0 (0.0%) |
| $100,000 and over | 32 (100.0%) | 0 (0.0%) |
Public vs Private Health Insurance Coverage by Age in Mountain Mesa
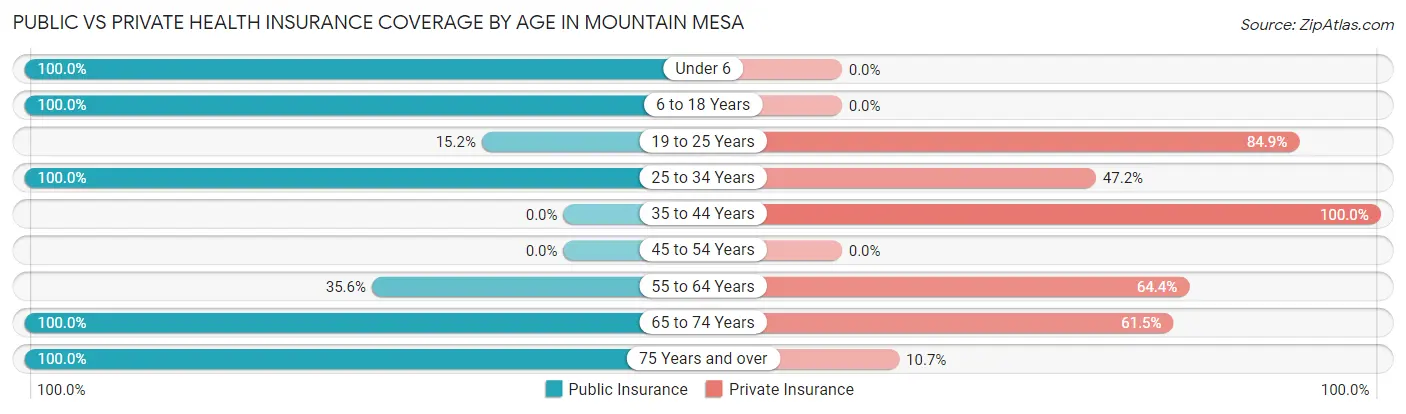
| Age Bracket | Public Insurance | Private Insurance |
| Under 6 | 29 (100.0%) | 0 (0.0%) |
| 6 to 18 Years | 29 (100.0%) | 0 (0.0%) |
| 19 to 25 Years | 5 (15.1%) | 28 (84.9%) |
| 25 to 34 Years | 53 (100.0%) | 25 (47.2%) |
| 35 to 44 Years | 0 (0.0%) | 4 (100.0%) |
| 45 to 54 Years | 0 (0.0%) | 0 (0.0%) |
| 55 to 64 Years | 32 (35.6%) | 58 (64.4%) |
| 65 to 74 Years | 104 (100.0%) | 64 (61.5%) |
| 75 Years and over | 169 (100.0%) | 18 (10.6%) |
| Total | 421 (82.4%) | 197 (38.6%) |
Disability Status by Sex by Age in Mountain Mesa
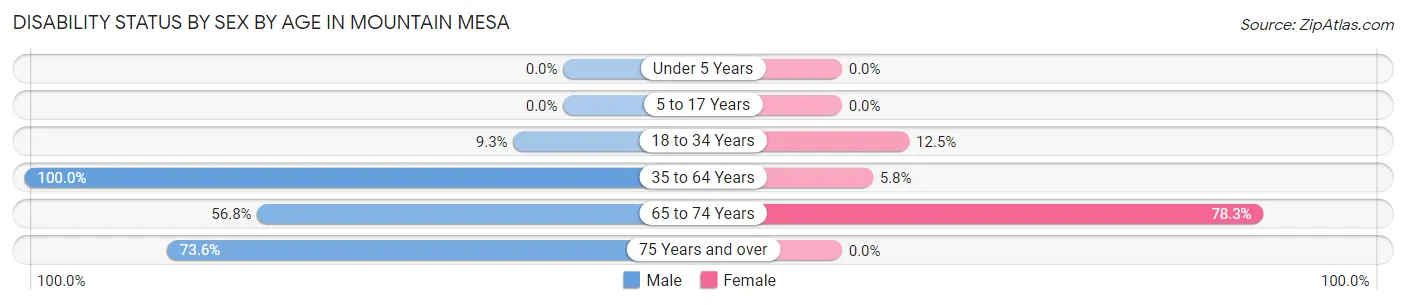
| Age Bracket | Male | Female |
| Under 5 Years | 0 (0.0%) | 0 (0.0%) |
| 5 to 17 Years | 0 (0.0%) | 0 (0.0%) |
| 18 to 34 Years | 5 (9.3%) | 4 (12.5%) |
| 35 to 64 Years | 7 (100.0%) | 5 (5.8%) |
| 65 to 74 Years | 46 (56.8%) | 18 (78.3%) |
| 75 Years and over | 78 (73.6%) | 0 (0.0%) |
Disability Class by Sex by Age in Mountain Mesa
Disability Class: Hearing Difficulty
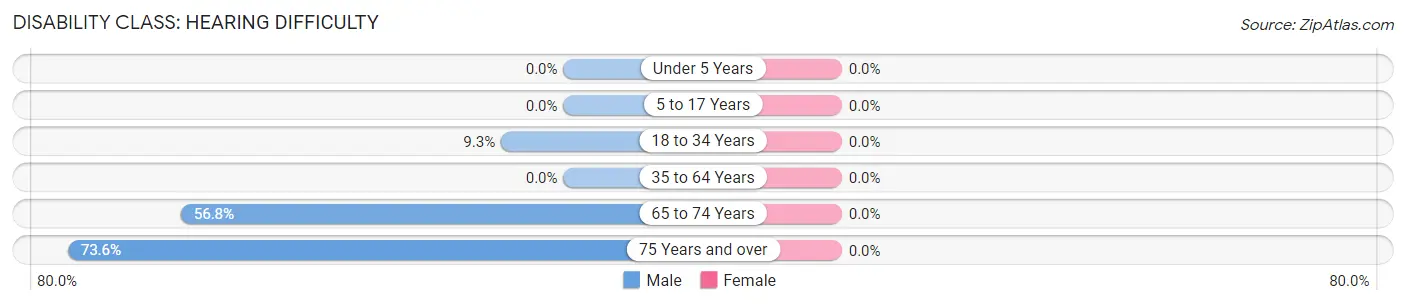
| Age Bracket | Male | Female |
| Under 5 Years | 0 (0.0%) | 0 (0.0%) |
| 5 to 17 Years | 0 (0.0%) | 0 (0.0%) |
| 18 to 34 Years | 5 (9.3%) | 0 (0.0%) |
| 35 to 64 Years | 0 (0.0%) | 0 (0.0%) |
| 65 to 74 Years | 46 (56.8%) | 0 (0.0%) |
| 75 Years and over | 78 (73.6%) | 0 (0.0%) |
Disability Class: Vision Difficulty
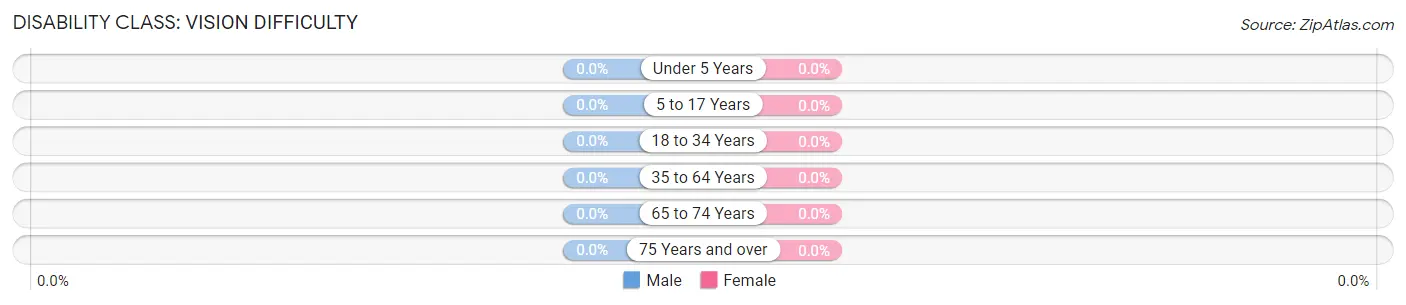
| Age Bracket | Male | Female |
| Under 5 Years | 0 (0.0%) | 0 (0.0%) |
| 5 to 17 Years | 0 (0.0%) | 0 (0.0%) |
| 18 to 34 Years | 0 (0.0%) | 0 (0.0%) |
| 35 to 64 Years | 0 (0.0%) | 0 (0.0%) |
| 65 to 74 Years | 0 (0.0%) | 0 (0.0%) |
| 75 Years and over | 0 (0.0%) | 0 (0.0%) |
Disability Class: Cognitive Difficulty
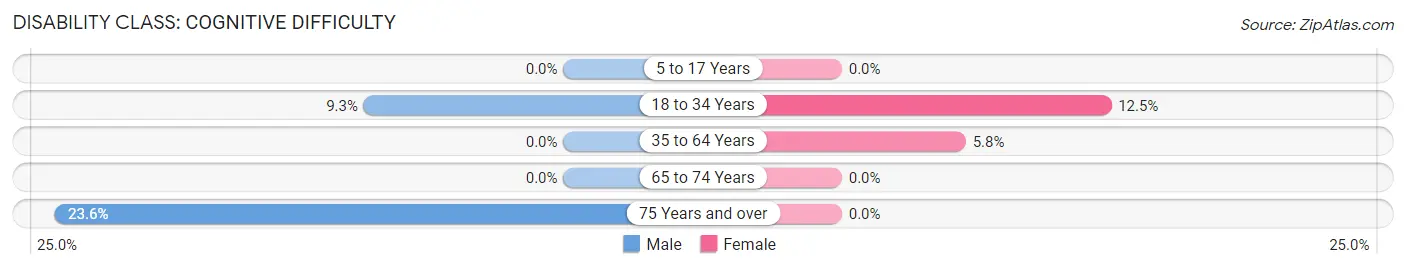
| Age Bracket | Male | Female |
| 5 to 17 Years | 0 (0.0%) | 0 (0.0%) |
| 18 to 34 Years | 5 (9.3%) | 4 (12.5%) |
| 35 to 64 Years | 0 (0.0%) | 5 (5.8%) |
| 65 to 74 Years | 0 (0.0%) | 0 (0.0%) |
| 75 Years and over | 25 (23.6%) | 0 (0.0%) |
Disability Class: Ambulatory Difficulty
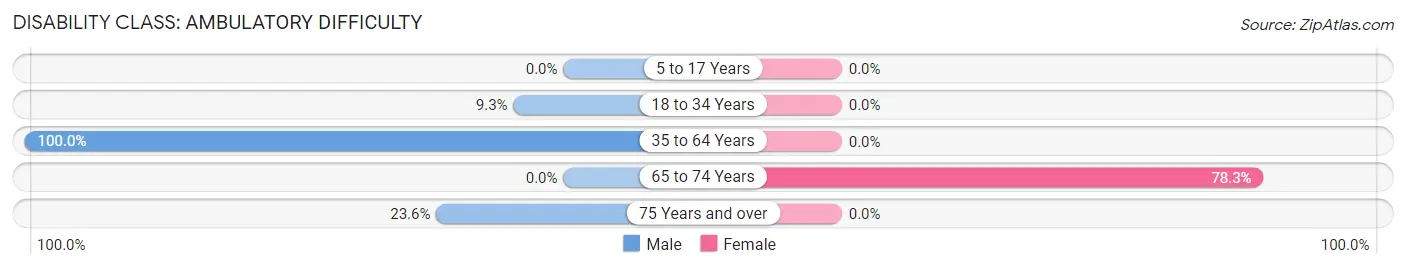
| Age Bracket | Male | Female |
| 5 to 17 Years | 0 (0.0%) | 0 (0.0%) |
| 18 to 34 Years | 5 (9.3%) | 0 (0.0%) |
| 35 to 64 Years | 7 (100.0%) | 0 (0.0%) |
| 65 to 74 Years | 0 (0.0%) | 18 (78.3%) |
| 75 Years and over | 25 (23.6%) | 0 (0.0%) |
Disability Class: Self-Care Difficulty
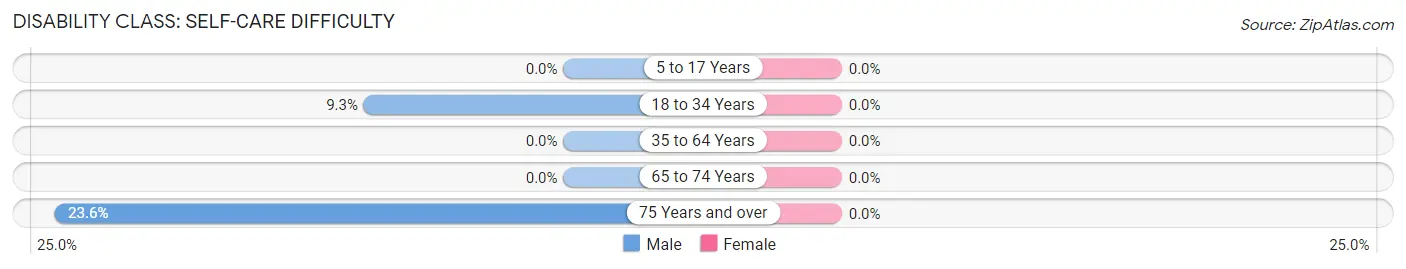
| Age Bracket | Male | Female |
| 5 to 17 Years | 0 (0.0%) | 0 (0.0%) |
| 18 to 34 Years | 5 (9.3%) | 0 (0.0%) |
| 35 to 64 Years | 0 (0.0%) | 0 (0.0%) |
| 65 to 74 Years | 0 (0.0%) | 0 (0.0%) |
| 75 Years and over | 25 (23.6%) | 0 (0.0%) |
Technology Access in Mountain Mesa
Computing Device Access in Mountain Mesa
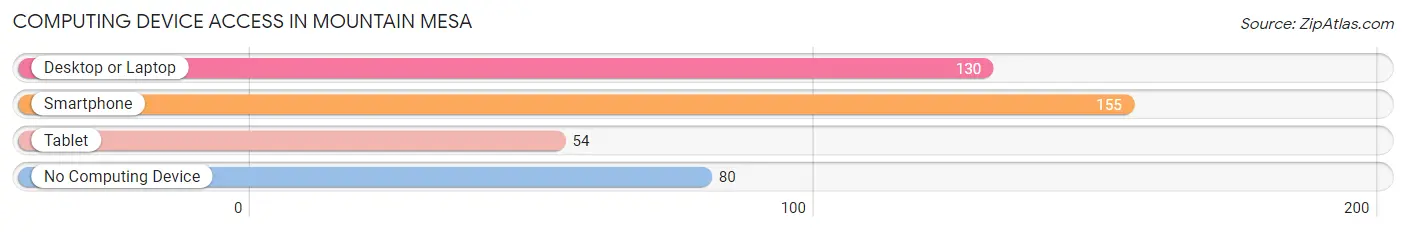
| Device Type | # Households | % Households |
| Desktop or Laptop | 130 | 51.4% |
| Smartphone | 155 | 61.3% |
| Tablet | 54 | 21.3% |
| No Computing Device | 80 | 31.6% |
| Total | 253 | 100.0% |
Internet Access in Mountain Mesa
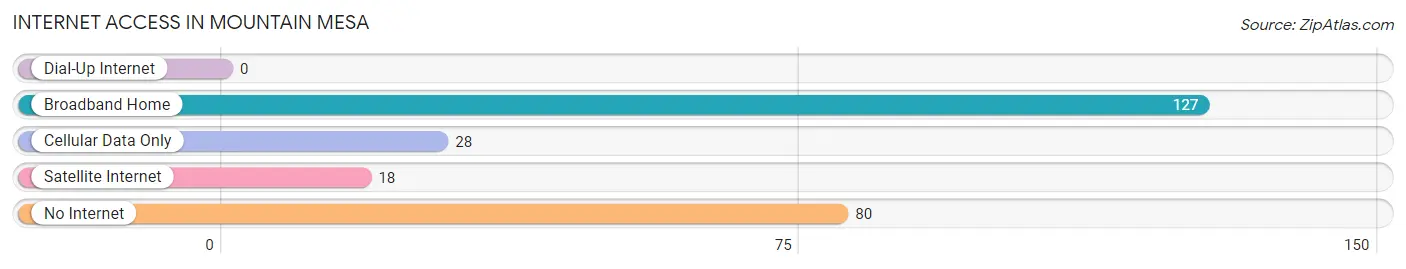
| Internet Type | # Households | % Households |
| Dial-Up Internet | 0 | 0.0% |
| Broadband Home | 127 | 50.2% |
| Cellular Data Only | 28 | 11.1% |
| Satellite Internet | 18 | 7.1% |
| No Internet | 80 | 31.6% |
| Total | 253 | 100.0% |
Mountain Mesa Summary
Mountain Mesa is a small unincorporated community located in Kern County, California. It is situated in the foothills of the Sierra Nevada Mountains, approximately 25 miles east of Bakersfield. The population of Mountain Mesa was 1,845 at the 2010 census.
History
Mountain Mesa was first settled in the late 1800s by ranchers and farmers. The area was originally known as “Mountain View” and was part of the Tejon Ranch. In the early 1900s, the area was renamed “Mountain Mesa” and the first post office was established in 1910.
In the 1920s, the area began to develop as a resort community. The first hotel was built in 1924 and the first golf course was built in 1925. The area was also home to a number of summer camps, including Camp Kern, Camp Kern-O-Ree, and Camp Kern-O-Ree-Ki.
In the 1950s, the area began to develop as a residential community. The first homes were built in the area in the late 1950s and early 1960s. The area continued to grow throughout the 1960s and 1970s, and by the 1980s, the population had grown to over 1,000.
Geography
Mountain Mesa is located in the foothills of the Sierra Nevada Mountains, approximately 25 miles east of Bakersfield. The area is characterized by rolling hills and valleys, with elevations ranging from 1,000 to 4,000 feet. The climate is semi-arid, with hot summers and mild winters.
Economy
Mountain Mesa is primarily a residential community, with most of the population employed in the nearby cities of Bakersfield and Tehachapi. The area is also home to a number of small businesses, including restaurants, convenience stores, and gas stations.
Demographics
As of the 2010 census, the population of Mountain Mesa was 1,845. The racial makeup of the town was 79.3% White, 0.7% African American, 0.7% Native American, 0.7% Asian, 0.2% Pacific Islander, 16.2% from other races, and 2.2% from two or more races. Hispanic or Latino of any race were 33.2% of the population.
The median income for a household in Mountain Mesa was $41,250, and the median income for a family was $45,625. The per capita income for the town was $17,845. About 16.2% of families and 19.2% of the population were below the poverty line, including 25.2% of those under age 18 and 8.2% of those age 65 or over.
Common Questions
What is Per Capita Income in Mountain Mesa?
Per Capita income in Mountain Mesa is $26,019.
What is the Median Family Income in Mountain Mesa?
Median Family Income in Mountain Mesa is $47,432.
What is the Median Household income in Mountain Mesa?
Median Household Income in Mountain Mesa is $47,068.
What is Inequality or Gini Index in Mountain Mesa?
Inequality or Gini Index in Mountain Mesa is 0.34.
What is the Total Population of Mountain Mesa?
Total Population of Mountain Mesa is 572.
What is the Total Male Population of Mountain Mesa?
Total Male Population of Mountain Mesa is 274.
What is the Total Female Population of Mountain Mesa?
Total Female Population of Mountain Mesa is 298.
What is the Ratio of Males per 100 Females in Mountain Mesa?
There are 91.95 Males per 100 Females in Mountain Mesa.
What is the Ratio of Females per 100 Males in Mountain Mesa?
There are 108.76 Females per 100 Males in Mountain Mesa.
What is the Median Population Age in Mountain Mesa?
Median Population Age in Mountain Mesa is 70.3 Years.
What is the Average Family Size in Mountain Mesa
Average Family Size in Mountain Mesa is 2.4 People.
What is the Average Household Size in Mountain Mesa
Average Household Size in Mountain Mesa is 2.0 People.
How Large is the Labor Force in Mountain Mesa?
There are 60 People in the Labor Forcein in Mountain Mesa.
What is the Percentage of People in the Labor Force in Mountain Mesa?
11.7% of People are in the Labor Force in Mountain Mesa.