Cities with the Highest Percentage of Population Employed in Health Diagnosing & Treating in Michigan
RELATED REPORTS & OPTIONS
Health Diagnosing & Treating
Michigan
Compare Cities
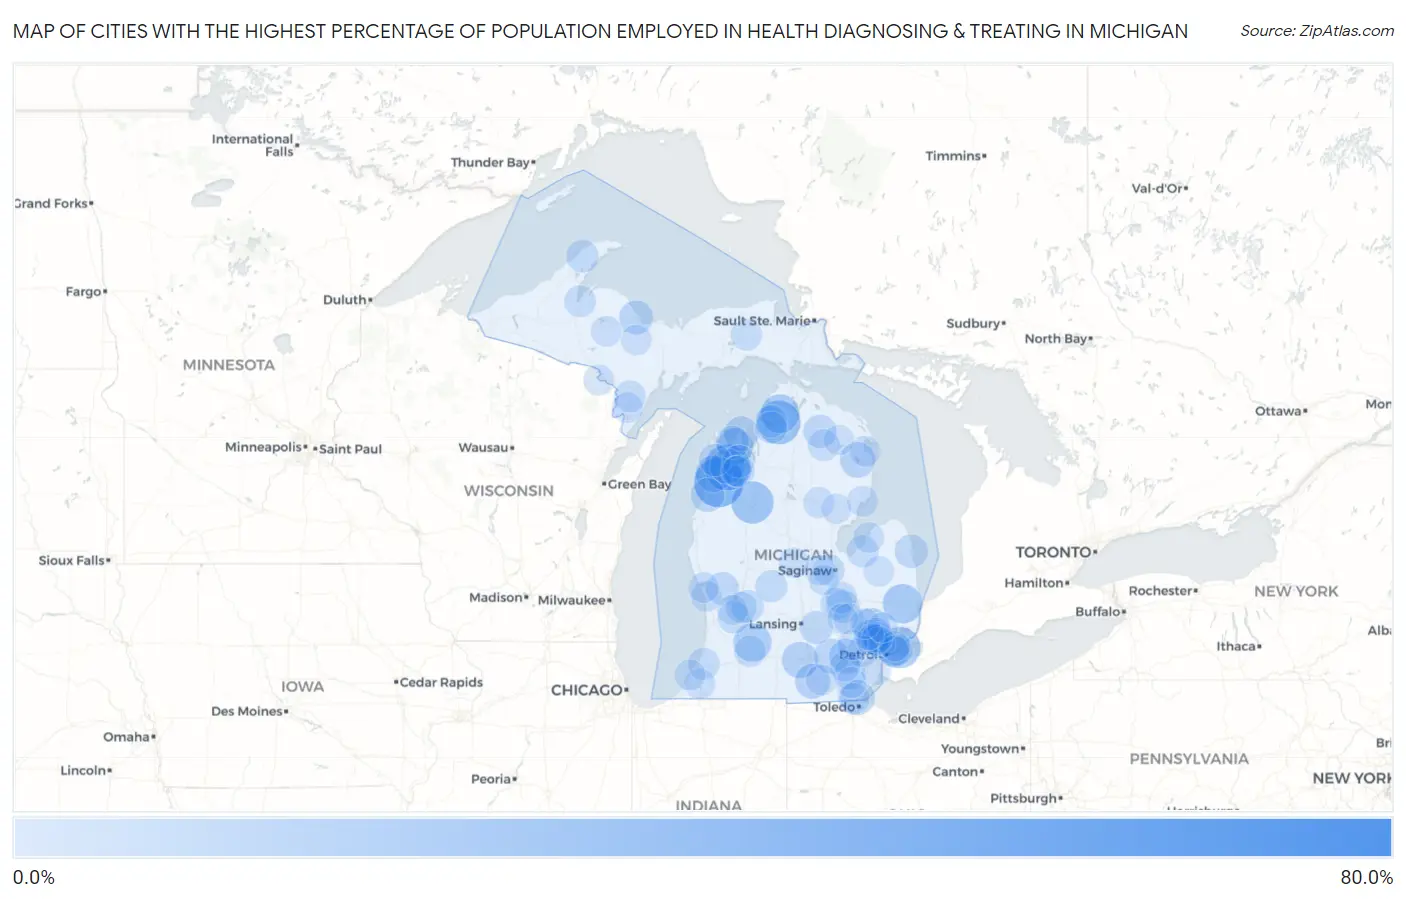
Map of Cities with the Highest Percentage of Population Employed in Health Diagnosing & Treating in Michigan
0.0%
80.0%
Cities with the Highest Percentage of Population Employed in Health Diagnosing & Treating in Michigan
| City | % Employed | vs State | vs National | |
| 1. | Millers Lake | 74.7% | 6.6%(+68.1)#1 | 6.2%(+68.5)#28 |
| 2. | Crystal Mountain | 43.1% | 6.6%(+36.5)#2 | 6.2%(+36.9)#116 |
| 3. | Maple Grove | 37.2% | 6.6%(+30.6)#3 | 6.2%(+31.0)#166 |
| 4. | Walloon Lake | 32.9% | 6.6%(+26.3)#4 | 6.2%(+26.7)#245 |
| 5. | Haring | 30.1% | 6.6%(+23.5)#5 | 6.2%(+23.9)#302 |
| 6. | Village Of Grosse Pointe Shores | 28.5% | 6.6%(+21.8)#6 | 6.2%(+22.2)#341 |
| 7. | Emmett | 25.4% | 6.6%(+18.7)#7 | 6.2%(+19.1)#426 |
| 8. | Bay View | 24.5% | 6.6%(+17.9)#8 | 6.2%(+18.3)#467 |
| 9. | Delton | 23.2% | 6.6%(+16.5)#9 | 6.2%(+16.9)#537 |
| 10. | Beulah | 20.4% | 6.6%(+13.8)#10 | 6.2%(+14.2)#710 |
| 11. | Lamont | 20.4% | 6.6%(+13.7)#11 | 6.2%(+14.1)#713 |
| 12. | Parma | 20.1% | 6.6%(+13.4)#12 | 6.2%(+13.8)#733 |
| 13. | Lake Angelus | 20.0% | 6.6%(+13.4)#13 | 6.2%(+13.8)#742 |
| 14. | Lake Leelanau | 20.0% | 6.6%(+13.4)#14 | 6.2%(+13.8)#744 |
| 15. | Hubbard Lake | 18.4% | 6.6%(+11.8)#15 | 6.2%(+12.2)#904 |
| 16. | Lake Ann | 18.1% | 6.6%(+11.5)#16 | 6.2%(+11.9)#946 |
| 17. | Addison | 17.8% | 6.6%(+11.2)#17 | 6.2%(+11.6)#973 |
| 18. | Northport | 17.6% | 6.6%(+11.0)#18 | 6.2%(+11.4)#990 |
| 19. | Temperance | 17.6% | 6.6%(+10.9)#19 | 6.2%(+11.3)#1,003 |
| 20. | Chelsea | 17.3% | 6.6%(+10.7)#20 | 6.2%(+11.1)#1,032 |
| 21. | Barton Hills | 16.9% | 6.6%(+10.2)#21 | 6.2%(+10.6)#1,111 |
| 22. | Bloomfield Hills | 16.7% | 6.6%(+10.0)#22 | 6.2%(+10.4)#1,141 |
| 23. | Mohawk | 16.7% | 6.6%(+10.0)#23 | 6.2%(+10.4)#1,147 |
| 24. | Trowbridge Park | 16.2% | 6.6%(+9.56)#24 | 6.2%(+9.97)#1,241 |
| 25. | Onekama | 15.7% | 6.6%(+9.02)#25 | 6.2%(+9.42)#1,357 |
| 26. | Forestville | 15.2% | 6.6%(+8.51)#26 | 6.2%(+8.91)#1,473 |
| 27. | Leland | 14.9% | 6.6%(+8.23)#27 | 6.2%(+8.63)#1,536 |
| 28. | Canada Creek Ranch | 14.6% | 6.6%(+7.99)#28 | 6.2%(+8.39)#1,598 |
| 29. | Swartz Creek | 14.5% | 6.6%(+7.84)#29 | 6.2%(+8.25)#1,650 |
| 30. | Ravenna | 14.5% | 6.6%(+7.83)#30 | 6.2%(+8.24)#1,654 |
| 31. | Williamston | 14.4% | 6.6%(+7.79)#31 | 6.2%(+8.19)#1,666 |
| 32. | Ahmeek | 13.6% | 6.6%(+6.99)#32 | 6.2%(+7.39)#1,937 |
| 33. | Greilickville | 13.6% | 6.6%(+6.94)#33 | 6.2%(+7.35)#1,945 |
| 34. | Forest Hills | 13.5% | 6.6%(+6.90)#34 | 6.2%(+7.30)#1,964 |
| 35. | Lake Leann | 13.5% | 6.6%(+6.88)#35 | 6.2%(+7.28)#1,972 |
| 36. | Grosse Pointe | 13.4% | 6.6%(+6.79)#36 | 6.2%(+7.19)#2,008 |
| 37. | Unionville | 13.1% | 6.6%(+6.41)#37 | 6.2%(+6.81)#2,154 |
| 38. | Sheridan | 13.0% | 6.6%(+6.32)#38 | 6.2%(+6.72)#2,210 |
| 39. | Horton Bay | 12.9% | 6.6%(+6.26)#39 | 6.2%(+6.66)#2,235 |
| 40. | Empire | 12.8% | 6.6%(+6.19)#40 | 6.2%(+6.59)#2,268 |
| 41. | Bingham Farms | 12.8% | 6.6%(+6.16)#41 | 6.2%(+6.57)#2,283 |
| 42. | Milan | 12.8% | 6.6%(+6.15)#42 | 6.2%(+6.55)#2,289 |
| 43. | Advance | 12.7% | 6.6%(+6.01)#43 | 6.2%(+6.41)#2,352 |
| 44. | Chums Corner | 12.6% | 6.6%(+5.93)#44 | 6.2%(+6.33)#2,388 |
| 45. | Byron Center | 12.4% | 6.6%(+5.77)#45 | 6.2%(+6.17)#2,471 |
| 46. | Lennon | 12.3% | 6.6%(+5.63)#46 | 6.2%(+6.04)#2,538 |
| 47. | Paw Paw Lake | 12.3% | 6.6%(+5.62)#47 | 6.2%(+6.02)#2,546 |
| 48. | Franklin | 12.2% | 6.6%(+5.59)#48 | 6.2%(+5.99)#2,566 |
| 49. | Atlanta | 12.2% | 6.6%(+5.51)#49 | 6.2%(+5.91)#2,602 |
| 50. | L Anse | 12.1% | 6.6%(+5.47)#50 | 6.2%(+5.87)#2,626 |
| 51. | Carney | 12.0% | 6.6%(+5.31)#51 | 6.2%(+5.71)#2,699 |
| 52. | Naubinway | 11.9% | 6.6%(+5.26)#52 | 6.2%(+5.66)#2,727 |
| 53. | Shields | 11.8% | 6.6%(+5.19)#53 | 6.2%(+5.59)#2,754 |
| 54. | Lambertville | 11.8% | 6.6%(+5.13)#54 | 6.2%(+5.53)#2,784 |
| 55. | Cannonsburg | 11.7% | 6.6%(+5.00)#55 | 6.2%(+5.41)#2,874 |
| 56. | Flushing | 11.6% | 6.6%(+4.95)#56 | 6.2%(+5.35)#2,908 |
| 57. | East Grand Rapids | 11.6% | 6.6%(+4.93)#57 | 6.2%(+5.33)#2,932 |
| 58. | Richland | 11.5% | 6.6%(+4.88)#58 | 6.2%(+5.28)#2,971 |
| 59. | Grosse Pointe Farms | 11.5% | 6.6%(+4.83)#59 | 6.2%(+5.24)#3,005 |
| 60. | Ramsay | 11.4% | 6.6%(+4.72)#60 | 6.2%(+5.12)#3,084 |
| 61. | Newberry | 11.2% | 6.6%(+4.59)#61 | 6.2%(+4.99)#3,160 |
| 62. | Huntington Woods | 11.1% | 6.6%(+4.43)#62 | 6.2%(+4.83)#3,284 |
| 63. | West Branch | 11.1% | 6.6%(+4.42)#63 | 6.2%(+4.82)#3,291 |
| 64. | Plymouth | 11.0% | 6.6%(+4.37)#64 | 6.2%(+4.77)#3,321 |
| 65. | Lakeport | 10.9% | 6.6%(+4.25)#65 | 6.2%(+4.65)#3,391 |
| 66. | Ferrysburg | 10.9% | 6.6%(+4.21)#66 | 6.2%(+4.61)#3,424 |
| 67. | East Tawas | 10.8% | 6.6%(+4.17)#67 | 6.2%(+4.57)#3,463 |
| 68. | Dundee | 10.8% | 6.6%(+4.16)#68 | 6.2%(+4.56)#3,472 |
| 69. | Beverly Hills | 10.7% | 6.6%(+4.06)#69 | 6.2%(+4.46)#3,557 |
| 70. | Ossineke | 10.7% | 6.6%(+4.04)#70 | 6.2%(+4.44)#3,567 |
| 71. | Saline | 10.7% | 6.6%(+4.03)#71 | 6.2%(+4.44)#3,569 |
| 72. | Fenton | 10.6% | 6.6%(+3.96)#72 | 6.2%(+4.36)#3,637 |
| 73. | Bay Port | 10.6% | 6.6%(+3.95)#73 | 6.2%(+4.35)#3,647 |
| 74. | Kingsford | 10.4% | 6.6%(+3.79)#74 | 6.2%(+4.19)#3,786 |
| 75. | Daggett | 10.4% | 6.6%(+3.74)#75 | 6.2%(+4.14)#3,831 |
| 76. | Roosevelt Park | 10.4% | 6.6%(+3.73)#76 | 6.2%(+4.13)#3,842 |
| 77. | Republic | 10.4% | 6.6%(+3.72)#77 | 6.2%(+4.13)#3,846 |
| 78. | Berrien Springs | 10.4% | 6.6%(+3.71)#78 | 6.2%(+4.11)#3,860 |
| 79. | Onsted | 10.2% | 6.6%(+3.60)#79 | 6.2%(+4.00)#3,973 |
| 80. | Grosse Pointe Park | 10.2% | 6.6%(+3.59)#80 | 6.2%(+3.99)#3,976 |
| 81. | Birmingham | 10.2% | 6.6%(+3.57)#81 | 6.2%(+3.97)#3,994 |
| 82. | Hemlock | 10.2% | 6.6%(+3.55)#82 | 6.2%(+3.95)#4,017 |
| 83. | Gwinn | 10.2% | 6.6%(+3.51)#83 | 6.2%(+3.91)#4,068 |
| 84. | Shoreham | 10.1% | 6.6%(+3.50)#84 | 6.2%(+3.90)#4,071 |
| 85. | Grawn | 10.0% | 6.6%(+3.37)#85 | 6.2%(+3.77)#4,178 |
| 86. | St Charles | 10.0% | 6.6%(+3.37)#86 | 6.2%(+3.77)#4,184 |
| 87. | Argentine | 10.0% | 6.6%(+3.33)#87 | 6.2%(+3.74)#4,240 |
| 88. | Kingston | 9.9% | 6.6%(+3.29)#88 | 6.2%(+3.69)#4,272 |
| 89. | Grandville | 9.9% | 6.6%(+3.24)#89 | 6.2%(+3.65)#4,324 |
| 90. | Shepherd | 9.9% | 6.6%(+3.23)#90 | 6.2%(+3.63)#4,348 |
| 91. | Grosse Pointe Woods | 9.9% | 6.6%(+3.23)#91 | 6.2%(+3.63)#4,350 |
| 92. | Eureka | 9.8% | 6.6%(+3.19)#92 | 6.2%(+3.59)#4,389 |
| 93. | South Lyon | 9.8% | 6.6%(+3.16)#93 | 6.2%(+3.56)#4,433 |
| 94. | Hillman | 9.8% | 6.6%(+3.14)#94 | 6.2%(+3.54)#4,450 |
| 95. | Orchard Lake Village | 9.7% | 6.6%(+3.01)#95 | 6.2%(+3.41)#4,588 |
| 96. | Village Of Clarkston | 9.6% | 6.6%(+2.96)#96 | 6.2%(+3.37)#4,638 |
| 97. | Woodhaven | 9.6% | 6.6%(+2.96)#97 | 6.2%(+3.36)#4,648 |
| 98. | Rochester | 9.6% | 6.6%(+2.91)#98 | 6.2%(+3.31)#4,697 |
| 99. | Lake Gogebic | 9.5% | 6.6%(+2.88)#99 | 6.2%(+3.28)#4,741 |
| 100. | Prescott | 9.5% | 6.6%(+2.84)#100 | 6.2%(+3.24)#4,787 |
Common Questions
What are the Top 10 Cities with the Highest Percentage of Population Employed in Health Diagnosing & Treating in Michigan?
Top 10 Cities with the Highest Percentage of Population Employed in Health Diagnosing & Treating in Michigan are:
#1
43.1%
#2
37.2%
#3
32.9%
#4
30.1%
#5
28.5%
#6
25.4%
#7
24.5%
#8
23.2%
#9
20.4%
#10
20.1%
What city has the Highest Percentage of Population Employed in Health Diagnosing & Treating in Michigan?
Crystal Mountain has the Highest Percentage of Population Employed in Health Diagnosing & Treating in Michigan with 43.1%.
What is the Percentage of Population Employed in Health Diagnosing & Treating in the State of Michigan?
Percentage of Population Employed in Health Diagnosing & Treating in Michigan is 6.6%.
What is the Percentage of Population Employed in Health Diagnosing & Treating in the United States?
Percentage of Population Employed in Health Diagnosing & Treating in the United States is 6.2%.