Kentfield, CA Map & Demographics
Kentfield Map
Kentfield Overview
$129,827
PER CAPITA INCOME
$250,001
AVG FAMILY INCOME
$208,977
AVG HOUSEHOLD INCOME
46.7%
WAGE / INCOME GAP [ % ]
53.3¢/ $1
WAGE / INCOME GAP [ $ ]
0.53
INEQUALITY / GINI INDEX
7,410
TOTAL POPULATION
3,592
MALE POPULATION
3,818
FEMALE POPULATION
94.08
MALES / 100 FEMALES
106.29
FEMALES / 100 MALES
46.4
MEDIAN AGE
3.1
AVG FAMILY SIZE
2.6
AVG HOUSEHOLD SIZE
3,494
LABOR FORCE [ PEOPLE ]
60.7%
PERCENT IN LABOR FORCE
5.1%
UNEMPLOYMENT RATE
Kentfield Area Codes
Income in Kentfield
Income Overview in Kentfield
Per Capita Income in Kentfield is $129,827, while median incomes of families and households are $250,001 and $208,977 respectively.
| Characteristic | Number | Measure |
| Per Capita Income | 7,410 | $129,827 |
| Median Family Income | 2,011 | $250,001 |
| Mean Family Income | 2,011 | $429,600 |
| Median Household Income | 2,831 | $208,977 |
| Mean Household Income | 2,831 | $338,463 |
| Income Deficit | 2,011 | $0 |
| Wage / Income Gap (%) | 7,410 | 46.69% |
| Wage / Income Gap ($) | 7,410 | 53.31¢ per $1 |
| Gini / Inequality Index | 7,410 | 0.53 |
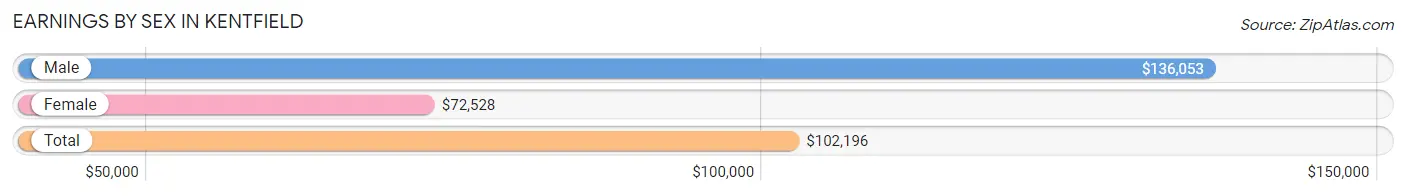
Earnings by Sex in Kentfield
Average Earnings in Kentfield are $102,196, $136,053 for men and $72,528 for women, a difference of 46.7%.
| Sex | Number | Average Earnings |
| Male | 2,092 (56.4%) | $136,053 |
| Female | 1,615 (43.6%) | $72,528 |
| Total | 3,707 (100.0%) | $102,196 |
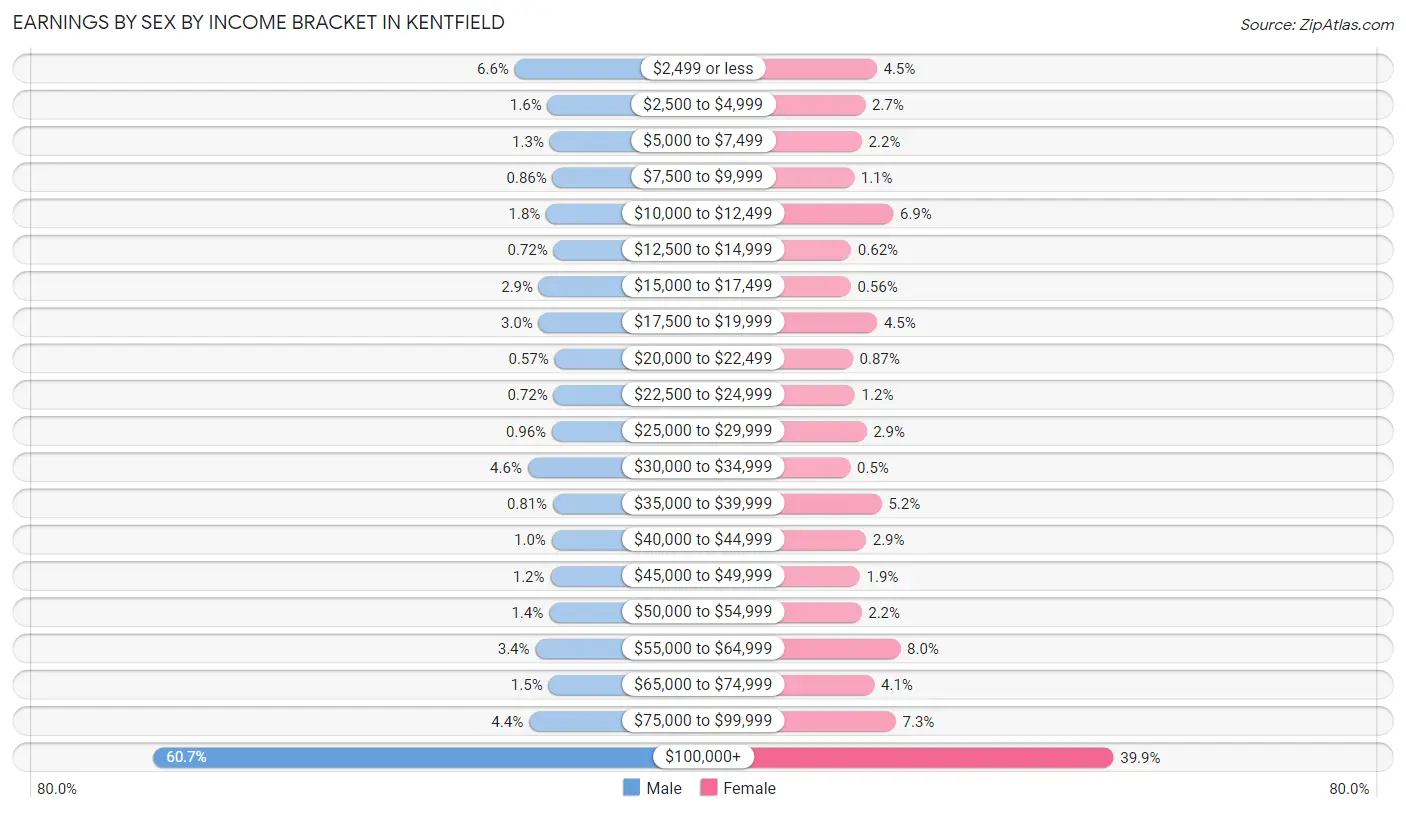
Earnings by Sex by Income Bracket in Kentfield
The most common earnings brackets in Kentfield are $100,000+ for men (1,270 | 60.7%) and $100,000+ for women (645 | 39.9%).
| Income | Male | Female |
| $2,499 or less | 137 (6.6%) | 72 (4.5%) |
| $2,500 to $4,999 | 34 (1.6%) | 44 (2.7%) |
| $5,000 to $7,499 | 27 (1.3%) | 36 (2.2%) |
| $7,500 to $9,999 | 18 (0.9%) | 17 (1.1%) |
| $10,000 to $12,499 | 38 (1.8%) | 112 (6.9%) |
| $12,500 to $14,999 | 15 (0.7%) | 10 (0.6%) |
| $15,000 to $17,499 | 61 (2.9%) | 9 (0.6%) |
| $17,500 to $19,999 | 62 (3.0%) | 73 (4.5%) |
| $20,000 to $22,499 | 12 (0.6%) | 14 (0.9%) |
| $22,500 to $24,999 | 15 (0.7%) | 19 (1.2%) |
| $25,000 to $29,999 | 20 (1.0%) | 47 (2.9%) |
| $30,000 to $34,999 | 96 (4.6%) | 8 (0.5%) |
| $35,000 to $39,999 | 17 (0.8%) | 84 (5.2%) |
| $40,000 to $44,999 | 21 (1.0%) | 46 (2.9%) |
| $45,000 to $49,999 | 25 (1.2%) | 31 (1.9%) |
| $50,000 to $54,999 | 29 (1.4%) | 35 (2.2%) |
| $55,000 to $64,999 | 72 (3.4%) | 129 (8.0%) |
| $65,000 to $74,999 | 31 (1.5%) | 66 (4.1%) |
| $75,000 to $99,999 | 92 (4.4%) | 118 (7.3%) |
| $100,000+ | 1,270 (60.7%) | 645 (39.9%) |
| Total | 2,092 (100.0%) | 1,615 (100.0%) |
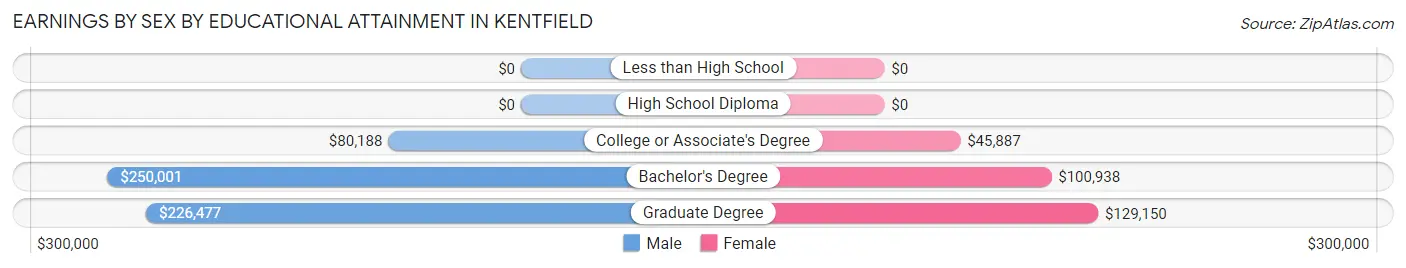
Earnings by Sex by Educational Attainment in Kentfield
Average earnings in Kentfield are $167,313 for men and $82,292 for women, a difference of 50.8%. Men with an educational attainment of bachelor's degree enjoy the highest average annual earnings of $250,001, while those with college or associate's degree education earn the least with $80,188. Women with an educational attainment of graduate degree earn the most with the average annual earnings of $129,150, while those with college or associate's degree education have the smallest earnings of $45,887.
| Educational Attainment | Male Income | Female Income |
| Less than High School | - | - |
| High School Diploma | - | - |
| College or Associate's Degree | $80,188 | $45,887 |
| Bachelor's Degree | $250,001 | $100,938 |
| Graduate Degree | $226,477 | $129,150 |
| Total | $167,313 | $82,292 |
Family Income in Kentfield
Family Income Brackets in Kentfield
According to the Kentfield family income data, there are 1,359 families falling into the $200,000+ income range, which is the most common income bracket and makes up 67.6% of all families.
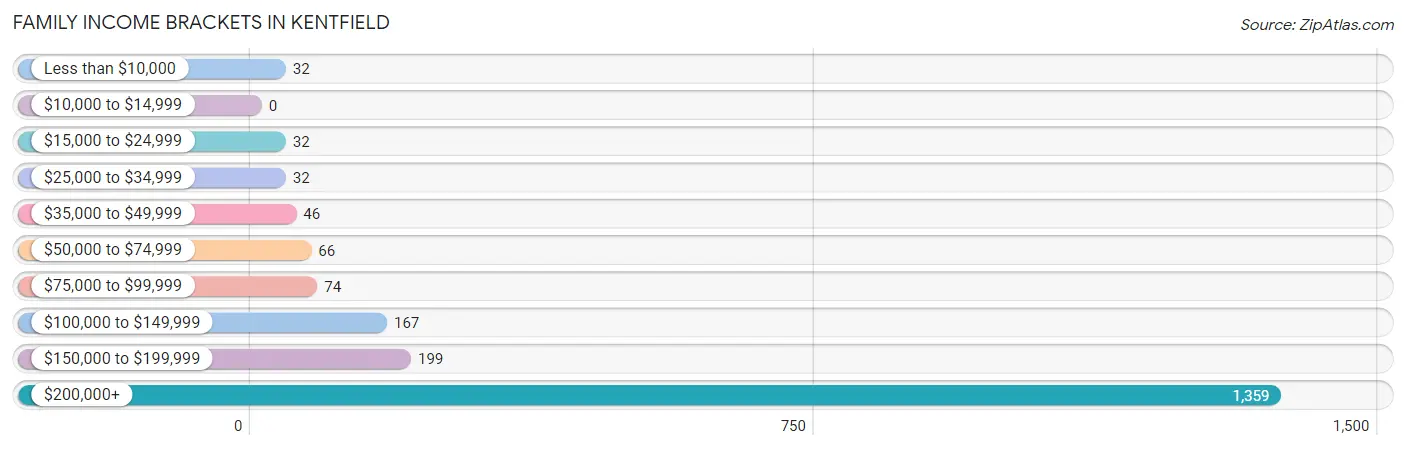
| Income Bracket | # Families | % Families |
| Less than $10,000 | 32 | 1.6% |
| $10,000 to $14,999 | 0 | 0.0% |
| $15,000 to $24,999 | 32 | 1.6% |
| $25,000 to $34,999 | 32 | 1.6% |
| $35,000 to $49,999 | 46 | 2.3% |
| $50,000 to $74,999 | 66 | 3.3% |
| $75,000 to $99,999 | 74 | 3.7% |
| $100,000 to $149,999 | 167 | 8.3% |
| $150,000 to $199,999 | 199 | 9.9% |
| $200,000+ | 1,359 | 67.6% |
Family Income by Famaliy Size in Kentfield
3-person families (300 | 14.9%) account for the highest median family income in Kentfield with $250,001 per family, while 2-person families (930 | 46.3%) have the highest median income of $96,591 per family member.
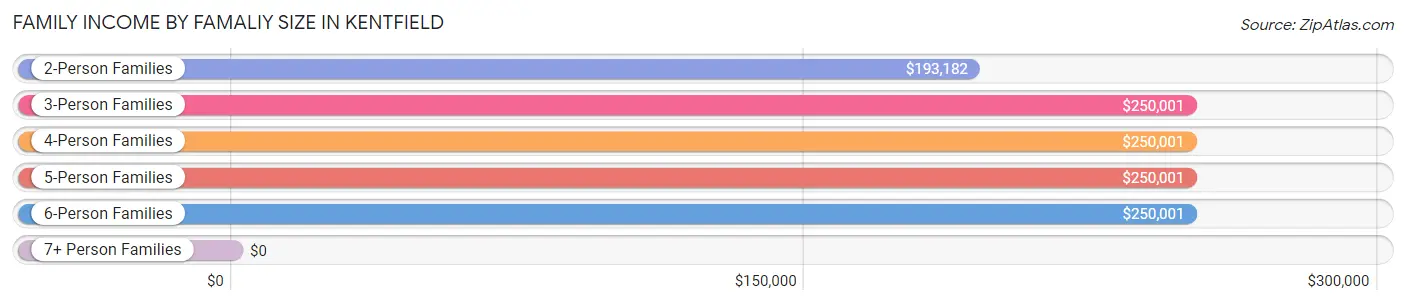
| Income Bracket | # Families | Median Income |
| 2-Person Families | 930 (46.3%) | $193,182 |
| 3-Person Families | 300 (14.9%) | $250,001 |
| 4-Person Families | 587 (29.2%) | $250,001 |
| 5-Person Families | 146 (7.3%) | $250,001 |
| 6-Person Families | 48 (2.4%) | $250,001 |
| 7+ Person Families | 0 (0.0%) | $0 |
| Total | 2,011 (100.0%) | $250,001 |
Family Income by Number of Earners in Kentfield
The median family income in Kentfield is $250,001, with families comprising 2 earners (802) having the highest median family income of $250,001, while families with no earners (260) have the lowest median family income of $120,938, accounting for 39.9% and 12.9% of families, respectively.
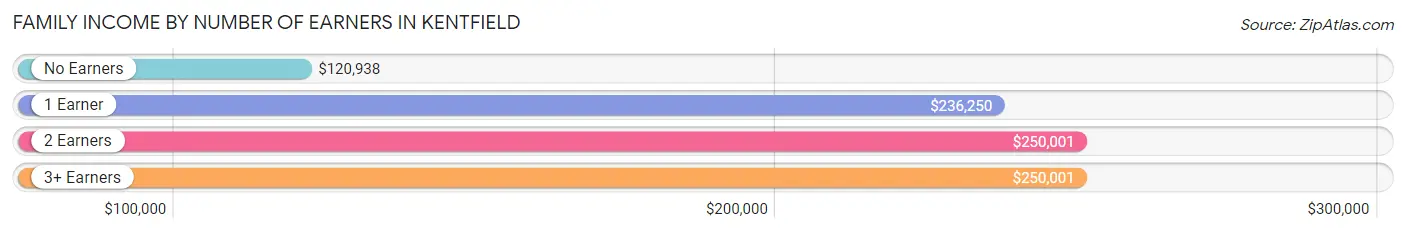
| Number of Earners | # Families | Median Income |
| No Earners | 260 (12.9%) | $120,938 |
| 1 Earner | 778 (38.7%) | $236,250 |
| 2 Earners | 802 (39.9%) | $250,001 |
| 3+ Earners | 171 (8.5%) | $250,001 |
| Total | 2,011 (100.0%) | $250,001 |
Household Income in Kentfield
Household Income Brackets in Kentfield
With 1,447 households falling in the category, the $200,000+ income range is the most frequent in Kentfield, accounting for 51.1% of all households. In contrast, only 11 households (0.4%) fall into the $10,000 to $14,999 income bracket, making it the least populous group.
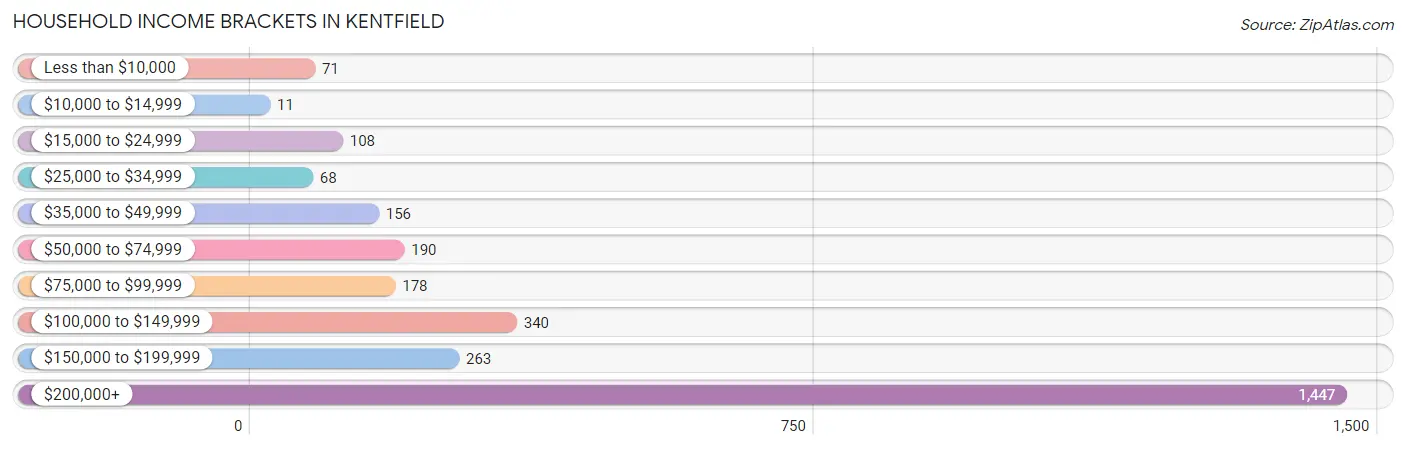
| Income Bracket | # Households | % Households |
| Less than $10,000 | 71 | 2.5% |
| $10,000 to $14,999 | 11 | 0.4% |
| $15,000 to $24,999 | 108 | 3.8% |
| $25,000 to $34,999 | 68 | 2.4% |
| $35,000 to $49,999 | 156 | 5.5% |
| $50,000 to $74,999 | 190 | 6.7% |
| $75,000 to $99,999 | 178 | 6.3% |
| $100,000 to $149,999 | 340 | 12.0% |
| $150,000 to $199,999 | 263 | 9.3% |
| $200,000+ | 1,447 | 51.1% |
Household Income by Householder Age in Kentfield
The median household income in Kentfield is $208,977, with the highest median household income of $250,001 found in the 25 to 44 years age bracket for the primary householder. A total of 510 households (18.0%) fall into this category.
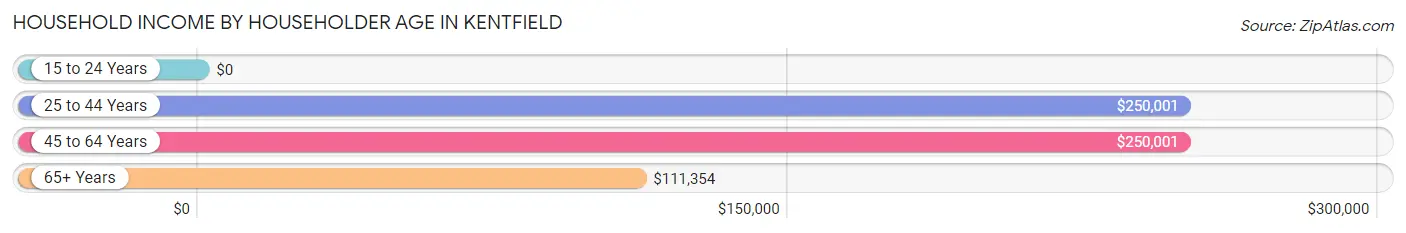
| Income Bracket | # Households | Median Income |
| 15 to 24 Years | 0 (0.0%) | $0 |
| 25 to 44 Years | 510 (18.0%) | $250,001 |
| 45 to 64 Years | 1,234 (43.6%) | $250,001 |
| 65+ Years | 1,087 (38.4%) | $111,354 |
| Total | 2,831 (100.0%) | $208,977 |
Poverty in Kentfield
Income Below Poverty by Sex and Age in Kentfield
With 2.3% poverty level for males and 6.7% for females among the residents of Kentfield, 6 to 11 year old males and 25 to 34 year old females are the most vulnerable to poverty, with 25 males (8.6%) and 103 females (44.2%) in their respective age groups living below the poverty level.
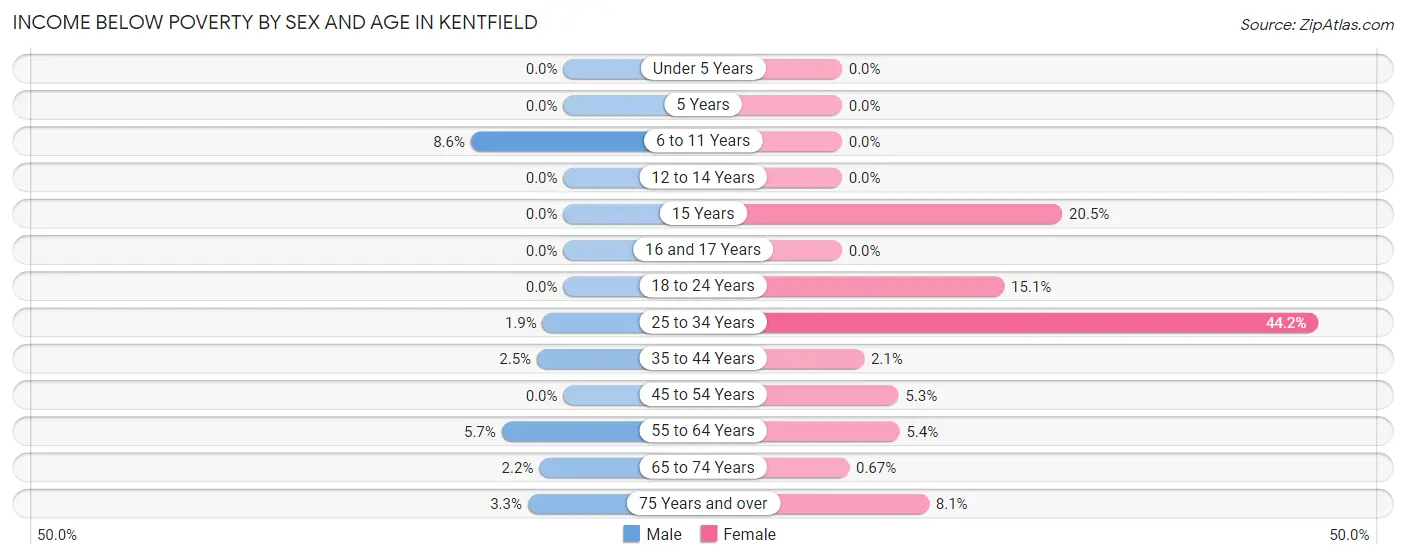
| Age Bracket | Male | Female |
| Under 5 Years | 0 (0.0%) | 0 (0.0%) |
| 5 Years | 0 (0.0%) | 0 (0.0%) |
| 6 to 11 Years | 25 (8.6%) | 0 (0.0%) |
| 12 to 14 Years | 0 (0.0%) | 0 (0.0%) |
| 15 Years | 0 (0.0%) | 9 (20.4%) |
| 16 and 17 Years | 0 (0.0%) | 0 (0.0%) |
| 18 to 24 Years | 0 (0.0%) | 33 (15.1%) |
| 25 to 34 Years | 4 (1.9%) | 103 (44.2%) |
| 35 to 44 Years | 8 (2.5%) | 8 (2.1%) |
| 45 to 54 Years | 0 (0.0%) | 36 (5.3%) |
| 55 to 64 Years | 26 (5.7%) | 24 (5.3%) |
| 65 to 74 Years | 7 (2.2%) | 3 (0.7%) |
| 75 Years and over | 14 (3.3%) | 40 (8.1%) |
| Total | 84 (2.3%) | 256 (6.7%) |
Income Above Poverty by Sex and Age in Kentfield
According to the poverty statistics in Kentfield, males aged under 5 years and females aged under 5 years are the age groups that are most secure financially, with 100.0% of males and 100.0% of females in these age groups living above the poverty line.
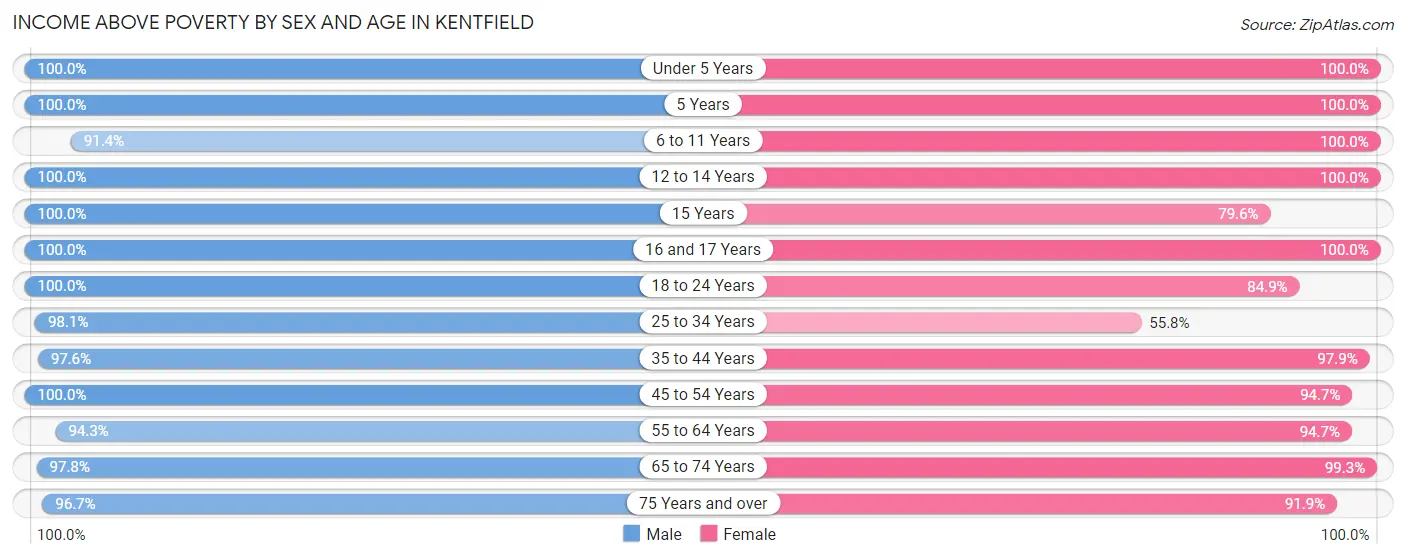
| Age Bracket | Male | Female |
| Under 5 Years | 238 (100.0%) | 186 (100.0%) |
| 5 Years | 20 (100.0%) | 35 (100.0%) |
| 6 to 11 Years | 266 (91.4%) | 322 (100.0%) |
| 12 to 14 Years | 233 (100.0%) | 232 (100.0%) |
| 15 Years | 50 (100.0%) | 35 (79.5%) |
| 16 and 17 Years | 145 (100.0%) | 82 (100.0%) |
| 18 to 24 Years | 186 (100.0%) | 186 (84.9%) |
| 25 to 34 Years | 203 (98.1%) | 130 (55.8%) |
| 35 to 44 Years | 318 (97.6%) | 380 (97.9%) |
| 45 to 54 Years | 700 (100.0%) | 648 (94.7%) |
| 55 to 64 Years | 428 (94.3%) | 425 (94.7%) |
| 65 to 74 Years | 305 (97.8%) | 446 (99.3%) |
| 75 Years and over | 410 (96.7%) | 455 (91.9%) |
| Total | 3,502 (97.7%) | 3,562 (93.3%) |
Income Below Poverty Among Married-Couple Families in Kentfield
The poverty statistics for married-couple families in Kentfield show that 1.5% or 26 of the total 1,715 families live below the poverty line. Families with no children have the highest poverty rate of 1.9%, comprising of 16 families. On the other hand, families with 3 or 4 children have the lowest poverty rate of 0.0%, which includes 0 families.
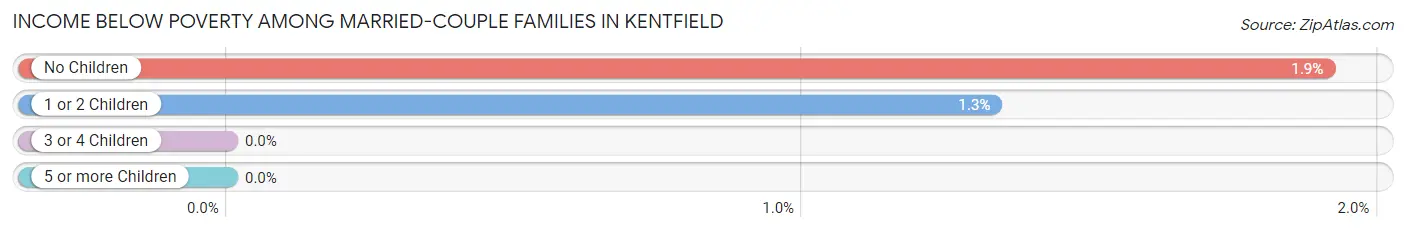
| Children | Above Poverty | Below Poverty |
| No Children | 820 (98.1%) | 16 (1.9%) |
| 1 or 2 Children | 741 (98.7%) | 10 (1.3%) |
| 3 or 4 Children | 128 (100.0%) | 0 (0.0%) |
| 5 or more Children | 0 (0.0%) | 0 (0.0%) |
| Total | 1,689 (98.5%) | 26 (1.5%) |
Income Below Poverty Among Single-Parent Households in Kentfield
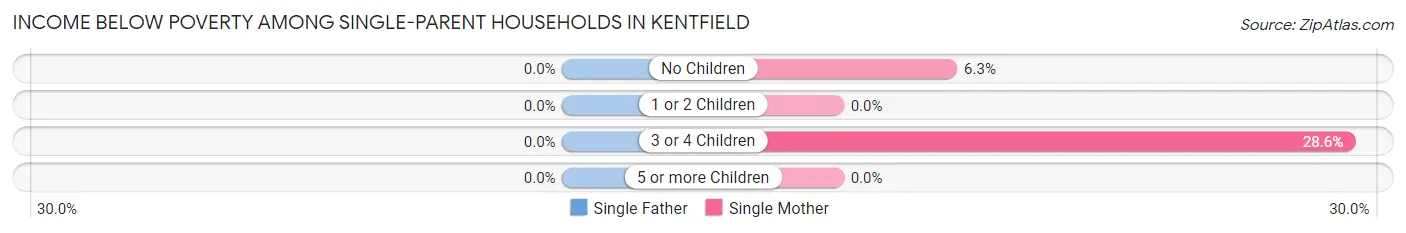
| Children | Single Father | Single Mother |
| No Children | 0 (0.0%) | 9 (6.3%) |
| 1 or 2 Children | 0 (0.0%) | 0 (0.0%) |
| 3 or 4 Children | 0 (0.0%) | 8 (28.6%) |
| 5 or more Children | 0 (0.0%) | 0 (0.0%) |
| Total | 0 (0.0%) | 17 (8.2%) |
Income Below Poverty Among Married-Couple vs Single-Parent Households in Kentfield
The poverty data for Kentfield shows that 26 of the married-couple family households (1.5%) and 17 of the single-parent households (5.7%) are living below the poverty level. Within the married-couple family households, those with no children have the highest poverty rate, with 16 households (1.9%) falling below the poverty line. Among the single-parent households, those with 3 or 4 children have the highest poverty rate, with 8 household (28.6%) living below poverty.
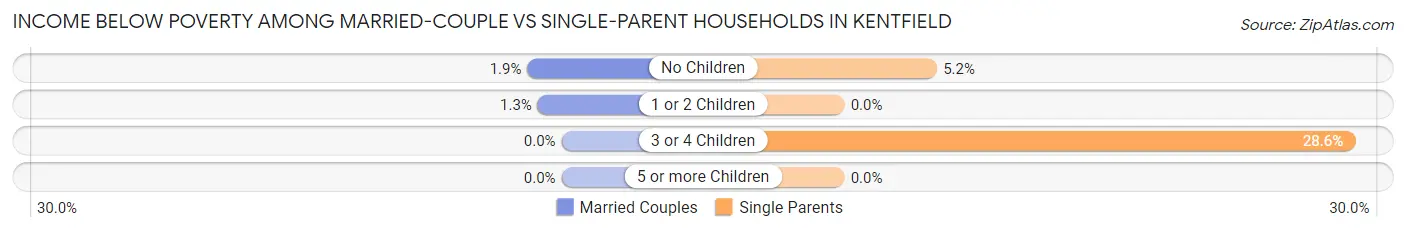
| Children | Married-Couple Families | Single-Parent Households |
| No Children | 16 (1.9%) | 9 (5.2%) |
| 1 or 2 Children | 10 (1.3%) | 0 (0.0%) |
| 3 or 4 Children | 0 (0.0%) | 8 (28.6%) |
| 5 or more Children | 0 (0.0%) | 0 (0.0%) |
| Total | 26 (1.5%) | 17 (5.7%) |
Race in Kentfield
The most populous races in Kentfield are White / Caucasian (6,324 | 85.3%), Hispanic or Latino (651 | 8.8%), and Two or more Races (522 | 7.0%).
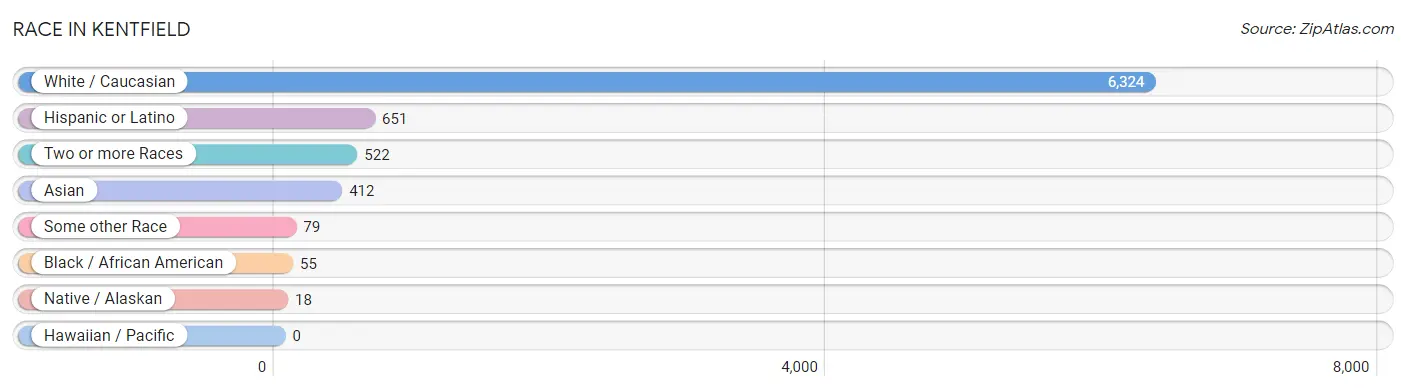
| Race | # Population | % Population |
| Asian | 412 | 5.6% |
| Black / African American | 55 | 0.7% |
| Hawaiian / Pacific | 0 | 0.0% |
| Hispanic or Latino | 651 | 8.8% |
| Native / Alaskan | 18 | 0.2% |
| White / Caucasian | 6,324 | 85.3% |
| Two or more Races | 522 | 7.0% |
| Some other Race | 79 | 1.1% |
| Total | 7,410 | 100.0% |
Ancestry in Kentfield
The most populous ancestries reported in Kentfield are English (1,182 | 16.0%), Irish (1,057 | 14.3%), German (1,028 | 13.9%), Italian (661 | 8.9%), and European (337 | 4.5%), together accounting for 57.6% of all Kentfield residents.
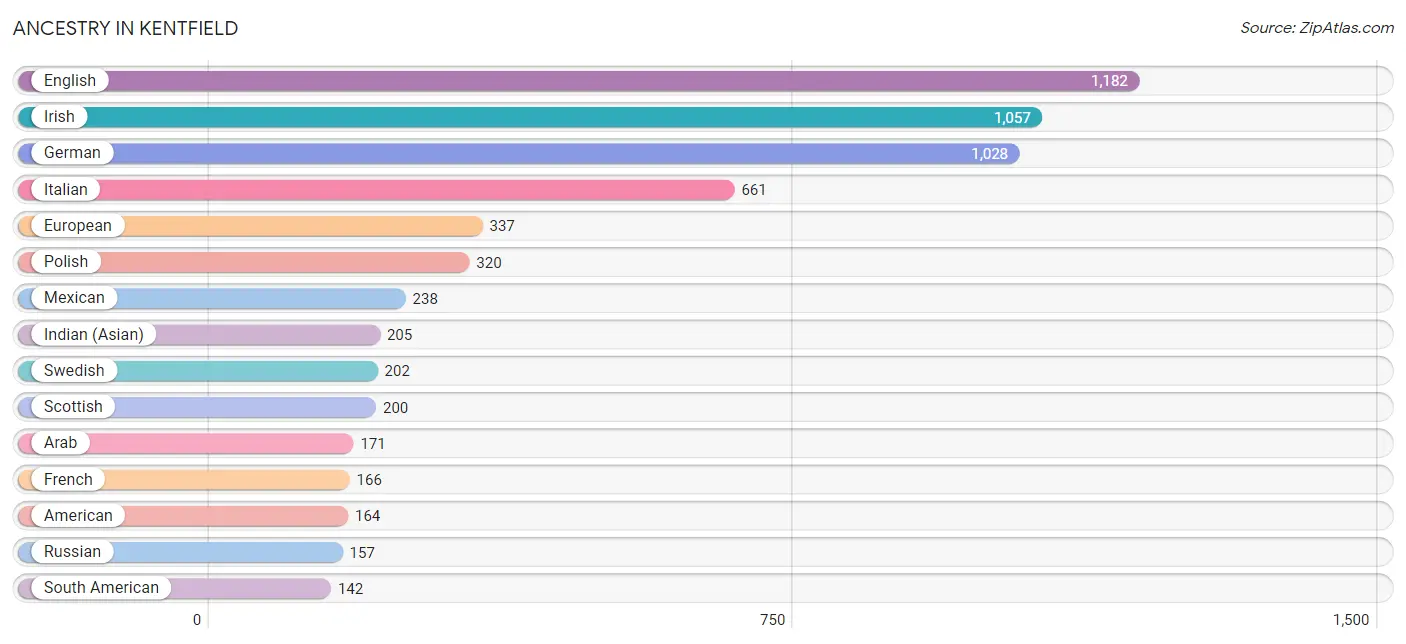
| Ancestry | # Population | % Population |
| American | 164 | 2.2% |
| Arab | 171 | 2.3% |
| Argentinean | 75 | 1.0% |
| Armenian | 23 | 0.3% |
| Austrian | 83 | 1.1% |
| Belgian | 11 | 0.2% |
| Bhutanese | 75 | 1.0% |
| Brazilian | 72 | 1.0% |
| British | 77 | 1.0% |
| Burmese | 47 | 0.6% |
| Canadian | 25 | 0.3% |
| Central American | 121 | 1.6% |
| Chilean | 7 | 0.1% |
| Colombian | 51 | 0.7% |
| Costa Rican | 11 | 0.2% |
| Croatian | 23 | 0.3% |
| Cuban | 37 | 0.5% |
| Czech | 35 | 0.5% |
| Czechoslovakian | 31 | 0.4% |
| Danish | 82 | 1.1% |
| Dutch | 55 | 0.7% |
| Eastern European | 87 | 1.2% |
| Egyptian | 13 | 0.2% |
| English | 1,182 | 16.0% |
| European | 337 | 4.5% |
| Filipino | 86 | 1.2% |
| Finnish | 40 | 0.5% |
| French | 166 | 2.2% |
| German | 1,028 | 13.9% |
| Greek | 69 | 0.9% |
| Hungarian | 36 | 0.5% |
| Indian (Asian) | 205 | 2.8% |
| Iranian | 99 | 1.3% |
| Irish | 1,057 | 14.3% |
| Italian | 661 | 8.9% |
| Jamaican | 57 | 0.8% |
| Korean | 129 | 1.7% |
| Lebanese | 67 | 0.9% |
| Lithuanian | 26 | 0.4% |
| Mexican | 238 | 3.2% |
| Native Hawaiian | 11 | 0.2% |
| Nicaraguan | 12 | 0.2% |
| Northern European | 8 | 0.1% |
| Norwegian | 109 | 1.5% |
| Palestinian | 16 | 0.2% |
| Panamanian | 18 | 0.2% |
| Peruvian | 9 | 0.1% |
| Polish | 320 | 4.3% |
| Portuguese | 102 | 1.4% |
| Puerto Rican | 9 | 0.1% |
| Puget Sound Salish | 6 | 0.1% |
| Romanian | 35 | 0.5% |
| Russian | 157 | 2.1% |
| Salvadoran | 80 | 1.1% |
| Scandinavian | 53 | 0.7% |
| Scotch-Irish | 135 | 1.8% |
| Scottish | 200 | 2.7% |
| Senegalese | 10 | 0.1% |
| Serbian | 11 | 0.2% |
| Sioux | 6 | 0.1% |
| Slovak | 20 | 0.3% |
| South American | 142 | 1.9% |
| Spaniard | 60 | 0.8% |
| Subsaharan African | 10 | 0.1% |
| Swedish | 202 | 2.7% |
| Swiss | 86 | 1.2% |
| Syrian | 75 | 1.0% |
| Thai | 83 | 1.1% |
| Ukrainian | 23 | 0.3% |
| Welsh | 103 | 1.4% | View All 70 Rows |
Immigrants in Kentfield
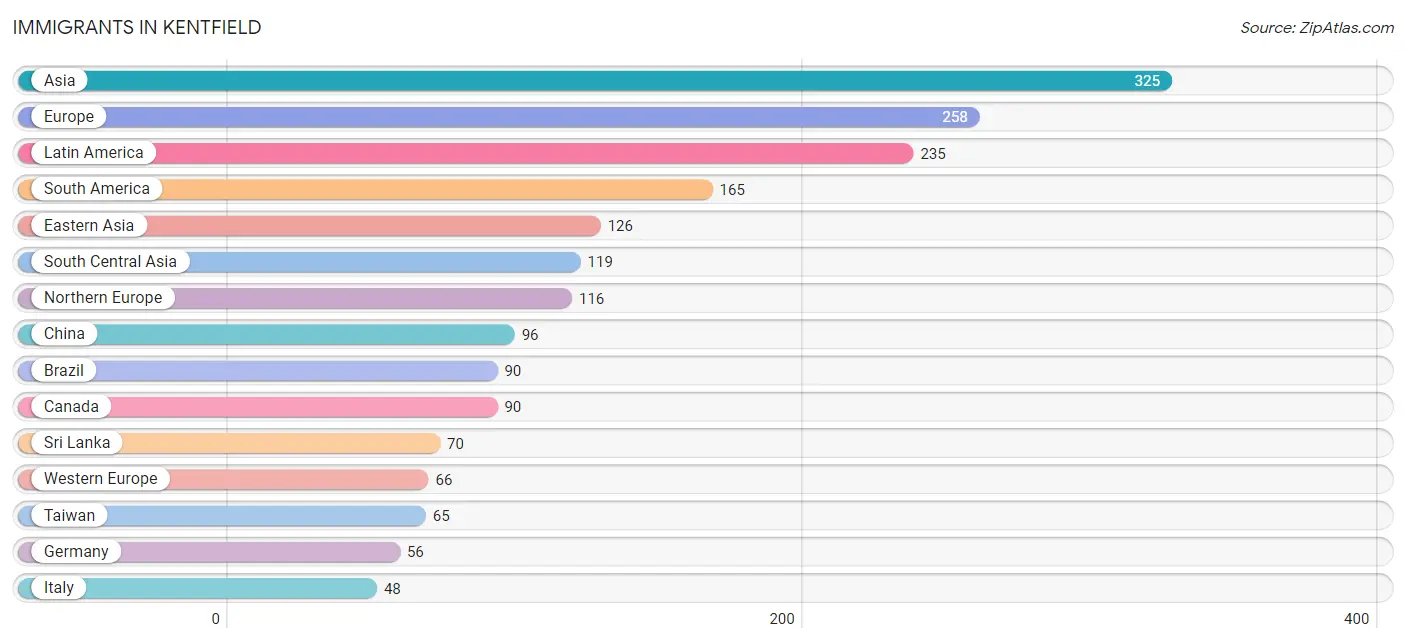
The most numerous immigrant groups reported in Kentfield came from Asia (325 | 4.4%), Europe (258 | 3.5%), Latin America (235 | 3.2%), South America (165 | 2.2%), and Eastern Asia (126 | 1.7%), together accounting for 15.0% of all Kentfield residents.
| Immigration Origin | # Population | % Population |
| Argentina | 11 | 0.2% |
| Asia | 325 | 4.4% |
| Belarus | 8 | 0.1% |
| Brazil | 90 | 1.2% |
| Canada | 90 | 1.2% |
| Caribbean | 29 | 0.4% |
| Central America | 41 | 0.5% |
| Chile | 7 | 0.1% |
| China | 96 | 1.3% |
| Colombia | 20 | 0.3% |
| Costa Rica | 11 | 0.2% |
| Denmark | 22 | 0.3% |
| Eastern Asia | 126 | 1.7% |
| Eastern Europe | 28 | 0.4% |
| El Salvador | 19 | 0.3% |
| England | 31 | 0.4% |
| Europe | 258 | 3.5% |
| Germany | 56 | 0.8% |
| Hong Kong | 8 | 0.1% |
| India | 7 | 0.1% |
| Iran | 42 | 0.6% |
| Ireland | 9 | 0.1% |
| Italy | 48 | 0.6% |
| Jamaica | 29 | 0.4% |
| Japan | 10 | 0.1% |
| Korea | 20 | 0.3% |
| Latin America | 235 | 3.2% |
| Lebanon | 8 | 0.1% |
| Mexico | 11 | 0.2% |
| Northern Europe | 116 | 1.6% |
| Philippines | 45 | 0.6% |
| Poland | 9 | 0.1% |
| Russia | 11 | 0.2% |
| South America | 165 | 2.2% |
| South Central Asia | 119 | 1.6% |
| South Eastern Asia | 45 | 0.6% |
| Southern Europe | 48 | 0.6% |
| Sri Lanka | 70 | 0.9% |
| Sweden | 21 | 0.3% |
| Switzerland | 10 | 0.1% |
| Syria | 27 | 0.4% |
| Taiwan | 65 | 0.9% |
| Uruguay | 37 | 0.5% |
| Western Asia | 35 | 0.5% |
| Western Europe | 66 | 0.9% | View All 45 Rows |
Sex and Age in Kentfield
Sex and Age in Kentfield
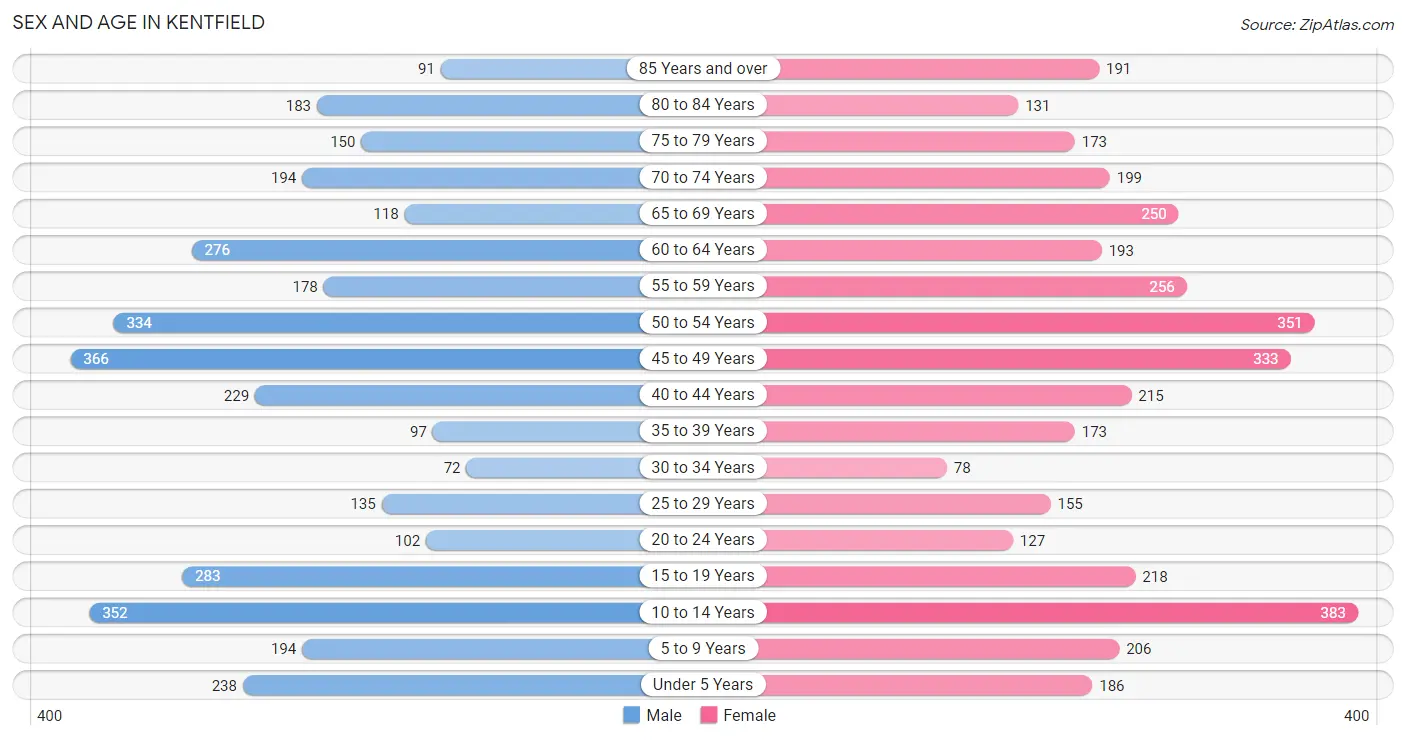
The most populous age groups in Kentfield are 45 to 49 Years (366 | 10.2%) for men and 10 to 14 Years (383 | 10.0%) for women.
| Age Bracket | Male | Female |
| Under 5 Years | 238 (6.6%) | 186 (4.9%) |
| 5 to 9 Years | 194 (5.4%) | 206 (5.4%) |
| 10 to 14 Years | 352 (9.8%) | 383 (10.0%) |
| 15 to 19 Years | 283 (7.9%) | 218 (5.7%) |
| 20 to 24 Years | 102 (2.8%) | 127 (3.3%) |
| 25 to 29 Years | 135 (3.8%) | 155 (4.1%) |
| 30 to 34 Years | 72 (2.0%) | 78 (2.0%) |
| 35 to 39 Years | 97 (2.7%) | 173 (4.5%) |
| 40 to 44 Years | 229 (6.4%) | 215 (5.6%) |
| 45 to 49 Years | 366 (10.2%) | 333 (8.7%) |
| 50 to 54 Years | 334 (9.3%) | 351 (9.2%) |
| 55 to 59 Years | 178 (5.0%) | 256 (6.7%) |
| 60 to 64 Years | 276 (7.7%) | 193 (5.1%) |
| 65 to 69 Years | 118 (3.3%) | 250 (6.6%) |
| 70 to 74 Years | 194 (5.4%) | 199 (5.2%) |
| 75 to 79 Years | 150 (4.2%) | 173 (4.5%) |
| 80 to 84 Years | 183 (5.1%) | 131 (3.4%) |
| 85 Years and over | 91 (2.5%) | 191 (5.0%) |
| Total | 3,592 (100.0%) | 3,818 (100.0%) |
Families and Households in Kentfield
Median Family Size in Kentfield
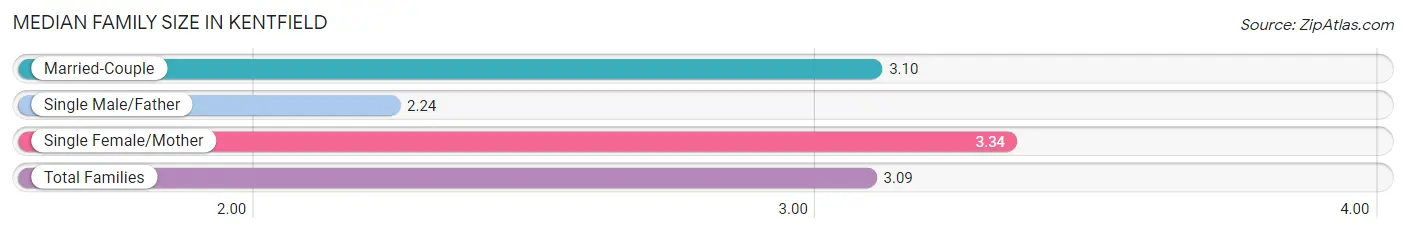
The median family size in Kentfield is 3.09 persons per family, with single female/mother families (208 | 10.3%) accounting for the largest median family size of 3.34 persons per family. On the other hand, single male/father families (88 | 4.4%) represent the smallest median family size with 2.24 persons per family.
| Family Type | # Families | Family Size |
| Married-Couple | 1,715 (85.3%) | 3.10 |
| Single Male/Father | 88 (4.4%) | 2.24 |
| Single Female/Mother | 208 (10.3%) | 3.34 |
| Total Families | 2,011 (100.0%) | 3.09 |
Median Household Size in Kentfield
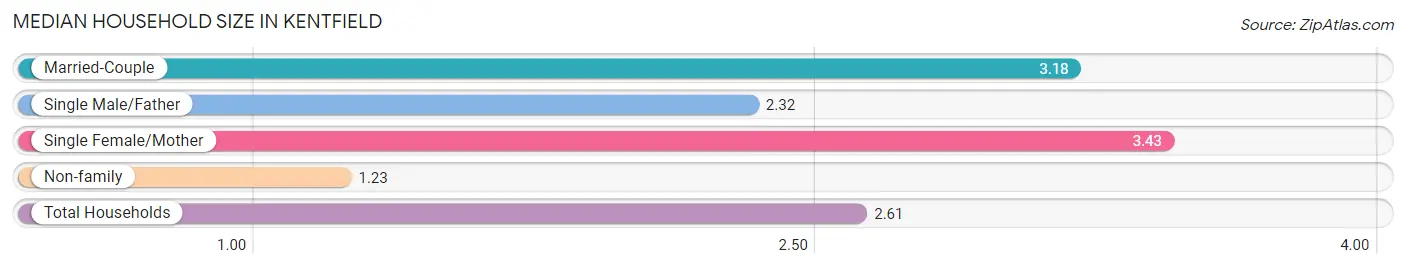
The median household size in Kentfield is 2.61 persons per household, with single female/mother households (208 | 7.3%) accounting for the largest median household size of 3.43 persons per household. non-family households (820 | 29.0%) represent the smallest median household size with 1.23 persons per household.
| Household Type | # Households | Household Size |
| Married-Couple | 1,715 (60.6%) | 3.18 |
| Single Male/Father | 88 (3.1%) | 2.32 |
| Single Female/Mother | 208 (7.3%) | 3.43 |
| Non-family | 820 (29.0%) | 1.23 |
| Total Households | 2,831 (100.0%) | 2.61 |
Household Size by Marriage Status in Kentfield
Out of a total of 2,831 households in Kentfield, 2,011 (71.0%) are family households, while 820 (29.0%) are nonfamily households. The most numerous type of family households are 2-person households, comprising 891, and the most common type of nonfamily households are 1-person households, comprising 661.
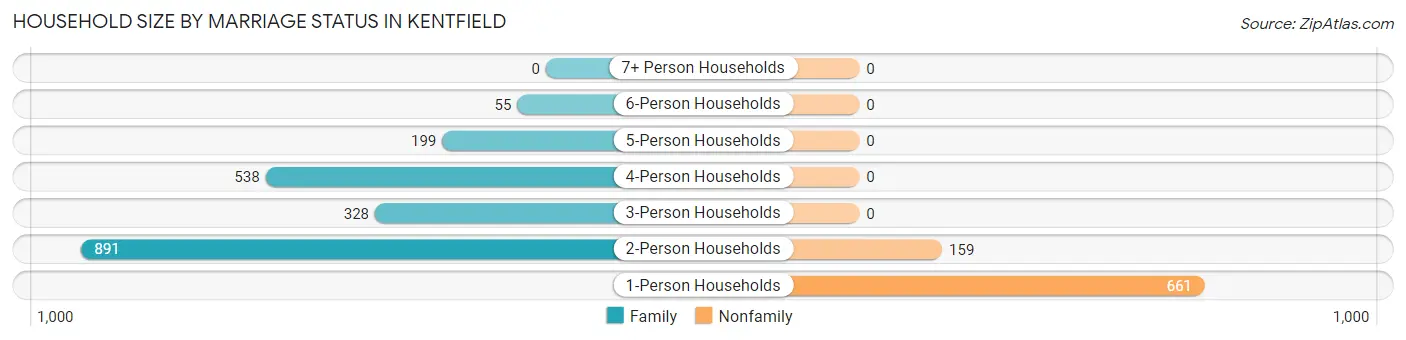
| Household Size | Family Households | Nonfamily Households |
| 1-Person Households | - | 661 (23.4%) |
| 2-Person Households | 891 (31.5%) | 159 (5.6%) |
| 3-Person Households | 328 (11.6%) | 0 (0.0%) |
| 4-Person Households | 538 (19.0%) | 0 (0.0%) |
| 5-Person Households | 199 (7.0%) | 0 (0.0%) |
| 6-Person Households | 55 (1.9%) | 0 (0.0%) |
| 7+ Person Households | 0 (0.0%) | 0 (0.0%) |
| Total | 2,011 (71.0%) | 820 (29.0%) |
Female Fertility in Kentfield
Fertility by Age in Kentfield
Average fertility rate in Kentfield is 41.0 births per 1,000 women. Women in the age bracket of 35 to 50 years have the highest fertility rate with 50.0 births per 1,000 women. Women in the age bracket of 35 to 50 years acount for 70.2% of all women with births.
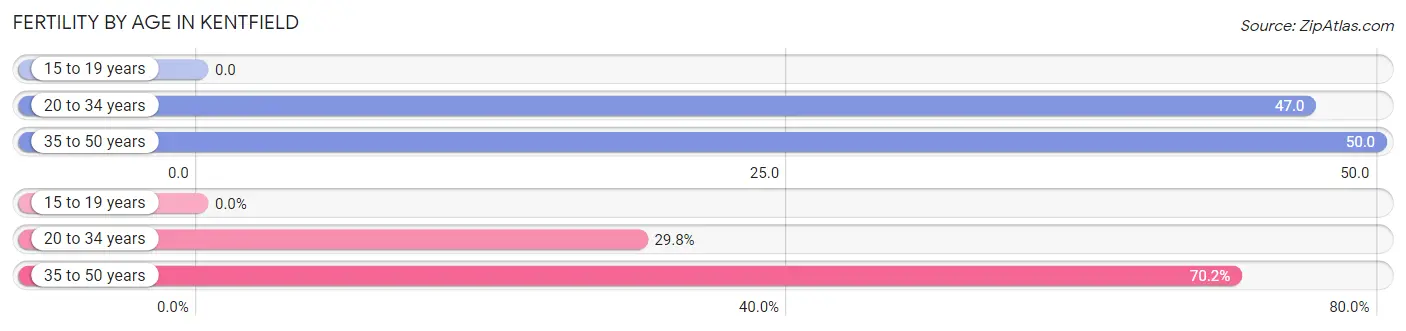
| Age Bracket | Women with Births | Births / 1,000 Women |
| 15 to 19 years | 0 (0.0%) | 0.0 |
| 20 to 34 years | 17 (29.8%) | 47.0 |
| 35 to 50 years | 40 (70.2%) | 50.0 |
| Total | 57 (100.0%) | 41.0 |
Fertility by Age by Marriage Status in Kentfield
93.0% of women with births (57) in Kentfield are married. The highest percentage of unmarried women with births falls into 35 to 50 years age bracket with 7.5% of them unmarried at the time of birth, while the lowest percentage of unmarried women with births belong to 20 to 34 years age bracket with 5.9% of them unmarried.
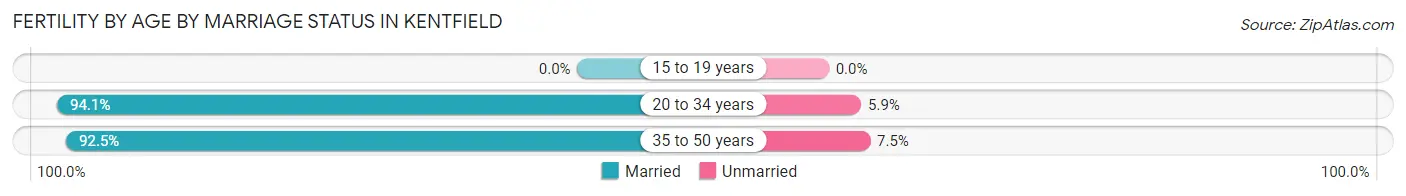
| Age Bracket | Married | Unmarried |
| 15 to 19 years | 0 (0.0%) | 0 (0.0%) |
| 20 to 34 years | 16 (94.1%) | 1 (5.9%) |
| 35 to 50 years | 37 (92.5%) | 3 (7.5%) |
| Total | 53 (93.0%) | 4 (7.0%) |
Fertility by Education in Kentfield
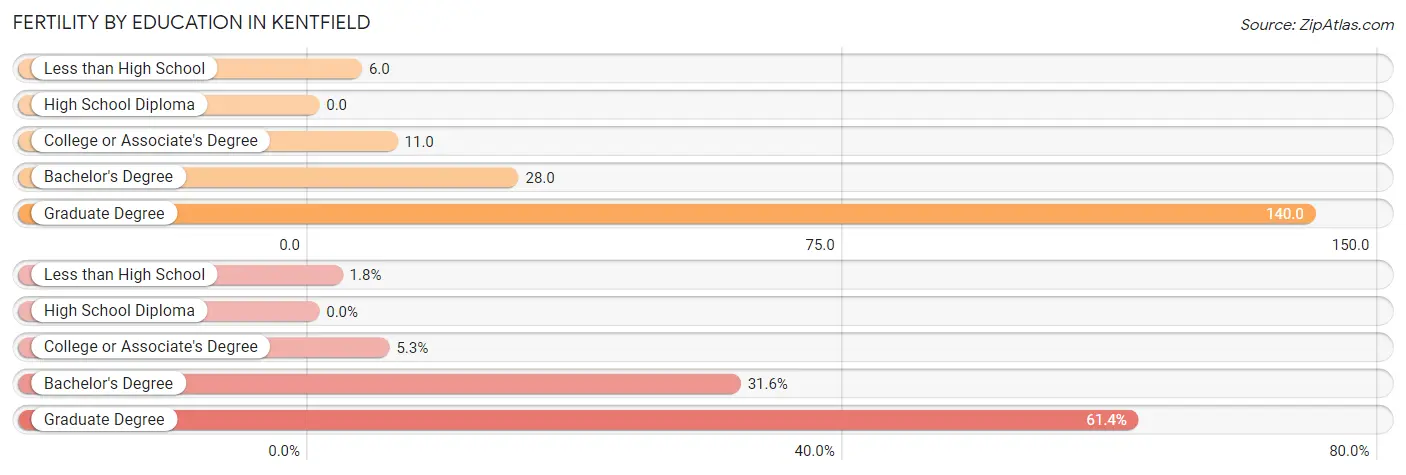
| Educational Attainment | Women with Births | Births / 1,000 Women |
| Less than High School | 1 (1.8%) | 6.0 |
| High School Diploma | 0 (0.0%) | 0.0 |
| College or Associate's Degree | 3 (5.3%) | 11.0 |
| Bachelor's Degree | 18 (31.6%) | 28.0 |
| Graduate Degree | 35 (61.4%) | 140.0 |
| Total | 57 (100.0%) | 41.0 |
Fertility by Education by Marriage Status in Kentfield
7.0% of women with births in Kentfield are unmarried. Women with the educational attainment of bachelor's degree are most likely to be married with 100.0% of them married at childbirth, while women with the educational attainment of less than high school are least likely to be married with 100.0% of them unmarried at childbirth.
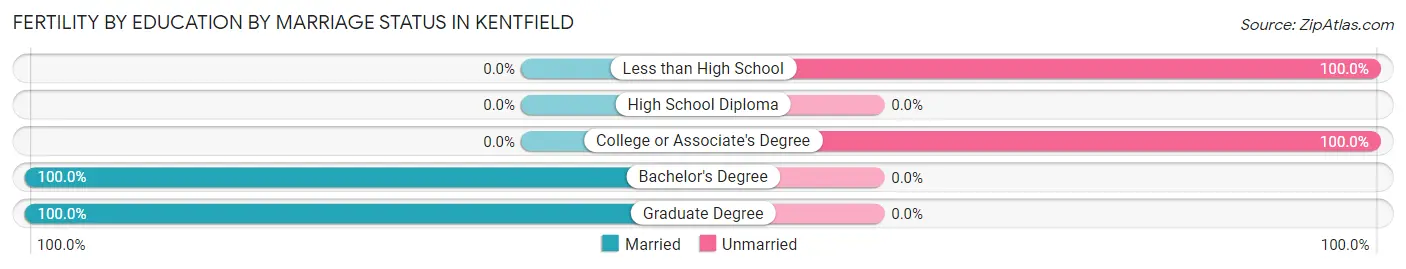
| Educational Attainment | Married | Unmarried |
| Less than High School | 0 (0.0%) | 1 (100.0%) |
| High School Diploma | 0 (0.0%) | 0 (0.0%) |
| College or Associate's Degree | 0 (0.0%) | 3 (100.0%) |
| Bachelor's Degree | 18 (100.0%) | 0 (0.0%) |
| Graduate Degree | 35 (100.0%) | 0 (0.0%) |
| Total | 53 (93.0%) | 4 (7.0%) |
Employment Characteristics in Kentfield
Employment by Class of Employer in Kentfield
Among the 3,266 employed individuals in Kentfield, private company employees (1,987 | 60.8%), self-employed (not incorporated) (453 | 13.9%), and self-employed (incorporated) (351 | 10.7%) make up the most common classes of employment.
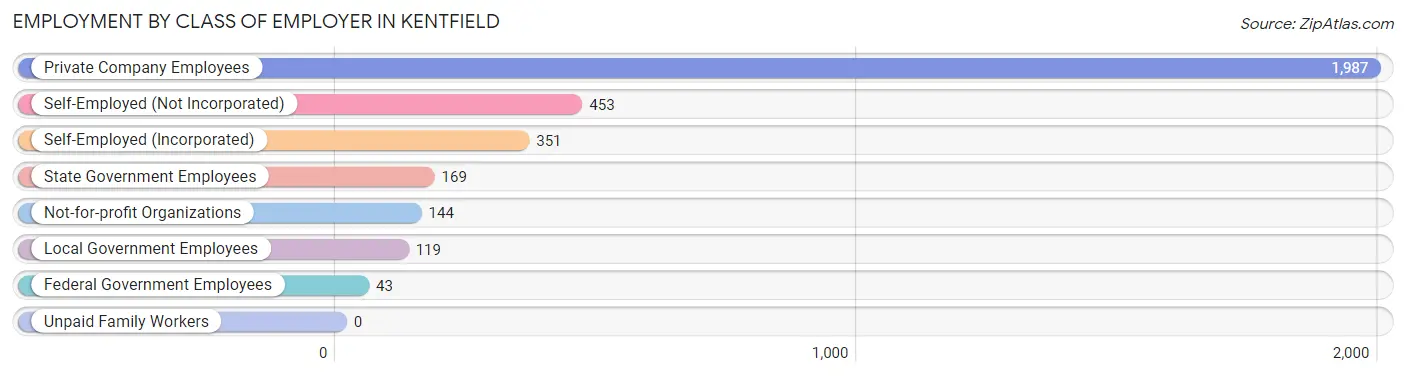
| Employer Class | # Employees | % Employees |
| Private Company Employees | 1,987 | 60.8% |
| Self-Employed (Incorporated) | 351 | 10.7% |
| Self-Employed (Not Incorporated) | 453 | 13.9% |
| Not-for-profit Organizations | 144 | 4.4% |
| Local Government Employees | 119 | 3.6% |
| State Government Employees | 169 | 5.2% |
| Federal Government Employees | 43 | 1.3% |
| Unpaid Family Workers | 0 | 0.0% |
| Total | 3,266 | 100.0% |
Employment Status by Age in Kentfield
According to the labor force statistics for Kentfield, out of the total population over 16 years of age (5,757), 60.7% or 3,494 individuals are in the labor force, with 5.1% or 178 of them unemployed. The age group with the highest labor force participation rate is 25 to 29 years, with 95.5% or 277 individuals in the labor force. Within the labor force, the 20 to 24 years age range has the highest percentage of unemployed individuals, with 34.5% or 51 of them being unemployed.
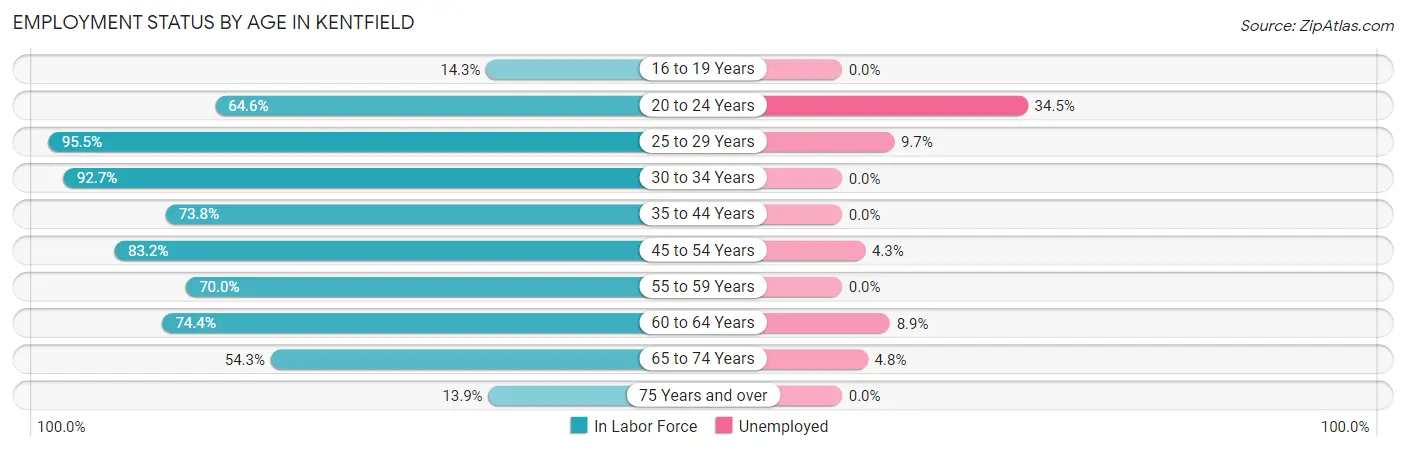
| Age Bracket | In Labor Force | Unemployed |
| 16 to 19 Years | 58 (14.3%) | 0 (0.0%) |
| 20 to 24 Years | 148 (64.6%) | 51 (34.5%) |
| 25 to 29 Years | 277 (95.5%) | 27 (9.7%) |
| 30 to 34 Years | 139 (92.7%) | 0 (0.0%) |
| 35 to 44 Years | 527 (73.8%) | 0 (0.0%) |
| 45 to 54 Years | 1,151 (83.2%) | 49 (4.3%) |
| 55 to 59 Years | 304 (70.0%) | 0 (0.0%) |
| 60 to 64 Years | 349 (74.4%) | 31 (8.9%) |
| 65 to 74 Years | 413 (54.3%) | 20 (4.8%) |
| 75 Years and over | 128 (13.9%) | 0 (0.0%) |
| Total | 3,494 (60.7%) | 178 (5.1%) |
Employment Status by Educational Attainment in Kentfield
According to labor force statistics for Kentfield, 79.9% of individuals (2,749) out of the total population between 25 and 64 years of age (3,441) are in the labor force, with 3.9% or 107 of them being unemployed. The group with the highest labor force participation rate are those with the educational attainment of high school diploma, with 95.7% or 132 individuals in the labor force. Within the labor force, individuals with high school diploma education have the highest percentage of unemployment, with 18.9% or 25 of them being unemployed.
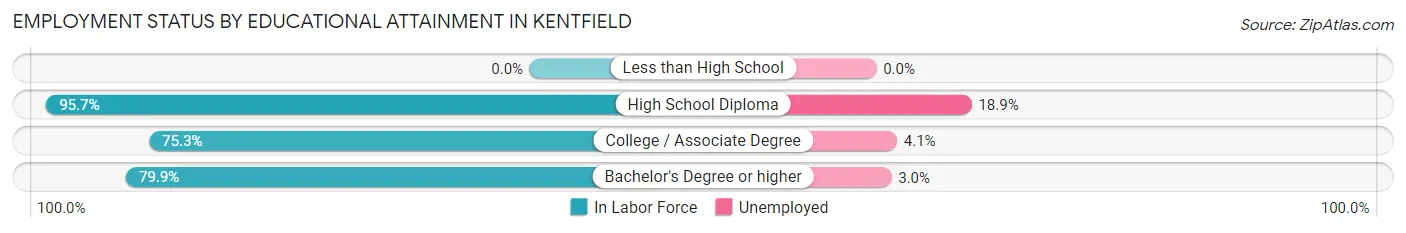
| Educational Attainment | In Labor Force | Unemployed |
| Less than High School | 0 (0.0%) | 0 (0.0%) |
| High School Diploma | 132 (95.7%) | 26 (18.9%) |
| College / Associate Degree | 394 (75.3%) | 21 (4.1%) |
| Bachelor's Degree or higher | 2,221 (79.9%) | 83 (3.0%) |
| Total | 2,749 (79.9%) | 134 (3.9%) |
Employment Occupations by Sex in Kentfield
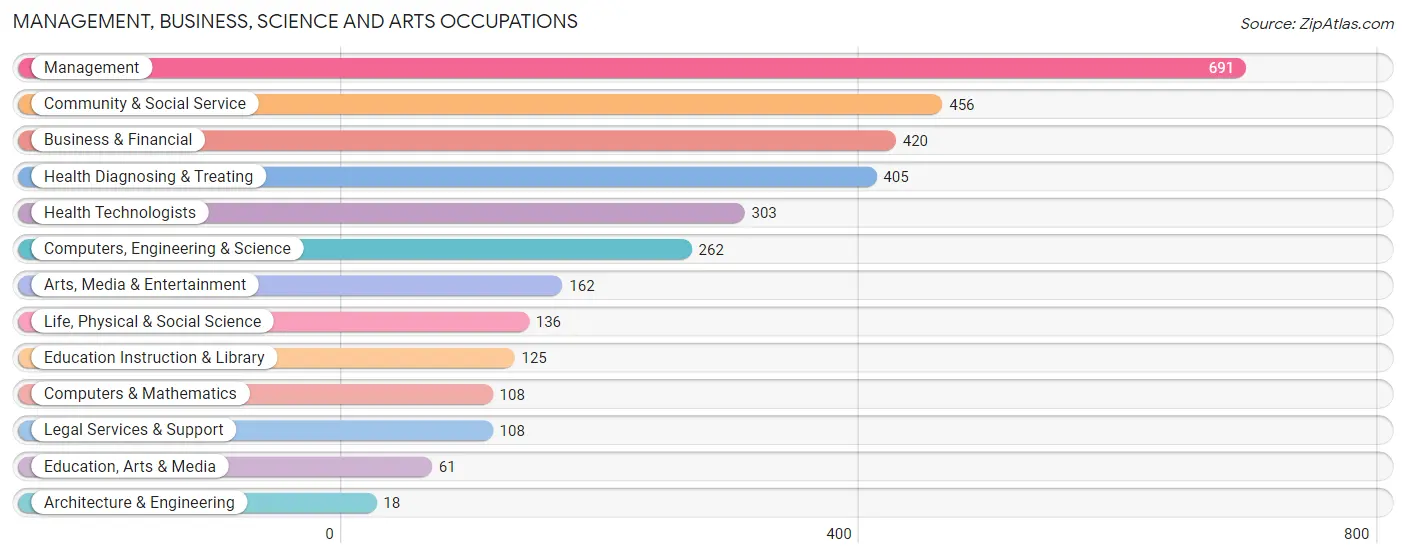
Management, Business, Science and Arts Occupations
The most common Management, Business, Science and Arts occupations in Kentfield are Management (691 | 20.8%), Community & Social Service (456 | 13.8%), Business & Financial (420 | 12.7%), Health Diagnosing & Treating (405 | 12.2%), and Health Technologists (303 | 9.1%).
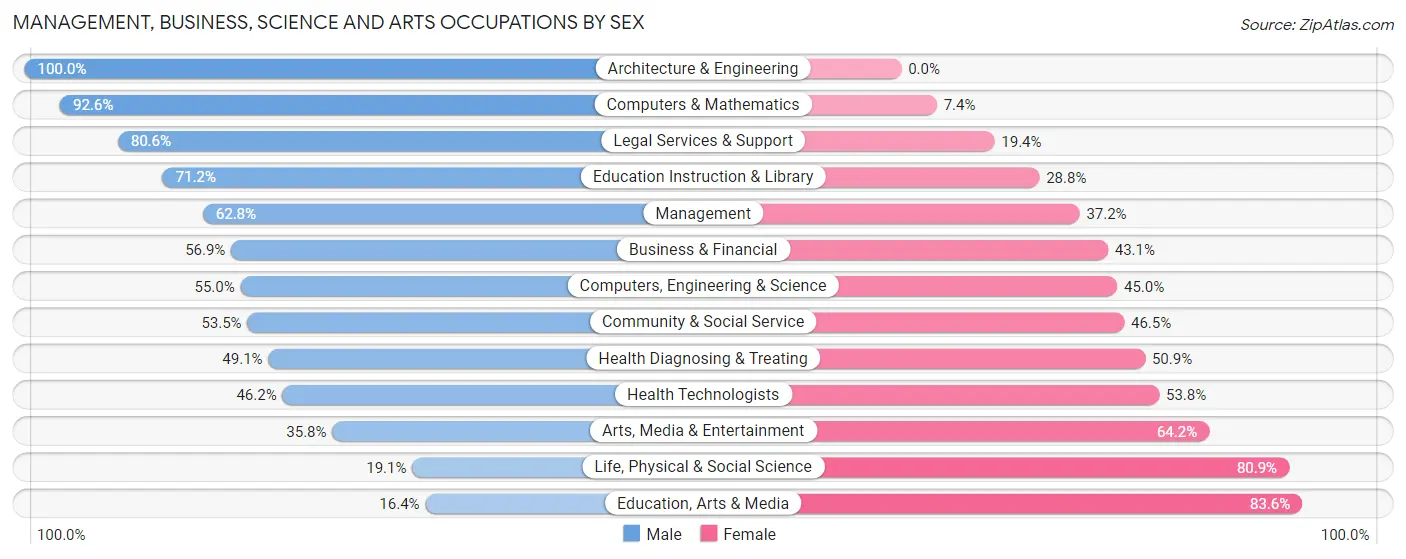
Management, Business, Science and Arts Occupations by Sex
Within the Management, Business, Science and Arts occupations in Kentfield, the most male-oriented occupations are Architecture & Engineering (100.0%), Computers & Mathematics (92.6%), and Legal Services & Support (80.6%), while the most female-oriented occupations are Education, Arts & Media (83.6%), Life, Physical & Social Science (80.9%), and Arts, Media & Entertainment (64.2%).
| Occupation | Male | Female |
| Management | 434 (62.8%) | 257 (37.2%) |
| Business & Financial | 239 (56.9%) | 181 (43.1%) |
| Computers, Engineering & Science | 144 (55.0%) | 118 (45.0%) |
| Computers & Mathematics | 100 (92.6%) | 8 (7.4%) |
| Architecture & Engineering | 18 (100.0%) | 0 (0.0%) |
| Life, Physical & Social Science | 26 (19.1%) | 110 (80.9%) |
| Community & Social Service | 244 (53.5%) | 212 (46.5%) |
| Education, Arts & Media | 10 (16.4%) | 51 (83.6%) |
| Legal Services & Support | 87 (80.6%) | 21 (19.4%) |
| Education Instruction & Library | 89 (71.2%) | 36 (28.8%) |
| Arts, Media & Entertainment | 58 (35.8%) | 104 (64.2%) |
| Health Diagnosing & Treating | 199 (49.1%) | 206 (50.9%) |
| Health Technologists | 140 (46.2%) | 163 (53.8%) |
| Total (Category) | 1,260 (56.4%) | 974 (43.6%) |
| Total (Overall) | 1,842 (55.5%) | 1,474 (44.5%) |
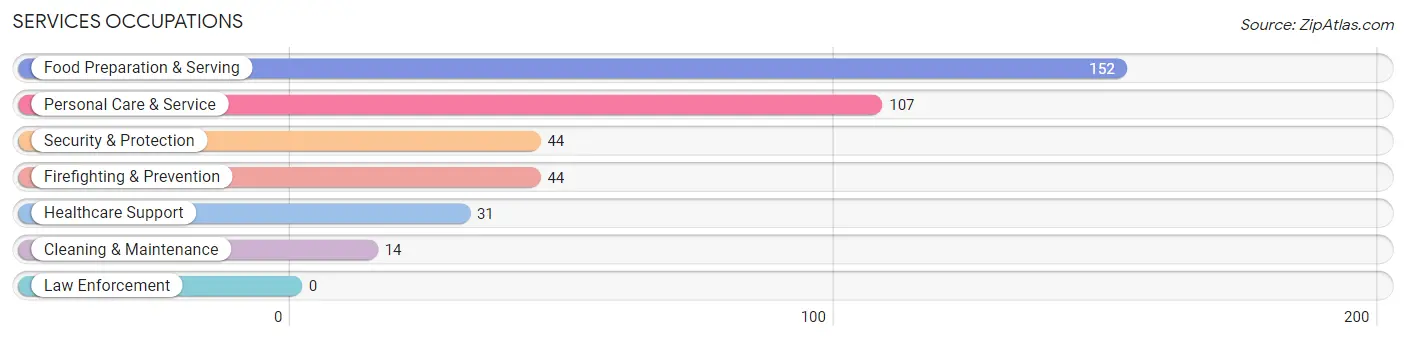
Services Occupations
The most common Services occupations in Kentfield are Food Preparation & Serving (152 | 4.6%), Personal Care & Service (107 | 3.2%), Security & Protection (44 | 1.3%), Firefighting & Prevention (44 | 1.3%), and Healthcare Support (31 | 0.9%).
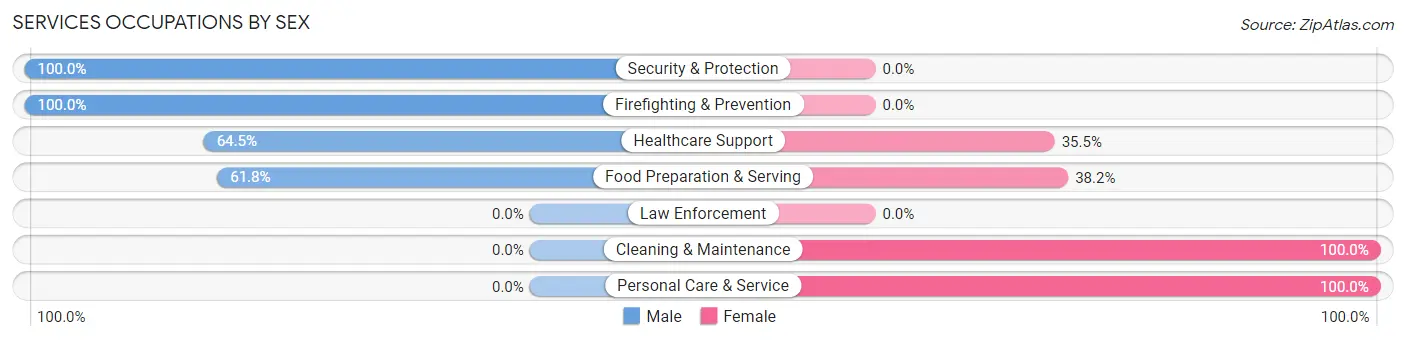
Services Occupations by Sex
Within the Services occupations in Kentfield, the most male-oriented occupations are Security & Protection (100.0%), Firefighting & Prevention (100.0%), and Healthcare Support (64.5%), while the most female-oriented occupations are Cleaning & Maintenance (100.0%), Personal Care & Service (100.0%), and Food Preparation & Serving (38.2%).
| Occupation | Male | Female |
| Healthcare Support | 20 (64.5%) | 11 (35.5%) |
| Security & Protection | 44 (100.0%) | 0 (0.0%) |
| Firefighting & Prevention | 44 (100.0%) | 0 (0.0%) |
| Law Enforcement | 0 (0.0%) | 0 (0.0%) |
| Food Preparation & Serving | 94 (61.8%) | 58 (38.2%) |
| Cleaning & Maintenance | 0 (0.0%) | 14 (100.0%) |
| Personal Care & Service | 0 (0.0%) | 107 (100.0%) |
| Total (Category) | 158 (45.4%) | 190 (54.6%) |
| Total (Overall) | 1,842 (55.5%) | 1,474 (44.5%) |
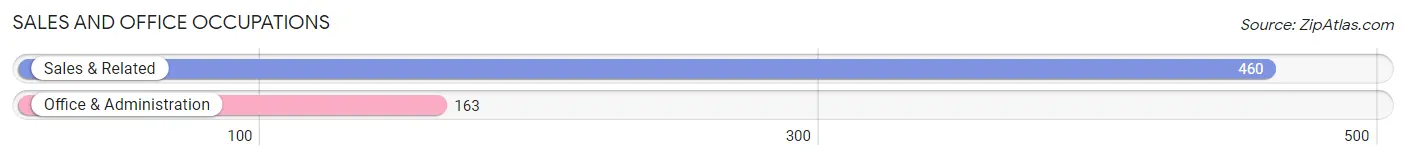
Sales and Office Occupations
The most common Sales and Office occupations in Kentfield are Sales & Related (460 | 13.9%), and Office & Administration (163 | 4.9%).
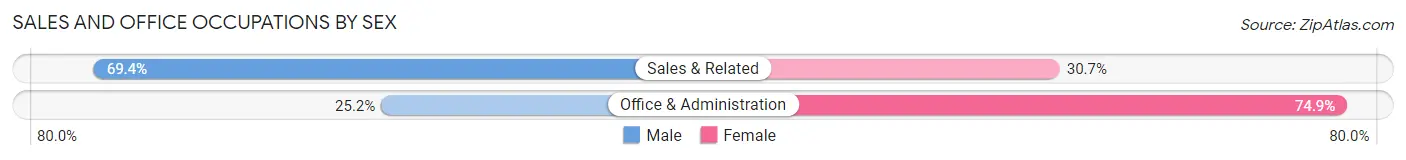
Sales and Office Occupations by Sex
| Occupation | Male | Female |
| Sales & Related | 319 (69.4%) | 141 (30.6%) |
| Office & Administration | 41 (25.2%) | 122 (74.9%) |
| Total (Category) | 360 (57.8%) | 263 (42.2%) |
| Total (Overall) | 1,842 (55.5%) | 1,474 (44.5%) |
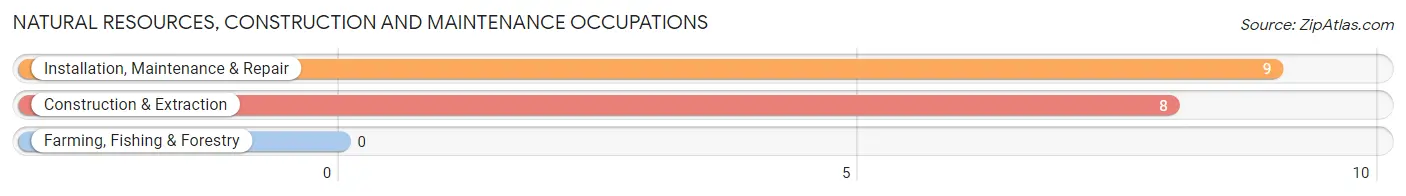
Natural Resources, Construction and Maintenance Occupations
The most common Natural Resources, Construction and Maintenance occupations in Kentfield are Installation, Maintenance & Repair (9 | 0.3%), and Construction & Extraction (8 | 0.2%).
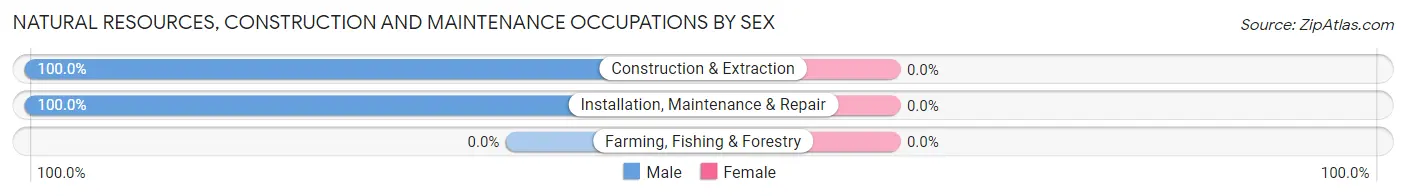
Natural Resources, Construction and Maintenance Occupations by Sex
| Occupation | Male | Female |
| Farming, Fishing & Forestry | 0 (0.0%) | 0 (0.0%) |
| Construction & Extraction | 8 (100.0%) | 0 (0.0%) |
| Installation, Maintenance & Repair | 9 (100.0%) | 0 (0.0%) |
| Total (Category) | 17 (100.0%) | 0 (0.0%) |
| Total (Overall) | 1,842 (55.5%) | 1,474 (44.5%) |
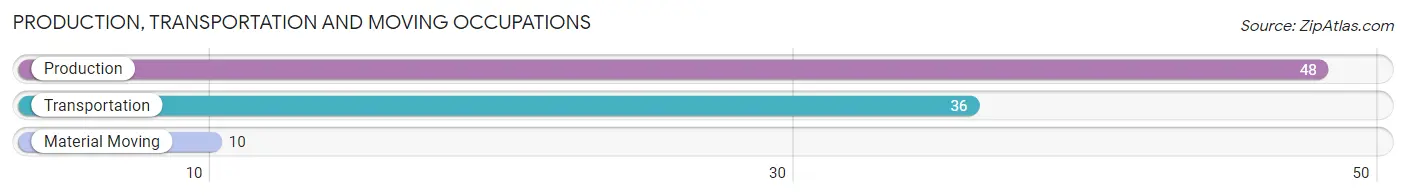
Production, Transportation and Moving Occupations
The most common Production, Transportation and Moving occupations in Kentfield are Production (48 | 1.5%), Transportation (36 | 1.1%), and Material Moving (10 | 0.3%).
Production, Transportation and Moving Occupations by Sex
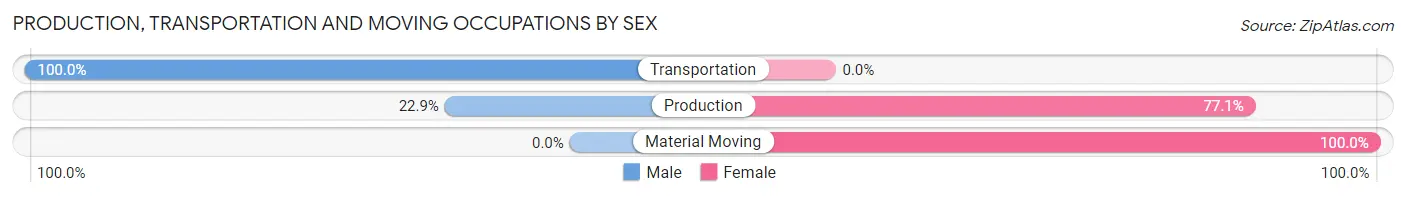
| Occupation | Male | Female |
| Production | 11 (22.9%) | 37 (77.1%) |
| Transportation | 36 (100.0%) | 0 (0.0%) |
| Material Moving | 0 (0.0%) | 10 (100.0%) |
| Total (Category) | 47 (50.0%) | 47 (50.0%) |
| Total (Overall) | 1,842 (55.5%) | 1,474 (44.5%) |
Employment Industries by Sex in Kentfield
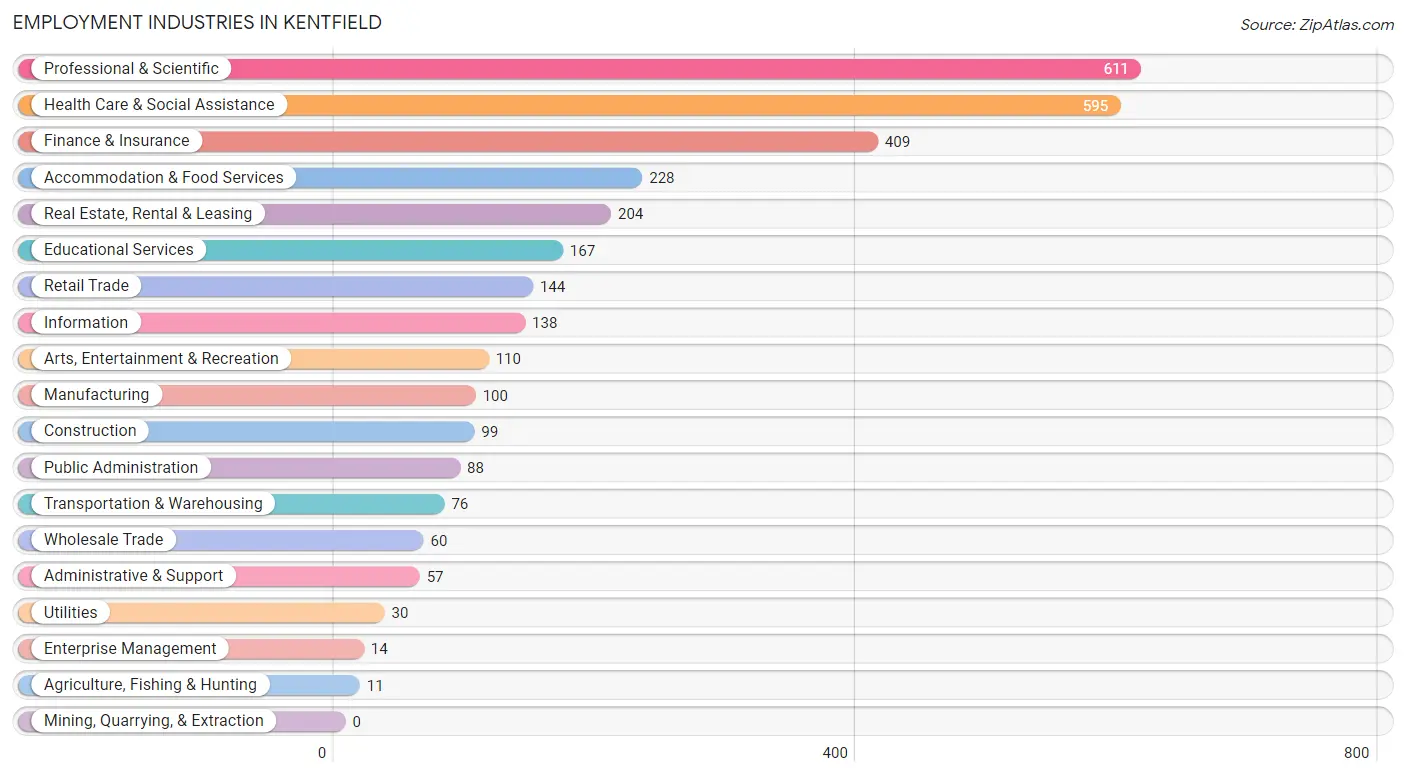
Employment Industries in Kentfield
The major employment industries in Kentfield include Professional & Scientific (611 | 18.4%), Health Care & Social Assistance (595 | 17.9%), Finance & Insurance (409 | 12.3%), Accommodation & Food Services (228 | 6.9%), and Real Estate, Rental & Leasing (204 | 6.1%).
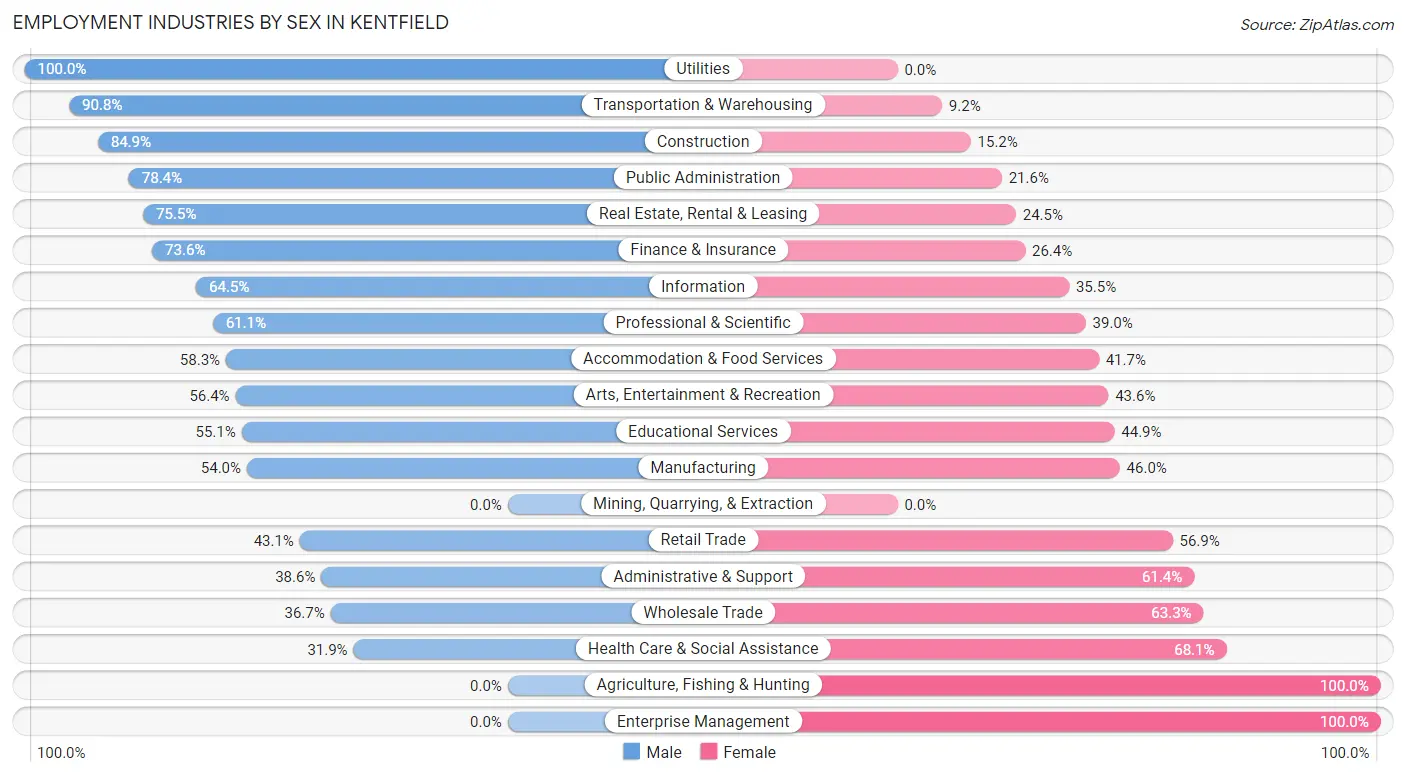
Employment Industries by Sex in Kentfield
The Kentfield industries that see more men than women are Utilities (100.0%), Transportation & Warehousing (90.8%), and Construction (84.9%), whereas the industries that tend to have a higher number of women are Agriculture, Fishing & Hunting (100.0%), Enterprise Management (100.0%), and Health Care & Social Assistance (68.1%).
| Industry | Male | Female |
| Agriculture, Fishing & Hunting | 0 (0.0%) | 11 (100.0%) |
| Mining, Quarrying, & Extraction | 0 (0.0%) | 0 (0.0%) |
| Construction | 84 (84.9%) | 15 (15.1%) |
| Manufacturing | 54 (54.0%) | 46 (46.0%) |
| Wholesale Trade | 22 (36.7%) | 38 (63.3%) |
| Retail Trade | 62 (43.1%) | 82 (56.9%) |
| Transportation & Warehousing | 69 (90.8%) | 7 (9.2%) |
| Utilities | 30 (100.0%) | 0 (0.0%) |
| Information | 89 (64.5%) | 49 (35.5%) |
| Finance & Insurance | 301 (73.6%) | 108 (26.4%) |
| Real Estate, Rental & Leasing | 154 (75.5%) | 50 (24.5%) |
| Professional & Scientific | 373 (61.1%) | 238 (39.0%) |
| Enterprise Management | 0 (0.0%) | 14 (100.0%) |
| Administrative & Support | 22 (38.6%) | 35 (61.4%) |
| Educational Services | 92 (55.1%) | 75 (44.9%) |
| Health Care & Social Assistance | 190 (31.9%) | 405 (68.1%) |
| Arts, Entertainment & Recreation | 62 (56.4%) | 48 (43.6%) |
| Accommodation & Food Services | 133 (58.3%) | 95 (41.7%) |
| Public Administration | 69 (78.4%) | 19 (21.6%) |
| Total | 1,842 (55.5%) | 1,474 (44.5%) |
Education in Kentfield
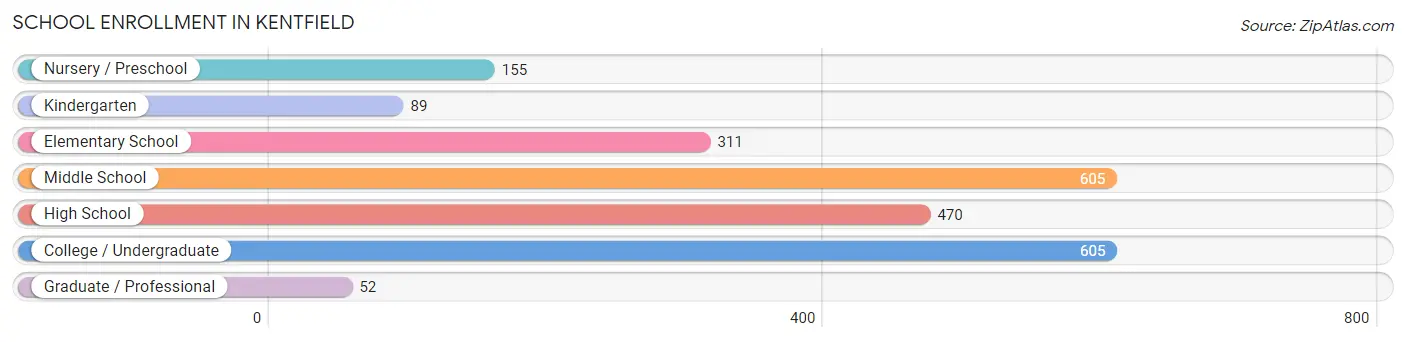
School Enrollment in Kentfield
The most common levels of schooling among the 2,287 students in Kentfield are middle school (605 | 26.5%), college / undergraduate (605 | 26.5%), and high school (470 | 20.5%).
| School Level | # Students | % Students |
| Nursery / Preschool | 155 | 6.8% |
| Kindergarten | 89 | 3.9% |
| Elementary School | 311 | 13.6% |
| Middle School | 605 | 26.5% |
| High School | 470 | 20.5% |
| College / Undergraduate | 605 | 26.5% |
| Graduate / Professional | 52 | 2.3% |
| Total | 2,287 | 100.0% |
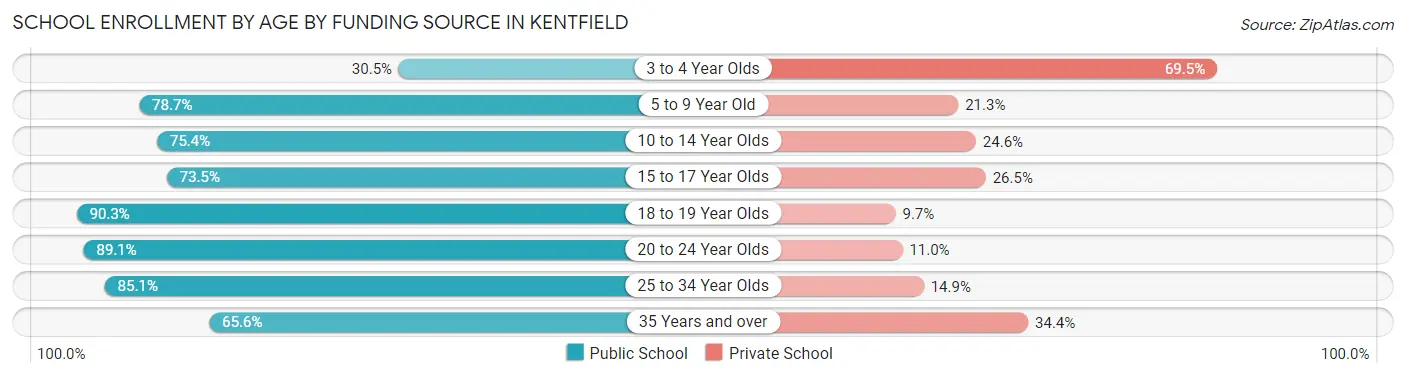
School Enrollment by Age by Funding Source in Kentfield
Out of a total of 2,287 students who are enrolled in schools in Kentfield, 558 (24.4%) attend a private institution, while the remaining 1,729 (75.6%) are enrolled in public schools. The age group of 3 to 4 year olds has the highest likelihood of being enrolled in private schools, with 89 (69.5% in the age bracket) enrolled. Conversely, the age group of 18 to 19 year olds has the lowest likelihood of being enrolled in a private school, with 159 (90.3% in the age bracket) attending a public institution.
| Age Bracket | Public School | Private School |
| 3 to 4 Year Olds | 39 (30.5%) | 89 (69.5%) |
| 5 to 9 Year Old | 306 (78.7%) | 83 (21.3%) |
| 10 to 14 Year Olds | 554 (75.4%) | 181 (24.6%) |
| 15 to 17 Year Olds | 239 (73.5%) | 86 (26.5%) |
| 18 to 19 Year Olds | 159 (90.3%) | 17 (9.7%) |
| 20 to 24 Year Olds | 187 (89.0%) | 23 (11.0%) |
| 25 to 34 Year Olds | 137 (85.1%) | 24 (14.9%) |
| 35 Years and over | 107 (65.6%) | 56 (34.4%) |
| Total | 1,729 (75.6%) | 558 (24.4%) |
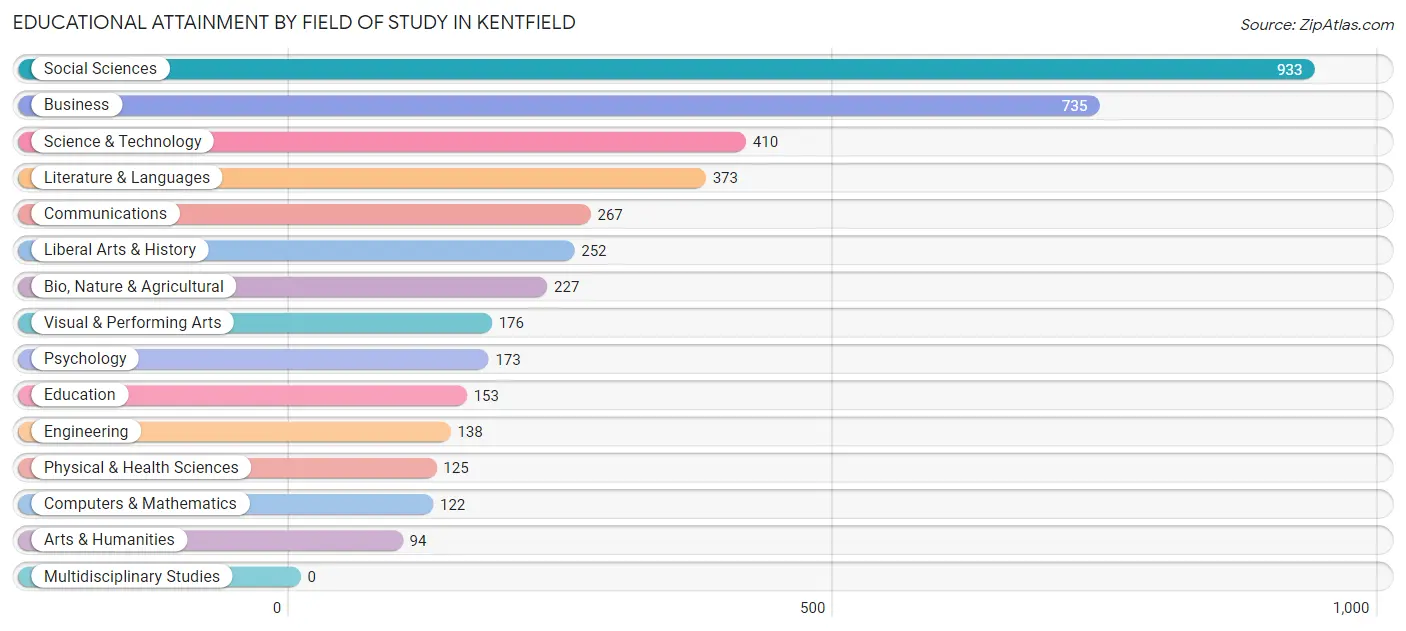
Educational Attainment by Field of Study in Kentfield
Social sciences (933 | 22.3%), business (735 | 17.6%), science & technology (410 | 9.8%), literature & languages (373 | 8.9%), and communications (267 | 6.4%) are the most common fields of study among 4,178 individuals in Kentfield who have obtained a bachelor's degree or higher.
| Field of Study | # Graduates | % Graduates |
| Computers & Mathematics | 122 | 2.9% |
| Bio, Nature & Agricultural | 227 | 5.4% |
| Physical & Health Sciences | 125 | 3.0% |
| Psychology | 173 | 4.1% |
| Social Sciences | 933 | 22.3% |
| Engineering | 138 | 3.3% |
| Multidisciplinary Studies | 0 | 0.0% |
| Science & Technology | 410 | 9.8% |
| Business | 735 | 17.6% |
| Education | 153 | 3.7% |
| Literature & Languages | 373 | 8.9% |
| Liberal Arts & History | 252 | 6.0% |
| Visual & Performing Arts | 176 | 4.2% |
| Communications | 267 | 6.4% |
| Arts & Humanities | 94 | 2.2% |
| Total | 4,178 | 100.0% |
Transportation & Commute in Kentfield
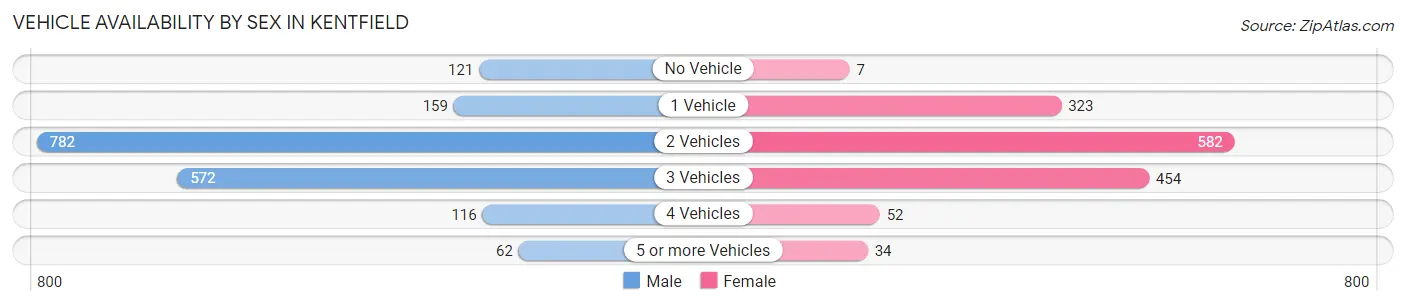
Vehicle Availability by Sex in Kentfield
The most prevalent vehicle ownership categories in Kentfield are males with 2 vehicles (782, accounting for 43.2%) and females with 2 vehicles (582, making up 53.9%).
| Vehicles Available | Male | Female |
| No Vehicle | 121 (6.7%) | 7 (0.5%) |
| 1 Vehicle | 159 (8.8%) | 323 (22.3%) |
| 2 Vehicles | 782 (43.2%) | 582 (40.1%) |
| 3 Vehicles | 572 (31.6%) | 454 (31.3%) |
| 4 Vehicles | 116 (6.4%) | 52 (3.6%) |
| 5 or more Vehicles | 62 (3.4%) | 34 (2.3%) |
| Total | 1,812 (100.0%) | 1,452 (100.0%) |
Commute Time in Kentfield
The most frequently occuring commute durations in Kentfield are 45 to 59 minutes (398 commuters, 19.5%), 10 to 14 minutes (367 commuters, 18.0%), and 5 to 9 minutes (245 commuters, 12.0%).
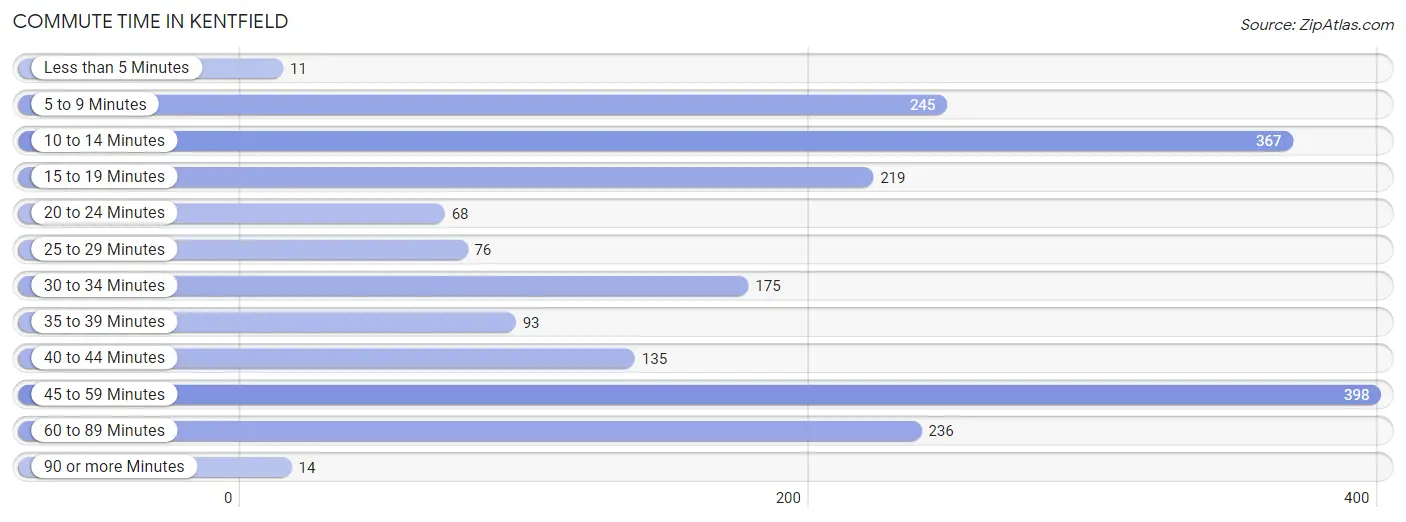
| Commute Time | # Commuters | % Commuters |
| Less than 5 Minutes | 11 | 0.5% |
| 5 to 9 Minutes | 245 | 12.0% |
| 10 to 14 Minutes | 367 | 18.0% |
| 15 to 19 Minutes | 219 | 10.7% |
| 20 to 24 Minutes | 68 | 3.3% |
| 25 to 29 Minutes | 76 | 3.7% |
| 30 to 34 Minutes | 175 | 8.6% |
| 35 to 39 Minutes | 93 | 4.6% |
| 40 to 44 Minutes | 135 | 6.6% |
| 45 to 59 Minutes | 398 | 19.5% |
| 60 to 89 Minutes | 236 | 11.6% |
| 90 or more Minutes | 14 | 0.7% |
Commute Time by Sex in Kentfield
The most common commute times in Kentfield are 45 to 59 minutes (315 commuters, 25.8%) for males and 10 to 14 minutes (206 commuters, 25.3%) for females.
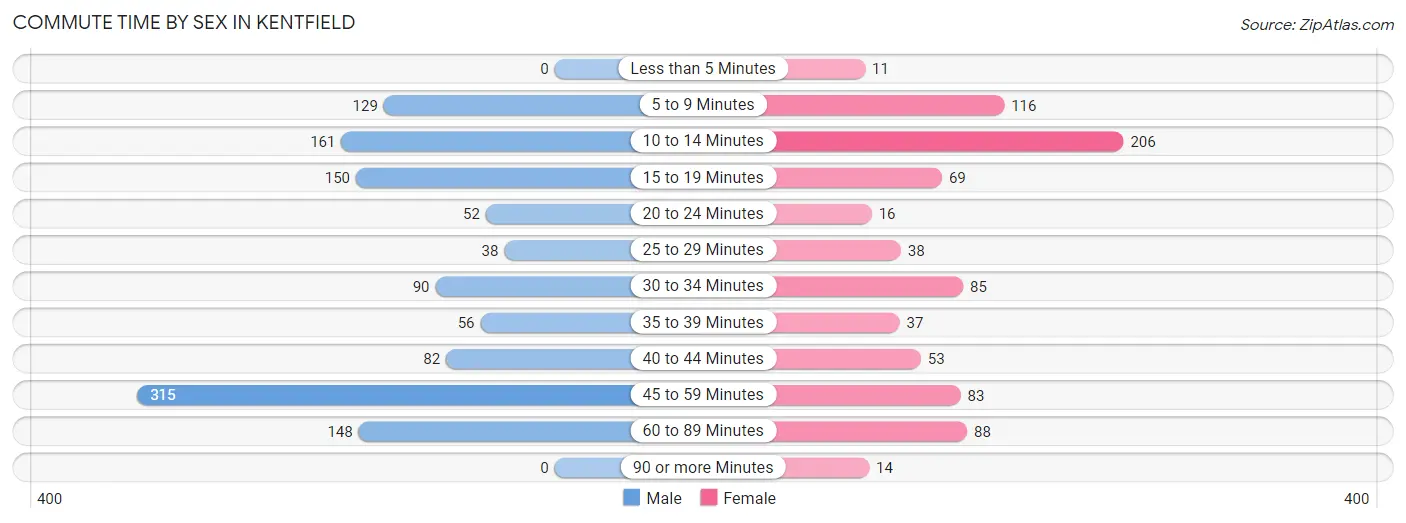
| Commute Time | Male | Female |
| Less than 5 Minutes | 0 (0.0%) | 11 (1.3%) |
| 5 to 9 Minutes | 129 (10.6%) | 116 (14.2%) |
| 10 to 14 Minutes | 161 (13.2%) | 206 (25.3%) |
| 15 to 19 Minutes | 150 (12.3%) | 69 (8.5%) |
| 20 to 24 Minutes | 52 (4.3%) | 16 (2.0%) |
| 25 to 29 Minutes | 38 (3.1%) | 38 (4.7%) |
| 30 to 34 Minutes | 90 (7.4%) | 85 (10.4%) |
| 35 to 39 Minutes | 56 (4.6%) | 37 (4.5%) |
| 40 to 44 Minutes | 82 (6.7%) | 53 (6.5%) |
| 45 to 59 Minutes | 315 (25.8%) | 83 (10.2%) |
| 60 to 89 Minutes | 148 (12.1%) | 88 (10.8%) |
| 90 or more Minutes | 0 (0.0%) | 14 (1.7%) |
Time of Departure to Work by Sex in Kentfield
The most frequent times of departure to work in Kentfield are 7:30 AM to 7:59 AM (210, 17.2%) for males and 7:00 AM to 7:29 AM (169, 20.7%) for females.
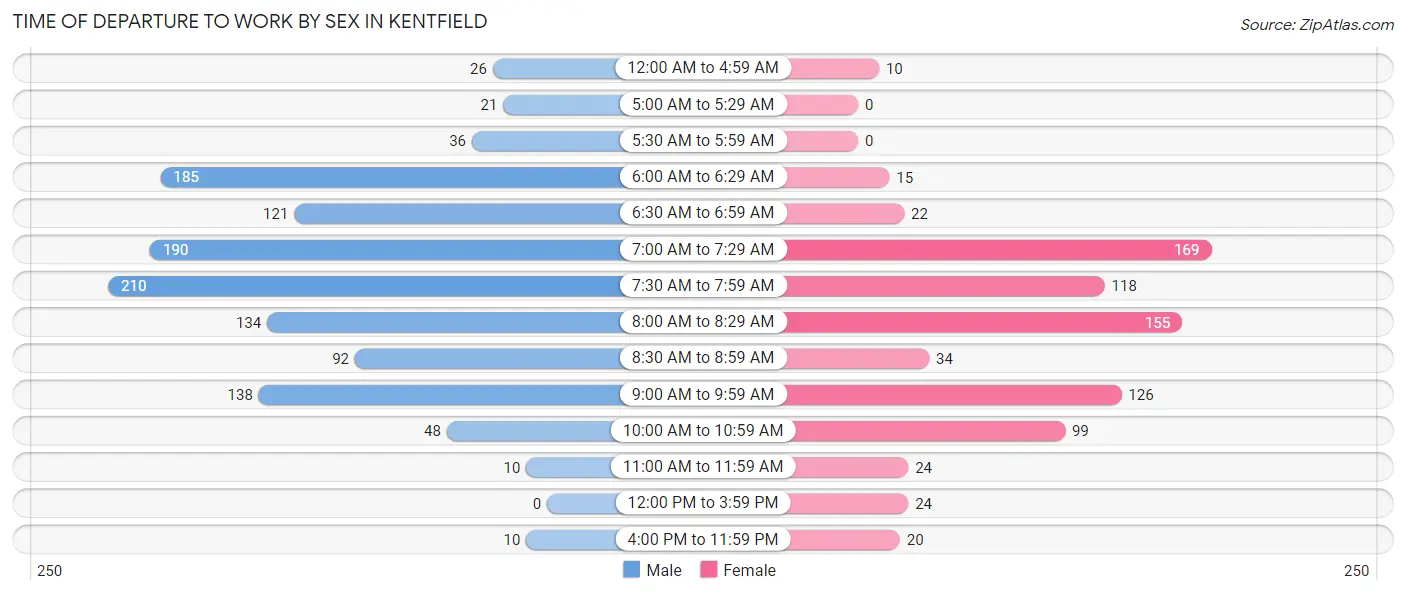
| Time of Departure | Male | Female |
| 12:00 AM to 4:59 AM | 26 (2.1%) | 10 (1.2%) |
| 5:00 AM to 5:29 AM | 21 (1.7%) | 0 (0.0%) |
| 5:30 AM to 5:59 AM | 36 (2.9%) | 0 (0.0%) |
| 6:00 AM to 6:29 AM | 185 (15.1%) | 15 (1.8%) |
| 6:30 AM to 6:59 AM | 121 (9.9%) | 22 (2.7%) |
| 7:00 AM to 7:29 AM | 190 (15.6%) | 169 (20.7%) |
| 7:30 AM to 7:59 AM | 210 (17.2%) | 118 (14.5%) |
| 8:00 AM to 8:29 AM | 134 (11.0%) | 155 (19.0%) |
| 8:30 AM to 8:59 AM | 92 (7.5%) | 34 (4.2%) |
| 9:00 AM to 9:59 AM | 138 (11.3%) | 126 (15.4%) |
| 10:00 AM to 10:59 AM | 48 (3.9%) | 99 (12.1%) |
| 11:00 AM to 11:59 AM | 10 (0.8%) | 24 (2.9%) |
| 12:00 PM to 3:59 PM | 0 (0.0%) | 24 (2.9%) |
| 4:00 PM to 11:59 PM | 10 (0.8%) | 20 (2.5%) |
| Total | 1,221 (100.0%) | 816 (100.0%) |
Housing Occupancy in Kentfield
Occupancy by Ownership in Kentfield
Of the total 2,831 dwellings in Kentfield, owner-occupied units account for 2,155 (76.1%), while renter-occupied units make up 676 (23.9%).
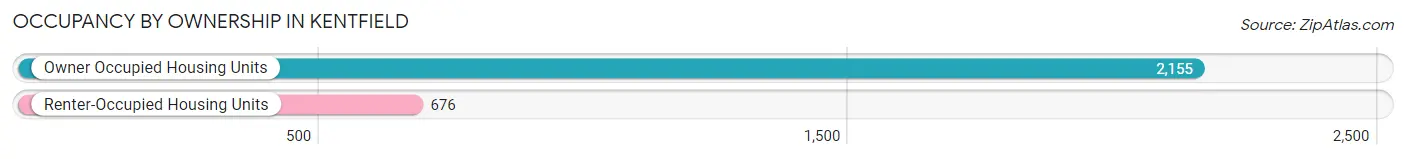
| Occupancy | # Housing Units | % Housing Units |
| Owner Occupied Housing Units | 2,155 | 76.1% |
| Renter-Occupied Housing Units | 676 | 23.9% |
| Total Occupied Housing Units | 2,831 | 100.0% |
Occupancy by Household Size in Kentfield
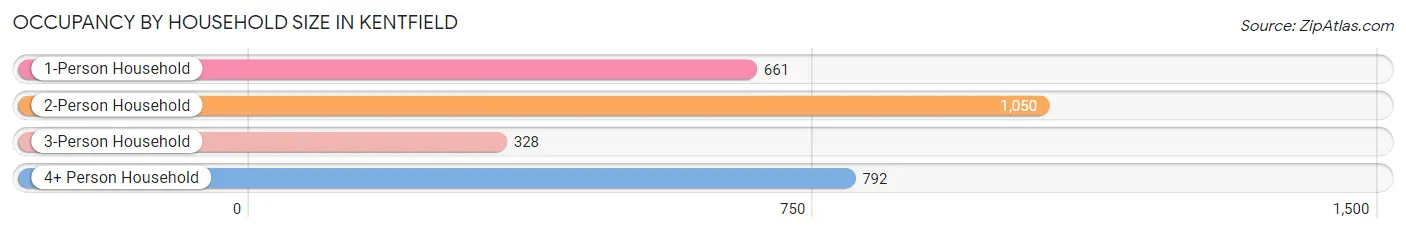
| Household Size | # Housing Units | % Housing Units |
| 1-Person Household | 661 | 23.4% |
| 2-Person Household | 1,050 | 37.1% |
| 3-Person Household | 328 | 11.6% |
| 4+ Person Household | 792 | 28.0% |
| Total Housing Units | 2,831 | 100.0% |
Occupancy by Ownership by Household Size in Kentfield
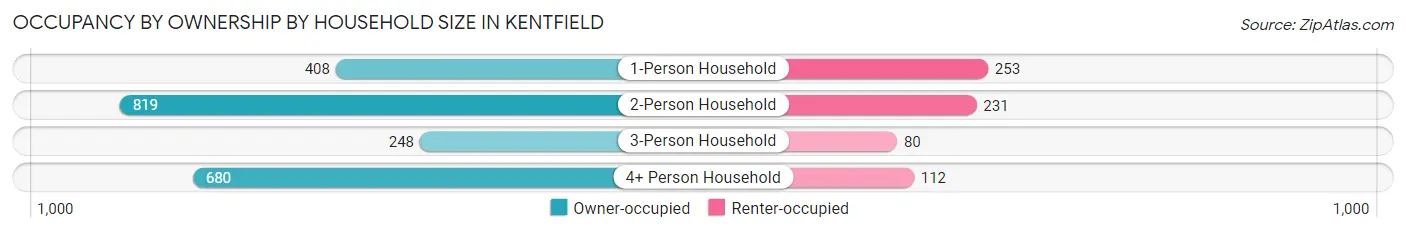
| Household Size | Owner-occupied | Renter-occupied |
| 1-Person Household | 408 (61.7%) | 253 (38.3%) |
| 2-Person Household | 819 (78.0%) | 231 (22.0%) |
| 3-Person Household | 248 (75.6%) | 80 (24.4%) |
| 4+ Person Household | 680 (85.9%) | 112 (14.1%) |
| Total Housing Units | 2,155 (76.1%) | 676 (23.9%) |
Occupancy by Educational Attainment in Kentfield
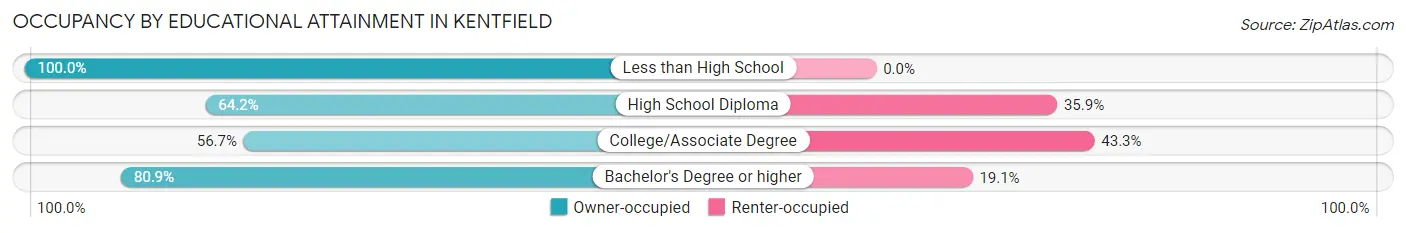
| Household Size | Owner-occupied | Renter-occupied |
| Less than High School | 12 (100.0%) | 0 (0.0%) |
| High School Diploma | 136 (64.1%) | 76 (35.8%) |
| College/Associate Degree | 240 (56.7%) | 183 (43.3%) |
| Bachelor's Degree or higher | 1,767 (80.9%) | 417 (19.1%) |
Occupancy by Age of Householder in Kentfield
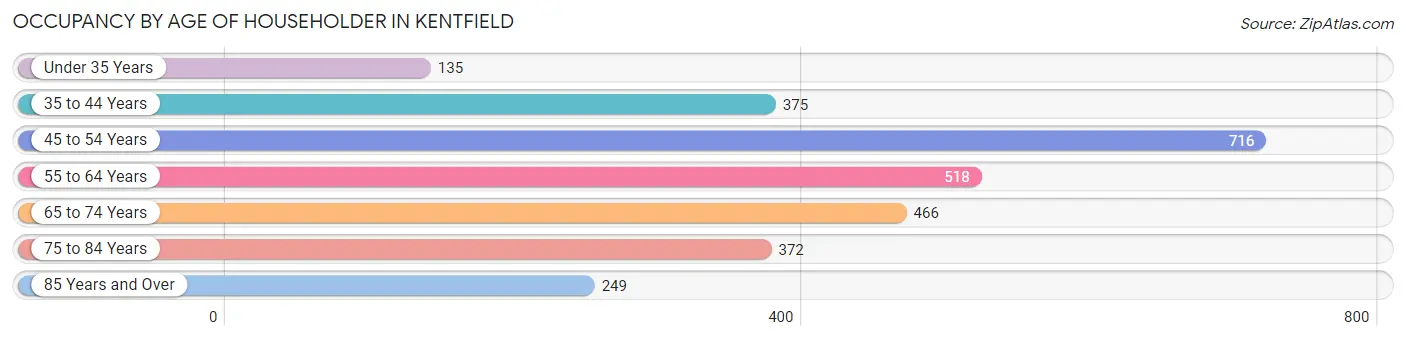
| Age Bracket | # Households | % Households |
| Under 35 Years | 135 | 4.8% |
| 35 to 44 Years | 375 | 13.3% |
| 45 to 54 Years | 716 | 25.3% |
| 55 to 64 Years | 518 | 18.3% |
| 65 to 74 Years | 466 | 16.5% |
| 75 to 84 Years | 372 | 13.1% |
| 85 Years and Over | 249 | 8.8% |
| Total | 2,831 | 100.0% |
Housing Finances in Kentfield
Median Income by Occupancy in Kentfield
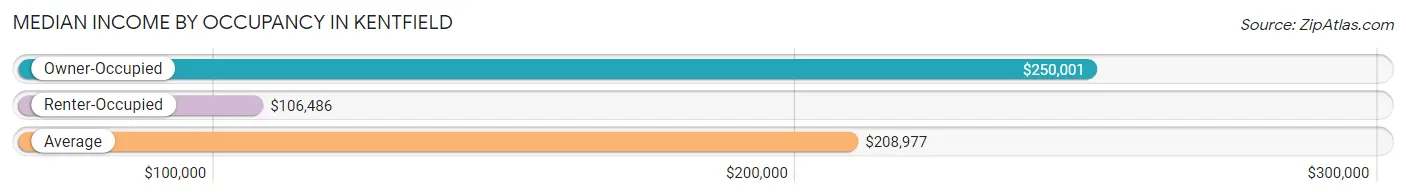
| Occupancy Type | # Households | Median Income |
| Owner-Occupied | 2,155 (76.1%) | $250,001 |
| Renter-Occupied | 676 (23.9%) | $106,486 |
| Average | 2,831 (100.0%) | $208,977 |
Occupancy by Householder Income Bracket in Kentfield
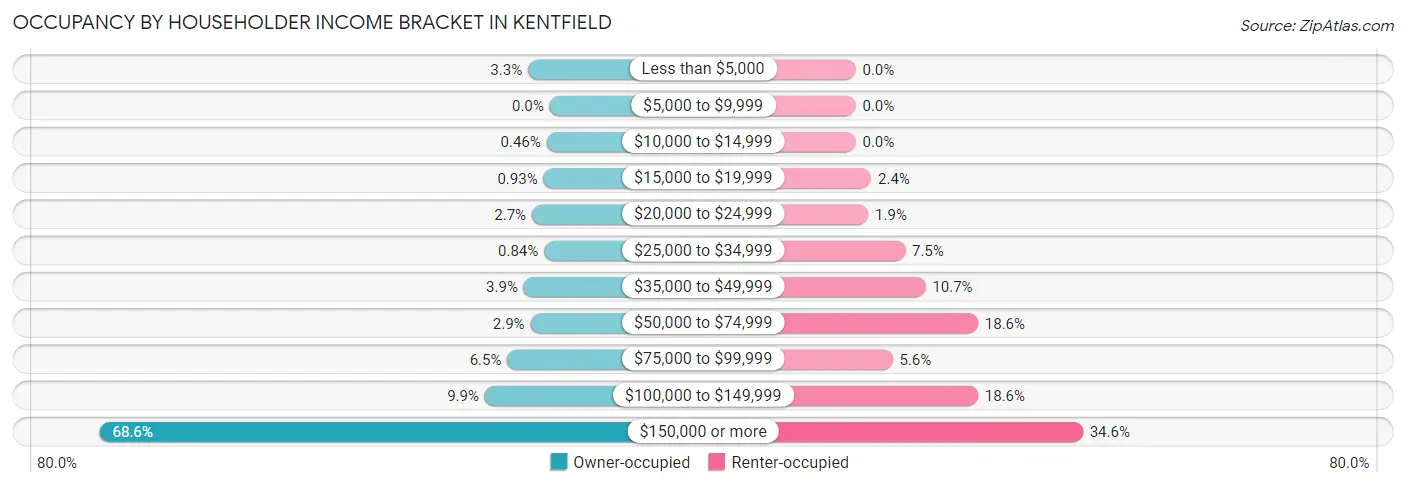
| Income Bracket | Owner-occupied | Renter-occupied |
| Less than $5,000 | 71 (3.3%) | 0 (0.0%) |
| $5,000 to $9,999 | 0 (0.0%) | 0 (0.0%) |
| $10,000 to $14,999 | 10 (0.5%) | 0 (0.0%) |
| $15,000 to $19,999 | 20 (0.9%) | 16 (2.4%) |
| $20,000 to $24,999 | 58 (2.7%) | 13 (1.9%) |
| $25,000 to $34,999 | 18 (0.8%) | 51 (7.5%) |
| $35,000 to $49,999 | 85 (3.9%) | 72 (10.6%) |
| $50,000 to $74,999 | 63 (2.9%) | 126 (18.6%) |
| $75,000 to $99,999 | 139 (6.5%) | 38 (5.6%) |
| $100,000 to $149,999 | 213 (9.9%) | 126 (18.6%) |
| $150,000 or more | 1,478 (68.6%) | 234 (34.6%) |
| Total | 2,155 (100.0%) | 676 (100.0%) |
Monthly Housing Cost Tiers in Kentfield
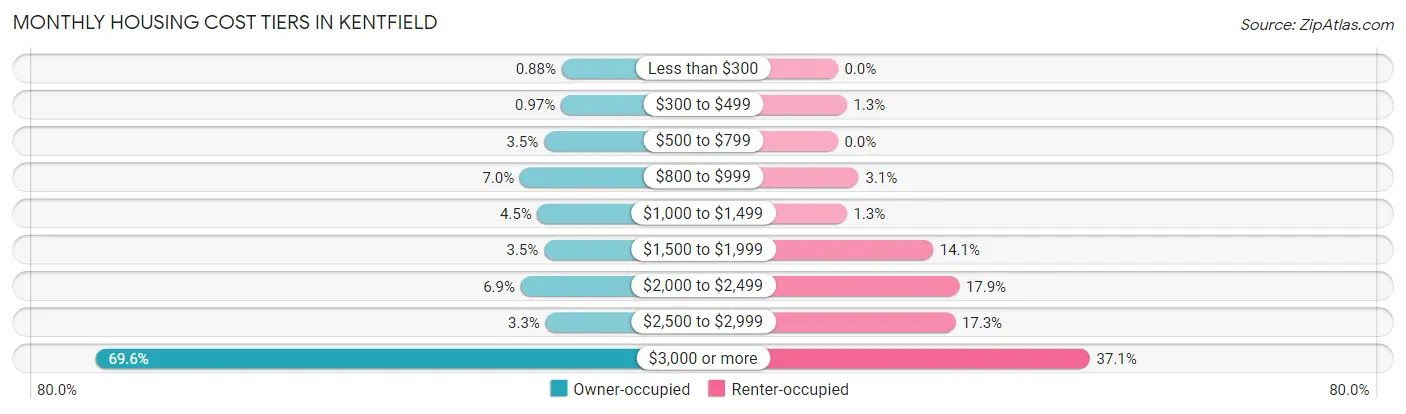
| Monthly Cost | Owner-occupied | Renter-occupied |
| Less than $300 | 19 (0.9%) | 0 (0.0%) |
| $300 to $499 | 21 (1.0%) | 9 (1.3%) |
| $500 to $799 | 75 (3.5%) | 0 (0.0%) |
| $800 to $999 | 151 (7.0%) | 21 (3.1%) |
| $1,000 to $1,499 | 96 (4.4%) | 9 (1.3%) |
| $1,500 to $1,999 | 75 (3.5%) | 95 (14.1%) |
| $2,000 to $2,499 | 149 (6.9%) | 121 (17.9%) |
| $2,500 to $2,999 | 70 (3.3%) | 117 (17.3%) |
| $3,000 or more | 1,499 (69.6%) | 251 (37.1%) |
| Total | 2,155 (100.0%) | 676 (100.0%) |
Physical Housing Characteristics in Kentfield
Housing Structures in Kentfield
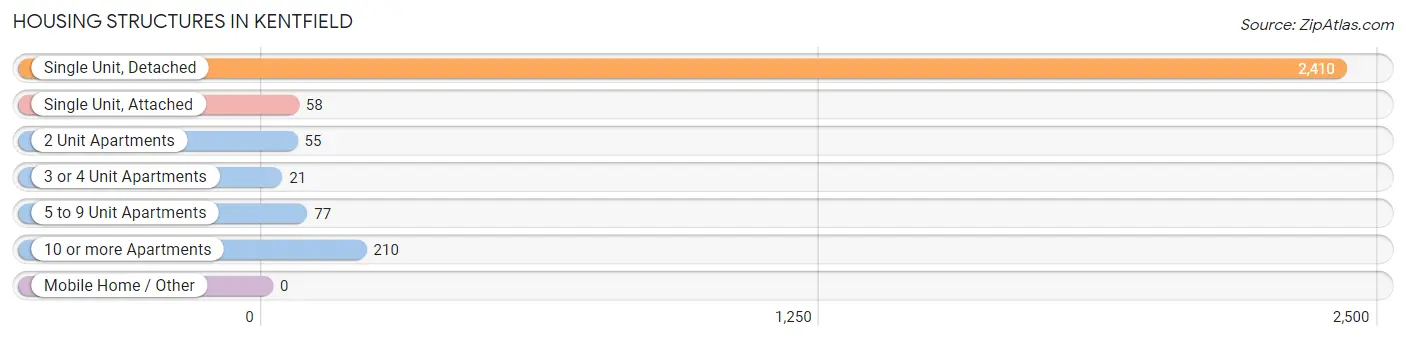
| Structure Type | # Housing Units | % Housing Units |
| Single Unit, Detached | 2,410 | 85.1% |
| Single Unit, Attached | 58 | 2.1% |
| 2 Unit Apartments | 55 | 1.9% |
| 3 or 4 Unit Apartments | 21 | 0.7% |
| 5 to 9 Unit Apartments | 77 | 2.7% |
| 10 or more Apartments | 210 | 7.4% |
| Mobile Home / Other | 0 | 0.0% |
| Total | 2,831 | 100.0% |
Housing Structures by Occupancy in Kentfield
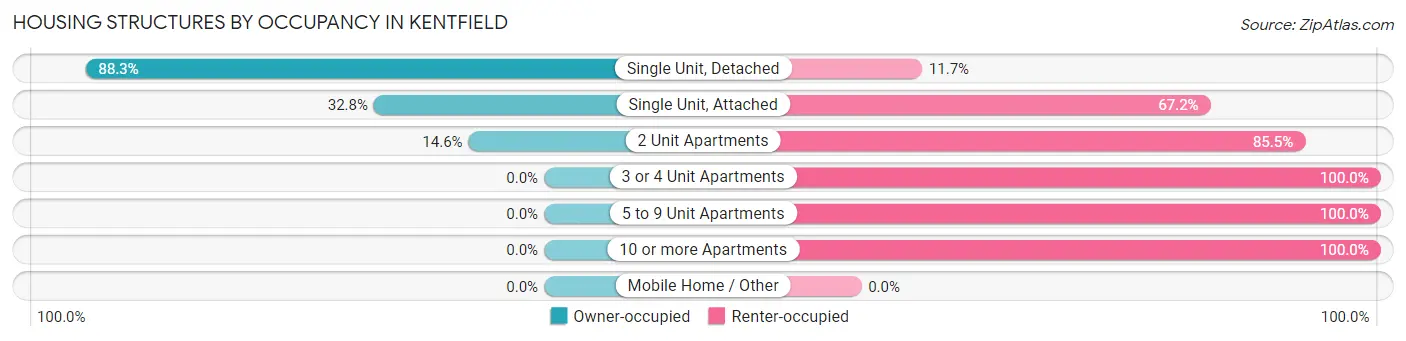
| Structure Type | Owner-occupied | Renter-occupied |
| Single Unit, Detached | 2,128 (88.3%) | 282 (11.7%) |
| Single Unit, Attached | 19 (32.8%) | 39 (67.2%) |
| 2 Unit Apartments | 8 (14.5%) | 47 (85.5%) |
| 3 or 4 Unit Apartments | 0 (0.0%) | 21 (100.0%) |
| 5 to 9 Unit Apartments | 0 (0.0%) | 77 (100.0%) |
| 10 or more Apartments | 0 (0.0%) | 210 (100.0%) |
| Mobile Home / Other | 0 (0.0%) | 0 (0.0%) |
| Total | 2,155 (76.1%) | 676 (23.9%) |
Housing Structures by Number of Rooms in Kentfield
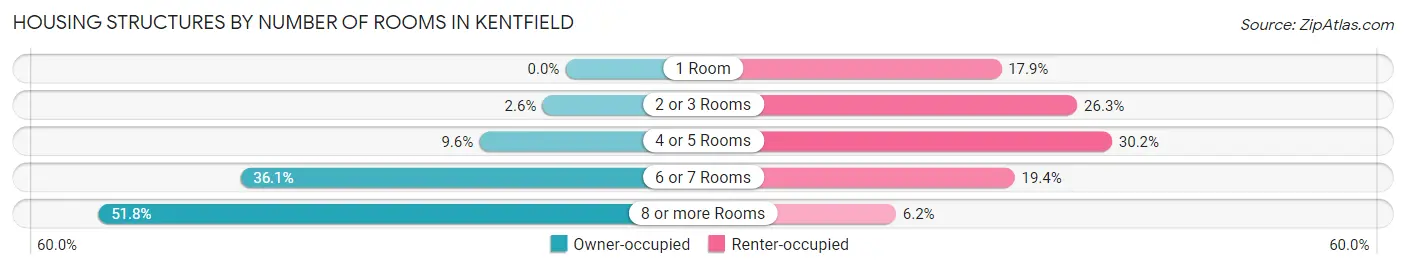
| Number of Rooms | Owner-occupied | Renter-occupied |
| 1 Room | 0 (0.0%) | 121 (17.9%) |
| 2 or 3 Rooms | 55 (2.5%) | 178 (26.3%) |
| 4 or 5 Rooms | 206 (9.6%) | 204 (30.2%) |
| 6 or 7 Rooms | 777 (36.1%) | 131 (19.4%) |
| 8 or more Rooms | 1,117 (51.8%) | 42 (6.2%) |
| Total | 2,155 (100.0%) | 676 (100.0%) |
Housing Structure by Heating Type in Kentfield
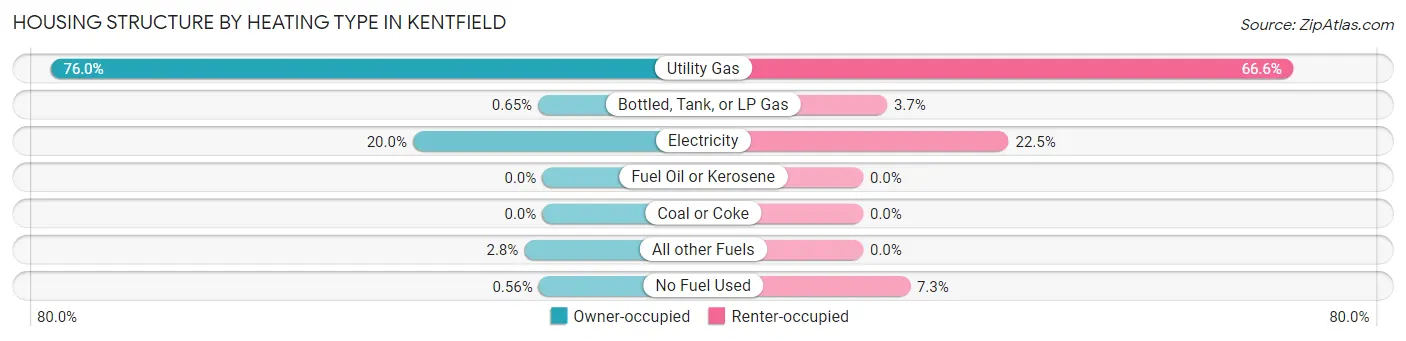
| Heating Type | Owner-occupied | Renter-occupied |
| Utility Gas | 1,638 (76.0%) | 450 (66.6%) |
| Bottled, Tank, or LP Gas | 14 (0.6%) | 25 (3.7%) |
| Electricity | 431 (20.0%) | 152 (22.5%) |
| Fuel Oil or Kerosene | 0 (0.0%) | 0 (0.0%) |
| Coal or Coke | 0 (0.0%) | 0 (0.0%) |
| All other Fuels | 60 (2.8%) | 0 (0.0%) |
| No Fuel Used | 12 (0.6%) | 49 (7.2%) |
| Total | 2,155 (100.0%) | 676 (100.0%) |
Household Vehicle Usage in Kentfield
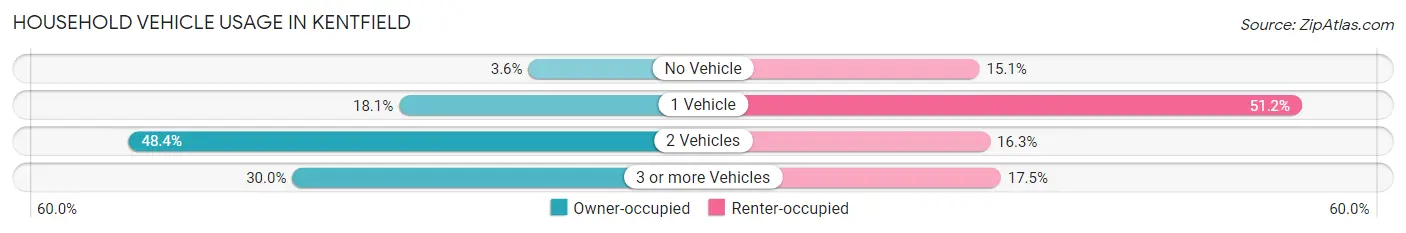
| Vehicles per Household | Owner-occupied | Renter-occupied |
| No Vehicle | 77 (3.6%) | 102 (15.1%) |
| 1 Vehicle | 389 (18.0%) | 346 (51.2%) |
| 2 Vehicles | 1,042 (48.3%) | 110 (16.3%) |
| 3 or more Vehicles | 647 (30.0%) | 118 (17.5%) |
| Total | 2,155 (100.0%) | 676 (100.0%) |
Real Estate & Mortgages in Kentfield
Real Estate and Mortgage Overview in Kentfield
| Characteristic | Without Mortgage | With Mortgage |
| Housing Units | 592 | 1,563 |
| Median Property Value | $1,654,600 | $2,000,001 |
| Median Household Income | $111,042 | $1,255 |
| Monthly Housing Costs | $1,208 | $1,421 |
| Real Estate Taxes | $7,237 | $0 |
Property Value by Mortgage Status in Kentfield
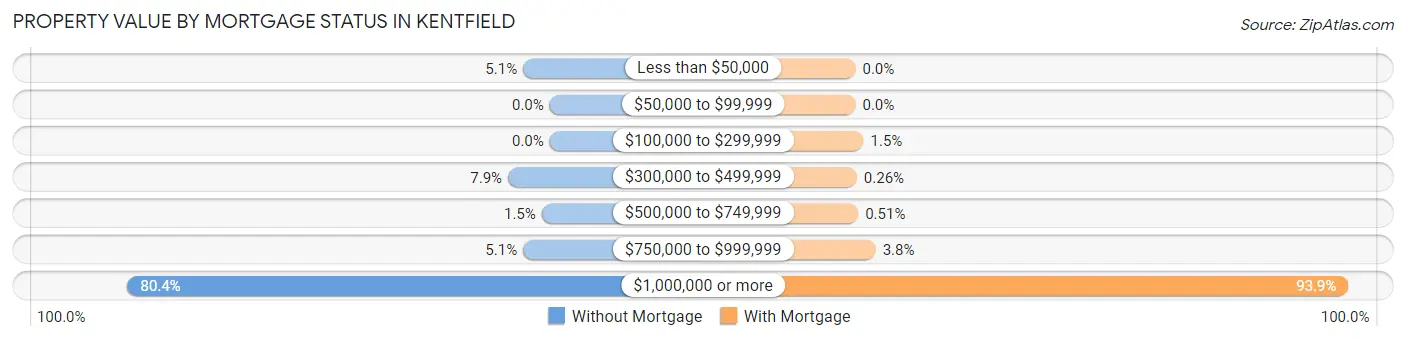
| Property Value | Without Mortgage | With Mortgage |
| Less than $50,000 | 30 (5.1%) | 0 (0.0%) |
| $50,000 to $99,999 | 0 (0.0%) | 0 (0.0%) |
| $100,000 to $299,999 | 0 (0.0%) | 24 (1.5%) |
| $300,000 to $499,999 | 47 (7.9%) | 4 (0.3%) |
| $500,000 to $749,999 | 9 (1.5%) | 8 (0.5%) |
| $750,000 to $999,999 | 30 (5.1%) | 60 (3.8%) |
| $1,000,000 or more | 476 (80.4%) | 1,467 (93.9%) |
| Total | 592 (100.0%) | 1,563 (100.0%) |
Household Income by Mortgage Status in Kentfield
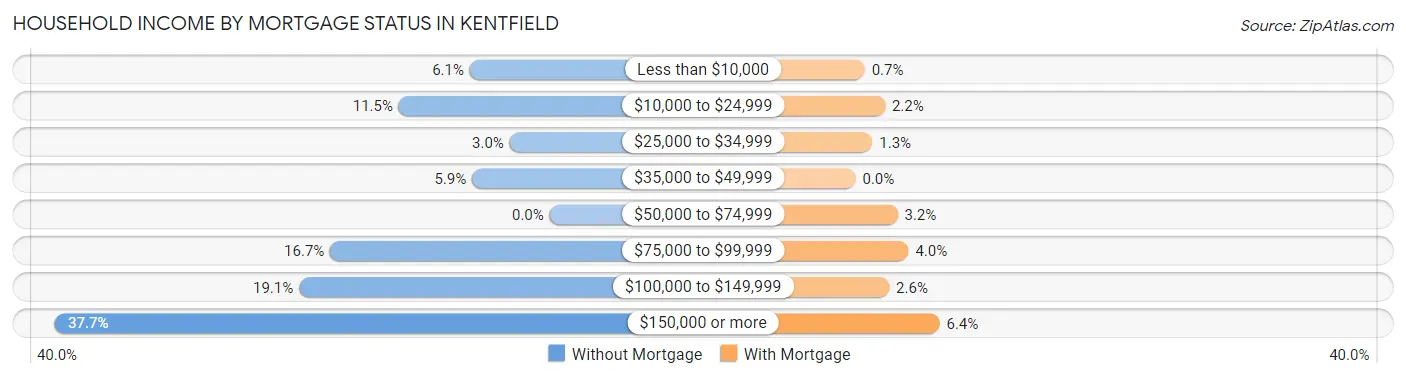
| Household Income | Without Mortgage | With Mortgage |
| Less than $10,000 | 36 (6.1%) | 11 (0.7%) |
| $10,000 to $24,999 | 68 (11.5%) | 35 (2.2%) |
| $25,000 to $34,999 | 18 (3.0%) | 20 (1.3%) |
| $35,000 to $49,999 | 35 (5.9%) | 0 (0.0%) |
| $50,000 to $74,999 | 0 (0.0%) | 50 (3.2%) |
| $75,000 to $99,999 | 99 (16.7%) | 63 (4.0%) |
| $100,000 to $149,999 | 113 (19.1%) | 40 (2.6%) |
| $150,000 or more | 223 (37.7%) | 100 (6.4%) |
| Total | 592 (100.0%) | 1,563 (100.0%) |
Property Value to Household Income Ratio in Kentfield
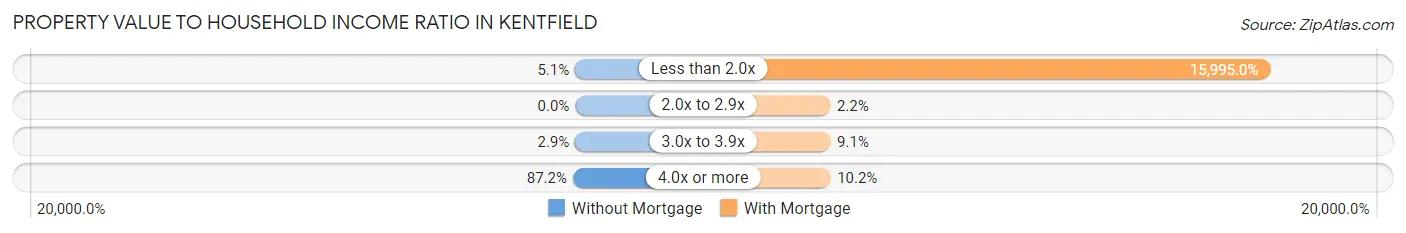
| Value-to-Income Ratio | Without Mortgage | With Mortgage |
| Less than 2.0x | 30 (5.1%) | 250,001 (15,995.0%) |
| 2.0x to 2.9x | 0 (0.0%) | 34 (2.2%) |
| 3.0x to 3.9x | 17 (2.9%) | 142 (9.1%) |
| 4.0x or more | 516 (87.2%) | 160 (10.2%) |
| Total | 592 (100.0%) | 1,563 (100.0%) |
Real Estate Taxes by Mortgage Status in Kentfield
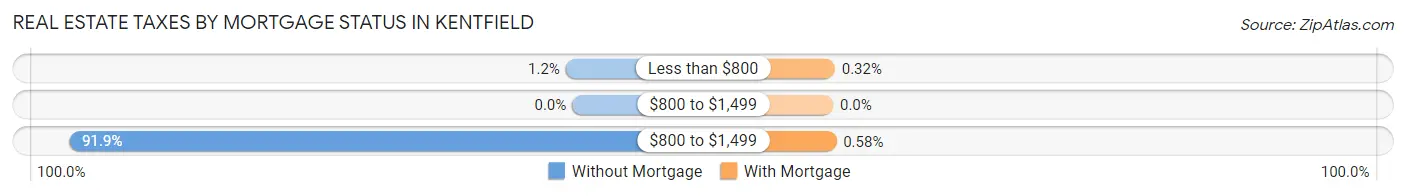
| Property Taxes | Without Mortgage | With Mortgage |
| Less than $800 | 7 (1.2%) | 5 (0.3%) |
| $800 to $1,499 | 0 (0.0%) | 0 (0.0%) |
| $800 to $1,499 | 544 (91.9%) | 9 (0.6%) |
| Total | 592 (100.0%) | 1,563 (100.0%) |
Health & Disability in Kentfield
Health Insurance Coverage by Age in Kentfield
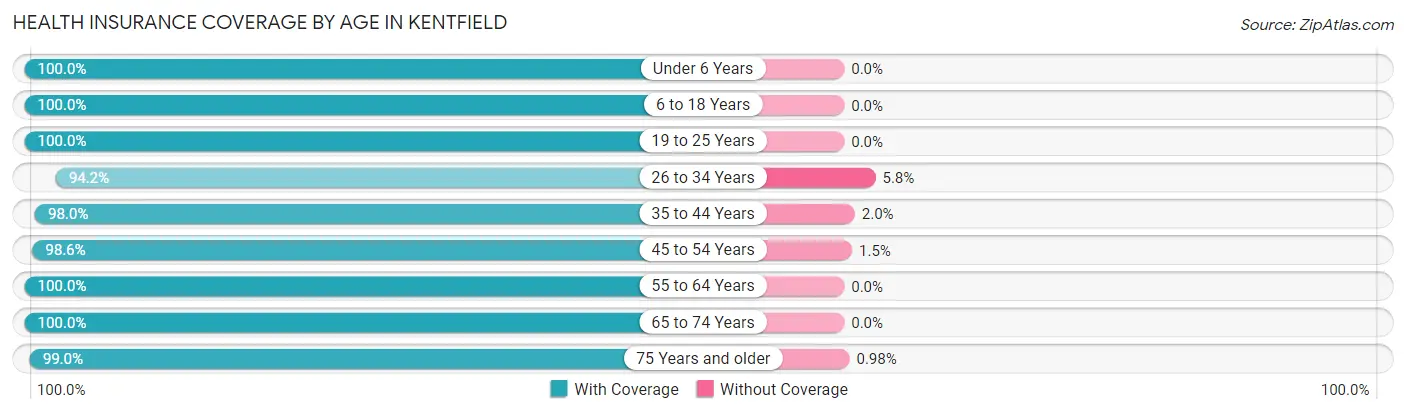
| Age Bracket | With Coverage | Without Coverage |
| Under 6 Years | 479 (100.0%) | 0 (0.0%) |
| 6 to 18 Years | 1,527 (100.0%) | 0 (0.0%) |
| 19 to 25 Years | 374 (100.0%) | 0 (0.0%) |
| 26 to 34 Years | 323 (94.2%) | 20 (5.8%) |
| 35 to 44 Years | 700 (98.0%) | 14 (2.0%) |
| 45 to 54 Years | 1,364 (98.6%) | 20 (1.5%) |
| 55 to 64 Years | 903 (100.0%) | 0 (0.0%) |
| 65 to 74 Years | 761 (100.0%) | 0 (0.0%) |
| 75 Years and older | 910 (99.0%) | 9 (1.0%) |
| Total | 7,341 (99.2%) | 63 (0.9%) |
Health Insurance Coverage by Citizenship Status in Kentfield
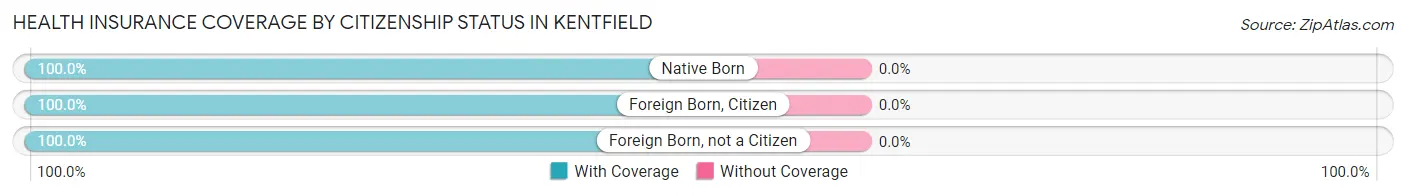
| Citizenship Status | With Coverage | Without Coverage |
| Native Born | 479 (100.0%) | 0 (0.0%) |
| Foreign Born, Citizen | 1,527 (100.0%) | 0 (0.0%) |
| Foreign Born, not a Citizen | 374 (100.0%) | 0 (0.0%) |
Health Insurance Coverage by Household Income in Kentfield
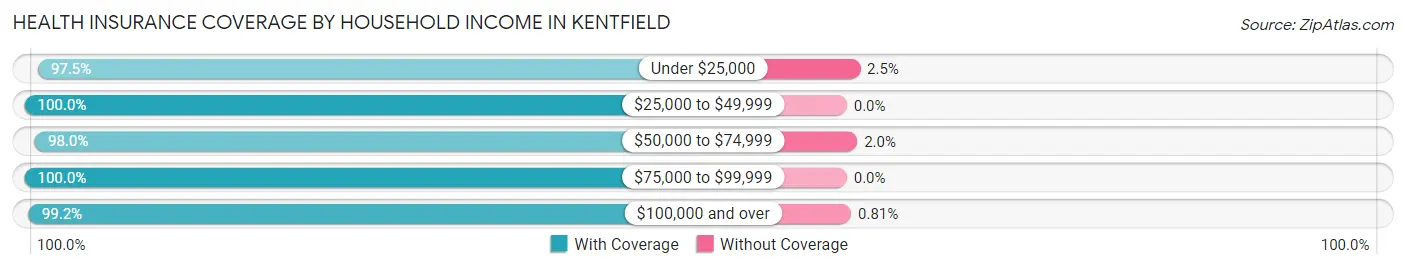
| Household Income | With Coverage | Without Coverage |
| Under $25,000 | 313 (97.5%) | 8 (2.5%) |
| $25,000 to $49,999 | 449 (100.0%) | 0 (0.0%) |
| $50,000 to $74,999 | 300 (98.0%) | 6 (2.0%) |
| $75,000 to $99,999 | 258 (100.0%) | 0 (0.0%) |
| $100,000 and over | 5,998 (99.2%) | 49 (0.8%) |
Public vs Private Health Insurance Coverage by Age in Kentfield
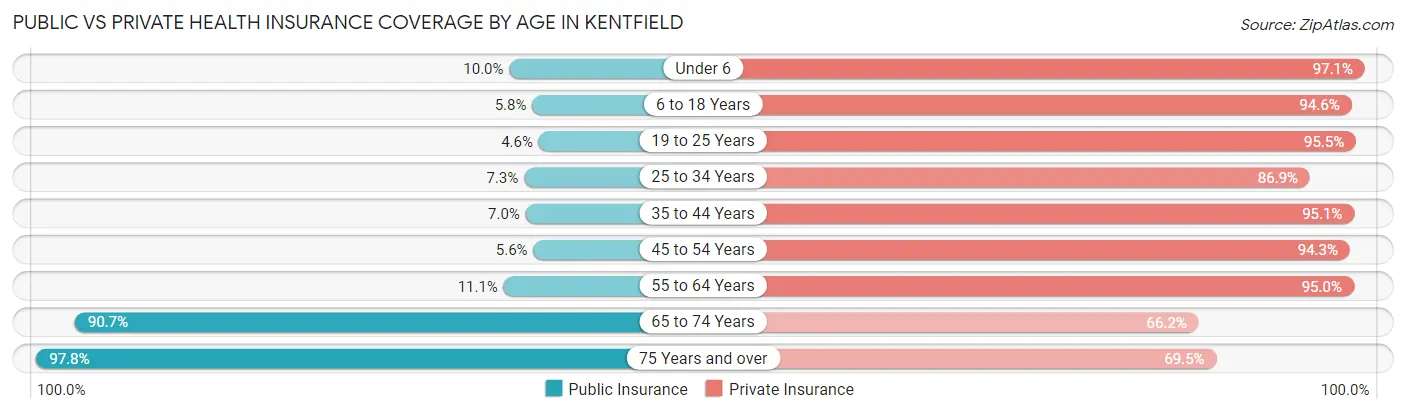
| Age Bracket | Public Insurance | Private Insurance |
| Under 6 | 48 (10.0%) | 465 (97.1%) |
| 6 to 18 Years | 88 (5.8%) | 1,445 (94.6%) |
| 19 to 25 Years | 17 (4.5%) | 357 (95.5%) |
| 25 to 34 Years | 25 (7.3%) | 298 (86.9%) |
| 35 to 44 Years | 50 (7.0%) | 679 (95.1%) |
| 45 to 54 Years | 77 (5.6%) | 1,305 (94.3%) |
| 55 to 64 Years | 100 (11.1%) | 858 (95.0%) |
| 65 to 74 Years | 690 (90.7%) | 504 (66.2%) |
| 75 Years and over | 899 (97.8%) | 639 (69.5%) |
| Total | 1,994 (26.9%) | 6,550 (88.5%) |
Disability Status by Sex by Age in Kentfield
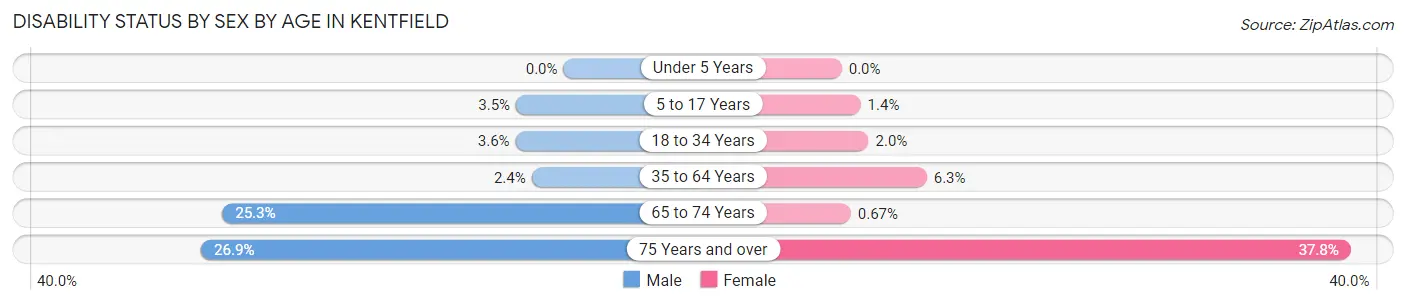
| Age Bracket | Male | Female |
| Under 5 Years | 0 (0.0%) | 0 (0.0%) |
| 5 to 17 Years | 26 (3.5%) | 10 (1.4%) |
| 18 to 34 Years | 14 (3.6%) | 9 (2.0%) |
| 35 to 64 Years | 35 (2.4%) | 96 (6.3%) |
| 65 to 74 Years | 79 (25.3%) | 3 (0.7%) |
| 75 Years and over | 114 (26.9%) | 187 (37.8%) |
Disability Class by Sex by Age in Kentfield
Disability Class: Hearing Difficulty
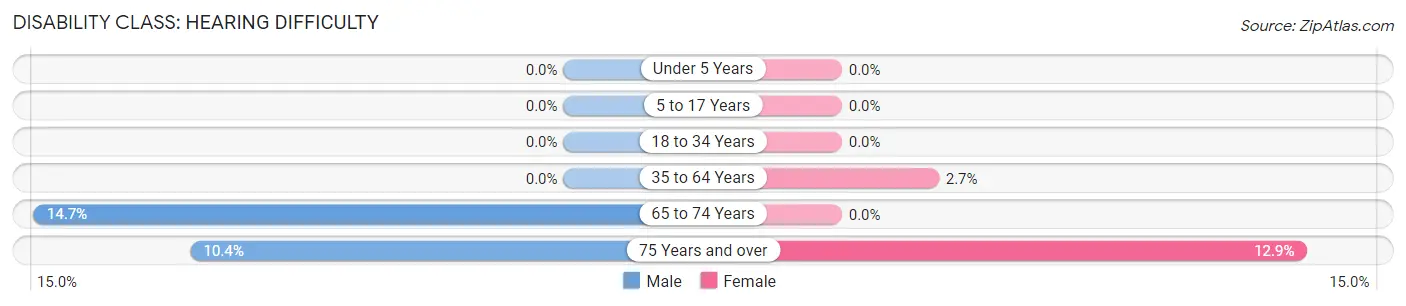
| Age Bracket | Male | Female |
| Under 5 Years | 0 (0.0%) | 0 (0.0%) |
| 5 to 17 Years | 0 (0.0%) | 0 (0.0%) |
| 18 to 34 Years | 0 (0.0%) | 0 (0.0%) |
| 35 to 64 Years | 0 (0.0%) | 41 (2.7%) |
| 65 to 74 Years | 46 (14.7%) | 0 (0.0%) |
| 75 Years and over | 44 (10.4%) | 64 (12.9%) |
Disability Class: Vision Difficulty
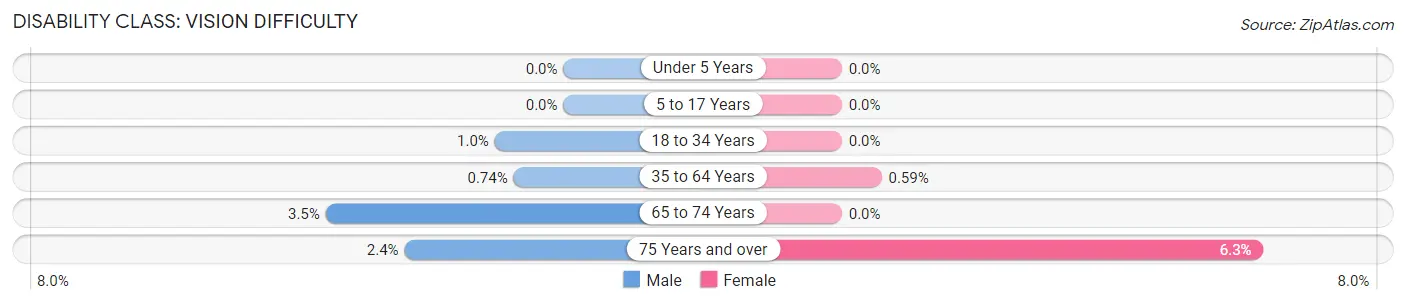
| Age Bracket | Male | Female |
| Under 5 Years | 0 (0.0%) | 0 (0.0%) |
| 5 to 17 Years | 0 (0.0%) | 0 (0.0%) |
| 18 to 34 Years | 4 (1.0%) | 0 (0.0%) |
| 35 to 64 Years | 11 (0.7%) | 9 (0.6%) |
| 65 to 74 Years | 11 (3.5%) | 0 (0.0%) |
| 75 Years and over | 10 (2.4%) | 31 (6.3%) |
Disability Class: Cognitive Difficulty
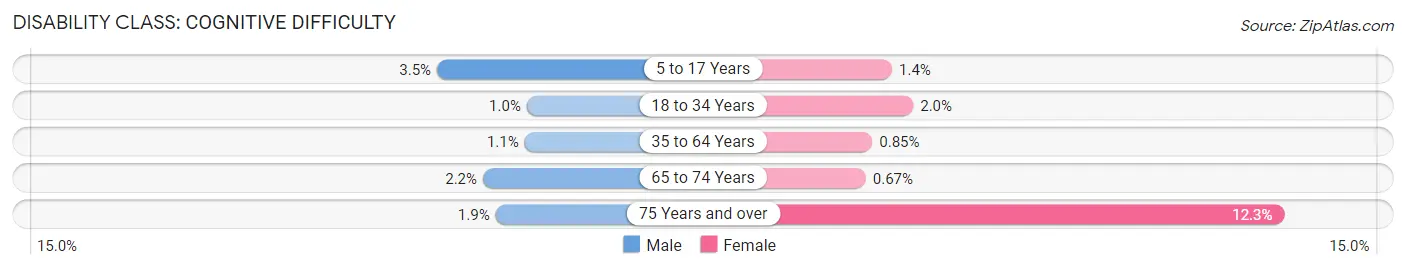
| Age Bracket | Male | Female |
| 5 to 17 Years | 26 (3.5%) | 10 (1.4%) |
| 18 to 34 Years | 4 (1.0%) | 9 (2.0%) |
| 35 to 64 Years | 16 (1.1%) | 13 (0.9%) |
| 65 to 74 Years | 7 (2.2%) | 3 (0.7%) |
| 75 Years and over | 8 (1.9%) | 61 (12.3%) |
Disability Class: Ambulatory Difficulty
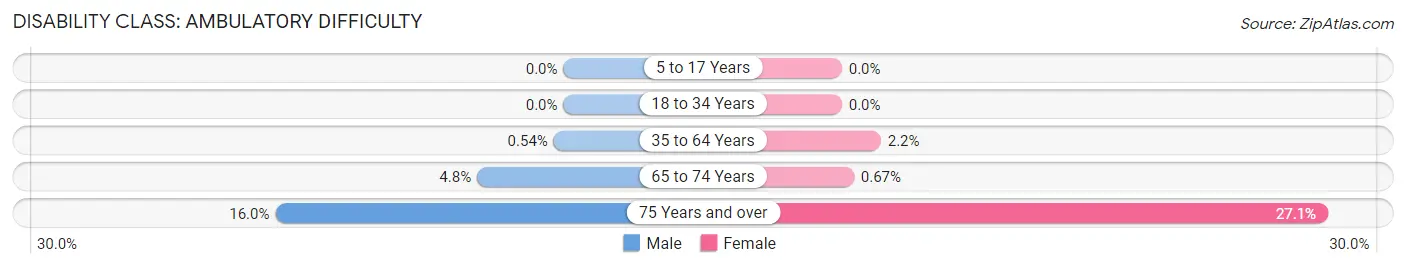
| Age Bracket | Male | Female |
| 5 to 17 Years | 0 (0.0%) | 0 (0.0%) |
| 18 to 34 Years | 0 (0.0%) | 0 (0.0%) |
| 35 to 64 Years | 8 (0.5%) | 33 (2.2%) |
| 65 to 74 Years | 15 (4.8%) | 3 (0.7%) |
| 75 Years and over | 68 (16.0%) | 134 (27.1%) |
Disability Class: Self-Care Difficulty
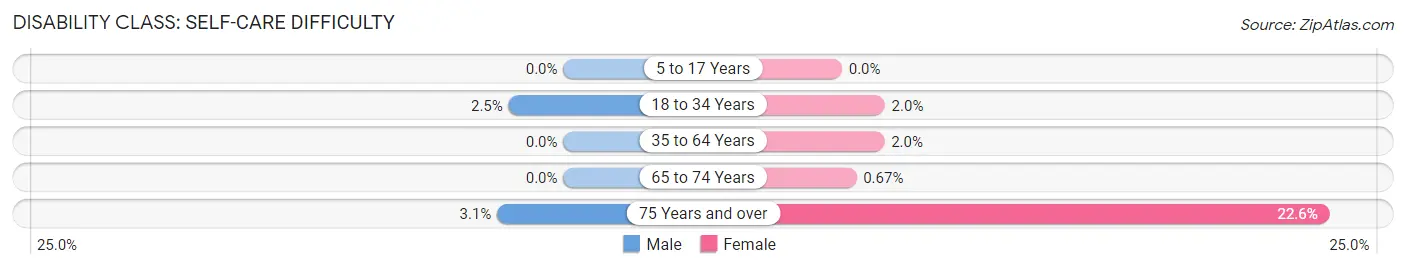
| Age Bracket | Male | Female |
| 5 to 17 Years | 0 (0.0%) | 0 (0.0%) |
| 18 to 34 Years | 10 (2.5%) | 9 (2.0%) |
| 35 to 64 Years | 0 (0.0%) | 30 (2.0%) |
| 65 to 74 Years | 0 (0.0%) | 3 (0.7%) |
| 75 Years and over | 13 (3.1%) | 112 (22.6%) |
Technology Access in Kentfield
Computing Device Access in Kentfield
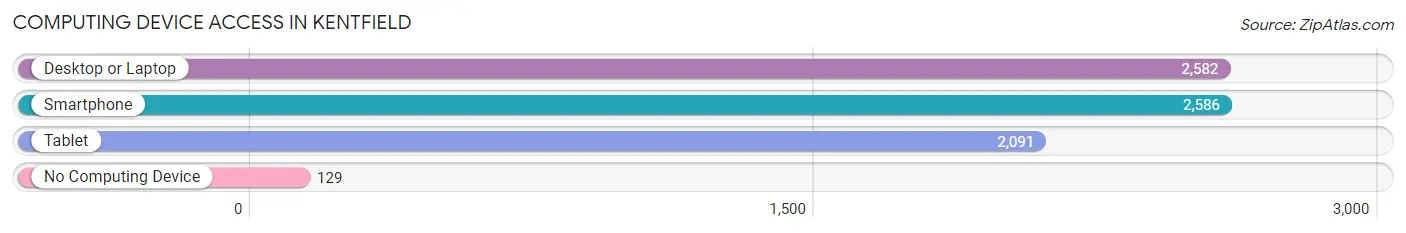
| Device Type | # Households | % Households |
| Desktop or Laptop | 2,582 | 91.2% |
| Smartphone | 2,586 | 91.3% |
| Tablet | 2,091 | 73.9% |
| No Computing Device | 129 | 4.6% |
| Total | 2,831 | 100.0% |
Internet Access in Kentfield
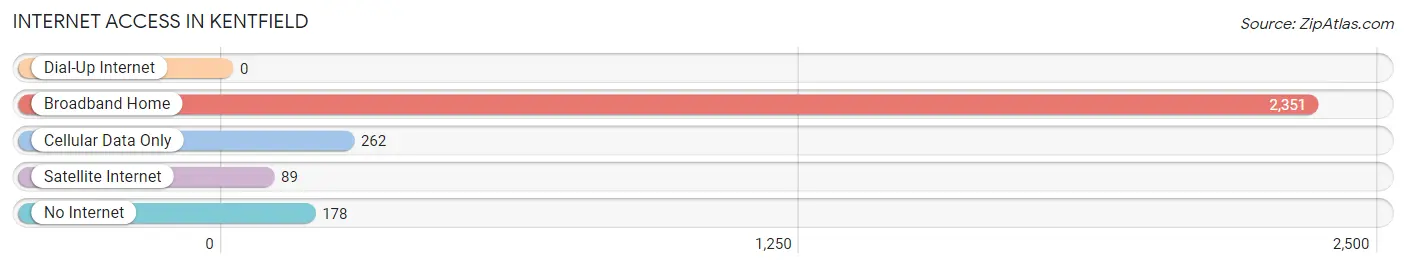
| Internet Type | # Households | % Households |
| Dial-Up Internet | 0 | 0.0% |
| Broadband Home | 2,351 | 83.0% |
| Cellular Data Only | 262 | 9.2% |
| Satellite Internet | 89 | 3.1% |
| No Internet | 178 | 6.3% |
| Total | 2,831 | 100.0% |
Kentfield Summary
History
The history of Kentfield, California dates back to the mid-1800s when the area was first settled by the Miwok Native Americans. The Miwok were a peaceful tribe that lived in the area for centuries before the arrival of Europeans. The first Europeans to settle in the area were the Spanish, who established a mission in nearby San Rafael in 1817. The mission was the first permanent European settlement in Marin County.
In the late 1800s, the area was developed by the Kent family, who purchased land in the area and began to build a small community. The community was named Kentfield after the family. The area was primarily used for farming and ranching, and the Kent family built a large ranch house that still stands today.
In the early 1900s, the area began to grow as more people moved to the area. The population of Kentfield grew steadily throughout the 20th century, and by the 2000 census, the population was 6,485.
Geography
Kentfield is located in Marin County, California, about 10 miles north of San Francisco. The town is situated in a valley surrounded by hills and mountains, and is bordered by the cities of San Rafael, Larkspur, and Corte Madera. The town is located at an elevation of about 500 feet, and has a mild Mediterranean climate with warm summers and cool, wet winters.
The town covers an area of about 4.5 square miles, and is home to several parks and open spaces, including the Kentfield-Ross Valley Open Space Preserve, which is a popular destination for hikers and nature lovers.
Economy
The economy of Kentfield is largely based on the service industry, with many residents employed in the retail, hospitality, and healthcare sectors. The town is also home to several small businesses, including restaurants, cafes, and shops.
The town is also home to several educational institutions, including the College of Marin, which is a two-year community college. The college offers a variety of degree and certificate programs, and is a popular destination for students from around the Bay Area.
Demographics
According to the 2000 census, the population of Kentfield was 6,485. The racial makeup of the town was 87.3% White, 4.2% Asian, 2.2% African American, 0.5% Native American, and 0.2% Pacific Islander. The median household income was $90,945, and the median home value was $717,000.
The town is home to a diverse population, with many residents of Hispanic, Asian, and African American descent. The town is also home to a large Jewish community, with many residents of Jewish descent.
Conclusion
Kentfield, California is a small town located in Marin County, about 10 miles north of San Francisco. The town has a rich history, dating back to the mid-1800s when it was first settled by the Miwok Native Americans. The town has a mild Mediterranean climate and is home to several parks and open spaces. The economy of Kentfield is largely based on the service industry, and the town is home to several educational institutions. The population of Kentfield is diverse, with many residents of Hispanic, Asian, and African American descent.
Common Questions
What is Per Capita Income in Kentfield?
Per Capita income in Kentfield is $129,827.
What is the Median Family Income in Kentfield?
Median Family Income in Kentfield is $250,001.
What is the Median Household income in Kentfield?
Median Household Income in Kentfield is $208,977.
What is Income or Wage Gap in Kentfield?
Income or Wage Gap in Kentfield is 46.7%.
Women in Kentfield earn 53.3 cents for every dollar earned by a man.
What is Inequality or Gini Index in Kentfield?
Inequality or Gini Index in Kentfield is 0.53.
What is the Total Population of Kentfield?
Total Population of Kentfield is 7,410.
What is the Total Male Population of Kentfield?
Total Male Population of Kentfield is 3,592.
What is the Total Female Population of Kentfield?
Total Female Population of Kentfield is 3,818.
What is the Ratio of Males per 100 Females in Kentfield?
There are 94.08 Males per 100 Females in Kentfield.
What is the Ratio of Females per 100 Males in Kentfield?
There are 106.29 Females per 100 Males in Kentfield.
What is the Median Population Age in Kentfield?
Median Population Age in Kentfield is 46.4 Years.
What is the Average Family Size in Kentfield
Average Family Size in Kentfield is 3.1 People.
What is the Average Household Size in Kentfield
Average Household Size in Kentfield is 2.6 People.
How Large is the Labor Force in Kentfield?
There are 3,494 People in the Labor Forcein in Kentfield.
What is the Percentage of People in the Labor Force in Kentfield?
60.7% of People are in the Labor Force in Kentfield.
What is the Unemployment Rate in Kentfield?
Unemployment Rate in Kentfield is 5.1%.