Calpella, CA Map & Demographics
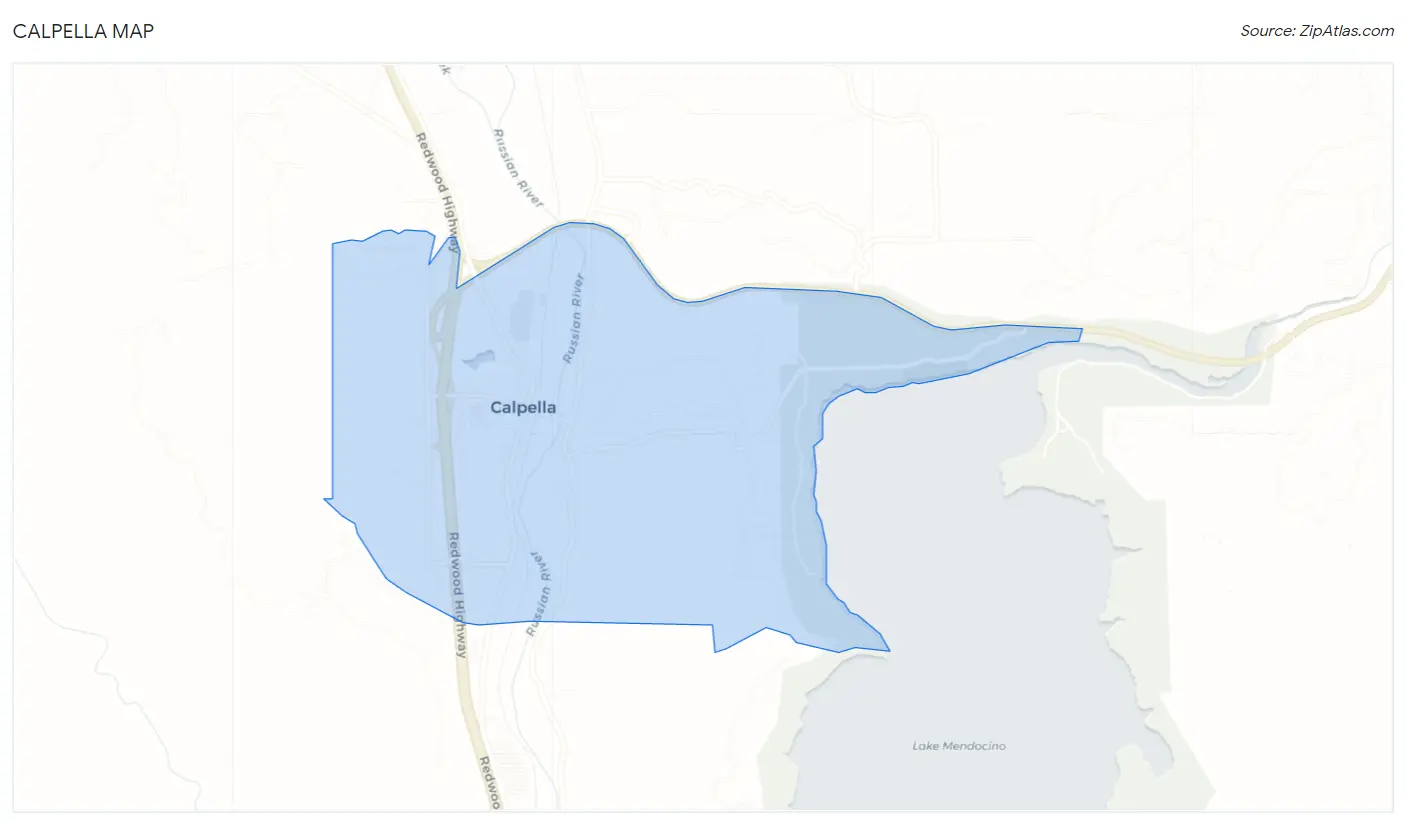
Calpella Map
Calpella Overview
$50,906
PER CAPITA INCOME
$98,867
AVG HOUSEHOLD INCOME
14.7%
WAGE / INCOME GAP [ % ]
85.3¢/ $1
WAGE / INCOME GAP [ $ ]
0.37
INEQUALITY / GINI INDEX
674
TOTAL POPULATION
395
MALE POPULATION
279
FEMALE POPULATION
141.58
MALES / 100 FEMALES
70.63
FEMALES / 100 MALES
48.7
MEDIAN AGE
3.6
AVG FAMILY SIZE
3.1
AVG HOUSEHOLD SIZE
380
LABOR FORCE [ PEOPLE ]
67.0%
PERCENT IN LABOR FORCE
Calpella Area Codes
Income in Calpella
Income Overview in Calpella
| Characteristic | Number | Measure |
| Per Capita Income | 674 | $50,906 |
| Median Family Income | 163 | $0 |
| Mean Family Income | 163 | $174,326 |
| Median Household Income | 217 | $98,867 |
| Mean Household Income | 217 | $144,289 |
| Income Deficit | 163 | $0 |
| Wage / Income Gap (%) | 674 | 14.65% |
| Wage / Income Gap ($) | 674 | 85.35¢ per $1 |
| Gini / Inequality Index | 674 | 0.37 |
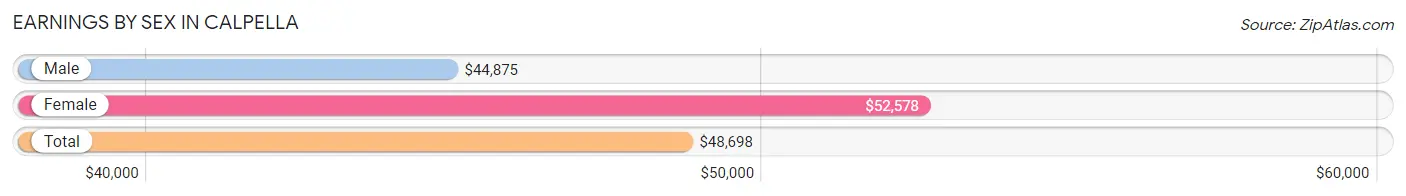
Earnings by Sex in Calpella
Average Earnings in Calpella are $48,698, $44,875 for men and $52,578 for women, a difference of 14.6%.
| Sex | Number | Average Earnings |
| Male | 248 (65.3%) | $44,875 |
| Female | 132 (34.7%) | $52,578 |
| Total | 380 (100.0%) | $48,698 |
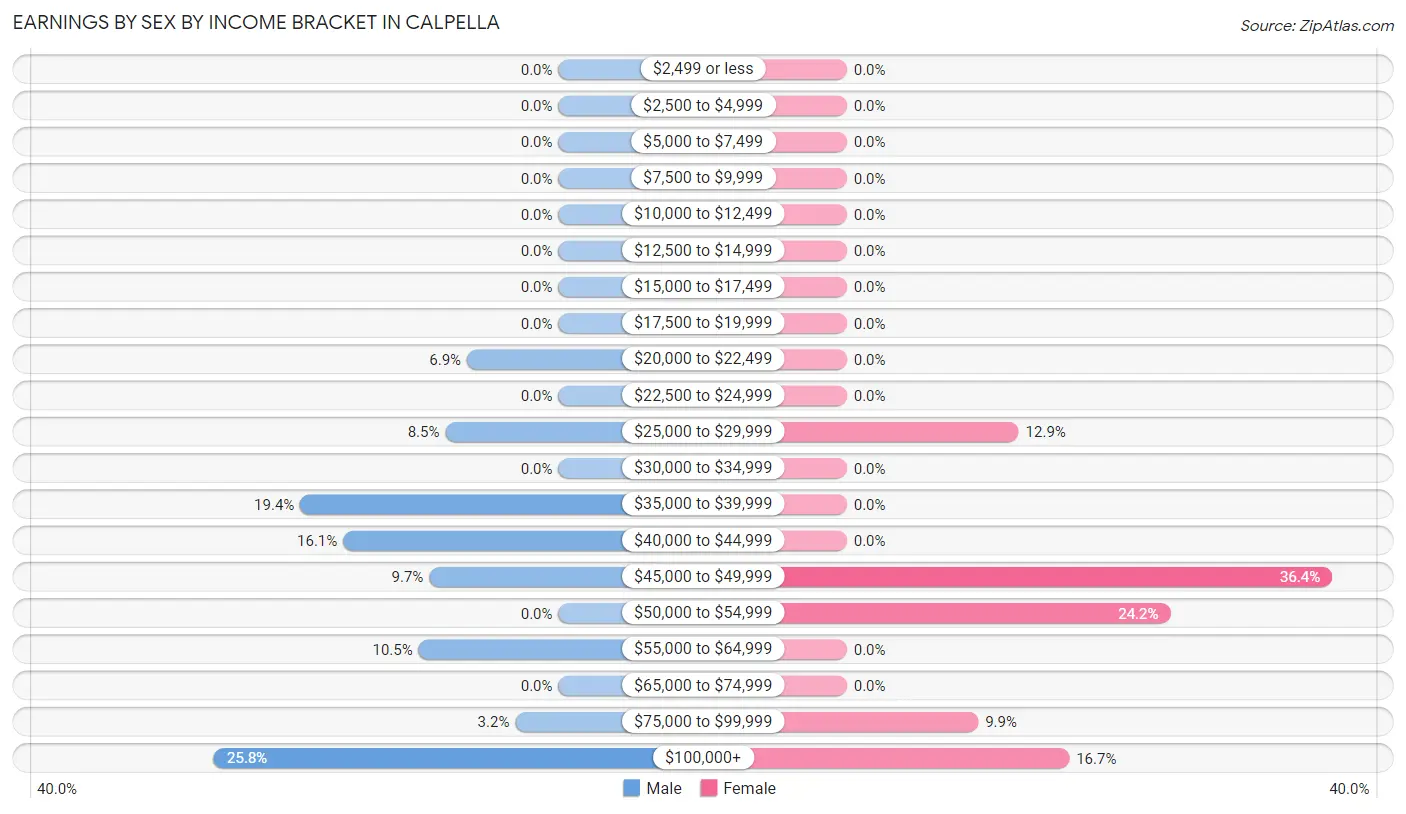
Earnings by Sex by Income Bracket in Calpella
The most common earnings brackets in Calpella are $100,000+ for men (64 | 25.8%) and $45,000 to $49,999 for women (48 | 36.4%).
| Income | Male | Female |
| $2,499 or less | 0 (0.0%) | 0 (0.0%) |
| $2,500 to $4,999 | 0 (0.0%) | 0 (0.0%) |
| $5,000 to $7,499 | 0 (0.0%) | 0 (0.0%) |
| $7,500 to $9,999 | 0 (0.0%) | 0 (0.0%) |
| $10,000 to $12,499 | 0 (0.0%) | 0 (0.0%) |
| $12,500 to $14,999 | 0 (0.0%) | 0 (0.0%) |
| $15,000 to $17,499 | 0 (0.0%) | 0 (0.0%) |
| $17,500 to $19,999 | 0 (0.0%) | 0 (0.0%) |
| $20,000 to $22,499 | 17 (6.9%) | 0 (0.0%) |
| $22,500 to $24,999 | 0 (0.0%) | 0 (0.0%) |
| $25,000 to $29,999 | 21 (8.5%) | 17 (12.9%) |
| $30,000 to $34,999 | 0 (0.0%) | 0 (0.0%) |
| $35,000 to $39,999 | 48 (19.4%) | 0 (0.0%) |
| $40,000 to $44,999 | 40 (16.1%) | 0 (0.0%) |
| $45,000 to $49,999 | 24 (9.7%) | 48 (36.4%) |
| $50,000 to $54,999 | 0 (0.0%) | 32 (24.2%) |
| $55,000 to $64,999 | 26 (10.5%) | 0 (0.0%) |
| $65,000 to $74,999 | 0 (0.0%) | 0 (0.0%) |
| $75,000 to $99,999 | 8 (3.2%) | 13 (9.9%) |
| $100,000+ | 64 (25.8%) | 22 (16.7%) |
| Total | 248 (100.0%) | 132 (100.0%) |
Earnings by Sex by Educational Attainment in Calpella
| Educational Attainment | Male Income | Female Income |
| Less than High School | - | - |
| High School Diploma | - | - |
| College or Associate's Degree | - | - |
| Bachelor's Degree | - | - |
| Graduate Degree | - | - |
| Total | $44,875 | $49,714 |
Family Income in Calpella
Family Income Brackets in Calpella
According to the Calpella family income data, there are 70 families falling into the $75,000 to $99,999 income range, which is the most common income bracket and makes up 42.9% of all families.
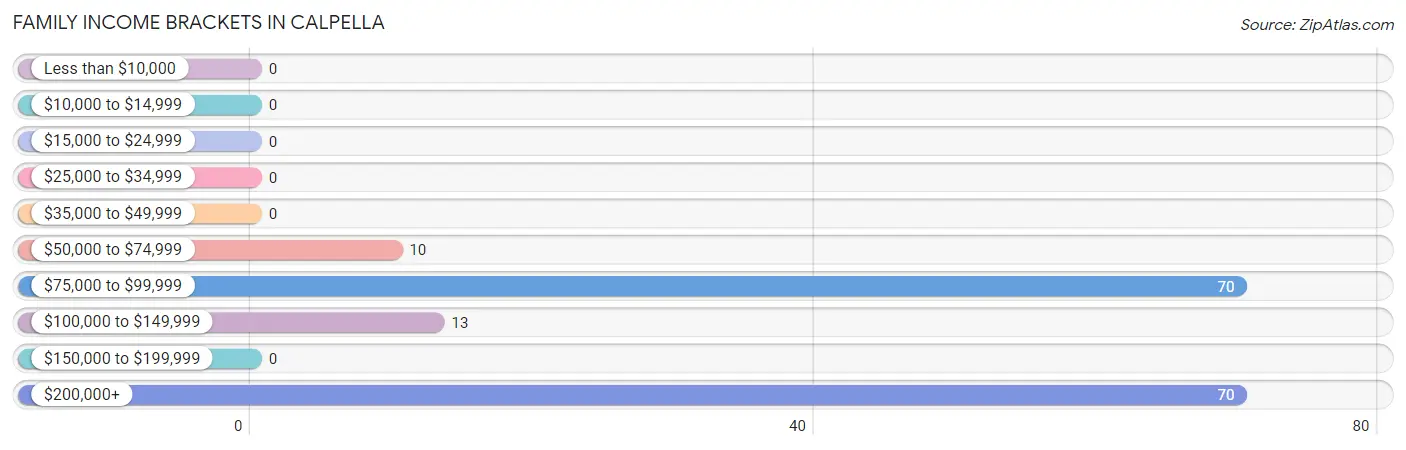
| Income Bracket | # Families | % Families |
| Less than $10,000 | 0 | 0.0% |
| $10,000 to $14,999 | 0 | 0.0% |
| $15,000 to $24,999 | 0 | 0.0% |
| $25,000 to $34,999 | 0 | 0.0% |
| $35,000 to $49,999 | 0 | 0.0% |
| $50,000 to $74,999 | 10 | 6.1% |
| $75,000 to $99,999 | 70 | 42.9% |
| $100,000 to $149,999 | 13 | 8.0% |
| $150,000 to $199,999 | 0 | 0.0% |
| $200,000+ | 70 | 42.9% |
Family Income by Famaliy Size in Calpella
2-person families (58 | 35.6%) account for the highest median family income in Calpella with $98,750 per family, while 2-person families (58 | 35.6%) have the highest median income of $49,375 per family member.
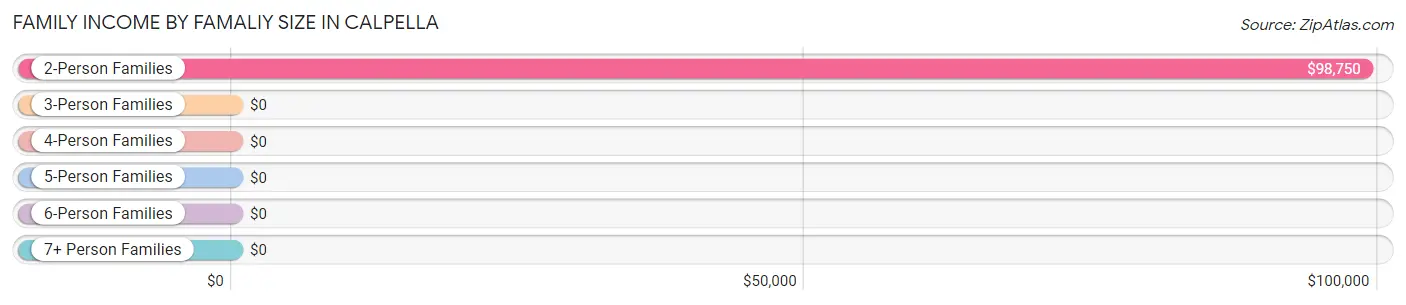
| Income Bracket | # Families | Median Income |
| 2-Person Families | 58 (35.6%) | $98,750 |
| 3-Person Families | 83 (50.9%) | $0 |
| 4-Person Families | 0 (0.0%) | $0 |
| 5-Person Families | 0 (0.0%) | $0 |
| 6-Person Families | 22 (13.5%) | $0 |
| 7+ Person Families | 0 (0.0%) | $0 |
| Total | 163 (100.0%) | $0 |
Family Income by Number of Earners in Calpella
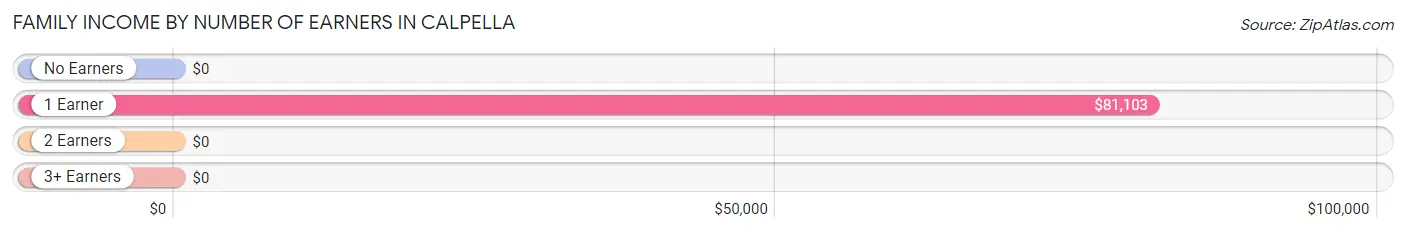
| Number of Earners | # Families | Median Income |
| No Earners | 13 (8.0%) | $0 |
| 1 Earner | 35 (21.5%) | $81,103 |
| 2 Earners | 76 (46.6%) | $0 |
| 3+ Earners | 39 (23.9%) | $0 |
| Total | 163 (100.0%) | $0 |
Household Income in Calpella
Household Income Brackets in Calpella
With 70 households falling in the category, the $75,000 to $99,999 income range is the most frequent in Calpella, accounting for 32.3% of all households.
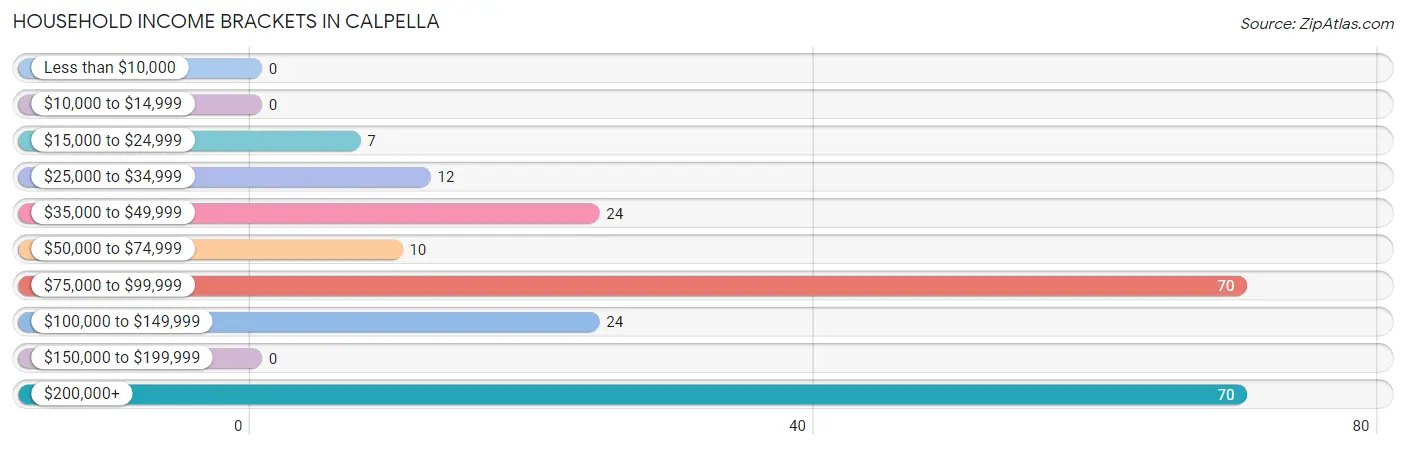
| Income Bracket | # Households | % Households |
| Less than $10,000 | 0 | 0.0% |
| $10,000 to $14,999 | 0 | 0.0% |
| $15,000 to $24,999 | 7 | 3.2% |
| $25,000 to $34,999 | 12 | 5.5% |
| $35,000 to $49,999 | 24 | 11.1% |
| $50,000 to $74,999 | 10 | 4.6% |
| $75,000 to $99,999 | 70 | 32.3% |
| $100,000 to $149,999 | 24 | 11.1% |
| $150,000 to $199,999 | 0 | 0.0% |
| $200,000+ | 70 | 32.3% |
Household Income by Householder Age in Calpella
The median household income in Calpella is $98,867, with the highest median household income of $69,375 found in the 65+ years age bracket for the primary householder. A total of 53 households (24.4%) fall into this category. Meanwhile, the 15 to 24 years age bracket for the primary householder has the lowest median household income of $0, with 13 households (6.0%) in this group.
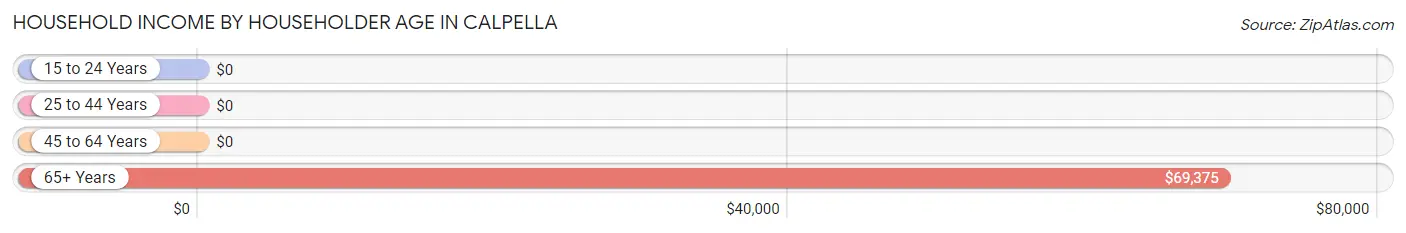
| Income Bracket | # Households | Median Income |
| 15 to 24 Years | 13 (6.0%) | $0 |
| 25 to 44 Years | 30 (13.8%) | $0 |
| 45 to 64 Years | 121 (55.8%) | $0 |
| 65+ Years | 53 (24.4%) | $69,375 |
| Total | 217 (100.0%) | $98,867 |
Poverty in Calpella
Income Below Poverty by Sex and Age in Calpella
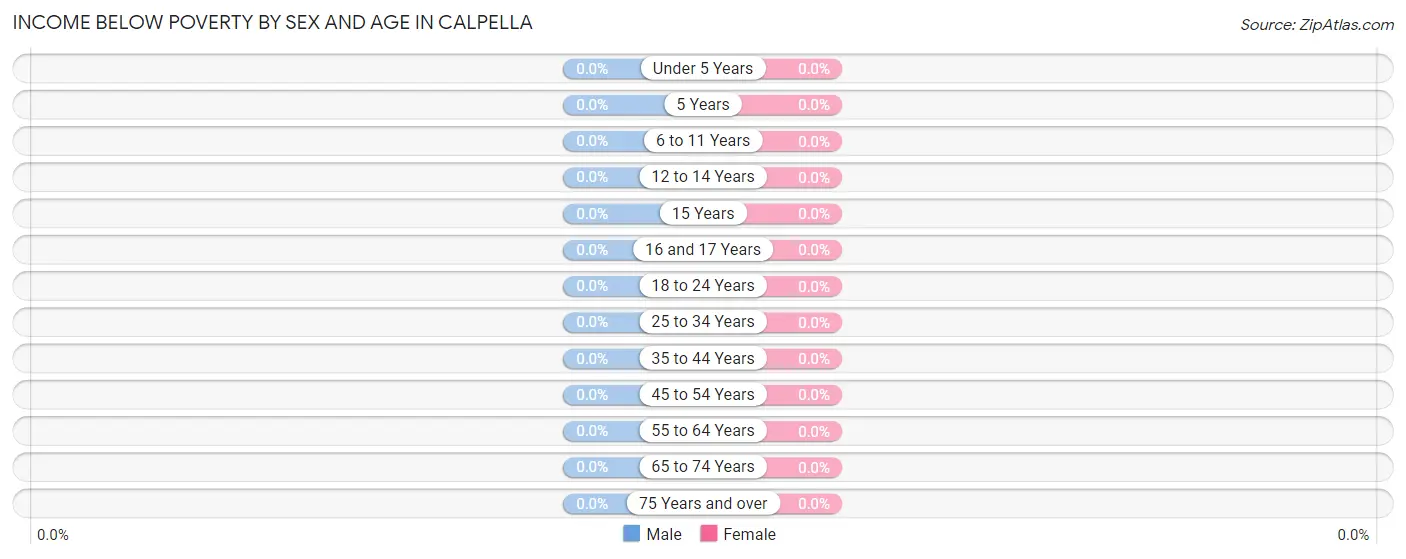
| Age Bracket | Male | Female |
| Under 5 Years | 0 (0.0%) | 0 (0.0%) |
| 5 Years | 0 (0.0%) | 0 (0.0%) |
| 6 to 11 Years | 0 (0.0%) | 0 (0.0%) |
| 12 to 14 Years | 0 (0.0%) | 0 (0.0%) |
| 15 Years | 0 (0.0%) | 0 (0.0%) |
| 16 and 17 Years | 0 (0.0%) | 0 (0.0%) |
| 18 to 24 Years | 0 (0.0%) | 0 (0.0%) |
| 25 to 34 Years | 0 (0.0%) | 0 (0.0%) |
| 35 to 44 Years | 0 (0.0%) | 0 (0.0%) |
| 45 to 54 Years | 0 (0.0%) | 0 (0.0%) |
| 55 to 64 Years | 0 (0.0%) | 0 (0.0%) |
| 65 to 74 Years | 0 (0.0%) | 0 (0.0%) |
| 75 Years and over | 0 (0.0%) | 0 (0.0%) |
| Total | 0 (0.0%) | 0 (0.0%) |
Income Above Poverty by Sex and Age in Calpella
According to the poverty statistics in Calpella, males aged under 5 years and females aged 15 years are the age groups that are most secure financially, with 100.0% of males and 100.0% of females in these age groups living above the poverty line.
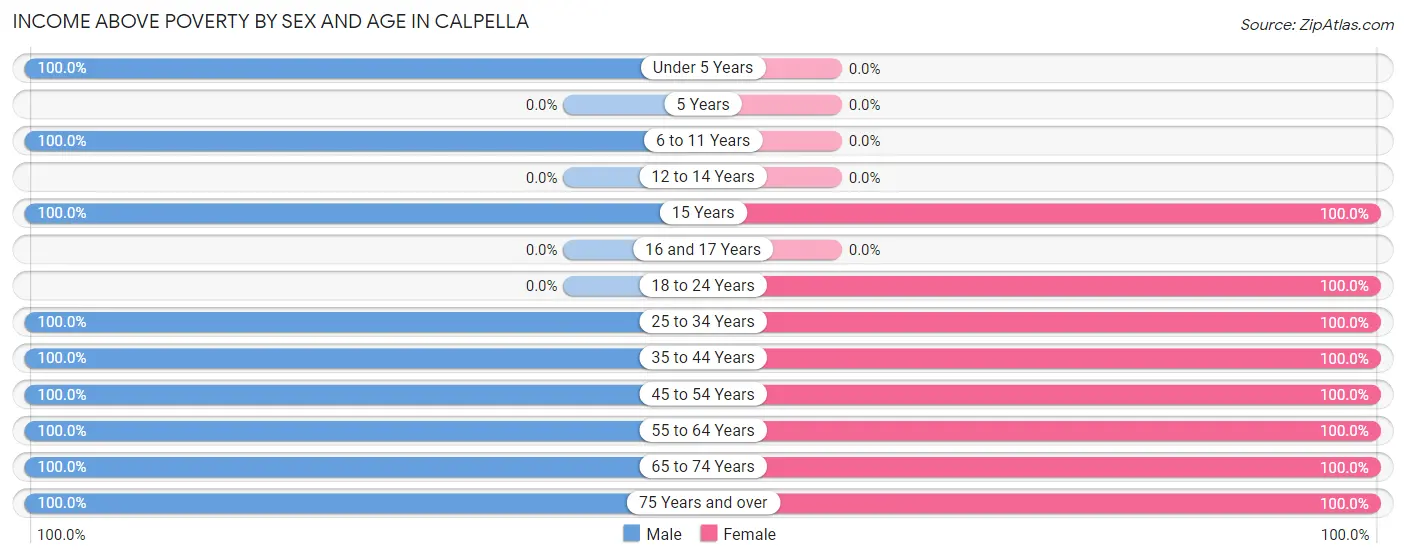
| Age Bracket | Male | Female |
| Under 5 Years | 24 (100.0%) | 0 (0.0%) |
| 5 Years | 0 (0.0%) | 0 (0.0%) |
| 6 to 11 Years | 23 (100.0%) | 0 (0.0%) |
| 12 to 14 Years | 0 (0.0%) | 0 (0.0%) |
| 15 Years | 36 (100.0%) | 24 (100.0%) |
| 16 and 17 Years | 0 (0.0%) | 0 (0.0%) |
| 18 to 24 Years | 0 (0.0%) | 13 (100.0%) |
| 25 to 34 Years | 36 (100.0%) | 16 (100.0%) |
| 35 to 44 Years | 17 (100.0%) | 22 (100.0%) |
| 45 to 54 Years | 118 (100.0%) | 80 (100.0%) |
| 55 to 64 Years | 46 (100.0%) | 27 (100.0%) |
| 65 to 74 Years | 58 (100.0%) | 78 (100.0%) |
| 75 Years and over | 37 (100.0%) | 19 (100.0%) |
| Total | 395 (100.0%) | 279 (100.0%) |
Income Below Poverty Among Married-Couple Families in Calpella
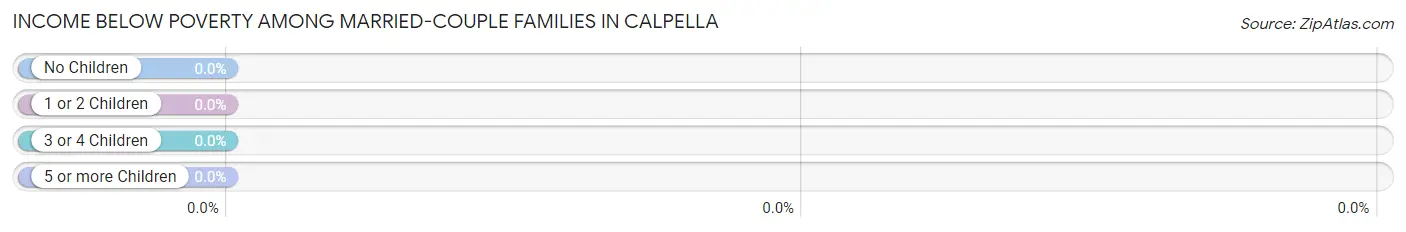
| Children | Above Poverty | Below Poverty |
| No Children | 102 (100.0%) | 0 (0.0%) |
| 1 or 2 Children | 61 (100.0%) | 0 (0.0%) |
| 3 or 4 Children | 0 (0.0%) | 0 (0.0%) |
| 5 or more Children | 0 (0.0%) | 0 (0.0%) |
| Total | 163 (100.0%) | 0 (0.0%) |
Income Below Poverty Among Single-Parent Households in Calpella
| Children | Single Father | Single Mother |
| No Children | 0 (0.0%) | 0 (0.0%) |
| 1 or 2 Children | 0 (0.0%) | 0 (0.0%) |
| 3 or 4 Children | 0 (0.0%) | 0 (0.0%) |
| 5 or more Children | 0 (0.0%) | 0 (0.0%) |
| Total | 0 (0.0%) | 0 (0.0%) |
Income Below Poverty Among Married-Couple vs Single-Parent Households in Calpella
| Children | Married-Couple Families | Single-Parent Households |
| No Children | 0 (0.0%) | 0 (0.0%) |
| 1 or 2 Children | 0 (0.0%) | 0 (0.0%) |
| 3 or 4 Children | 0 (0.0%) | 0 (0.0%) |
| 5 or more Children | 0 (0.0%) | 0 (0.0%) |
| Total | 0 (0.0%) | 0 (0.0%) |
Race in Calpella
The most populous races in Calpella are White / Caucasian (601 | 89.2%), Hispanic or Latino (306 | 45.4%), and Two or more Races (65 | 9.6%).
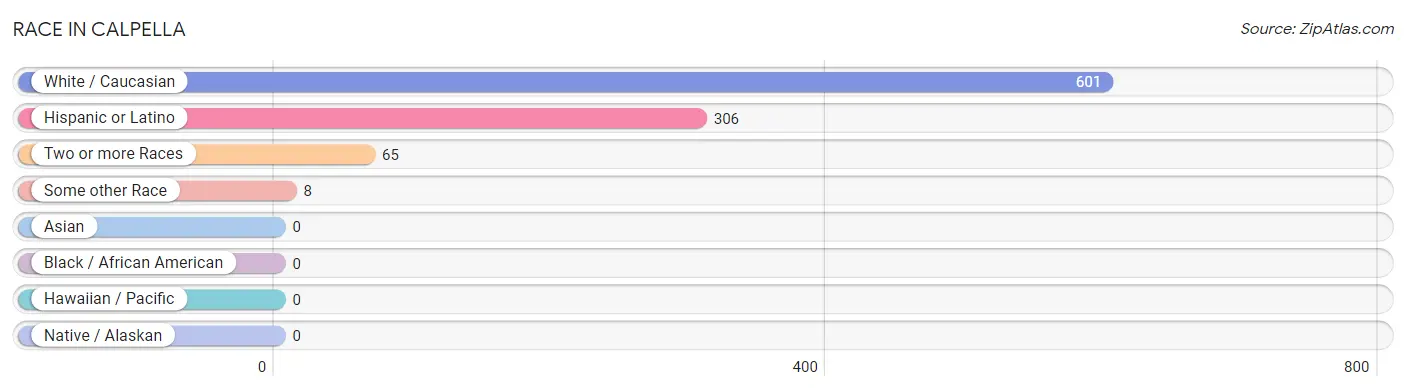
| Race | # Population | % Population |
| Asian | 0 | 0.0% |
| Black / African American | 0 | 0.0% |
| Hawaiian / Pacific | 0 | 0.0% |
| Hispanic or Latino | 306 | 45.4% |
| Native / Alaskan | 0 | 0.0% |
| White / Caucasian | 601 | 89.2% |
| Two or more Races | 65 | 9.6% |
| Some other Race | 8 | 1.2% |
| Total | 674 | 100.0% |
Ancestry in Calpella
The most populous ancestries reported in Calpella are Mexican (256 | 38.0%), German (147 | 21.8%), Irish (48 | 7.1%), English (47 | 7.0%), and French (44 | 6.5%), together accounting for 80.4% of all Calpella residents.
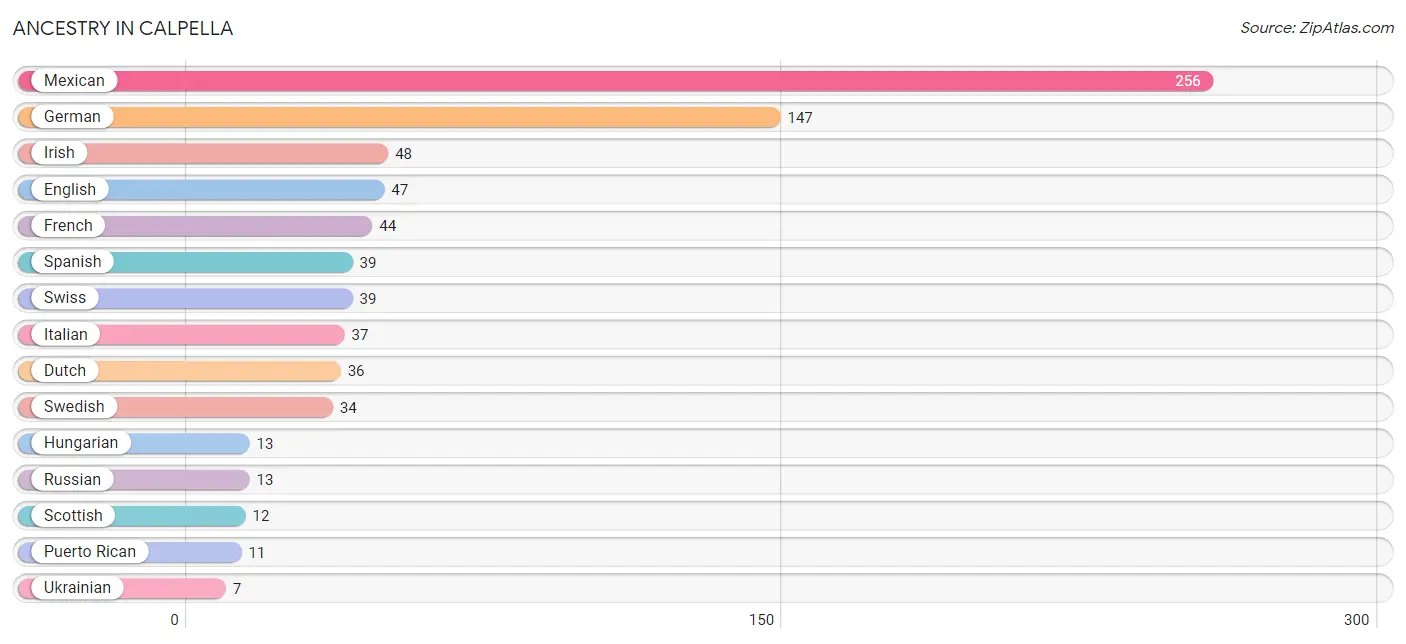
| Ancestry | # Population | % Population |
| Dutch | 36 | 5.3% |
| English | 47 | 7.0% |
| French | 44 | 6.5% |
| German | 147 | 21.8% |
| Hungarian | 13 | 1.9% |
| Irish | 48 | 7.1% |
| Italian | 37 | 5.5% |
| Mexican | 256 | 38.0% |
| Puerto Rican | 11 | 1.6% |
| Russian | 13 | 1.9% |
| Scottish | 12 | 1.8% |
| Spanish | 39 | 5.8% |
| Swedish | 34 | 5.0% |
| Swiss | 39 | 5.8% |
| Ukrainian | 7 | 1.0% | View All 15 Rows |
Immigrants in Calpella
The most numerous immigrant groups reported in Calpella came from Central America (88 | 13.1%), Latin America (88 | 13.1%), Mexico (88 | 13.1%), Europe (7 | 1.0%), and Germany (7 | 1.0%), together accounting for 41.3% of all Calpella residents.
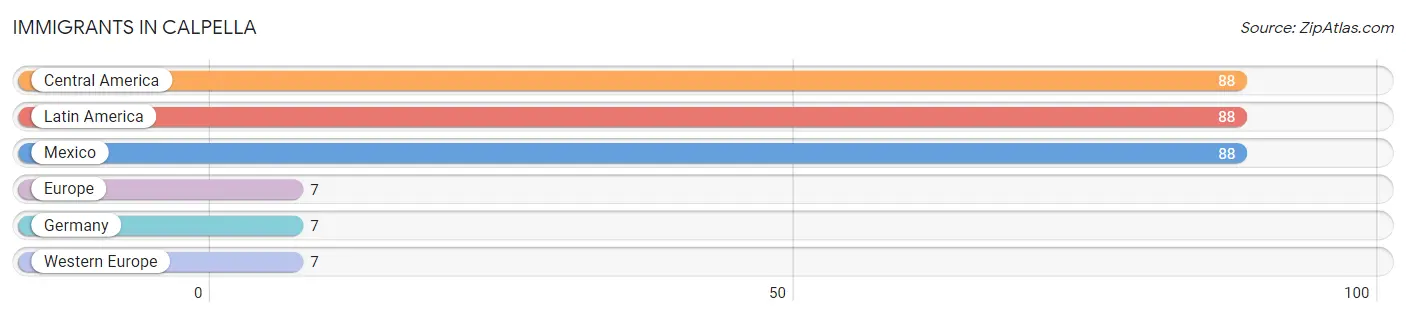
| Immigration Origin | # Population | % Population |
| Central America | 88 | 13.1% |
| Europe | 7 | 1.0% |
| Germany | 7 | 1.0% |
| Latin America | 88 | 13.1% |
| Mexico | 88 | 13.1% |
| Western Europe | 7 | 1.0% | View All 6 Rows |
Sex and Age in Calpella
Sex and Age in Calpella
The most populous age groups in Calpella are 45 to 49 Years (118 | 29.9%) for men and 45 to 49 Years (63 | 22.6%) for women.
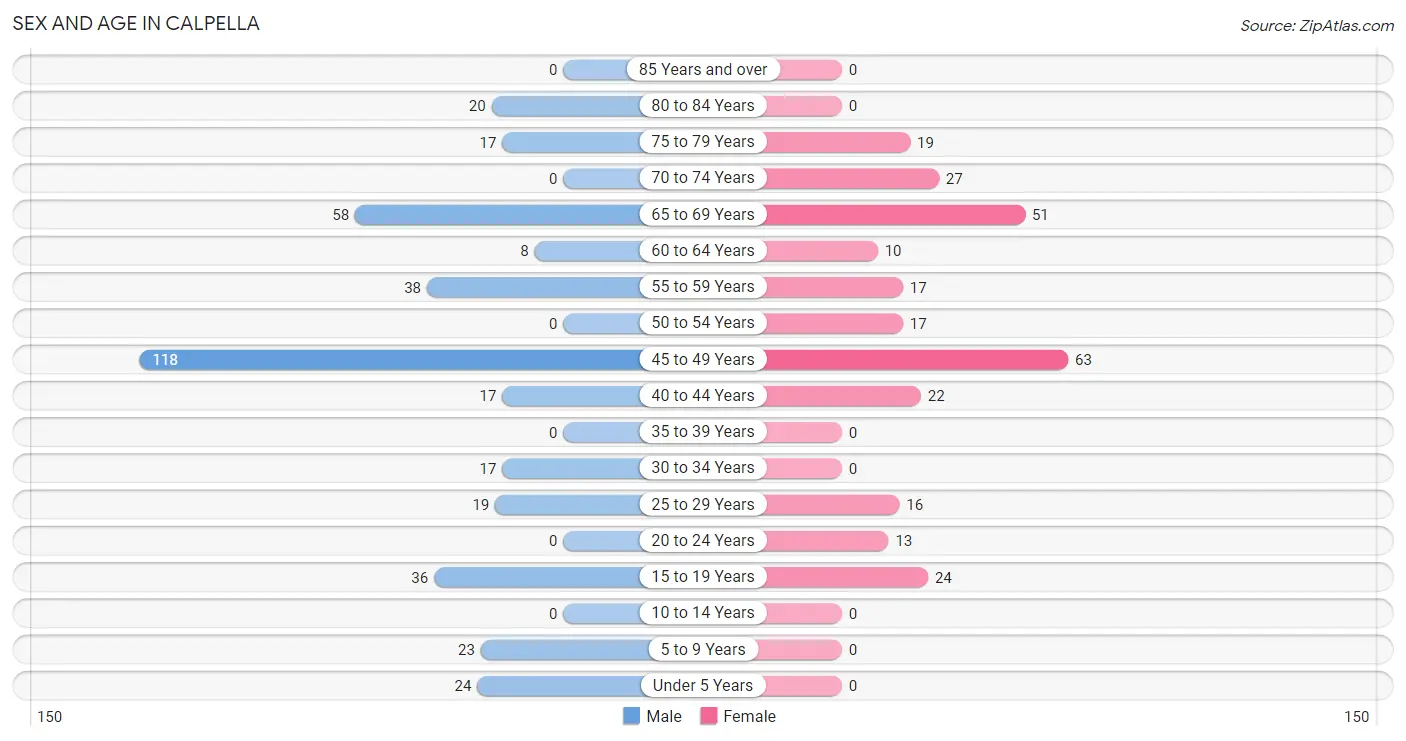
| Age Bracket | Male | Female |
| Under 5 Years | 24 (6.1%) | 0 (0.0%) |
| 5 to 9 Years | 23 (5.8%) | 0 (0.0%) |
| 10 to 14 Years | 0 (0.0%) | 0 (0.0%) |
| 15 to 19 Years | 36 (9.1%) | 24 (8.6%) |
| 20 to 24 Years | 0 (0.0%) | 13 (4.7%) |
| 25 to 29 Years | 19 (4.8%) | 16 (5.7%) |
| 30 to 34 Years | 17 (4.3%) | 0 (0.0%) |
| 35 to 39 Years | 0 (0.0%) | 0 (0.0%) |
| 40 to 44 Years | 17 (4.3%) | 22 (7.9%) |
| 45 to 49 Years | 118 (29.9%) | 63 (22.6%) |
| 50 to 54 Years | 0 (0.0%) | 17 (6.1%) |
| 55 to 59 Years | 38 (9.6%) | 17 (6.1%) |
| 60 to 64 Years | 8 (2.0%) | 10 (3.6%) |
| 65 to 69 Years | 58 (14.7%) | 51 (18.3%) |
| 70 to 74 Years | 0 (0.0%) | 27 (9.7%) |
| 75 to 79 Years | 17 (4.3%) | 19 (6.8%) |
| 80 to 84 Years | 20 (5.1%) | 0 (0.0%) |
| 85 Years and over | 0 (0.0%) | 0 (0.0%) |
| Total | 395 (100.0%) | 279 (100.0%) |
Families and Households in Calpella
Median Family Size in Calpella
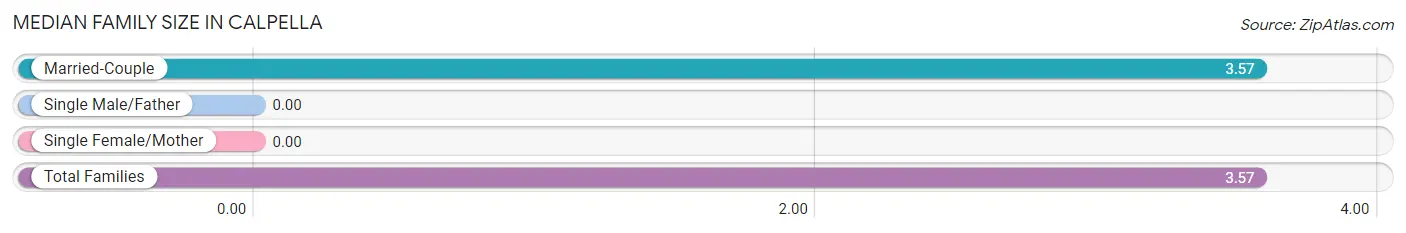
| Family Type | # Families | Family Size |
| Married-Couple | 163 (100.0%) | 3.57 |
| Single Male/Father | 0 (0.0%) | - |
| Single Female/Mother | 0 (0.0%) | - |
| Total Families | 163 (100.0%) | 3.57 |
Median Household Size in Calpella
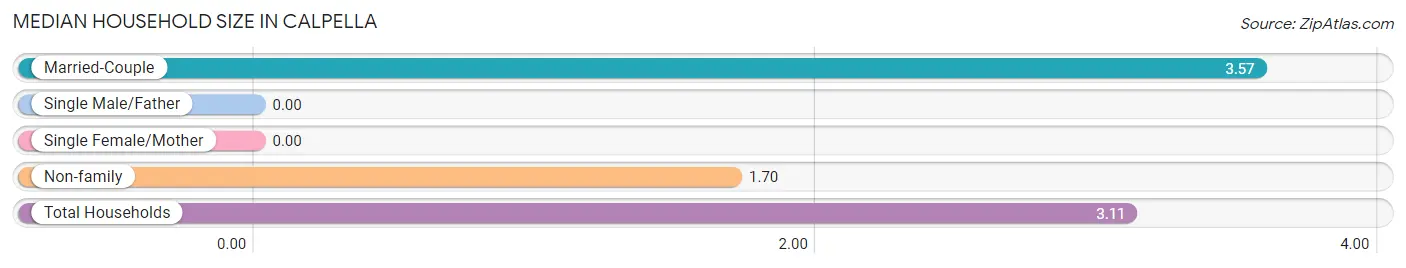
| Household Type | # Households | Household Size |
| Married-Couple | 163 (75.1%) | 3.57 |
| Single Male/Father | 0 (0.0%) | - |
| Single Female/Mother | 0 (0.0%) | - |
| Non-family | 54 (24.9%) | 1.70 |
| Total Households | 217 (100.0%) | 3.11 |
Household Size by Marriage Status in Calpella
Out of a total of 217 households in Calpella, 163 (75.1%) are family households, while 54 (24.9%) are nonfamily households. The most numerous type of family households are 3-person households, comprising 83, and the most common type of nonfamily households are 1-person households, comprising 43.
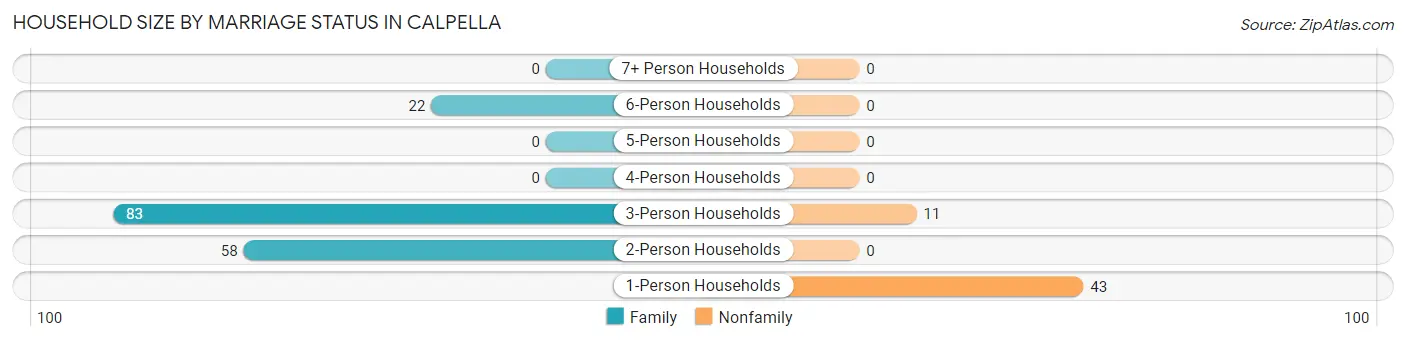
| Household Size | Family Households | Nonfamily Households |
| 1-Person Households | - | 43 (19.8%) |
| 2-Person Households | 58 (26.7%) | 0 (0.0%) |
| 3-Person Households | 83 (38.3%) | 11 (5.1%) |
| 4-Person Households | 0 (0.0%) | 0 (0.0%) |
| 5-Person Households | 0 (0.0%) | 0 (0.0%) |
| 6-Person Households | 22 (10.1%) | 0 (0.0%) |
| 7+ Person Households | 0 (0.0%) | 0 (0.0%) |
| Total | 163 (75.1%) | 54 (24.9%) |
Female Fertility in Calpella
Fertility by Age in Calpella
| Age Bracket | Women with Births | Births / 1,000 Women |
| 15 to 19 years | 0 (0.0%) | 0.0 |
| 20 to 34 years | 0 (0.0%) | 0.0 |
| 35 to 50 years | 0 (0.0%) | 0.0 |
| Total | 0 (0.0%) | 0.0 |
Fertility by Age by Marriage Status in Calpella
| Age Bracket | Married | Unmarried |
| 15 to 19 years | 0 (0.0%) | 0 (0.0%) |
| 20 to 34 years | 0 (0.0%) | 0 (0.0%) |
| 35 to 50 years | 0 (0.0%) | 0 (0.0%) |
| Total | 0 (0.0%) | 0 (0.0%) |
Fertility by Education in Calpella
| Educational Attainment | Women with Births | Births / 1,000 Women |
| Less than High School | 0 (0.0%) | 0.0 |
| High School Diploma | 0 (0.0%) | 0.0 |
| College or Associate's Degree | 0 (0.0%) | 0.0 |
| Bachelor's Degree | 0 (0.0%) | 0.0 |
| Graduate Degree | 0 (0.0%) | 0.0 |
| Total | 0 (0.0%) | 0.0 |
Fertility by Education by Marriage Status in Calpella
| Educational Attainment | Married | Unmarried |
| Less than High School | 0 (0.0%) | 0 (0.0%) |
| High School Diploma | 0 (0.0%) | 0 (0.0%) |
| College or Associate's Degree | 0 (0.0%) | 0 (0.0%) |
| Bachelor's Degree | 0 (0.0%) | 0 (0.0%) |
| Graduate Degree | 0 (0.0%) | 0 (0.0%) |
| Total | 0 (0.0%) | 0 (0.0%) |
Employment Characteristics in Calpella
Employment by Class of Employer in Calpella
Among the 306 employed individuals in Calpella, private company employees (150 | 49.0%), not-for-profit organizations (45 | 14.7%), and self-employed (not incorporated) (38 | 12.4%) make up the most common classes of employment.
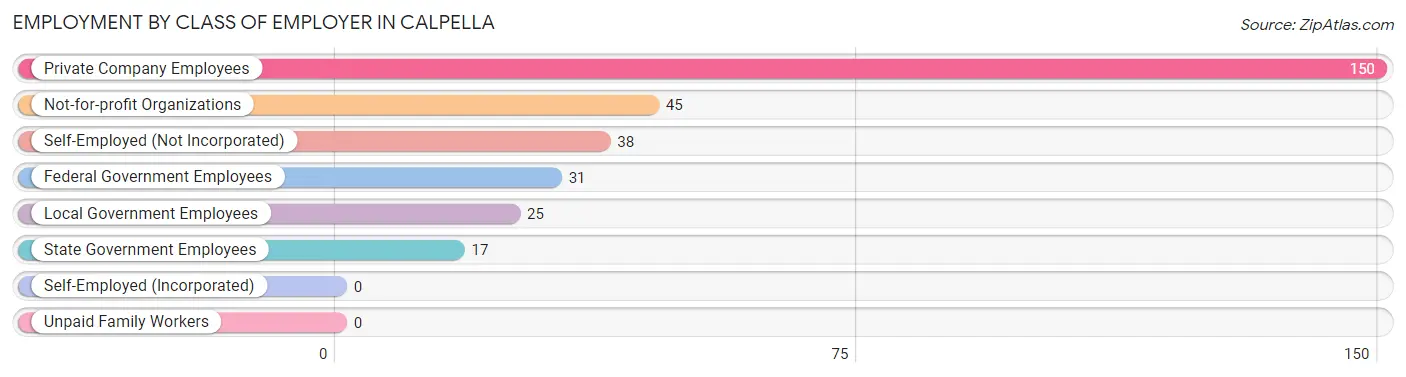
| Employer Class | # Employees | % Employees |
| Private Company Employees | 150 | 49.0% |
| Self-Employed (Incorporated) | 0 | 0.0% |
| Self-Employed (Not Incorporated) | 38 | 12.4% |
| Not-for-profit Organizations | 45 | 14.7% |
| Local Government Employees | 25 | 8.2% |
| State Government Employees | 17 | 5.6% |
| Federal Government Employees | 31 | 10.1% |
| Unpaid Family Workers | 0 | 0.0% |
| Total | 306 | 100.0% |
Employment Status by Age in Calpella
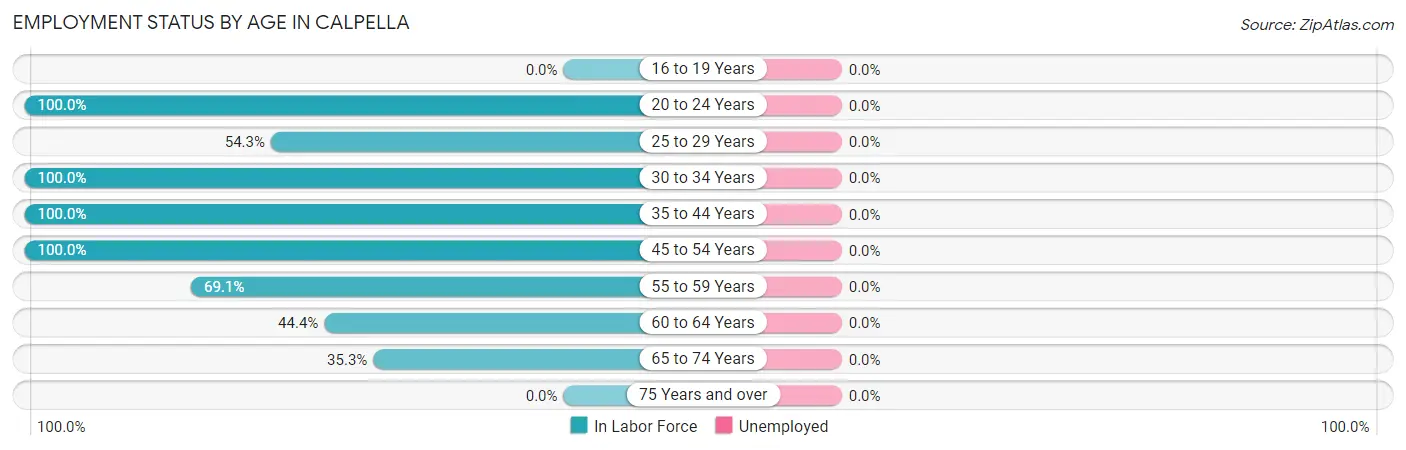
| Age Bracket | In Labor Force | Unemployed |
| 16 to 19 Years | 0 (0.0%) | 0 (0.0%) |
| 20 to 24 Years | 13 (100.0%) | 0 (0.0%) |
| 25 to 29 Years | 19 (54.3%) | 0 (0.0%) |
| 30 to 34 Years | 17 (100.0%) | 0 (0.0%) |
| 35 to 44 Years | 39 (100.0%) | 0 (0.0%) |
| 45 to 54 Years | 198 (100.0%) | 0 (0.0%) |
| 55 to 59 Years | 38 (69.1%) | 0 (0.0%) |
| 60 to 64 Years | 8 (44.4%) | 0 (0.0%) |
| 65 to 74 Years | 48 (35.3%) | 0 (0.0%) |
| 75 Years and over | 0 (0.0%) | 0 (0.0%) |
| Total | 380 (67.0%) | 0 (0.0%) |
Employment Status by Educational Attainment in Calpella
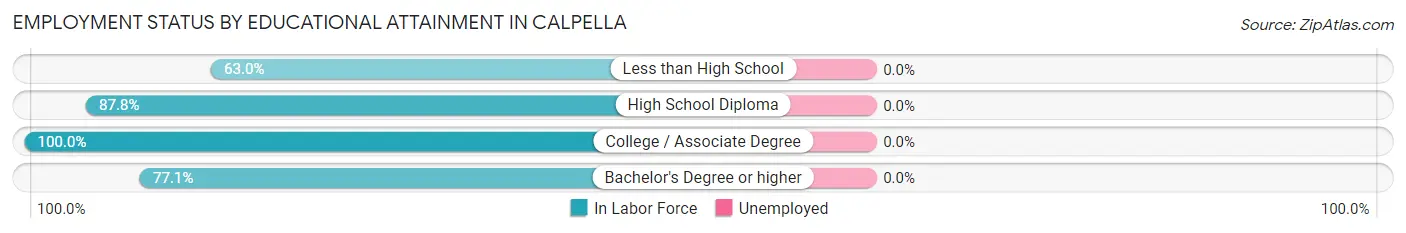
| Educational Attainment | In Labor Force | Unemployed |
| Less than High School | 17 (63.0%) | 0 (0.0%) |
| High School Diploma | 122 (87.8%) | 0 (0.0%) |
| College / Associate Degree | 126 (100.0%) | 0 (0.0%) |
| Bachelor's Degree or higher | 54 (77.1%) | 0 (0.0%) |
| Total | 319 (88.1%) | 0 (0.0%) |
Employment Occupations by Sex in Calpella
Management, Business, Science and Arts Occupations
The most common Management, Business, Science and Arts occupations in Calpella are Management (61 | 16.1%), Health Diagnosing & Treating (44 | 11.6%), and Health Technologists (13 | 3.4%).
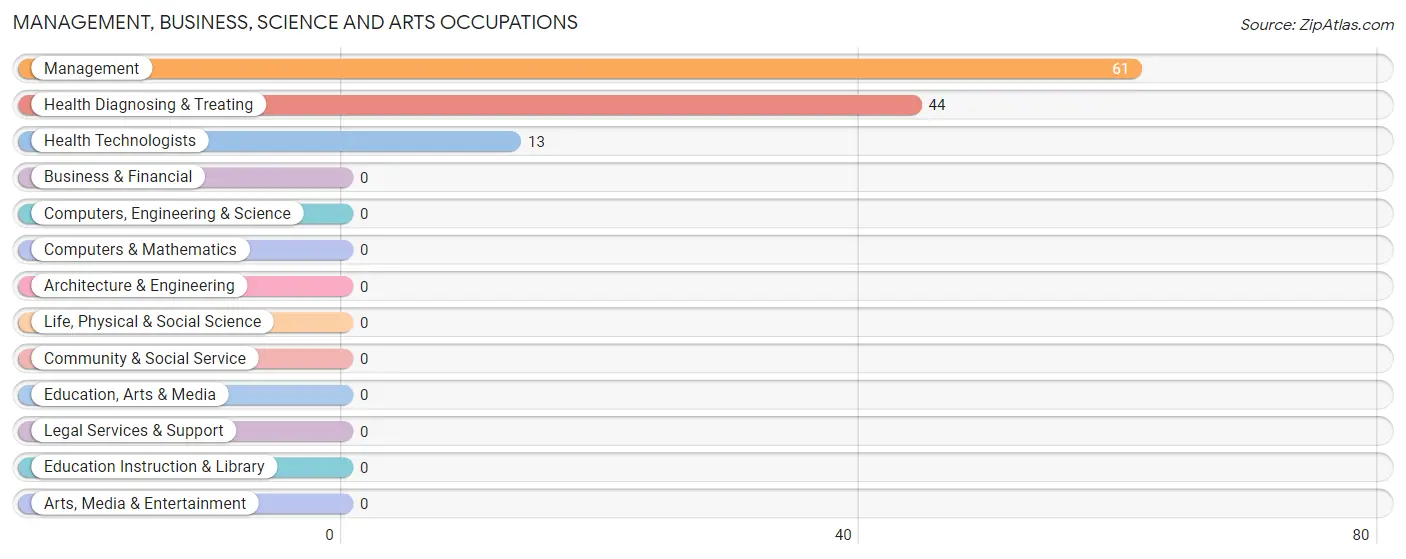
Management, Business, Science and Arts Occupations by Sex
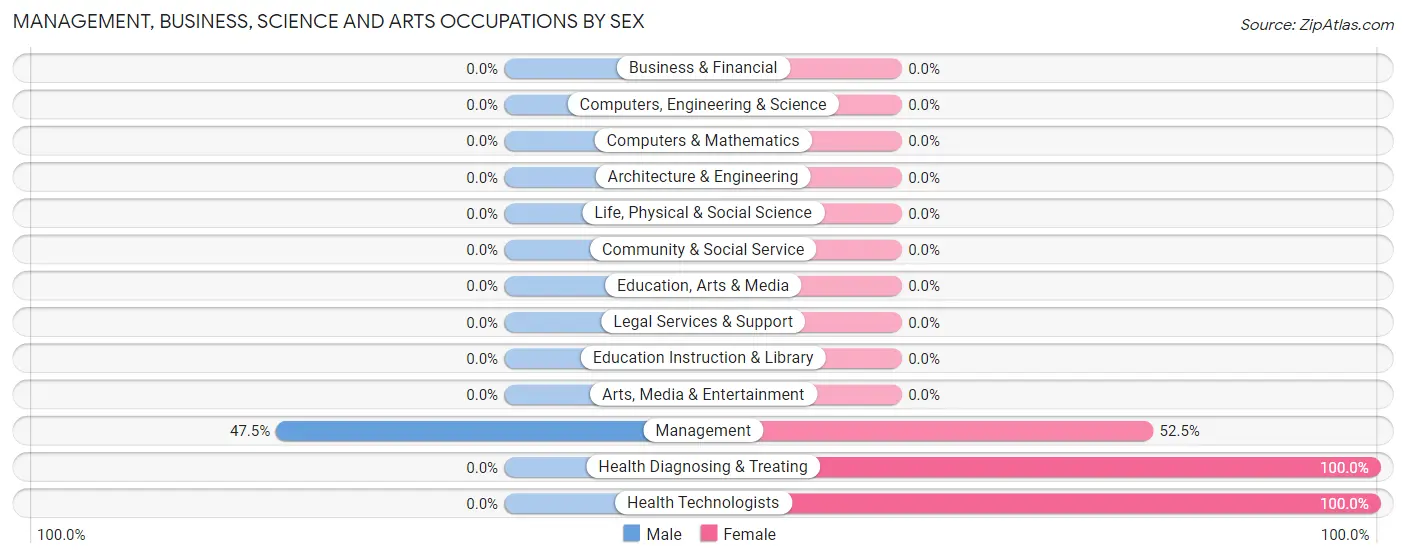
| Occupation | Male | Female |
| Management | 29 (47.5%) | 32 (52.5%) |
| Business & Financial | 0 (0.0%) | 0 (0.0%) |
| Computers, Engineering & Science | 0 (0.0%) | 0 (0.0%) |
| Computers & Mathematics | 0 (0.0%) | 0 (0.0%) |
| Architecture & Engineering | 0 (0.0%) | 0 (0.0%) |
| Life, Physical & Social Science | 0 (0.0%) | 0 (0.0%) |
| Community & Social Service | 0 (0.0%) | 0 (0.0%) |
| Education, Arts & Media | 0 (0.0%) | 0 (0.0%) |
| Legal Services & Support | 0 (0.0%) | 0 (0.0%) |
| Education Instruction & Library | 0 (0.0%) | 0 (0.0%) |
| Arts, Media & Entertainment | 0 (0.0%) | 0 (0.0%) |
| Health Diagnosing & Treating | 0 (0.0%) | 44 (100.0%) |
| Health Technologists | 0 (0.0%) | 13 (100.0%) |
| Total (Category) | 29 (27.6%) | 76 (72.4%) |
| Total (Overall) | 248 (65.3%) | 132 (34.7%) |
Services Occupations
The most common Services occupations in Calpella are Healthcare Support (17 | 4.5%), Cleaning & Maintenance (17 | 4.5%), Security & Protection (8 | 2.1%), and Law Enforcement (8 | 2.1%).
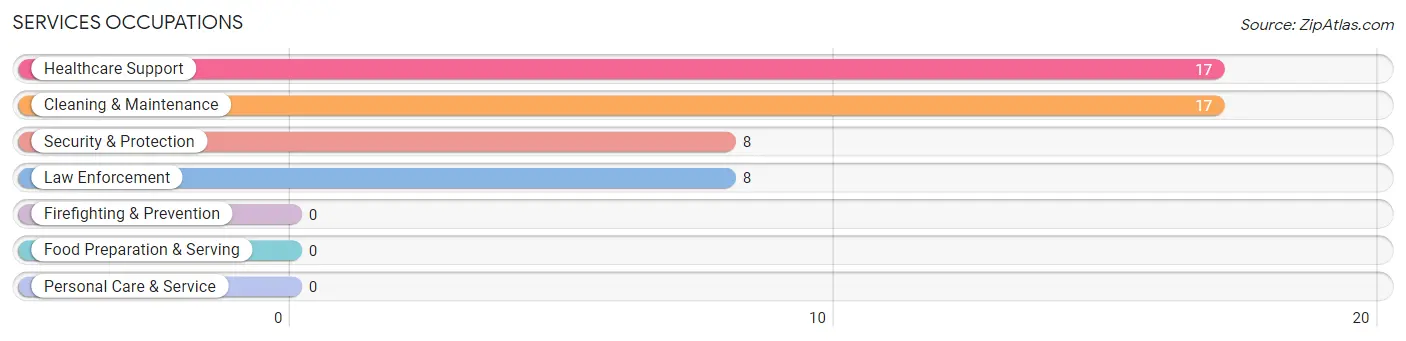
Services Occupations by Sex
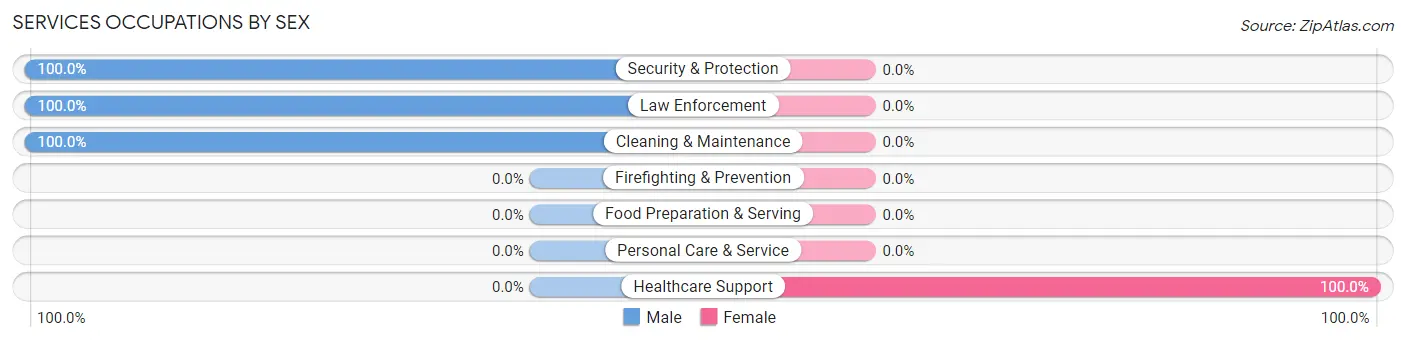
| Occupation | Male | Female |
| Healthcare Support | 0 (0.0%) | 17 (100.0%) |
| Security & Protection | 8 (100.0%) | 0 (0.0%) |
| Firefighting & Prevention | 0 (0.0%) | 0 (0.0%) |
| Law Enforcement | 8 (100.0%) | 0 (0.0%) |
| Food Preparation & Serving | 0 (0.0%) | 0 (0.0%) |
| Cleaning & Maintenance | 17 (100.0%) | 0 (0.0%) |
| Personal Care & Service | 0 (0.0%) | 0 (0.0%) |
| Total (Category) | 25 (59.5%) | 17 (40.5%) |
| Total (Overall) | 248 (65.3%) | 132 (34.7%) |
Sales and Office Occupations
The most common Sales and Office occupations in Calpella are Sales & Related (22 | 5.8%), and Office & Administration (17 | 4.5%).
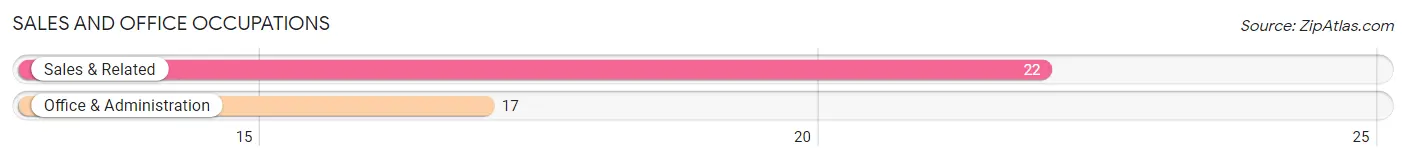
Sales and Office Occupations by Sex
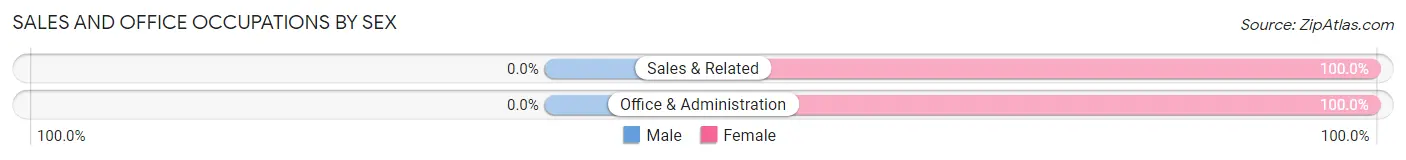
| Occupation | Male | Female |
| Sales & Related | 0 (0.0%) | 22 (100.0%) |
| Office & Administration | 0 (0.0%) | 17 (100.0%) |
| Total (Category) | 0 (0.0%) | 39 (100.0%) |
| Total (Overall) | 248 (65.3%) | 132 (34.7%) |
Natural Resources, Construction and Maintenance Occupations
The most common Natural Resources, Construction and Maintenance occupations in Calpella are Farming, Fishing & Forestry (74 | 19.5%), Construction & Extraction (60 | 15.8%), and Installation, Maintenance & Repair (25 | 6.6%).
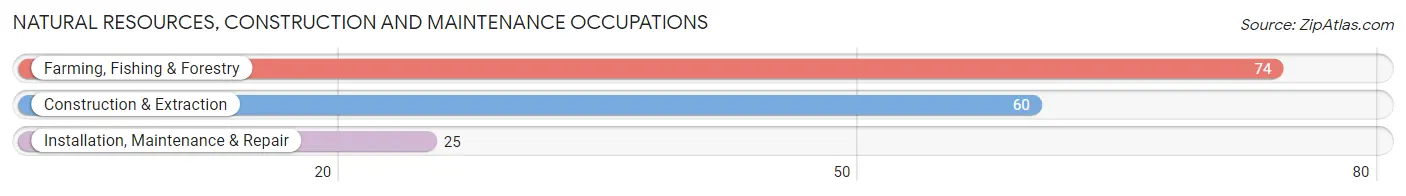
Natural Resources, Construction and Maintenance Occupations by Sex
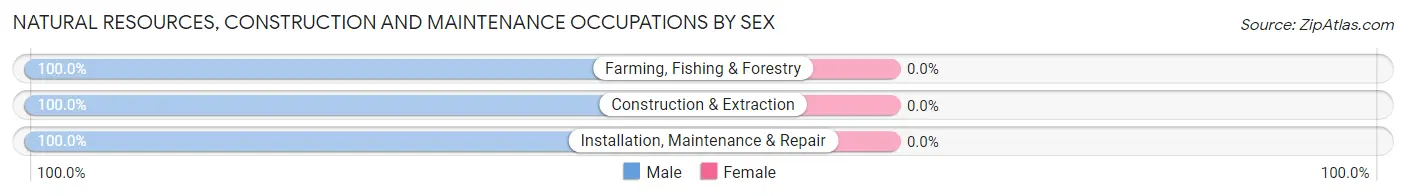
| Occupation | Male | Female |
| Farming, Fishing & Forestry | 74 (100.0%) | 0 (0.0%) |
| Construction & Extraction | 60 (100.0%) | 0 (0.0%) |
| Installation, Maintenance & Repair | 25 (100.0%) | 0 (0.0%) |
| Total (Category) | 159 (100.0%) | 0 (0.0%) |
| Total (Overall) | 248 (65.3%) | 132 (34.7%) |
Production, Transportation and Moving Occupations
The most common Production, Transportation and Moving occupations in Calpella are , and Production (35 | 9.2%).
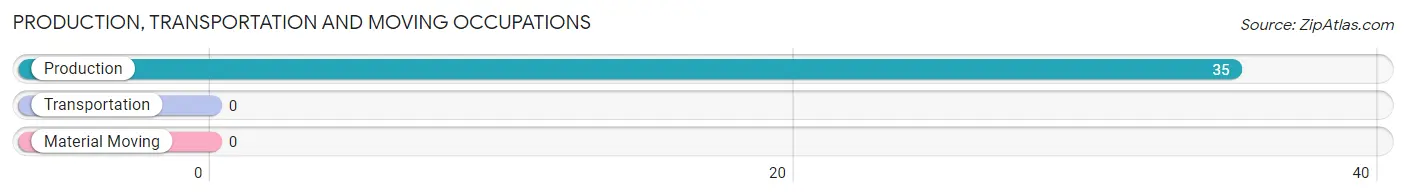
Production, Transportation and Moving Occupations by Sex
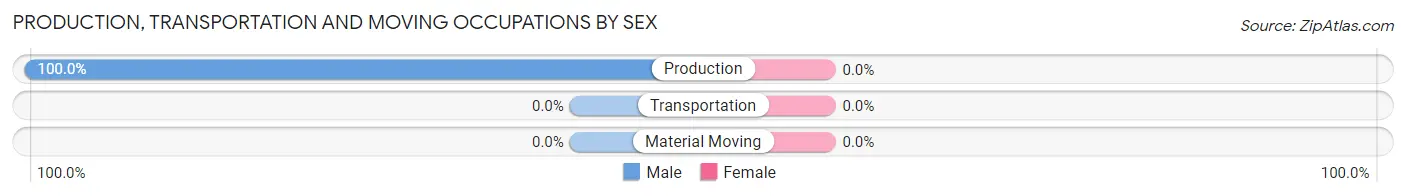
| Occupation | Male | Female |
| Production | 35 (100.0%) | 0 (0.0%) |
| Transportation | 0 (0.0%) | 0 (0.0%) |
| Material Moving | 0 (0.0%) | 0 (0.0%) |
| Total (Category) | 35 (100.0%) | 0 (0.0%) |
| Total (Overall) | 248 (65.3%) | 132 (34.7%) |
Employment Industries by Sex in Calpella
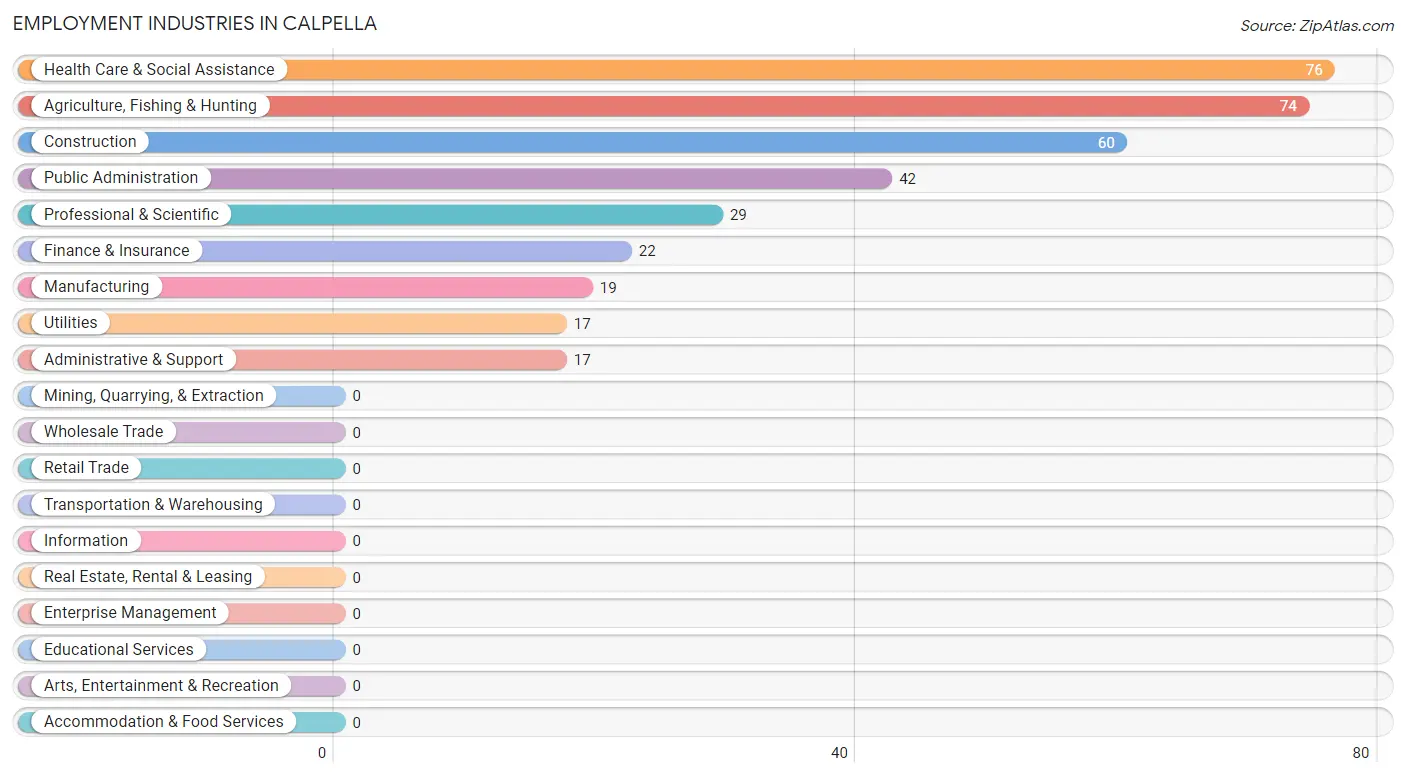
Employment Industries in Calpella
The major employment industries in Calpella include Health Care & Social Assistance (76 | 20.0%), Agriculture, Fishing & Hunting (74 | 19.5%), Construction (60 | 15.8%), Public Administration (42 | 11.1%), and Professional & Scientific (29 | 7.6%).
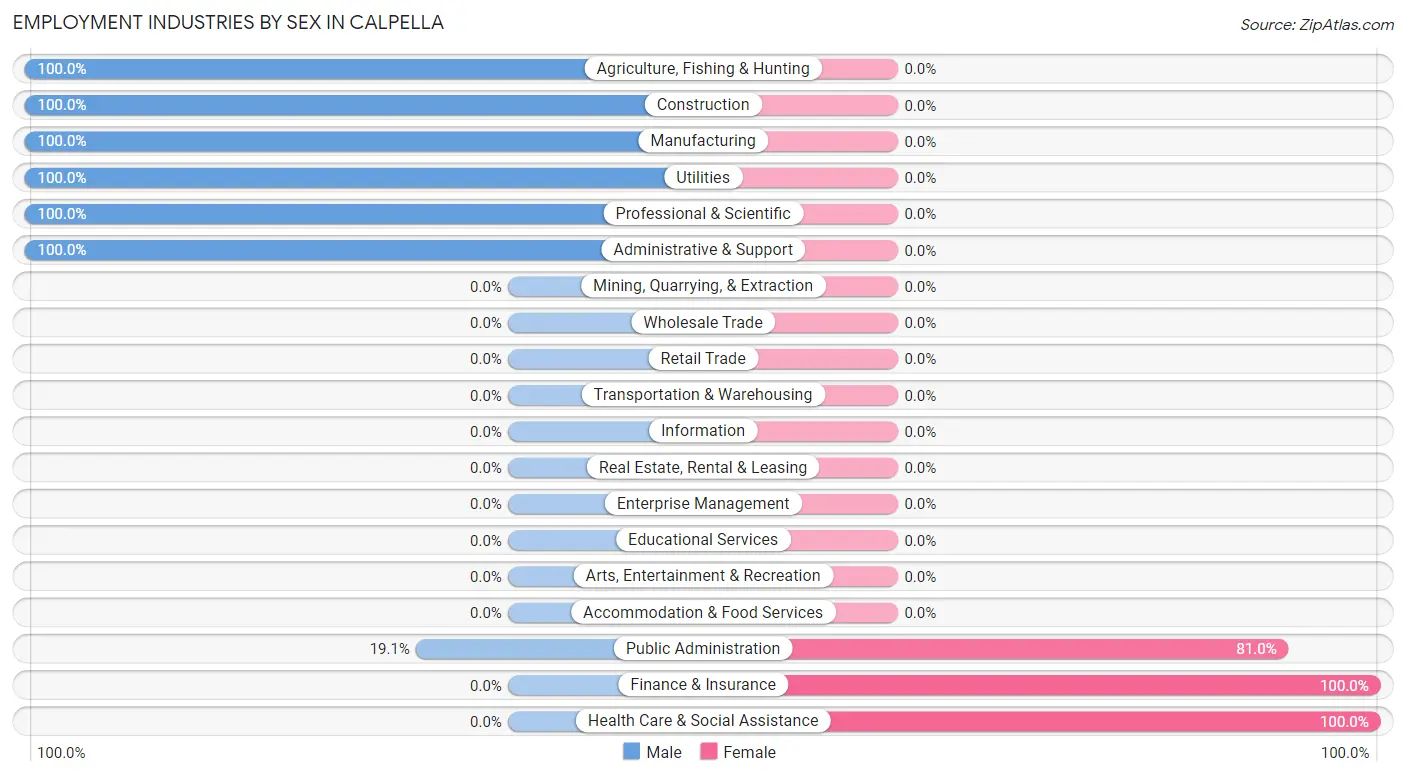
Employment Industries by Sex in Calpella
The Calpella industries that see more men than women are Agriculture, Fishing & Hunting (100.0%), Construction (100.0%), and Manufacturing (100.0%), whereas the industries that tend to have a higher number of women are Finance & Insurance (100.0%), Health Care & Social Assistance (100.0%), and Public Administration (80.9%).
| Industry | Male | Female |
| Agriculture, Fishing & Hunting | 74 (100.0%) | 0 (0.0%) |
| Mining, Quarrying, & Extraction | 0 (0.0%) | 0 (0.0%) |
| Construction | 60 (100.0%) | 0 (0.0%) |
| Manufacturing | 19 (100.0%) | 0 (0.0%) |
| Wholesale Trade | 0 (0.0%) | 0 (0.0%) |
| Retail Trade | 0 (0.0%) | 0 (0.0%) |
| Transportation & Warehousing | 0 (0.0%) | 0 (0.0%) |
| Utilities | 17 (100.0%) | 0 (0.0%) |
| Information | 0 (0.0%) | 0 (0.0%) |
| Finance & Insurance | 0 (0.0%) | 22 (100.0%) |
| Real Estate, Rental & Leasing | 0 (0.0%) | 0 (0.0%) |
| Professional & Scientific | 29 (100.0%) | 0 (0.0%) |
| Enterprise Management | 0 (0.0%) | 0 (0.0%) |
| Administrative & Support | 17 (100.0%) | 0 (0.0%) |
| Educational Services | 0 (0.0%) | 0 (0.0%) |
| Health Care & Social Assistance | 0 (0.0%) | 76 (100.0%) |
| Arts, Entertainment & Recreation | 0 (0.0%) | 0 (0.0%) |
| Accommodation & Food Services | 0 (0.0%) | 0 (0.0%) |
| Public Administration | 8 (19.1%) | 34 (80.9%) |
| Total | 248 (65.3%) | 132 (34.7%) |
Education in Calpella
School Enrollment in Calpella
The most common levels of schooling among the 64 students in Calpella are middle school (24 | 37.5%), elementary school (23 | 35.9%), and college / undergraduate (17 | 26.6%).
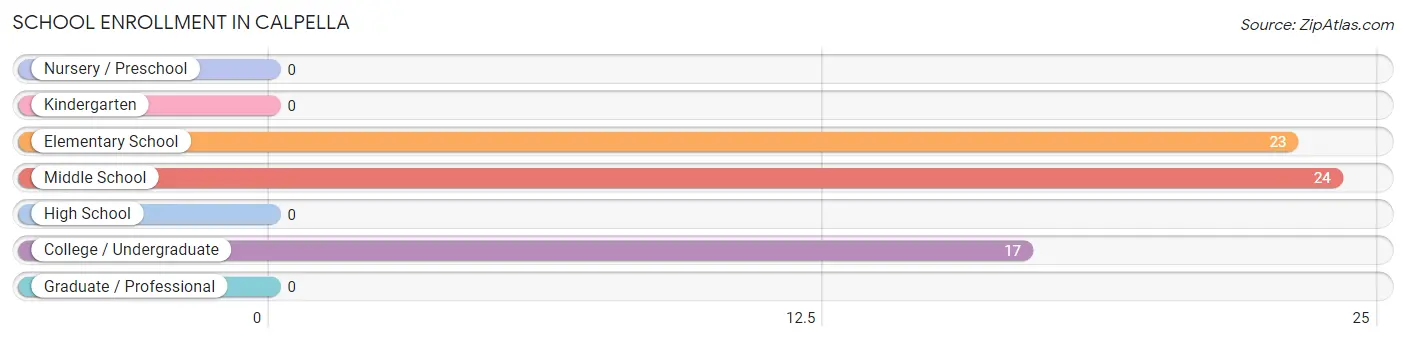
| School Level | # Students | % Students |
| Nursery / Preschool | 0 | 0.0% |
| Kindergarten | 0 | 0.0% |
| Elementary School | 23 | 35.9% |
| Middle School | 24 | 37.5% |
| High School | 0 | 0.0% |
| College / Undergraduate | 17 | 26.6% |
| Graduate / Professional | 0 | 0.0% |
| Total | 64 | 100.0% |
School Enrollment by Age by Funding Source in Calpella
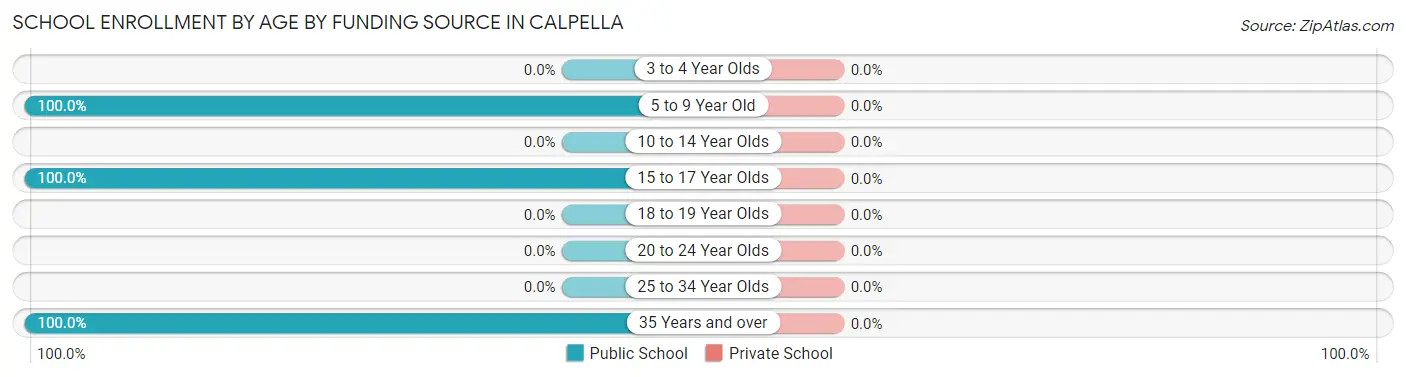
| Age Bracket | Public School | Private School |
| 3 to 4 Year Olds | 0 (0.0%) | 0 (0.0%) |
| 5 to 9 Year Old | 23 (100.0%) | 0 (0.0%) |
| 10 to 14 Year Olds | 0 (0.0%) | 0 (0.0%) |
| 15 to 17 Year Olds | 24 (100.0%) | 0 (0.0%) |
| 18 to 19 Year Olds | 0 (0.0%) | 0 (0.0%) |
| 20 to 24 Year Olds | 0 (0.0%) | 0 (0.0%) |
| 25 to 34 Year Olds | 0 (0.0%) | 0 (0.0%) |
| 35 Years and over | 17 (100.0%) | 0 (0.0%) |
| Total | 64 (100.0%) | 0 (0.0%) |
Educational Attainment by Field of Study in Calpella
Social sciences (54 | 50.5%), literature & languages (22 | 20.6%), business (16 | 14.9%), and arts & humanities (15 | 14.0%) are the most common fields of study among 107 individuals in Calpella who have obtained a bachelor's degree or higher.
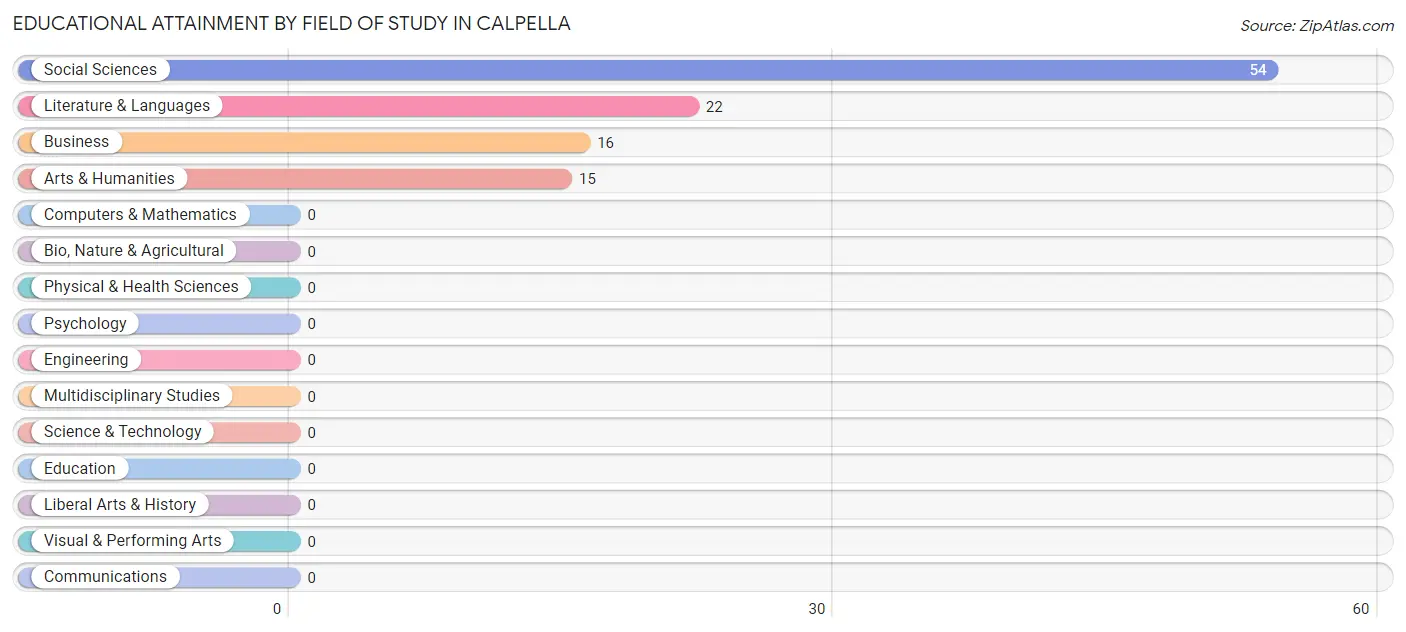
| Field of Study | # Graduates | % Graduates |
| Computers & Mathematics | 0 | 0.0% |
| Bio, Nature & Agricultural | 0 | 0.0% |
| Physical & Health Sciences | 0 | 0.0% |
| Psychology | 0 | 0.0% |
| Social Sciences | 54 | 50.5% |
| Engineering | 0 | 0.0% |
| Multidisciplinary Studies | 0 | 0.0% |
| Science & Technology | 0 | 0.0% |
| Business | 16 | 14.9% |
| Education | 0 | 0.0% |
| Literature & Languages | 22 | 20.6% |
| Liberal Arts & History | 0 | 0.0% |
| Visual & Performing Arts | 0 | 0.0% |
| Communications | 0 | 0.0% |
| Arts & Humanities | 15 | 14.0% |
| Total | 107 | 100.0% |
Transportation & Commute in Calpella
Vehicle Availability by Sex in Calpella
The most prevalent vehicle ownership categories in Calpella are males with 5 or more vehicles (81, accounting for 46.6%) and females with 5 or more vehicles (70, making up 61.4%).
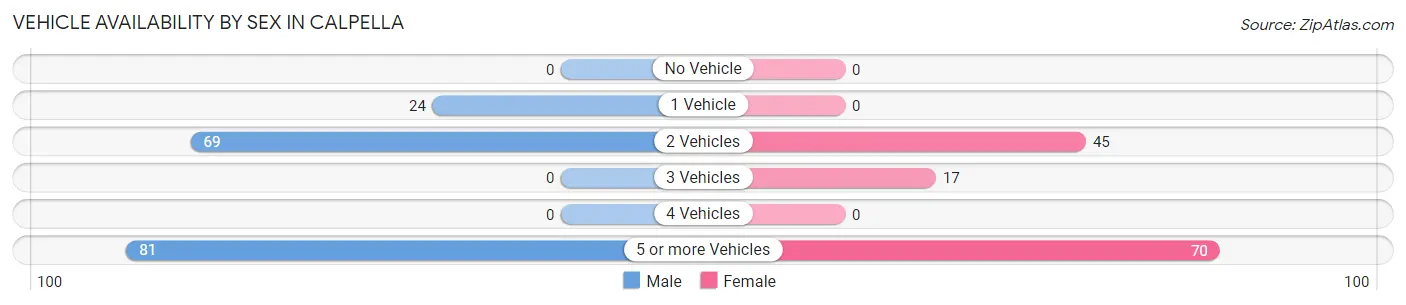
| Vehicles Available | Male | Female |
| No Vehicle | 0 (0.0%) | 0 (0.0%) |
| 1 Vehicle | 24 (13.8%) | 0 (0.0%) |
| 2 Vehicles | 69 (39.7%) | 45 (34.1%) |
| 3 Vehicles | 0 (0.0%) | 17 (12.9%) |
| 4 Vehicles | 0 (0.0%) | 0 (0.0%) |
| 5 or more Vehicles | 81 (46.6%) | 70 (53.0%) |
| Total | 174 (100.0%) | 132 (100.0%) |
Commute Time in Calpella
The most frequently occuring commute durations in Calpella are 60 to 89 minutes (92 commuters, 33.5%), 90 or more minutes (85 commuters, 30.9%), and 10 to 14 minutes (38 commuters, 13.8%).
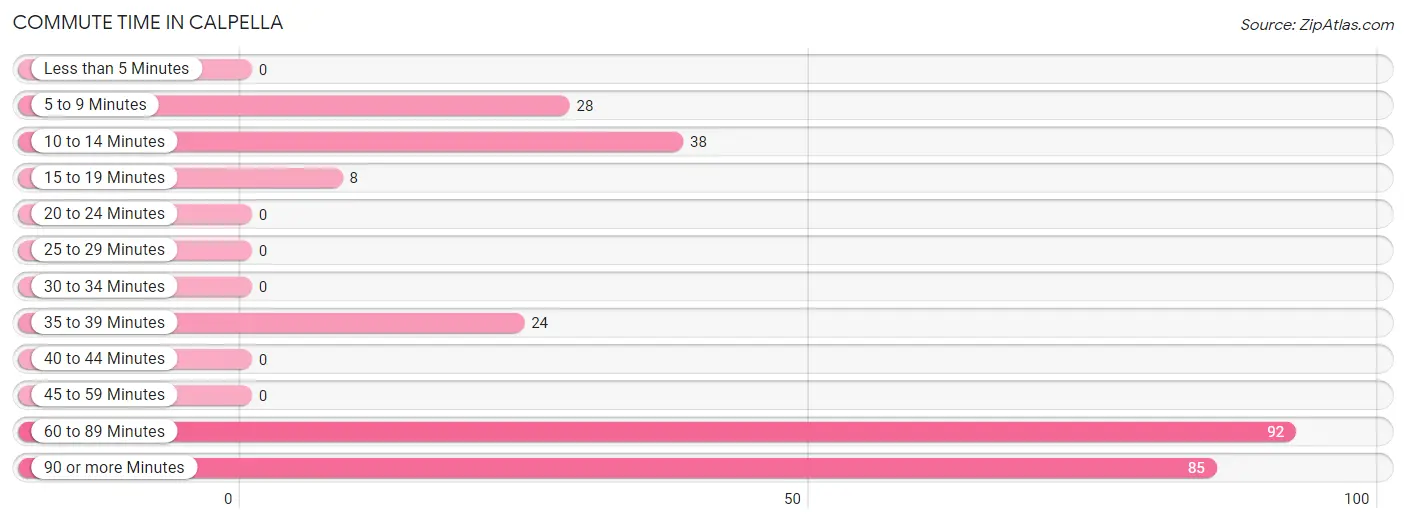
| Commute Time | # Commuters | % Commuters |
| Less than 5 Minutes | 0 | 0.0% |
| 5 to 9 Minutes | 28 | 10.2% |
| 10 to 14 Minutes | 38 | 13.8% |
| 15 to 19 Minutes | 8 | 2.9% |
| 20 to 24 Minutes | 0 | 0.0% |
| 25 to 29 Minutes | 0 | 0.0% |
| 30 to 34 Minutes | 0 | 0.0% |
| 35 to 39 Minutes | 24 | 8.7% |
| 40 to 44 Minutes | 0 | 0.0% |
| 45 to 59 Minutes | 0 | 0.0% |
| 60 to 89 Minutes | 92 | 33.5% |
| 90 or more Minutes | 85 | 30.9% |
Commute Time by Sex in Calpella
The most common commute times in Calpella are 90 or more minutes (85 commuters, 48.8%) for males and 60 to 89 minutes (54 commuters, 53.5%) for females.
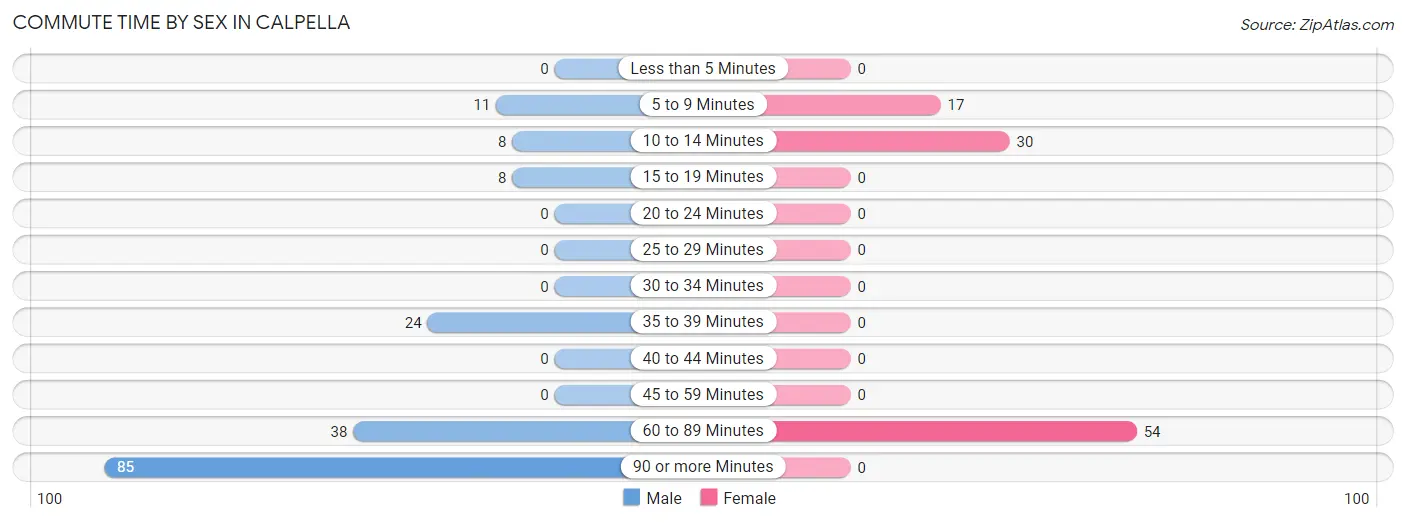
| Commute Time | Male | Female |
| Less than 5 Minutes | 0 (0.0%) | 0 (0.0%) |
| 5 to 9 Minutes | 11 (6.3%) | 17 (16.8%) |
| 10 to 14 Minutes | 8 (4.6%) | 30 (29.7%) |
| 15 to 19 Minutes | 8 (4.6%) | 0 (0.0%) |
| 20 to 24 Minutes | 0 (0.0%) | 0 (0.0%) |
| 25 to 29 Minutes | 0 (0.0%) | 0 (0.0%) |
| 30 to 34 Minutes | 0 (0.0%) | 0 (0.0%) |
| 35 to 39 Minutes | 24 (13.8%) | 0 (0.0%) |
| 40 to 44 Minutes | 0 (0.0%) | 0 (0.0%) |
| 45 to 59 Minutes | 0 (0.0%) | 0 (0.0%) |
| 60 to 89 Minutes | 38 (21.8%) | 54 (53.5%) |
| 90 or more Minutes | 85 (48.8%) | 0 (0.0%) |
Time of Departure to Work by Sex in Calpella
The most frequent times of departure to work in Calpella are 5:00 AM to 5:29 AM (53, 30.5%) for males and 4:00 PM to 11:59 PM (32, 31.7%) for females.
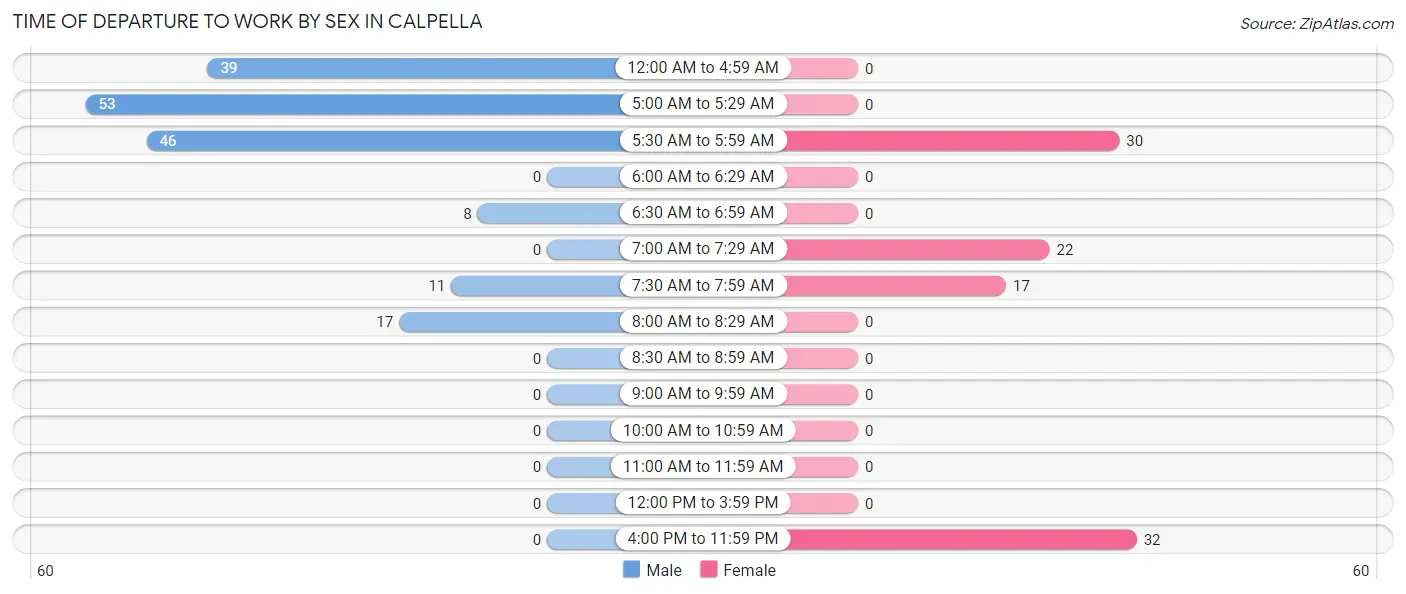
| Time of Departure | Male | Female |
| 12:00 AM to 4:59 AM | 39 (22.4%) | 0 (0.0%) |
| 5:00 AM to 5:29 AM | 53 (30.5%) | 0 (0.0%) |
| 5:30 AM to 5:59 AM | 46 (26.4%) | 30 (29.7%) |
| 6:00 AM to 6:29 AM | 0 (0.0%) | 0 (0.0%) |
| 6:30 AM to 6:59 AM | 8 (4.6%) | 0 (0.0%) |
| 7:00 AM to 7:29 AM | 0 (0.0%) | 22 (21.8%) |
| 7:30 AM to 7:59 AM | 11 (6.3%) | 17 (16.8%) |
| 8:00 AM to 8:29 AM | 17 (9.8%) | 0 (0.0%) |
| 8:30 AM to 8:59 AM | 0 (0.0%) | 0 (0.0%) |
| 9:00 AM to 9:59 AM | 0 (0.0%) | 0 (0.0%) |
| 10:00 AM to 10:59 AM | 0 (0.0%) | 0 (0.0%) |
| 11:00 AM to 11:59 AM | 0 (0.0%) | 0 (0.0%) |
| 12:00 PM to 3:59 PM | 0 (0.0%) | 0 (0.0%) |
| 4:00 PM to 11:59 PM | 0 (0.0%) | 32 (31.7%) |
| Total | 174 (100.0%) | 101 (100.0%) |
Housing Occupancy in Calpella
Occupancy by Ownership in Calpella
Of the total 217 dwellings in Calpella, owner-occupied units account for 180 (83.0%), while renter-occupied units make up 37 (17.1%).
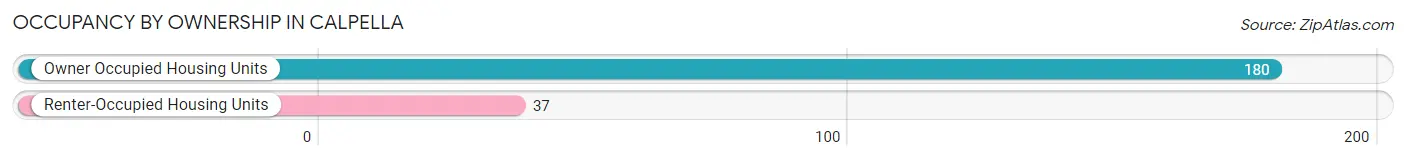
| Occupancy | # Housing Units | % Housing Units |
| Owner Occupied Housing Units | 180 | 83.0% |
| Renter-Occupied Housing Units | 37 | 17.1% |
| Total Occupied Housing Units | 217 | 100.0% |
Occupancy by Household Size in Calpella
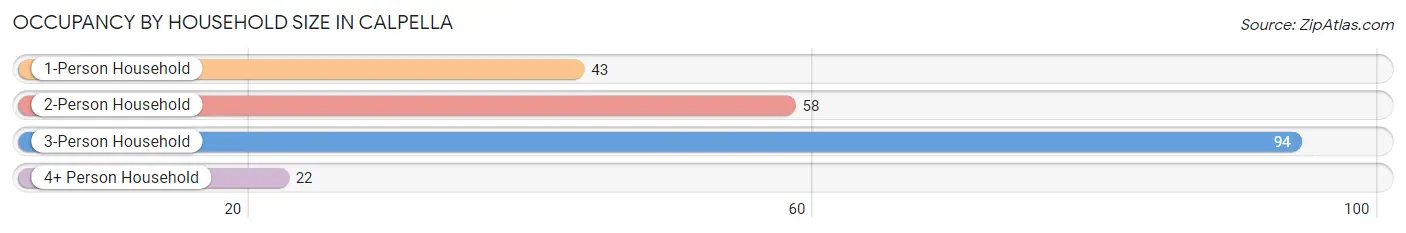
| Household Size | # Housing Units | % Housing Units |
| 1-Person Household | 43 | 19.8% |
| 2-Person Household | 58 | 26.7% |
| 3-Person Household | 94 | 43.3% |
| 4+ Person Household | 22 | 10.1% |
| Total Housing Units | 217 | 100.0% |
Occupancy by Ownership by Household Size in Calpella
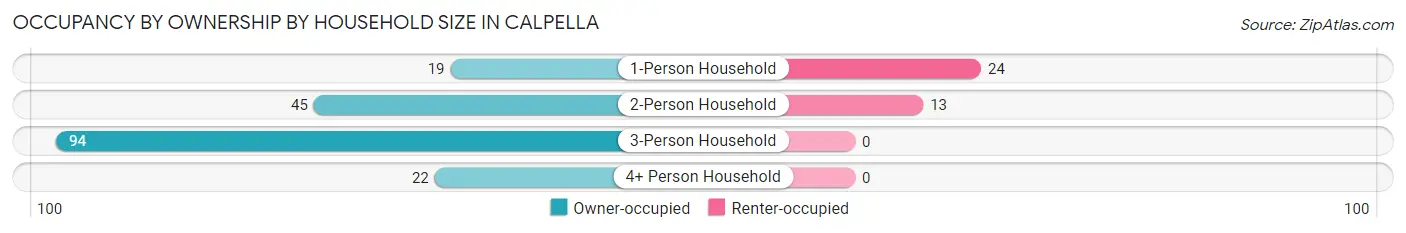
| Household Size | Owner-occupied | Renter-occupied |
| 1-Person Household | 19 (44.2%) | 24 (55.8%) |
| 2-Person Household | 45 (77.6%) | 13 (22.4%) |
| 3-Person Household | 94 (100.0%) | 0 (0.0%) |
| 4+ Person Household | 22 (100.0%) | 0 (0.0%) |
| Total Housing Units | 180 (83.0%) | 37 (17.1%) |
Occupancy by Educational Attainment in Calpella
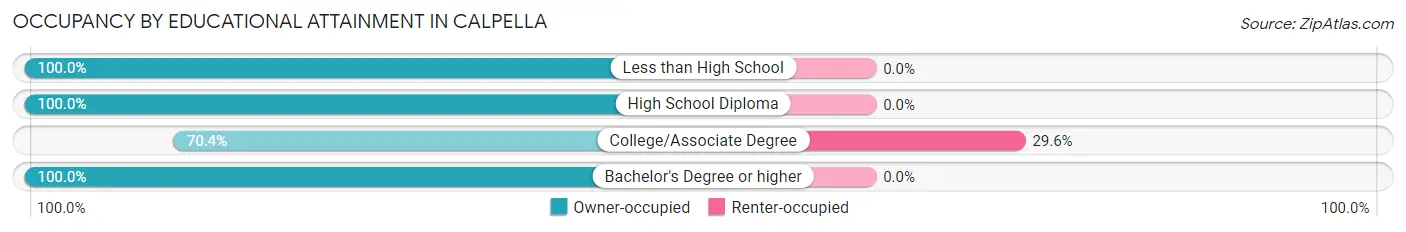
| Household Size | Owner-occupied | Renter-occupied |
| Less than High School | 11 (100.0%) | 0 (0.0%) |
| High School Diploma | 27 (100.0%) | 0 (0.0%) |
| College/Associate Degree | 88 (70.4%) | 37 (29.6%) |
| Bachelor's Degree or higher | 54 (100.0%) | 0 (0.0%) |
Occupancy by Age of Householder in Calpella
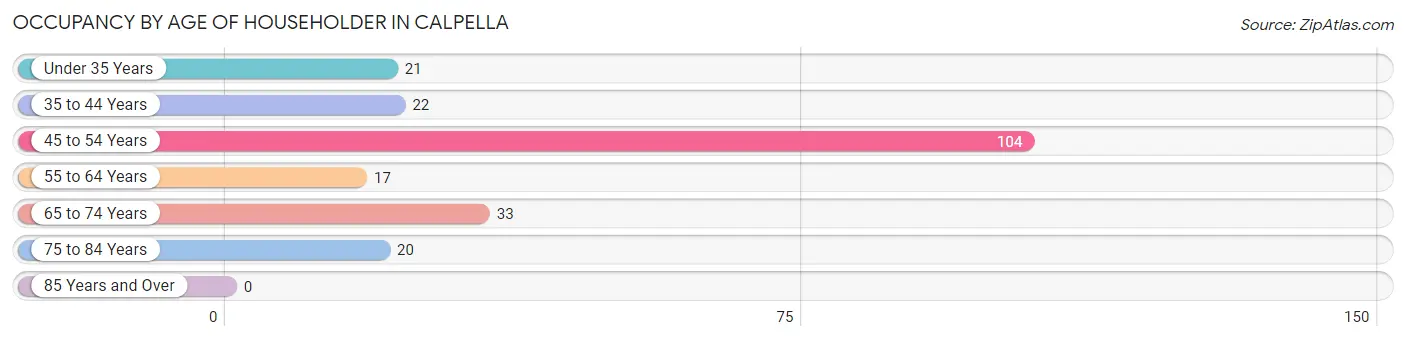
| Age Bracket | # Households | % Households |
| Under 35 Years | 21 | 9.7% |
| 35 to 44 Years | 22 | 10.1% |
| 45 to 54 Years | 104 | 47.9% |
| 55 to 64 Years | 17 | 7.8% |
| 65 to 74 Years | 33 | 15.2% |
| 75 to 84 Years | 20 | 9.2% |
| 85 Years and Over | 0 | 0.0% |
| Total | 217 | 100.0% |
Housing Finances in Calpella
Median Income by Occupancy in Calpella
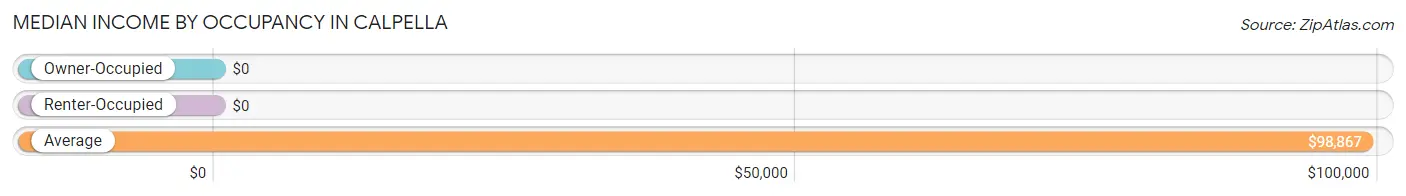
| Occupancy Type | # Households | Median Income |
| Owner-Occupied | 180 (83.0%) | $0 |
| Renter-Occupied | 37 (17.1%) | $0 |
| Average | 217 (100.0%) | $98,867 |
Occupancy by Householder Income Bracket in Calpella
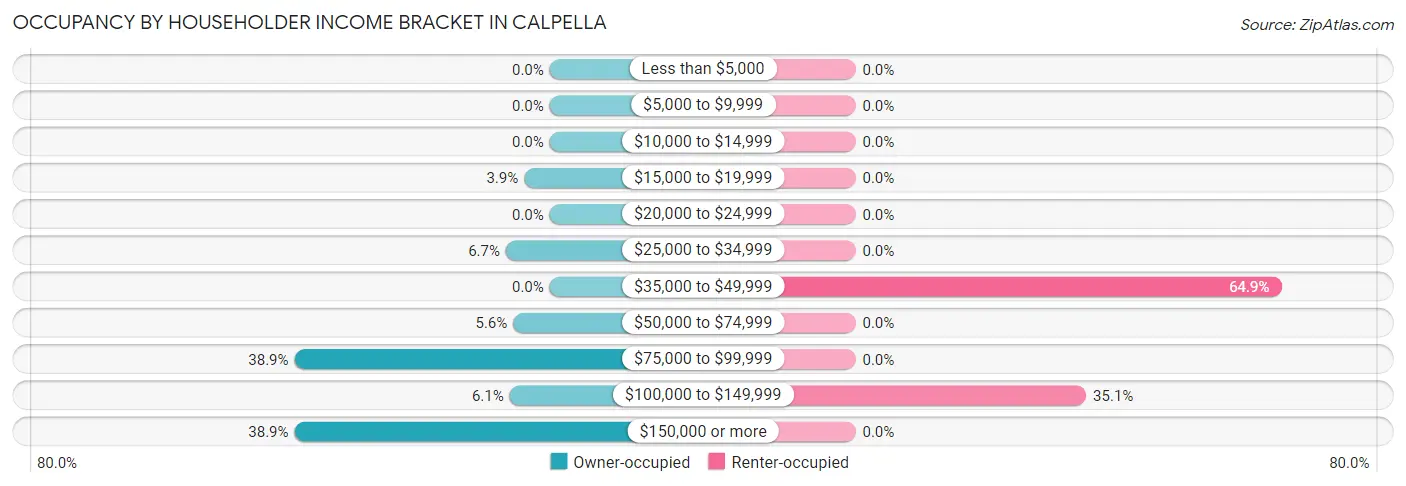
| Income Bracket | Owner-occupied | Renter-occupied |
| Less than $5,000 | 0 (0.0%) | 0 (0.0%) |
| $5,000 to $9,999 | 0 (0.0%) | 0 (0.0%) |
| $10,000 to $14,999 | 0 (0.0%) | 0 (0.0%) |
| $15,000 to $19,999 | 7 (3.9%) | 0 (0.0%) |
| $20,000 to $24,999 | 0 (0.0%) | 0 (0.0%) |
| $25,000 to $34,999 | 12 (6.7%) | 0 (0.0%) |
| $35,000 to $49,999 | 0 (0.0%) | 24 (64.9%) |
| $50,000 to $74,999 | 10 (5.6%) | 0 (0.0%) |
| $75,000 to $99,999 | 70 (38.9%) | 0 (0.0%) |
| $100,000 to $149,999 | 11 (6.1%) | 13 (35.1%) |
| $150,000 or more | 70 (38.9%) | 0 (0.0%) |
| Total | 180 (100.0%) | 37 (100.0%) |
Monthly Housing Cost Tiers in Calpella
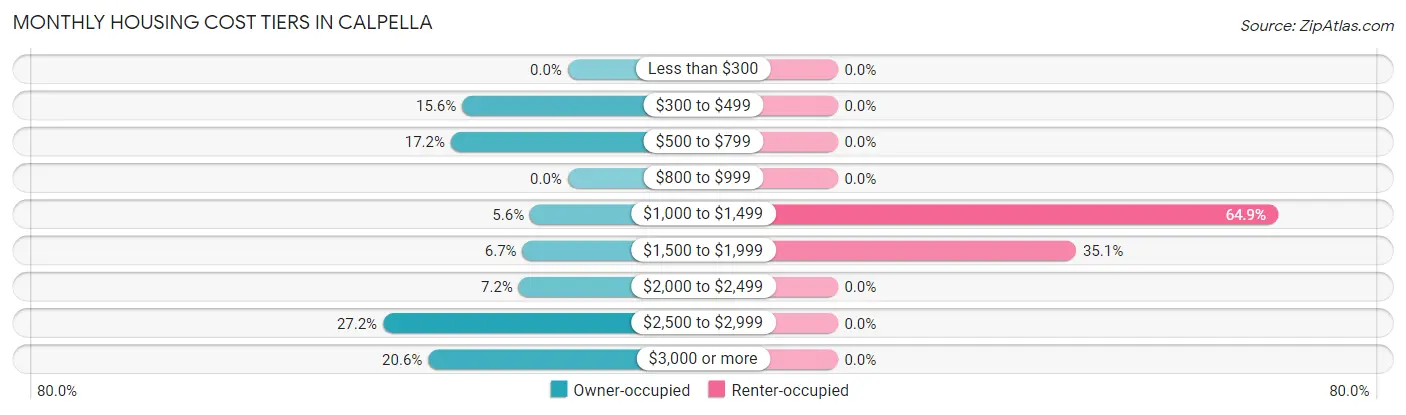
| Monthly Cost | Owner-occupied | Renter-occupied |
| Less than $300 | 0 (0.0%) | 0 (0.0%) |
| $300 to $499 | 28 (15.6%) | 0 (0.0%) |
| $500 to $799 | 31 (17.2%) | 0 (0.0%) |
| $800 to $999 | 0 (0.0%) | 0 (0.0%) |
| $1,000 to $1,499 | 10 (5.6%) | 24 (64.9%) |
| $1,500 to $1,999 | 12 (6.7%) | 13 (35.1%) |
| $2,000 to $2,499 | 13 (7.2%) | 0 (0.0%) |
| $2,500 to $2,999 | 49 (27.2%) | 0 (0.0%) |
| $3,000 or more | 37 (20.6%) | 0 (0.0%) |
| Total | 180 (100.0%) | 37 (100.0%) |
Physical Housing Characteristics in Calpella
Housing Structures in Calpella
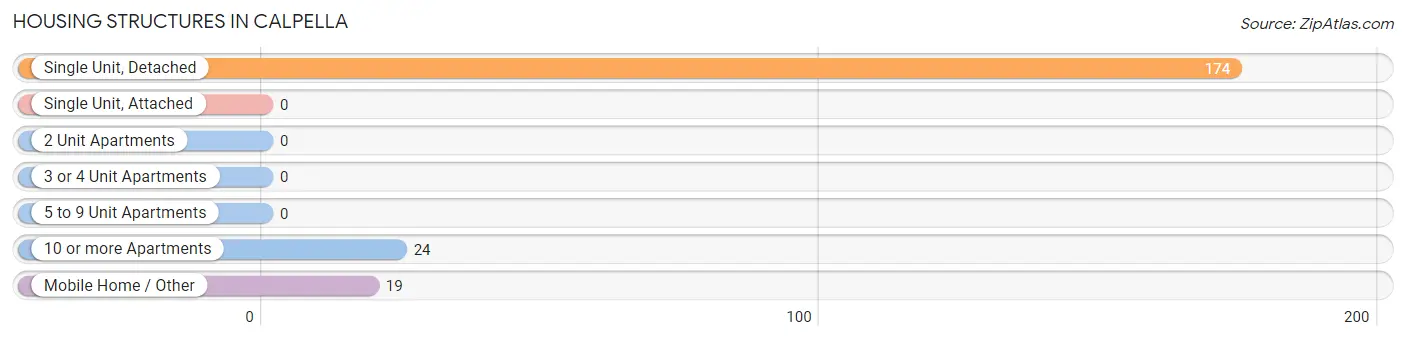
| Structure Type | # Housing Units | % Housing Units |
| Single Unit, Detached | 174 | 80.2% |
| Single Unit, Attached | 0 | 0.0% |
| 2 Unit Apartments | 0 | 0.0% |
| 3 or 4 Unit Apartments | 0 | 0.0% |
| 5 to 9 Unit Apartments | 0 | 0.0% |
| 10 or more Apartments | 24 | 11.1% |
| Mobile Home / Other | 19 | 8.8% |
| Total | 217 | 100.0% |
Housing Structures by Occupancy in Calpella
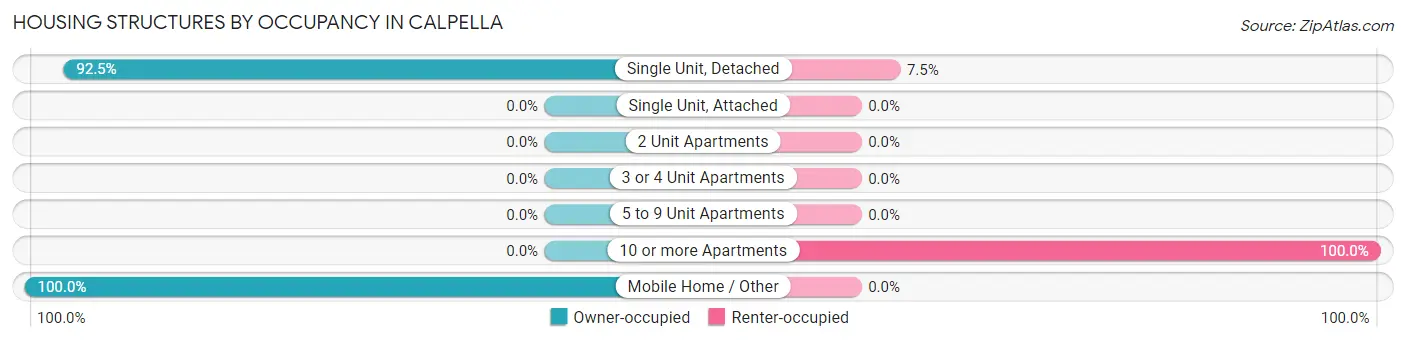
| Structure Type | Owner-occupied | Renter-occupied |
| Single Unit, Detached | 161 (92.5%) | 13 (7.5%) |
| Single Unit, Attached | 0 (0.0%) | 0 (0.0%) |
| 2 Unit Apartments | 0 (0.0%) | 0 (0.0%) |
| 3 or 4 Unit Apartments | 0 (0.0%) | 0 (0.0%) |
| 5 to 9 Unit Apartments | 0 (0.0%) | 0 (0.0%) |
| 10 or more Apartments | 0 (0.0%) | 24 (100.0%) |
| Mobile Home / Other | 19 (100.0%) | 0 (0.0%) |
| Total | 180 (83.0%) | 37 (17.1%) |
Housing Structures by Number of Rooms in Calpella
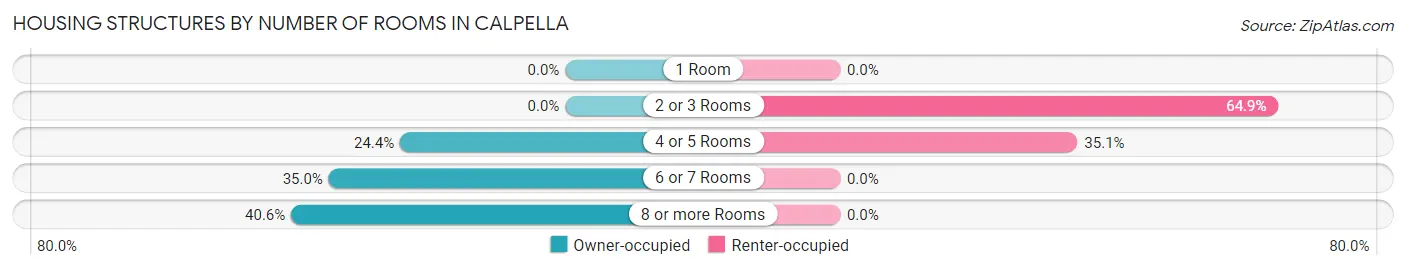
| Number of Rooms | Owner-occupied | Renter-occupied |
| 1 Room | 0 (0.0%) | 0 (0.0%) |
| 2 or 3 Rooms | 0 (0.0%) | 24 (64.9%) |
| 4 or 5 Rooms | 44 (24.4%) | 13 (35.1%) |
| 6 or 7 Rooms | 63 (35.0%) | 0 (0.0%) |
| 8 or more Rooms | 73 (40.6%) | 0 (0.0%) |
| Total | 180 (100.0%) | 37 (100.0%) |
Housing Structure by Heating Type in Calpella
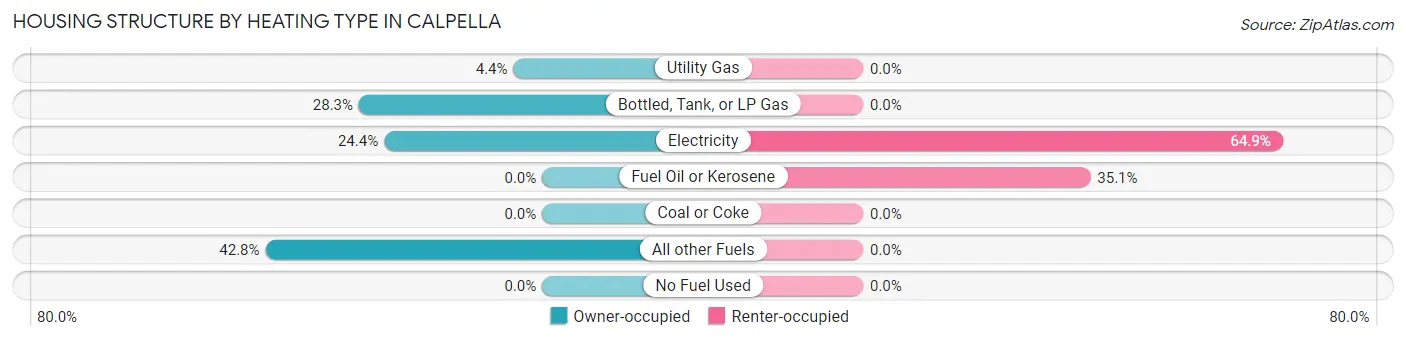
| Heating Type | Owner-occupied | Renter-occupied |
| Utility Gas | 8 (4.4%) | 0 (0.0%) |
| Bottled, Tank, or LP Gas | 51 (28.3%) | 0 (0.0%) |
| Electricity | 44 (24.4%) | 24 (64.9%) |
| Fuel Oil or Kerosene | 0 (0.0%) | 13 (35.1%) |
| Coal or Coke | 0 (0.0%) | 0 (0.0%) |
| All other Fuels | 77 (42.8%) | 0 (0.0%) |
| No Fuel Used | 0 (0.0%) | 0 (0.0%) |
| Total | 180 (100.0%) | 37 (100.0%) |
Household Vehicle Usage in Calpella
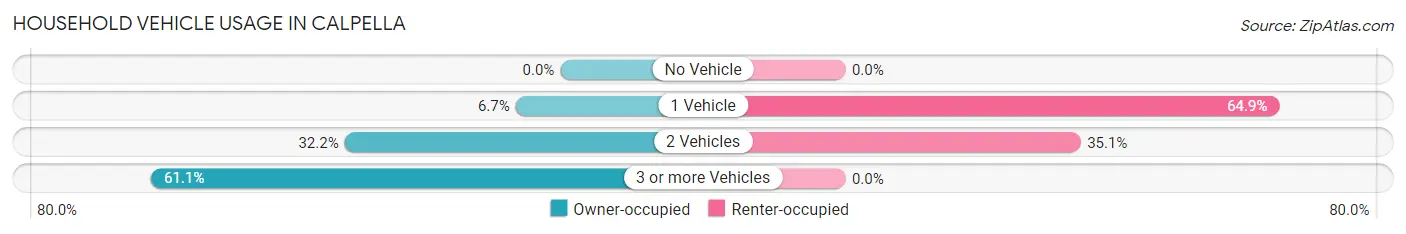
| Vehicles per Household | Owner-occupied | Renter-occupied |
| No Vehicle | 0 (0.0%) | 0 (0.0%) |
| 1 Vehicle | 12 (6.7%) | 24 (64.9%) |
| 2 Vehicles | 58 (32.2%) | 13 (35.1%) |
| 3 or more Vehicles | 110 (61.1%) | 0 (0.0%) |
| Total | 180 (100.0%) | 37 (100.0%) |
Real Estate & Mortgages in Calpella
Real Estate and Mortgage Overview in Calpella
| Characteristic | Without Mortgage | With Mortgage |
| Housing Units | 82 | 98 |
| Median Property Value | $441,900 | $471,000 |
| Median Household Income | - | - |
| Monthly Housing Costs | $642 | $37 |
| Real Estate Taxes | - | - |
Property Value by Mortgage Status in Calpella
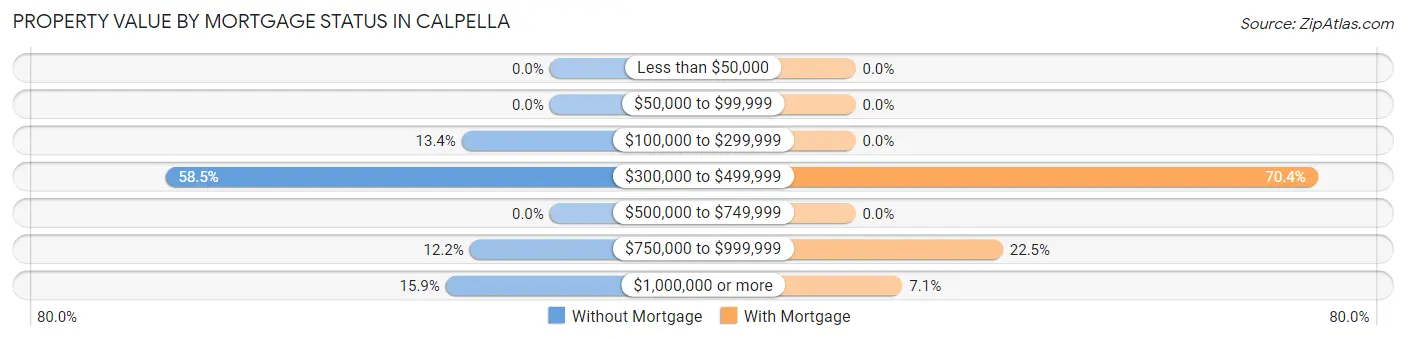
| Property Value | Without Mortgage | With Mortgage |
| Less than $50,000 | 0 (0.0%) | 0 (0.0%) |
| $50,000 to $99,999 | 0 (0.0%) | 0 (0.0%) |
| $100,000 to $299,999 | 11 (13.4%) | 0 (0.0%) |
| $300,000 to $499,999 | 48 (58.5%) | 69 (70.4%) |
| $500,000 to $749,999 | 0 (0.0%) | 0 (0.0%) |
| $750,000 to $999,999 | 10 (12.2%) | 22 (22.5%) |
| $1,000,000 or more | 13 (15.9%) | 7 (7.1%) |
| Total | 82 (100.0%) | 98 (100.0%) |
Household Income by Mortgage Status in Calpella
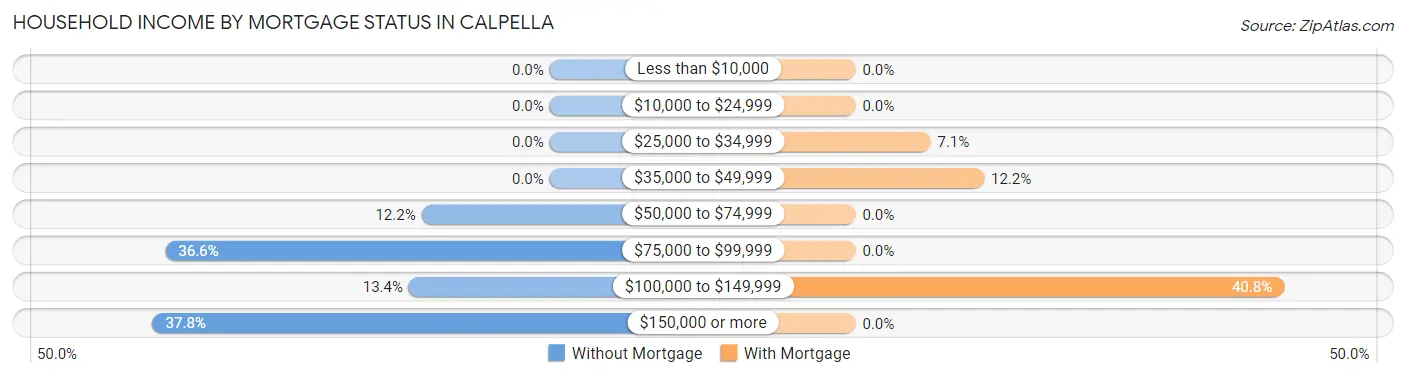
| Household Income | Without Mortgage | With Mortgage |
| Less than $10,000 | 0 (0.0%) | 0 (0.0%) |
| $10,000 to $24,999 | 0 (0.0%) | 0 (0.0%) |
| $25,000 to $34,999 | 0 (0.0%) | 7 (7.1%) |
| $35,000 to $49,999 | 0 (0.0%) | 12 (12.2%) |
| $50,000 to $74,999 | 10 (12.2%) | 0 (0.0%) |
| $75,000 to $99,999 | 30 (36.6%) | 0 (0.0%) |
| $100,000 to $149,999 | 11 (13.4%) | 40 (40.8%) |
| $150,000 or more | 31 (37.8%) | 0 (0.0%) |
| Total | 82 (100.0%) | 98 (100.0%) |
Property Value to Household Income Ratio in Calpella
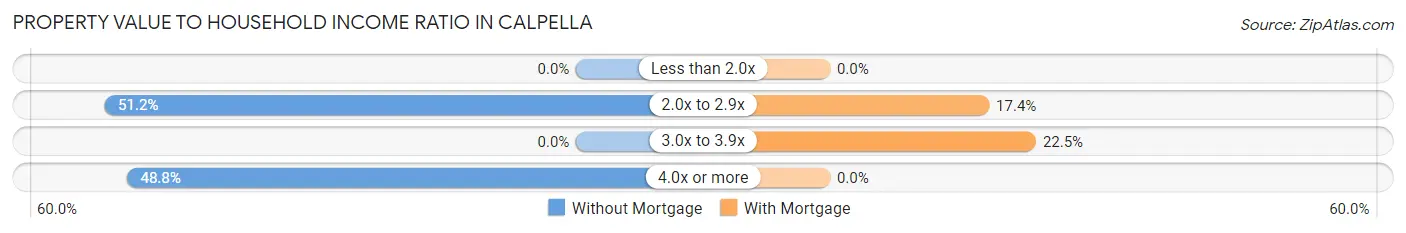
| Value-to-Income Ratio | Without Mortgage | With Mortgage |
| Less than 2.0x | 0 (0.0%) | 0 (0.0%) |
| 2.0x to 2.9x | 42 (51.2%) | 17 (17.3%) |
| 3.0x to 3.9x | 0 (0.0%) | 22 (22.5%) |
| 4.0x or more | 40 (48.8%) | 0 (0.0%) |
| Total | 82 (100.0%) | 98 (100.0%) |
Real Estate Taxes by Mortgage Status in Calpella
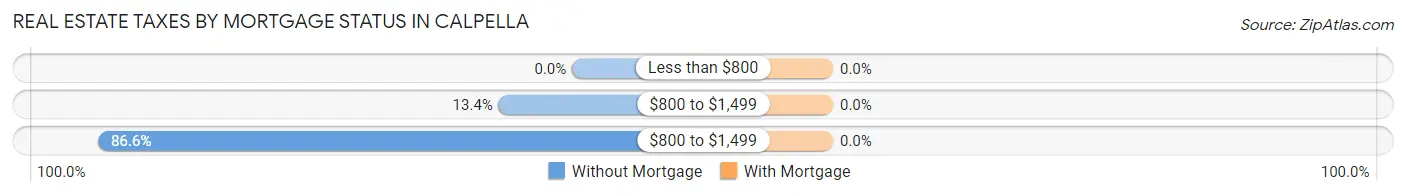
| Property Taxes | Without Mortgage | With Mortgage |
| Less than $800 | 0 (0.0%) | 0 (0.0%) |
| $800 to $1,499 | 11 (13.4%) | 0 (0.0%) |
| $800 to $1,499 | 71 (86.6%) | 0 (0.0%) |
| Total | 82 (100.0%) | 98 (100.0%) |
Health & Disability in Calpella
Health Insurance Coverage by Age in Calpella
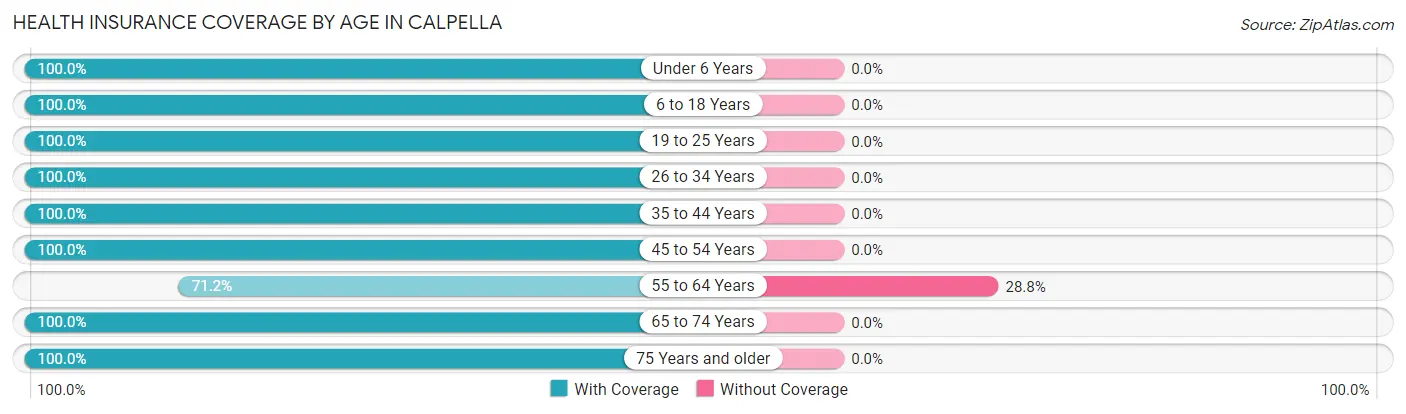
| Age Bracket | With Coverage | Without Coverage |
| Under 6 Years | 24 (100.0%) | 0 (0.0%) |
| 6 to 18 Years | 83 (100.0%) | 0 (0.0%) |
| 19 to 25 Years | 29 (100.0%) | 0 (0.0%) |
| 26 to 34 Years | 36 (100.0%) | 0 (0.0%) |
| 35 to 44 Years | 39 (100.0%) | 0 (0.0%) |
| 45 to 54 Years | 198 (100.0%) | 0 (0.0%) |
| 55 to 64 Years | 52 (71.2%) | 21 (28.8%) |
| 65 to 74 Years | 136 (100.0%) | 0 (0.0%) |
| 75 Years and older | 56 (100.0%) | 0 (0.0%) |
| Total | 653 (96.9%) | 21 (3.1%) |
Health Insurance Coverage by Citizenship Status in Calpella
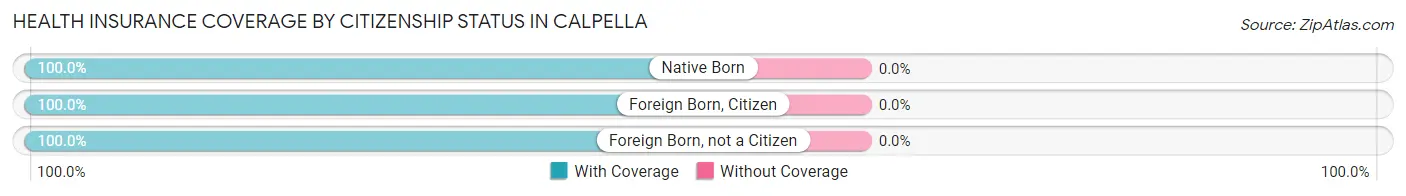
| Citizenship Status | With Coverage | Without Coverage |
| Native Born | 24 (100.0%) | 0 (0.0%) |
| Foreign Born, Citizen | 83 (100.0%) | 0 (0.0%) |
| Foreign Born, not a Citizen | 29 (100.0%) | 0 (0.0%) |
Health Insurance Coverage by Household Income in Calpella
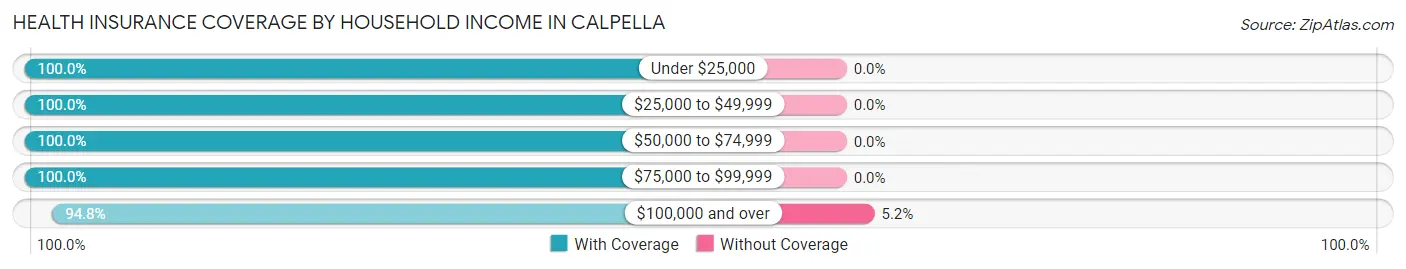
| Household Income | With Coverage | Without Coverage |
| Under $25,000 | 7 (100.0%) | 0 (0.0%) |
| $25,000 to $49,999 | 36 (100.0%) | 0 (0.0%) |
| $50,000 to $74,999 | 37 (100.0%) | 0 (0.0%) |
| $75,000 to $99,999 | 190 (100.0%) | 0 (0.0%) |
| $100,000 and over | 383 (94.8%) | 21 (5.2%) |
Public vs Private Health Insurance Coverage by Age in Calpella
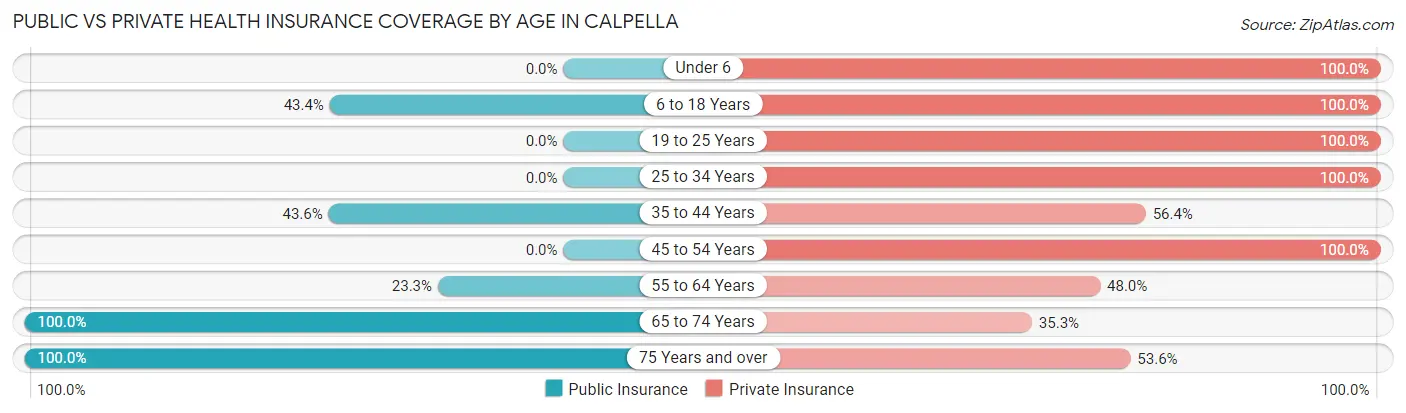
| Age Bracket | Public Insurance | Private Insurance |
| Under 6 | 0 (0.0%) | 24 (100.0%) |
| 6 to 18 Years | 36 (43.4%) | 83 (100.0%) |
| 19 to 25 Years | 0 (0.0%) | 29 (100.0%) |
| 25 to 34 Years | 0 (0.0%) | 36 (100.0%) |
| 35 to 44 Years | 17 (43.6%) | 22 (56.4%) |
| 45 to 54 Years | 0 (0.0%) | 198 (100.0%) |
| 55 to 64 Years | 17 (23.3%) | 35 (47.9%) |
| 65 to 74 Years | 136 (100.0%) | 48 (35.3%) |
| 75 Years and over | 56 (100.0%) | 30 (53.6%) |
| Total | 262 (38.9%) | 505 (74.9%) |
Disability Status by Sex by Age in Calpella
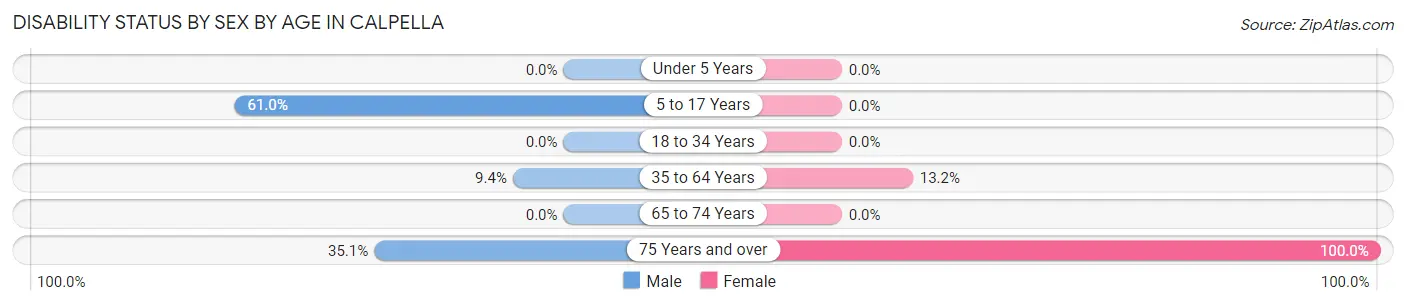
| Age Bracket | Male | Female |
| Under 5 Years | 0 (0.0%) | 0 (0.0%) |
| 5 to 17 Years | 36 (61.0%) | 0 (0.0%) |
| 18 to 34 Years | 0 (0.0%) | 0 (0.0%) |
| 35 to 64 Years | 17 (9.4%) | 17 (13.2%) |
| 65 to 74 Years | 0 (0.0%) | 0 (0.0%) |
| 75 Years and over | 13 (35.1%) | 19 (100.0%) |
Disability Class by Sex by Age in Calpella
Disability Class: Hearing Difficulty
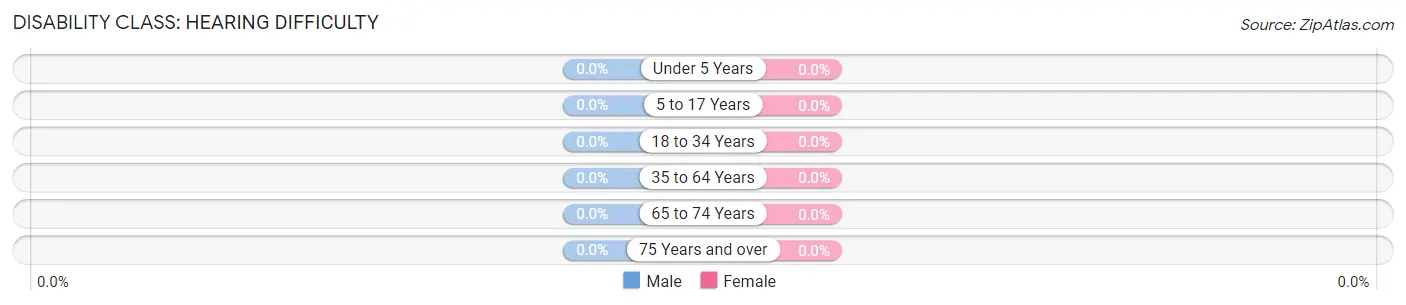
| Age Bracket | Male | Female |
| Under 5 Years | 0 (0.0%) | 0 (0.0%) |
| 5 to 17 Years | 0 (0.0%) | 0 (0.0%) |
| 18 to 34 Years | 0 (0.0%) | 0 (0.0%) |
| 35 to 64 Years | 0 (0.0%) | 0 (0.0%) |
| 65 to 74 Years | 0 (0.0%) | 0 (0.0%) |
| 75 Years and over | 0 (0.0%) | 0 (0.0%) |
Disability Class: Vision Difficulty
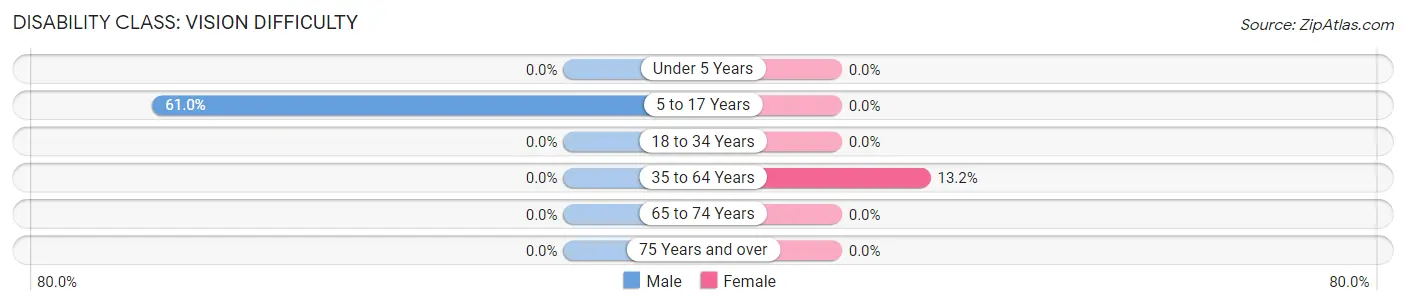
| Age Bracket | Male | Female |
| Under 5 Years | 0 (0.0%) | 0 (0.0%) |
| 5 to 17 Years | 36 (61.0%) | 0 (0.0%) |
| 18 to 34 Years | 0 (0.0%) | 0 (0.0%) |
| 35 to 64 Years | 0 (0.0%) | 17 (13.2%) |
| 65 to 74 Years | 0 (0.0%) | 0 (0.0%) |
| 75 Years and over | 0 (0.0%) | 0 (0.0%) |
Disability Class: Cognitive Difficulty
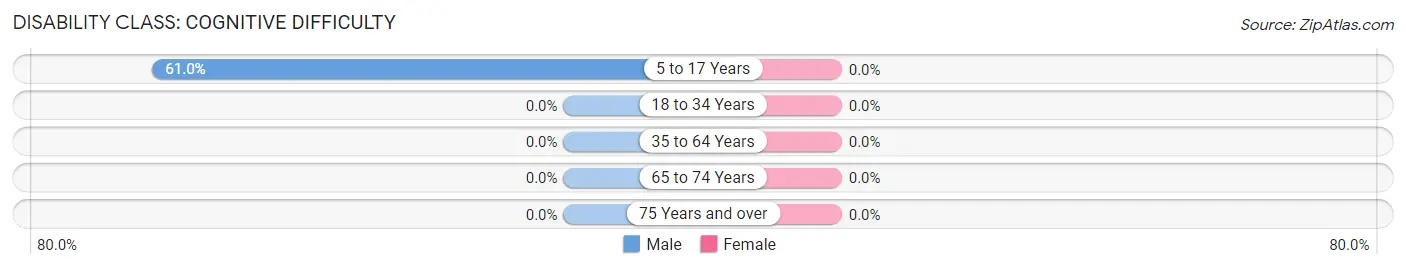
| Age Bracket | Male | Female |
| 5 to 17 Years | 36 (61.0%) | 0 (0.0%) |
| 18 to 34 Years | 0 (0.0%) | 0 (0.0%) |
| 35 to 64 Years | 0 (0.0%) | 0 (0.0%) |
| 65 to 74 Years | 0 (0.0%) | 0 (0.0%) |
| 75 Years and over | 0 (0.0%) | 0 (0.0%) |
Disability Class: Ambulatory Difficulty
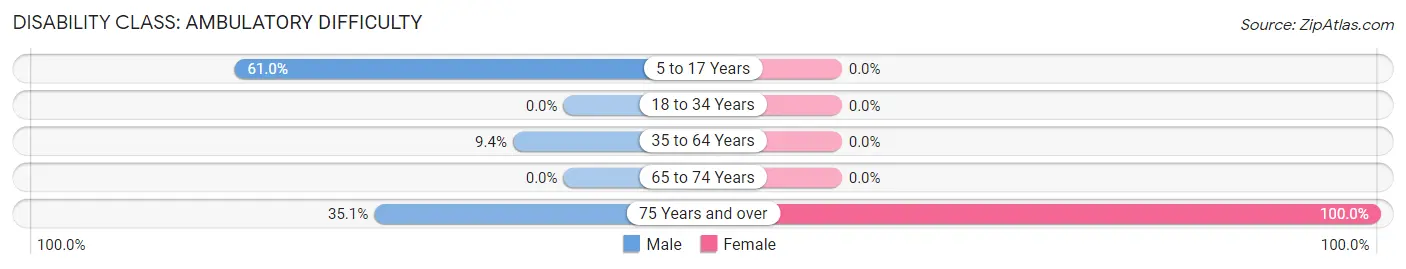
| Age Bracket | Male | Female |
| 5 to 17 Years | 36 (61.0%) | 0 (0.0%) |
| 18 to 34 Years | 0 (0.0%) | 0 (0.0%) |
| 35 to 64 Years | 17 (9.4%) | 0 (0.0%) |
| 65 to 74 Years | 0 (0.0%) | 0 (0.0%) |
| 75 Years and over | 13 (35.1%) | 19 (100.0%) |
Disability Class: Self-Care Difficulty
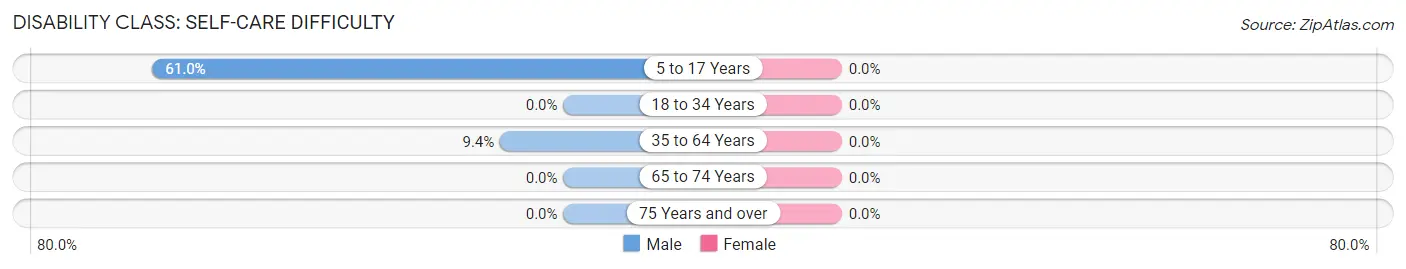
| Age Bracket | Male | Female |
| 5 to 17 Years | 36 (61.0%) | 0 (0.0%) |
| 18 to 34 Years | 0 (0.0%) | 0 (0.0%) |
| 35 to 64 Years | 17 (9.4%) | 0 (0.0%) |
| 65 to 74 Years | 0 (0.0%) | 0 (0.0%) |
| 75 Years and over | 0 (0.0%) | 0 (0.0%) |
Technology Access in Calpella
Computing Device Access in Calpella
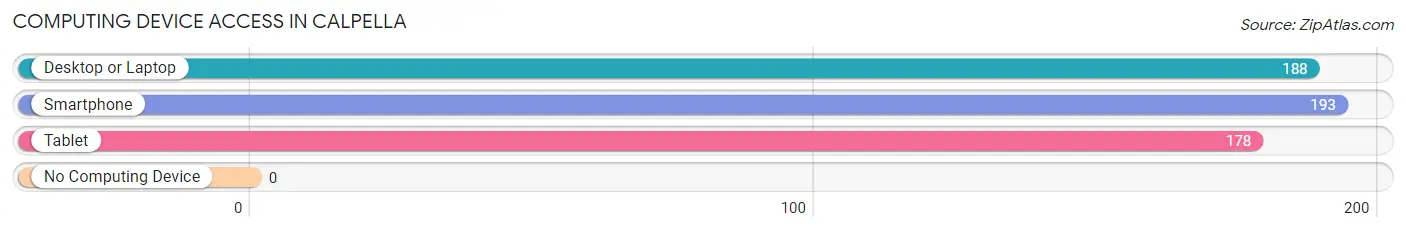
| Device Type | # Households | % Households |
| Desktop or Laptop | 188 | 86.6% |
| Smartphone | 193 | 88.9% |
| Tablet | 178 | 82.0% |
| No Computing Device | 0 | 0.0% |
| Total | 217 | 100.0% |
Internet Access in Calpella
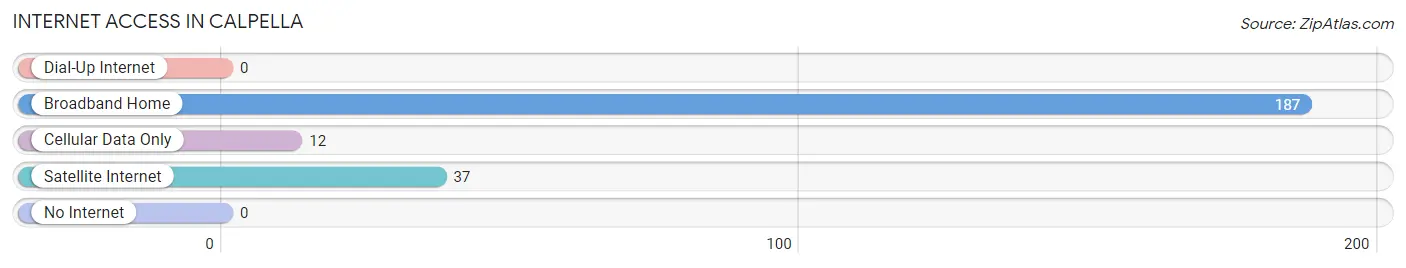
| Internet Type | # Households | % Households |
| Dial-Up Internet | 0 | 0.0% |
| Broadband Home | 187 | 86.2% |
| Cellular Data Only | 12 | 5.5% |
| Satellite Internet | 37 | 17.1% |
| No Internet | 0 | 0.0% |
| Total | 217 | 100.0% |
Calpella Summary
Calpella is a small unincorporated community located in Mendocino County, California. It is situated in the northern part of the county, about 10 miles east of Ukiah and about 20 miles west of Willits. The population of Calpella was estimated to be 1,845 in 2019.
History
Calpella was originally inhabited by the Pomo people, who were the original inhabitants of the area. The first European settlers arrived in the area in the 1850s, and the town was officially founded in 1858. The town was named after the nearby Calpella Creek, which was named after the Spanish word for “hills”.
The town grew slowly over the years, and by the early 1900s, it had become a popular destination for tourists. The town was home to a number of resorts, including the Calpella Hotel, which was built in 1906. The hotel was a popular destination for visitors from San Francisco and other nearby cities.
In the 1920s, the town began to decline as the popularity of the resorts began to wane. The Great Depression also had a negative impact on the town, and by the 1940s, the population had dropped to just over 500.
Geography
Calpella is located in the northern part of Mendocino County, about 10 miles east of Ukiah and about 20 miles west of Willits. The town is situated in a valley surrounded by hills and mountains. The nearby Calpella Creek flows through the town and is a popular destination for fishing and swimming.
The climate in Calpella is mild and temperate, with warm summers and cool winters. The average annual temperature is around 60 degrees Fahrenheit. The average annual precipitation is around 25 inches.
Economy
The economy of Calpella is largely based on agriculture and tourism. The town is home to a number of wineries and vineyards, as well as a number of small businesses. The town is also home to a number of resorts and hotels, which attract visitors from all over the world.
Demographics
As of 2019, the population of Calpella was estimated to be 1,845. The population is largely white (90.2%), with a small percentage of Hispanic or Latino (4.2%) and African American (2.2%) residents. The median household income is $50,945, and the median home value is $323,400. The town has a high rate of homeownership (77.2%).
Common Questions
What is Per Capita Income in Calpella?
Per Capita income in Calpella is $50,906.
What is the Median Household income in Calpella?
Median Household Income in Calpella is $98,867.
What is Income or Wage Gap in Calpella?
Income or Wage Gap in Calpella is 14.7%.
Women in Calpella earn 85.3 cents for every dollar earned by a man.
What is Inequality or Gini Index in Calpella?
Inequality or Gini Index in Calpella is 0.37.
What is the Total Population of Calpella?
Total Population of Calpella is 674.
What is the Total Male Population of Calpella?
Total Male Population of Calpella is 395.
What is the Total Female Population of Calpella?
Total Female Population of Calpella is 279.
What is the Ratio of Males per 100 Females in Calpella?
There are 141.58 Males per 100 Females in Calpella.
What is the Ratio of Females per 100 Males in Calpella?
There are 70.63 Females per 100 Males in Calpella.
What is the Median Population Age in Calpella?
Median Population Age in Calpella is 48.7 Years.
What is the Average Family Size in Calpella
Average Family Size in Calpella is 3.6 People.
What is the Average Household Size in Calpella
Average Household Size in Calpella is 3.1 People.
How Large is the Labor Force in Calpella?
There are 380 People in the Labor Forcein in Calpella.
What is the Percentage of People in the Labor Force in Calpella?
67.0% of People are in the Labor Force in Calpella.