Cities with the Highest Percentage of Population Employed in Health Diagnosing & Treating in Vermont
RELATED REPORTS & OPTIONS
Health Diagnosing & Treating
Vermont
Compare Cities
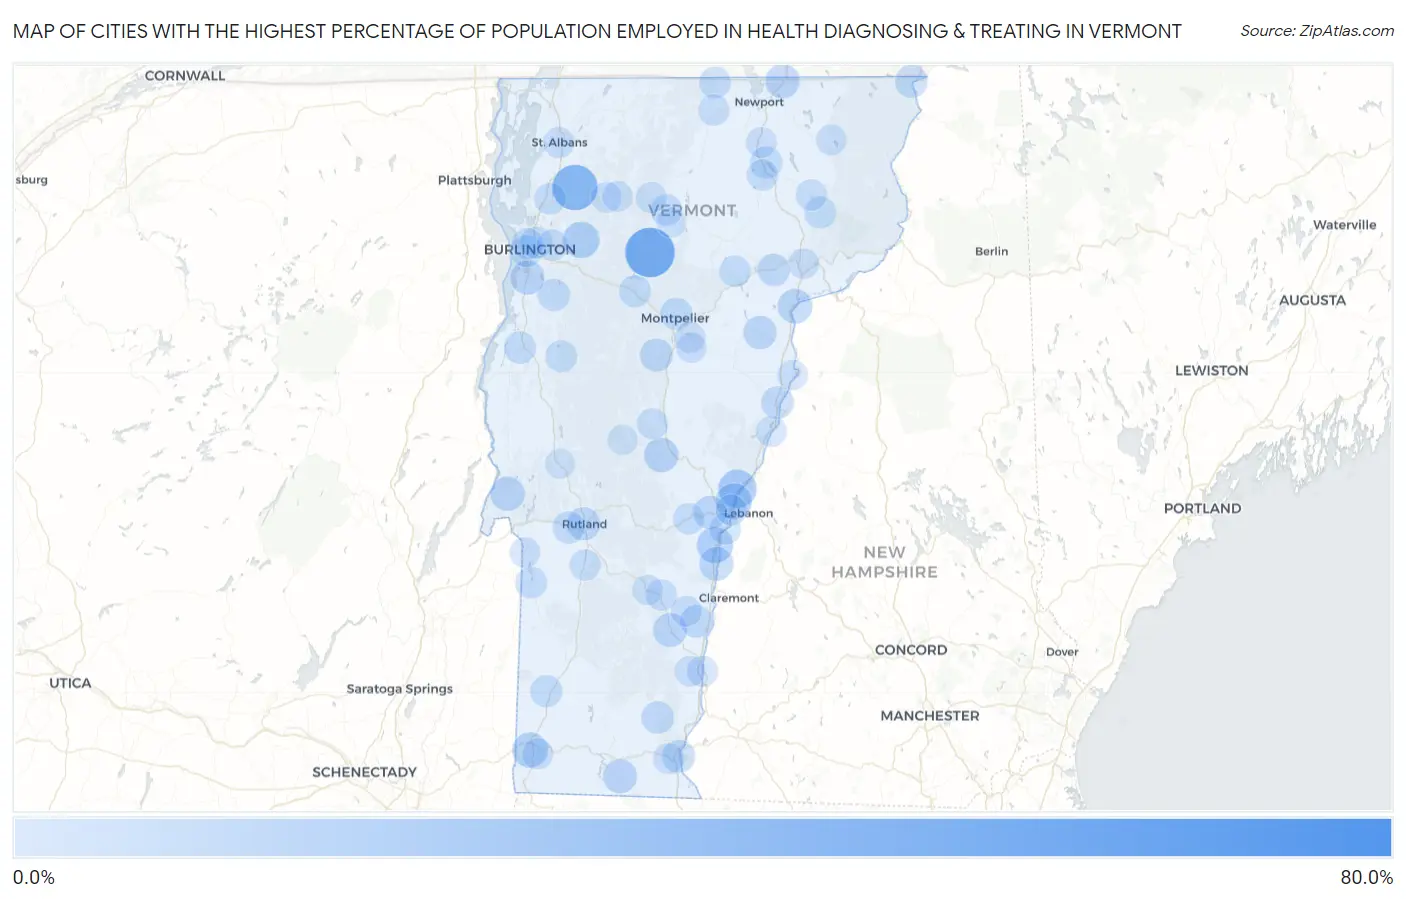
Map of Cities with the Highest Percentage of Population Employed in Health Diagnosing & Treating in Vermont
0.0%
80.0%
Cities with the Highest Percentage of Population Employed in Health Diagnosing & Treating in Vermont
| City | % Employed | vs State | vs National | |
| 1. | Townshend | 67.7% | 6.9%(+60.9)#1 | 6.2%(+61.5)#33 |
| 2. | Stowe | 46.0% | 6.9%(+39.2)#2 | 6.2%(+39.8)#98 |
| 3. | Fairfax | 36.7% | 6.9%(+29.8)#3 | 6.2%(+30.4)#173 |
| 4. | Norwich | 21.0% | 6.9%(+14.1)#4 | 6.2%(+14.8)#664 |
| 5. | South Hero | 20.9% | 6.9%(+14.0)#5 | 6.2%(+14.6)#671 |
| 6. | Lyndon | 18.4% | 6.9%(+11.5)#6 | 6.2%(+12.1)#908 |
| 7. | Jericho | 17.0% | 6.9%(+10.2)#7 | 6.2%(+10.8)#1,079 |
| 8. | Hartland | 16.3% | 6.9%(+9.43)#8 | 6.2%(+10.0)#1,217 |
| 9. | Wilder | 16.1% | 6.9%(+9.23)#9 | 6.2%(+9.84)#1,269 |
| 10. | South Lincoln | 15.0% | 6.9%(+8.10)#10 | 6.2%(+8.71)#1,518 |
| 11. | Old Bennington | 14.5% | 6.9%(+7.60)#11 | 6.2%(+8.21)#1,664 |
| 12. | Bethel | 12.9% | 6.9%(+6.09)#12 | 6.2%(+6.70)#2,218 |
| 13. | Barnet | 12.9% | 6.9%(+6.05)#13 | 6.2%(+6.66)#2,240 |
| 14. | Benson | 12.5% | 6.9%(+5.65)#14 | 6.2%(+6.26)#2,426 |
| 15. | Shelburne | 12.2% | 6.9%(+5.34)#15 | 6.2%(+5.95)#2,577 |
| 16. | Derby Line | 12.0% | 6.9%(+5.17)#16 | 6.2%(+5.78)#2,659 |
| 17. | East Poultney | 12.0% | 6.9%(+5.10)#17 | 6.2%(+5.71)#2,697 |
| 18. | Jacksonville | 11.8% | 6.9%(+4.97)#18 | 6.2%(+5.58)#2,764 |
| 19. | Windsor | 11.5% | 6.9%(+4.65)#19 | 6.2%(+5.26)#2,987 |
| 20. | Harmonyville | 11.5% | 6.9%(+4.61)#20 | 6.2%(+5.22)#3,013 |
| 21. | Chester | 11.2% | 6.9%(+4.36)#21 | 6.2%(+4.97)#3,172 |
| 22. | Quechee | 10.8% | 6.9%(+3.98)#22 | 6.2%(+4.59)#3,448 |
| 23. | Groton | 10.8% | 6.9%(+3.90)#23 | 6.2%(+4.51)#3,509 |
| 24. | Lincoln | 10.6% | 6.9%(+3.71)#24 | 6.2%(+4.32)#3,671 |
| 25. | Huntington | 10.5% | 6.9%(+3.60)#25 | 6.2%(+4.21)#3,772 |
| 26. | Rutland | 10.2% | 6.9%(+3.34)#26 | 6.2%(+3.95)#4,024 |
| 27. | Bolton | 10.0% | 6.9%(+3.15)#27 | 6.2%(+3.76)#4,222 |
| 28. | Northfield | 9.7% | 6.9%(+2.83)#28 | 6.2%(+3.44)#4,557 |
| 29. | Brattleboro | 9.4% | 6.9%(+2.52)#29 | 6.2%(+3.13)#4,912 |
| 30. | Canaan | 9.0% | 6.9%(+2.17)#30 | 6.2%(+2.78)#5,377 |
| 31. | Bradford | 8.8% | 6.9%(+1.96)#31 | 6.2%(+2.57)#5,683 |
| 32. | Springfield | 8.8% | 6.9%(+1.94)#32 | 6.2%(+2.55)#5,708 |
| 33. | Newfane | 8.8% | 6.9%(+1.92)#33 | 6.2%(+2.53)#5,749 |
| 34. | North Pownal | 8.6% | 6.9%(+1.78)#34 | 6.2%(+2.39)#5,949 |
| 35. | Danville | 8.6% | 6.9%(+1.74)#35 | 6.2%(+2.35)#6,022 |
| 36. | Hinesburg | 8.3% | 6.9%(+1.43)#36 | 6.2%(+2.04)#6,511 |
| 37. | Killington | 8.2% | 6.9%(+1.34)#37 | 6.2%(+1.95)#6,647 |
| 38. | Danby | 8.1% | 6.9%(+1.23)#38 | 6.2%(+1.84)#6,850 |
| 39. | Vergennes | 8.0% | 6.9%(+1.17)#39 | 6.2%(+1.78)#6,949 |
| 40. | Barton | 7.9% | 6.9%(+1.10)#40 | 6.2%(+1.70)#7,094 |
| 41. | West Rutland | 7.9% | 6.9%(+1.05)#41 | 6.2%(+1.66)#7,164 |
| 42. | Montpelier | 7.8% | 6.9%(+0.994)#42 | 6.2%(+1.60)#7,283 |
| 43. | Arlington | 7.8% | 6.9%(+0.976)#43 | 6.2%(+1.59)#7,319 |
| 44. | Proctor | 7.6% | 6.9%(+0.722)#44 | 6.2%(+1.33)#7,842 |
| 45. | Waterbury | 7.5% | 6.9%(+0.695)#45 | 6.2%(+1.30)#7,897 |
| 46. | Hartford | 7.5% | 6.9%(+0.693)#46 | 6.2%(+1.30)#7,905 |
| 47. | Bolton Valley | 7.5% | 6.9%(+0.665)#47 | 6.2%(+1.27)#7,968 |
| 48. | Castleton Four Corners | 7.4% | 6.9%(+0.503)#48 | 6.2%(+1.11)#8,345 |
| 49. | South Burlington | 7.3% | 6.9%(+0.451)#49 | 6.2%(+1.06)#8,463 |
| 50. | Bristol | 7.3% | 6.9%(+0.436)#50 | 6.2%(+1.05)#8,498 |
| 51. | East Burke | 7.2% | 6.9%(+0.375)#51 | 6.2%(+0.984)#8,641 |
| 52. | Stamford | 7.2% | 6.9%(+0.349)#52 | 6.2%(+0.959)#8,681 |
| 53. | Winooski | 7.2% | 6.9%(+0.310)#53 | 6.2%(+0.919)#8,769 |
| 54. | North Hartland | 6.8% | 6.9%(-0.048)#54 | 6.2%(+0.561)#9,660 |
| 55. | Pawlet | 6.7% | 6.9%(-0.131)#55 | 6.2%(+0.478)#9,875 |
| 56. | North Troy | 6.7% | 6.9%(-0.138)#56 | 6.2%(+0.472)#9,884 |
| 57. | Wells | 6.7% | 6.9%(-0.158)#57 | 6.2%(+0.452)#9,935 |
| 58. | Burlington | 6.7% | 6.9%(-0.173)#58 | 6.2%(+0.437)#9,968 |
| 59. | Milton | 6.6% | 6.9%(-0.231)#59 | 6.2%(+0.378)#10,126 |
| 60. | Hyde Park | 6.6% | 6.9%(-0.281)#60 | 6.2%(+0.328)#10,262 |
| 61. | Westford | 6.5% | 6.9%(-0.403)#61 | 6.2%(+0.207)#10,589 |
| 62. | Cabot | 6.4% | 6.9%(-0.432)#62 | 6.2%(+0.177)#10,665 |
| 63. | Woodstock | 6.3% | 6.9%(-0.505)#63 | 6.2%(+0.104)#10,839 |
| 64. | Chittenden | 6.2% | 6.9%(-0.669)#64 | 6.2%(-0.059)#11,267 |
| 65. | Glover | 6.2% | 6.9%(-0.700)#65 | 6.2%(-0.091)#11,344 |
| 66. | New Haven | 6.1% | 6.9%(-0.747)#66 | 6.2%(-0.138)#11,471 |
| 67. | Troy | 6.1% | 6.9%(-0.757)#67 | 6.2%(-0.147)#11,490 |
| 68. | West Pawlet | 6.0% | 6.9%(-0.830)#68 | 6.2%(-0.221)#11,679 |
| 69. | West Burke | 5.9% | 6.9%(-0.972)#69 | 6.2%(-0.363)#12,046 |
| 70. | Bennington | 5.9% | 6.9%(-0.977)#70 | 6.2%(-0.367)#12,067 |
| 71. | Essex Junction | 5.8% | 6.9%(-1.02)#71 | 6.2%(-0.412)#12,157 |
| 72. | Proctorsville | 5.8% | 6.9%(-1.03)#72 | 6.2%(-0.420)#12,185 |
| 73. | Wallingford | 5.7% | 6.9%(-1.14)#73 | 6.2%(-0.531)#12,496 |
| 74. | North Clarendon | 5.6% | 6.9%(-1.25)#74 | 6.2%(-0.645)#12,844 |
| 75. | Johnson | 5.5% | 6.9%(-1.31)#75 | 6.2%(-0.705)#13,013 |
| 76. | Bellows Falls | 5.4% | 6.9%(-1.43)#76 | 6.2%(-0.820)#13,327 |
| 77. | Randolph | 5.4% | 6.9%(-1.43)#77 | 6.2%(-0.820)#13,328 |
| 78. | St Albans | 5.4% | 6.9%(-1.43)#78 | 6.2%(-0.821)#13,334 |
| 79. | White River Junction | 5.4% | 6.9%(-1.46)#79 | 6.2%(-0.847)#13,414 |
| 80. | North Springfield | 5.2% | 6.9%(-1.64)#80 | 6.2%(-1.03)#13,965 |
| 81. | West Brattleboro | 5.2% | 6.9%(-1.67)#81 | 6.2%(-1.06)#14,051 |
| 82. | Cambridge | 5.2% | 6.9%(-1.67)#82 | 6.2%(-1.06)#14,061 |
| 83. | Bakersfield | 5.2% | 6.9%(-1.68)#83 | 6.2%(-1.07)#14,096 |
| 84. | Fairlee | 5.2% | 6.9%(-1.68)#84 | 6.2%(-1.07)#14,101 |
| 85. | Orleans | 5.0% | 6.9%(-1.82)#85 | 6.2%(-1.21)#14,514 |
| 86. | Barre | 5.0% | 6.9%(-1.89)#86 | 6.2%(-1.28)#14,709 |
| 87. | Jeffersonville | 4.9% | 6.9%(-1.97)#87 | 6.2%(-1.36)#14,969 |
| 88. | Island Pond | 4.7% | 6.9%(-2.11)#88 | 6.2%(-1.50)#15,385 |
| 89. | St Johnsbury | 4.6% | 6.9%(-2.24)#89 | 6.2%(-1.63)#15,760 |
| 90. | Saxtons River | 4.5% | 6.9%(-2.34)#90 | 6.2%(-1.73)#16,026 |
| 91. | Newbury | 4.3% | 6.9%(-2.53)#91 | 6.2%(-1.92)#16,623 |
| 92. | Huntington Center | 4.3% | 6.9%(-2.55)#92 | 6.2%(-1.94)#16,703 |
| 93. | South Barre | 4.3% | 6.9%(-2.56)#93 | 6.2%(-1.95)#16,720 |
| 94. | Poultney | 4.3% | 6.9%(-2.56)#94 | 6.2%(-1.95)#16,728 |
| 95. | Ludlow | 4.2% | 6.9%(-2.68)#95 | 6.2%(-2.07)#17,078 |
| 96. | Hanksville | 4.2% | 6.9%(-2.69)#96 | 6.2%(-2.08)#17,137 |
| 97. | Middletown Springs | 3.9% | 6.9%(-2.91)#97 | 6.2%(-2.30)#17,745 |
| 98. | Rochester | 3.9% | 6.9%(-2.97)#98 | 6.2%(-2.36)#17,938 |
| 99. | Morrisville | 3.8% | 6.9%(-3.10)#99 | 6.2%(-2.49)#18,296 |
| 100. | Brandon | 3.6% | 6.9%(-3.27)#100 | 6.2%(-2.66)#18,729 |
1
2Common Questions
What are the Top 10 Cities with the Highest Percentage of Population Employed in Health Diagnosing & Treating in Vermont?
Top 10 Cities with the Highest Percentage of Population Employed in Health Diagnosing & Treating in Vermont are:
What city has the Highest Percentage of Population Employed in Health Diagnosing & Treating in Vermont?
Stowe has the Highest Percentage of Population Employed in Health Diagnosing & Treating in Vermont with 46.0%.
What is the Percentage of Population Employed in Health Diagnosing & Treating in the State of Vermont?
Percentage of Population Employed in Health Diagnosing & Treating in Vermont is 6.9%.
What is the Percentage of Population Employed in Health Diagnosing & Treating in the United States?
Percentage of Population Employed in Health Diagnosing & Treating in the United States is 6.2%.