Cities with the Highest Percentage of Population Employed in Health Diagnosing & Treating in Washington
RELATED REPORTS & OPTIONS
Health Diagnosing & Treating
Washington
Compare Cities
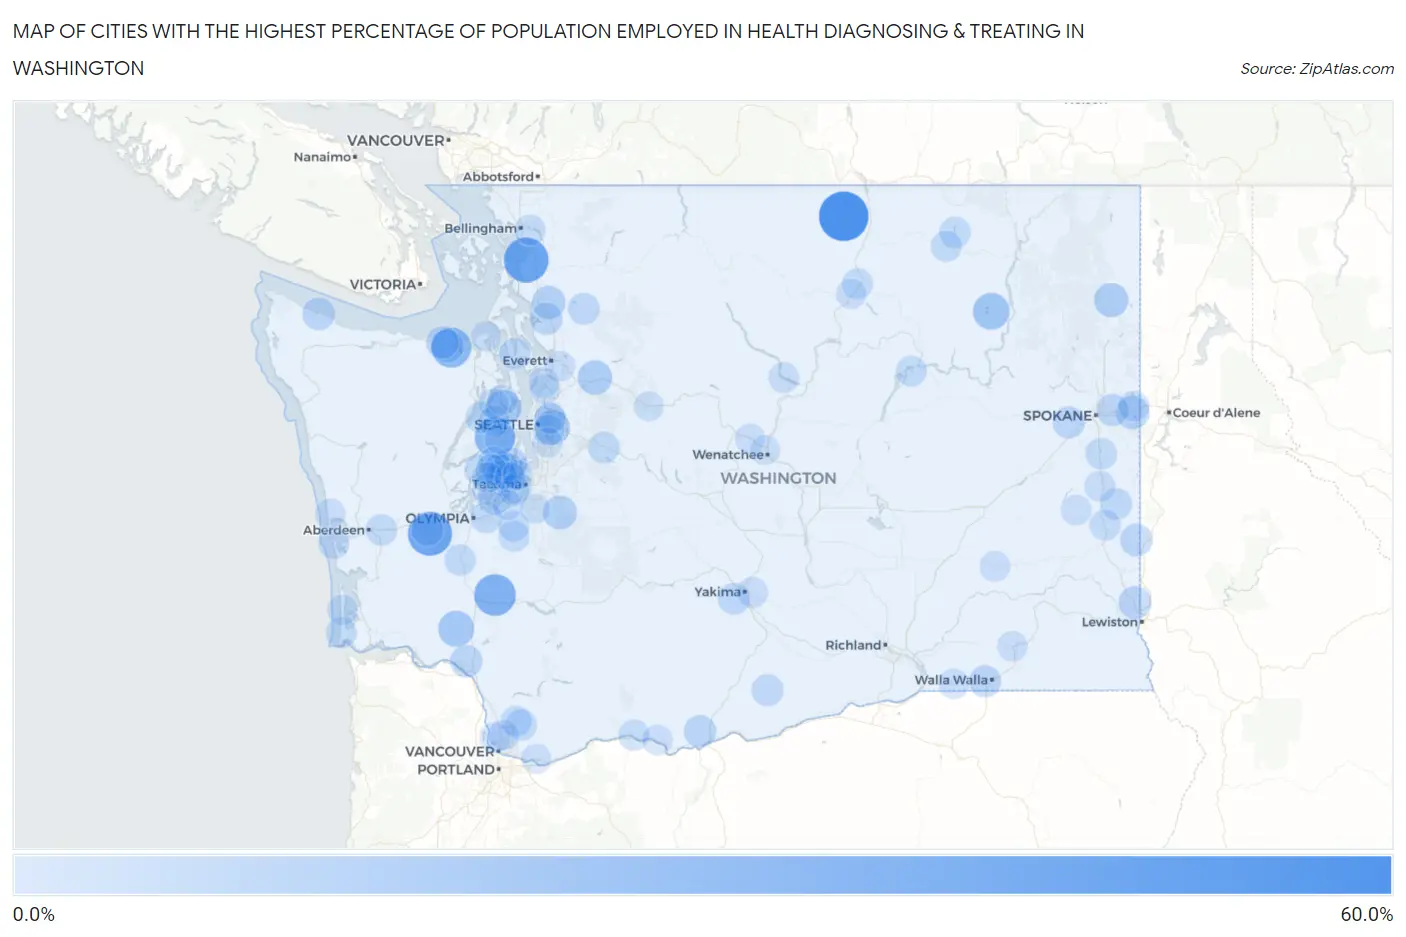
Map of Cities with the Highest Percentage of Population Employed in Health Diagnosing & Treating in Washington
0.0%
60.0%
Cities with the Highest Percentage of Population Employed in Health Diagnosing & Treating in Washington
| City | % Employed | vs State | vs National | |
| 1. | Loomis | 55.6% | 5.6%(+50.0)#1 | 6.2%(+49.3)#54 |
| 2. | Edison | 43.5% | 5.6%(+37.9)#2 | 6.2%(+37.2)#115 |
| 3. | Porter | 42.0% | 5.6%(+36.4)#3 | 6.2%(+35.8)#129 |
| 4. | Onalaska | 35.6% | 5.6%(+30.0)#4 | 6.2%(+29.3)#193 |
| 5. | Gorst | 32.8% | 5.6%(+27.2)#5 | 6.2%(+26.5)#247 |
| 6. | Pataha | 32.5% | 5.6%(+26.9)#6 | 6.2%(+26.3)#254 |
| 7. | Bell Hill | 32.0% | 5.6%(+26.4)#7 | 6.2%(+25.8)#266 |
| 8. | Twin Lakes | 23.5% | 5.6%(+18.0)#8 | 6.2%(+17.3)#519 |
| 9. | Sunland Estates | 22.7% | 5.6%(+17.2)#9 | 6.2%(+16.5)#565 |
| 10. | Ryderwood | 22.0% | 5.6%(+16.5)#10 | 6.2%(+15.8)#601 |
| 11. | Keyport | 21.2% | 5.6%(+15.6)#11 | 6.2%(+14.9)#646 |
| 12. | Beaux Arts Village | 19.6% | 5.6%(+14.0)#12 | 6.2%(+13.3)#791 |
| 13. | North Sultan | 18.5% | 5.6%(+12.9)#13 | 6.2%(+12.2)#900 |
| 14. | Cusick | 18.2% | 5.6%(+12.6)#14 | 6.2%(+11.9)#933 |
| 15. | Crocker | 17.3% | 5.6%(+11.7)#15 | 6.2%(+11.0)#1,037 |
| 16. | Lake Mcmurray | 15.9% | 5.6%(+10.4)#16 | 6.2%(+9.66)#1,298 |
| 17. | Gig Harbor | 15.9% | 5.6%(+10.3)#17 | 6.2%(+9.63)#1,309 |
| 18. | Liberty Lake | 15.5% | 5.6%(+9.97)#18 | 6.2%(+9.28)#1,389 |
| 19. | Uniontown | 14.9% | 5.6%(+9.33)#19 | 6.2%(+8.64)#1,535 |
| 20. | River Road | 14.5% | 5.6%(+8.99)#20 | 6.2%(+8.29)#1,638 |
| 21. | Maplewood | 14.2% | 5.6%(+8.64)#21 | 6.2%(+7.94)#1,750 |
| 22. | Palouse | 14.1% | 5.6%(+8.59)#22 | 6.2%(+7.90)#1,762 |
| 23. | Clallam Bay | 14.1% | 5.6%(+8.54)#23 | 6.2%(+7.85)#1,781 |
| 24. | Carlsborg | 13.9% | 5.6%(+8.35)#24 | 6.2%(+7.66)#1,827 |
| 25. | Raft Island | 13.8% | 5.6%(+8.28)#25 | 6.2%(+7.59)#1,854 |
| 26. | Sunday Lake | 13.6% | 5.6%(+8.03)#26 | 6.2%(+7.34)#1,950 |
| 27. | Longview Heights | 13.5% | 5.6%(+7.96)#27 | 6.2%(+7.27)#1,978 |
| 28. | Centerville | 13.4% | 5.6%(+7.88)#28 | 6.2%(+7.19)#2,016 |
| 29. | Millwood | 13.2% | 5.6%(+7.64)#29 | 6.2%(+6.95)#2,107 |
| 30. | Fairchild Afb | 13.0% | 5.6%(+7.48)#30 | 6.2%(+6.79)#2,171 |
| 31. | Malone | 12.8% | 5.6%(+7.28)#31 | 6.2%(+6.59)#2,269 |
| 32. | Garrett | 12.8% | 5.6%(+7.24)#32 | 6.2%(+6.54)#2,293 |
| 33. | Anderson Island | 12.5% | 5.6%(+6.97)#33 | 6.2%(+6.28)#2,408 |
| 34. | Bickleton | 12.5% | 5.6%(+6.95)#34 | 6.2%(+6.26)#2,441 |
| 35. | Rosedale | 12.5% | 5.6%(+6.92)#35 | 6.2%(+6.23)#2,454 |
| 36. | Oso | 12.1% | 5.6%(+6.57)#36 | 6.2%(+5.88)#2,616 |
| 37. | Ahtanum | 12.1% | 5.6%(+6.56)#37 | 6.2%(+5.87)#2,627 |
| 38. | Oakesdale | 11.9% | 5.6%(+6.32)#38 | 6.2%(+5.63)#2,734 |
| 39. | Artondale | 11.8% | 5.6%(+6.28)#39 | 6.2%(+5.59)#2,757 |
| 40. | Spangle | 11.7% | 5.6%(+6.17)#40 | 6.2%(+5.48)#2,815 |
| 41. | Seabeck | 11.7% | 5.6%(+6.12)#41 | 6.2%(+5.43)#2,852 |
| 42. | Stansberry Lake | 11.7% | 5.6%(+6.11)#42 | 6.2%(+5.42)#2,862 |
| 43. | Riverbend | 11.6% | 5.6%(+6.02)#43 | 6.2%(+5.33)#2,934 |
| 44. | Curlew Lake | 11.5% | 5.6%(+5.98)#44 | 6.2%(+5.29)#2,947 |
| 45. | Grapeview | 11.5% | 5.6%(+5.90)#45 | 6.2%(+5.21)#3,018 |
| 46. | Key Center | 11.4% | 5.6%(+5.89)#46 | 6.2%(+5.20)#3,026 |
| 47. | Tanglewilde | 11.4% | 5.6%(+5.80)#47 | 6.2%(+5.11)#3,089 |
| 48. | Venersborg | 11.3% | 5.6%(+5.78)#48 | 6.2%(+5.09)#3,105 |
| 49. | Grand Mound | 11.3% | 5.6%(+5.74)#49 | 6.2%(+5.04)#3,128 |
| 50. | Central Park | 11.3% | 5.6%(+5.72)#50 | 6.2%(+5.03)#3,139 |
| 51. | Freeland | 11.1% | 5.6%(+5.56)#51 | 6.2%(+4.87)#3,244 |
| 52. | Mckenna | 10.7% | 5.6%(+5.11)#52 | 6.2%(+4.42)#3,586 |
| 53. | Fircrest | 10.6% | 5.6%(+5.07)#53 | 6.2%(+4.38)#3,611 |
| 54. | Long Beach | 10.6% | 5.6%(+5.03)#54 | 6.2%(+4.34)#3,657 |
| 55. | Roy | 10.6% | 5.6%(+5.02)#55 | 6.2%(+4.32)#3,669 |
| 56. | Yarrow Point | 10.5% | 5.6%(+4.96)#56 | 6.2%(+4.26)#3,734 |
| 57. | White Salmon | 10.5% | 5.6%(+4.93)#57 | 6.2%(+4.24)#3,753 |
| 58. | Steptoe | 10.4% | 5.6%(+4.86)#58 | 6.2%(+4.17)#3,810 |
| 59. | University Place | 10.4% | 5.6%(+4.85)#59 | 6.2%(+4.16)#3,818 |
| 60. | Electric City | 10.4% | 5.6%(+4.82)#60 | 6.2%(+4.13)#3,841 |
| 61. | Lewisville | 10.4% | 5.6%(+4.81)#61 | 6.2%(+4.12)#3,852 |
| 62. | Omak | 10.4% | 5.6%(+4.80)#62 | 6.2%(+4.11)#3,859 |
| 63. | Republic | 10.3% | 5.6%(+4.73)#63 | 6.2%(+4.04)#3,928 |
| 64. | Chico | 10.3% | 5.6%(+4.71)#64 | 6.2%(+4.02)#3,949 |
| 65. | Felida | 10.2% | 5.6%(+4.64)#65 | 6.2%(+3.95)#4,023 |
| 66. | Manson | 10.2% | 5.6%(+4.63)#66 | 6.2%(+3.94)#4,031 |
| 67. | Terrace Heights | 10.2% | 5.6%(+4.61)#67 | 6.2%(+3.92)#4,059 |
| 68. | Rosalia | 10.1% | 5.6%(+4.56)#68 | 6.2%(+3.87)#4,096 |
| 69. | Clyde Hill | 10.0% | 5.6%(+4.46)#69 | 6.2%(+3.77)#4,182 |
| 70. | Longbranch | 10.0% | 5.6%(+4.46)#70 | 6.2%(+3.77)#4,185 |
| 71. | Otis Orchards East Farms | 9.9% | 5.6%(+4.39)#71 | 6.2%(+3.70)#4,270 |
| 72. | Home | 9.9% | 5.6%(+4.32)#72 | 6.2%(+3.63)#4,352 |
| 73. | Geneva | 9.8% | 5.6%(+4.26)#73 | 6.2%(+3.57)#4,413 |
| 74. | Westport | 9.8% | 5.6%(+4.24)#74 | 6.2%(+3.55)#4,436 |
| 75. | Mercer Island | 9.7% | 5.6%(+4.13)#75 | 6.2%(+3.44)#4,548 |
| 76. | Wollochet | 9.6% | 5.6%(+4.00)#76 | 6.2%(+3.31)#4,700 |
| 77. | Ocean Park | 9.5% | 5.6%(+3.91)#77 | 6.2%(+3.22)#4,803 |
| 78. | Fobes Hill | 9.4% | 5.6%(+3.89)#78 | 6.2%(+3.20)#4,831 |
| 79. | St John | 9.4% | 5.6%(+3.80)#79 | 6.2%(+3.11)#4,951 |
| 80. | Mount Vista | 9.3% | 5.6%(+3.78)#80 | 6.2%(+3.09)#4,998 |
| 81. | Washtucna | 9.3% | 5.6%(+3.75)#81 | 6.2%(+3.06)#5,033 |
| 82. | Touchet | 9.2% | 5.6%(+3.66)#82 | 6.2%(+2.97)#5,117 |
| 83. | Waitsburg | 9.1% | 5.6%(+3.58)#83 | 6.2%(+2.89)#5,208 |
| 84. | Port Orchard | 9.0% | 5.6%(+3.49)#84 | 6.2%(+2.79)#5,360 |
| 85. | Lyle | 9.0% | 5.6%(+3.43)#85 | 6.2%(+2.74)#5,448 |
| 86. | Cashmere | 9.0% | 5.6%(+3.43)#86 | 6.2%(+2.74)#5,456 |
| 87. | North Lynnwood | 9.0% | 5.6%(+3.42)#87 | 6.2%(+2.73)#5,466 |
| 88. | Okanogan | 8.9% | 5.6%(+3.39)#88 | 6.2%(+2.70)#5,500 |
| 89. | Bryn Mawr Skyway | 8.8% | 5.6%(+3.20)#89 | 6.2%(+2.51)#5,768 |
| 90. | Ocean City | 8.7% | 5.6%(+3.14)#90 | 6.2%(+2.45)#5,864 |
| 91. | Alderwood Manor | 8.6% | 5.6%(+3.08)#91 | 6.2%(+2.39)#5,951 |
| 92. | Washougal | 8.6% | 5.6%(+3.08)#92 | 6.2%(+2.39)#5,955 |
| 93. | Port Townsend | 8.6% | 5.6%(+3.04)#93 | 6.2%(+2.34)#6,027 |
| 94. | Poulsbo | 8.5% | 5.6%(+2.96)#94 | 6.2%(+2.26)#6,157 |
| 95. | North Fort Lewis | 8.3% | 5.6%(+2.79)#95 | 6.2%(+2.10)#6,393 |
| 96. | Skykomish | 8.3% | 5.6%(+2.78)#96 | 6.2%(+2.09)#6,434 |
| 97. | Wenatchee | 8.3% | 5.6%(+2.78)#97 | 6.2%(+2.09)#6,445 |
| 98. | Frederickson | 8.3% | 5.6%(+2.78)#98 | 6.2%(+2.09)#6,446 |
| 99. | Bangor Base | 8.3% | 5.6%(+2.76)#99 | 6.2%(+2.07)#6,458 |
| 100. | Ruston | 8.3% | 5.6%(+2.72)#100 | 6.2%(+2.03)#6,517 |
Common Questions
What are the Top 10 Cities with the Highest Percentage of Population Employed in Health Diagnosing & Treating in Washington?
Top 10 Cities with the Highest Percentage of Population Employed in Health Diagnosing & Treating in Washington are:
#1
55.6%
#2
43.5%
#3
42.0%
#4
35.6%
#5
32.8%
#6
32.0%
#7
23.5%
#8
22.0%
#9
21.2%
#10
19.6%
What city has the Highest Percentage of Population Employed in Health Diagnosing & Treating in Washington?
Loomis has the Highest Percentage of Population Employed in Health Diagnosing & Treating in Washington with 55.6%.
What is the Percentage of Population Employed in Health Diagnosing & Treating in the State of Washington?
Percentage of Population Employed in Health Diagnosing & Treating in Washington is 5.6%.
What is the Percentage of Population Employed in Health Diagnosing & Treating in the United States?
Percentage of Population Employed in Health Diagnosing & Treating in the United States is 6.2%.