Zip Codes with the Highest Percentage of Population Employed in Health Diagnosing & Treating in San Luis Obispo, CA
RELATED REPORTS & OPTIONS
Health Diagnosing & Treating
San Luis Obispo
Compare Zip Codes
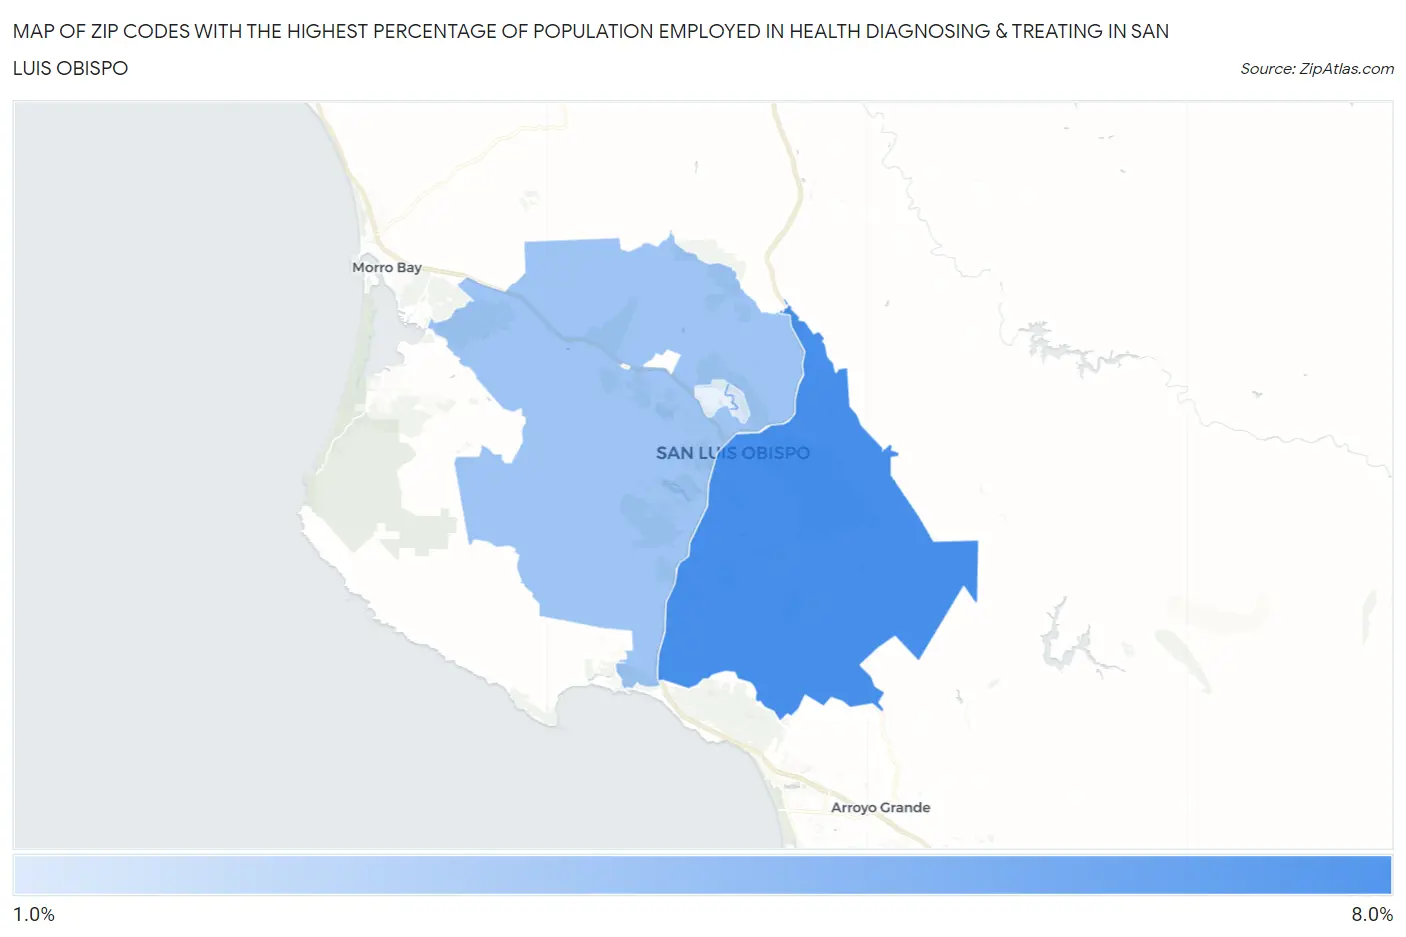
Map of Zip Codes with the Highest Percentage of Population Employed in Health Diagnosing & Treating in San Luis Obispo
1.8%
6.6%
Zip Codes with the Highest Percentage of Population Employed in Health Diagnosing & Treating in San Luis Obispo, CA
| Zip Code | % Employed | vs State | vs National | |
| 1. | 93401 | 6.6% | 5.3%(+1.29)#451 | 6.2%(+0.354)#11,672 |
| 2. | 93405 | 3.8% | 5.3%(-1.51)#1,055 | 6.2%(-2.44)#21,982 |
| 3. | 93410 | 1.8% | 5.3%(-3.48)#1,375 | 6.2%(-4.42)#26,761 |
1
Common Questions
What are the Top 3 Zip Codes with the Highest Percentage of Population Employed in Health Diagnosing & Treating in San Luis Obispo, CA?
Top 3 Zip Codes with the Highest Percentage of Population Employed in Health Diagnosing & Treating in San Luis Obispo, CA are:
What zip code has the Highest Percentage of Population Employed in Health Diagnosing & Treating in San Luis Obispo, CA?
93401 has the Highest Percentage of Population Employed in Health Diagnosing & Treating in San Luis Obispo, CA with 6.6%.
What is the Percentage of Population Employed in Health Diagnosing & Treating in San Luis Obispo, CA?
Percentage of Population Employed in Health Diagnosing & Treating in San Luis Obispo is 5.1%.
What is the Percentage of Population Employed in Health Diagnosing & Treating in California?
Percentage of Population Employed in Health Diagnosing & Treating in California is 5.3%.
What is the Percentage of Population Employed in Health Diagnosing & Treating in the United States?
Percentage of Population Employed in Health Diagnosing & Treating in the United States is 6.2%.