Cities with the Highest Percentage of Population Employed in Health Diagnosing & Treating in Ohio
RELATED REPORTS & OPTIONS
Health Diagnosing & Treating
Ohio
Compare Cities
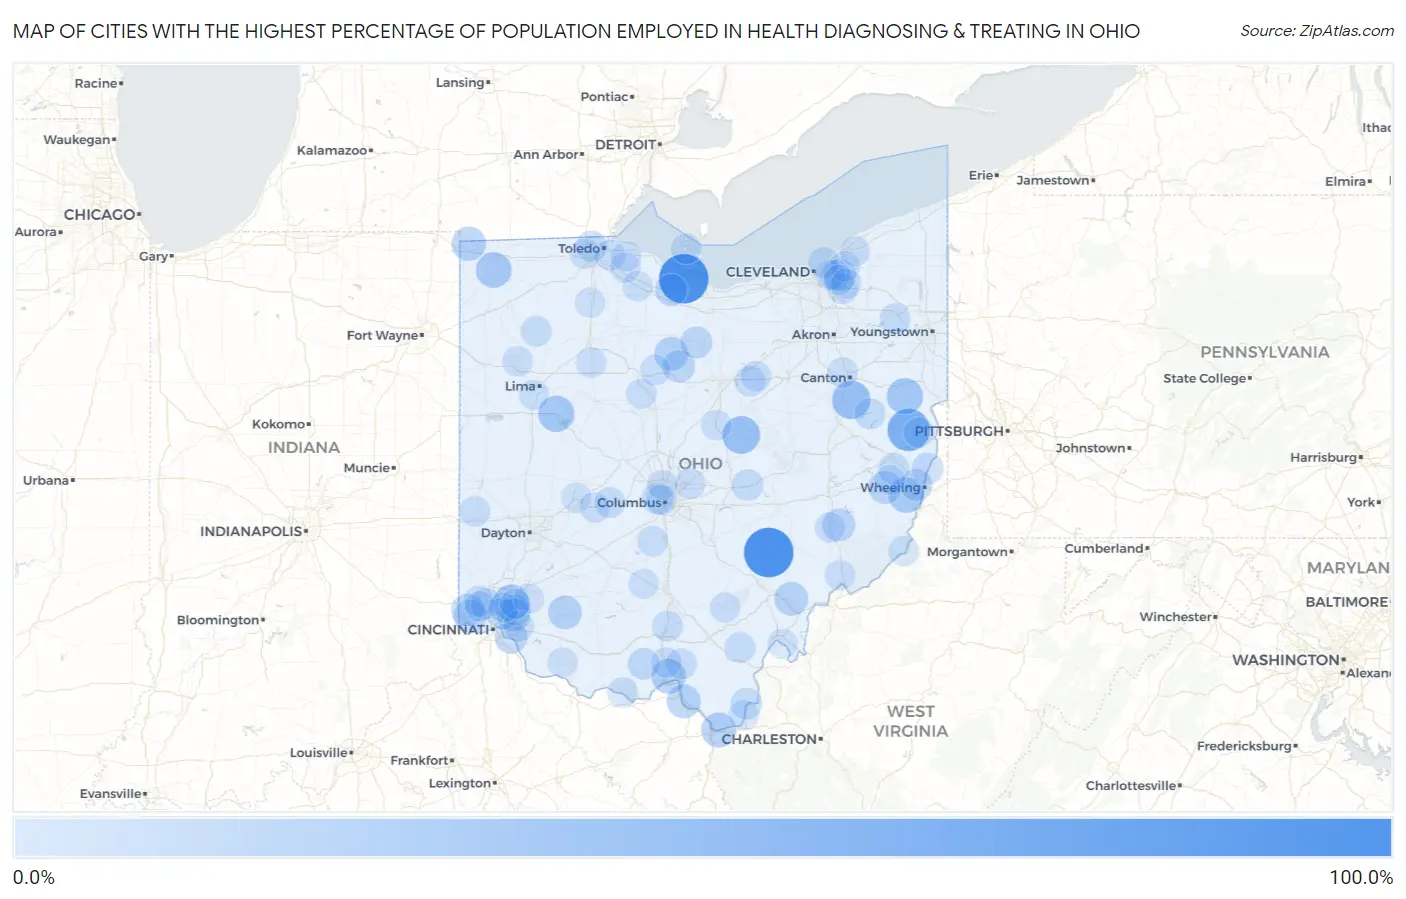
Map of Cities with the Highest Percentage of Population Employed in Health Diagnosing & Treating in Ohio
0.0%
100.0%
Cities with the Highest Percentage of Population Employed in Health Diagnosing & Treating in Ohio
| City | % Employed | vs State | vs National | |
| 1. | Crystal Rock | 100.0% | 7.2%(+92.8)#1 | 6.2%(+93.8)#6 |
| 2. | Rendville | 100.0% | 7.2%(+92.8)#2 | 6.2%(+93.8)#10 |
| 3. | East Springfield | 67.5% | 7.2%(+60.3)#3 | 6.2%(+61.3)#34 |
| 4. | Sandyville | 48.7% | 7.2%(+41.6)#4 | 6.2%(+42.5)#88 |
| 5. | Howard | 46.1% | 7.2%(+38.9)#5 | 6.2%(+39.8)#97 |
| 6. | Summitville | 40.0% | 7.2%(+32.8)#6 | 6.2%(+33.8)#143 |
| 7. | New Hampshire | 39.4% | 7.2%(+32.2)#7 | 6.2%(+33.1)#148 |
| 8. | Brecon | 39.1% | 7.2%(+32.0)#8 | 6.2%(+32.9)#149 |
| 9. | Pulaski | 37.2% | 7.2%(+30.1)#9 | 6.2%(+31.0)#168 |
| 10. | Glencoe | 36.7% | 7.2%(+29.5)#10 | 6.2%(+30.4)#174 |
| 11. | Nashport | 35.0% | 7.2%(+27.8)#11 | 6.2%(+28.8)#200 |
| 12. | Burlington | 33.3% | 7.2%(+26.2)#12 | 6.2%(+27.1)#242 |
| 13. | Rosemount | 33.0% | 7.2%(+25.9)#13 | 6.2%(+26.8)#243 |
| 14. | Nettle Lake | 31.2% | 7.2%(+24.1)#14 | 6.2%(+25.0)#287 |
| 15. | Chatfield | 29.5% | 7.2%(+22.4)#15 | 6.2%(+23.3)#315 |
| 16. | Franklin Furnace | 29.4% | 7.2%(+22.2)#16 | 6.2%(+23.1)#316 |
| 17. | St Martin | 28.7% | 7.2%(+21.6)#17 | 6.2%(+22.5)#326 |
| 18. | Stewart | 28.6% | 7.2%(+21.4)#18 | 6.2%(+22.3)#331 |
| 19. | The Village Of Indian Hill | 26.3% | 7.2%(+19.2)#19 | 6.2%(+20.1)#393 |
| 20. | Sarahsville | 25.6% | 7.2%(+18.4)#20 | 6.2%(+19.3)#420 |
| 21. | Morristown | 25.2% | 7.2%(+18.1)#21 | 6.2%(+19.0)#429 |
| 22. | Grandview | 24.3% | 7.2%(+17.1)#22 | 6.2%(+18.0)#477 |
| 23. | Sulphur Springs | 24.1% | 7.2%(+17.0)#23 | 6.2%(+17.9)#485 |
| 24. | Pepper Pike | 24.0% | 7.2%(+16.9)#24 | 6.2%(+17.8)#493 |
| 25. | Blue Jay | 23.6% | 7.2%(+16.4)#25 | 6.2%(+17.3)#515 |
| 26. | Coldstream | 23.3% | 7.2%(+16.1)#26 | 6.2%(+17.1)#531 |
| 27. | Vickery | 22.6% | 7.2%(+15.5)#27 | 6.2%(+16.4)#571 |
| 28. | Celeryville | 21.7% | 7.2%(+14.6)#28 | 6.2%(+15.5)#618 |
| 29. | Lansing | 21.7% | 7.2%(+14.5)#29 | 6.2%(+15.5)#622 |
| 30. | Rayland | 20.9% | 7.2%(+13.8)#30 | 6.2%(+14.7)#667 |
| 31. | Otway | 20.0% | 7.2%(+12.8)#31 | 6.2%(+13.8)#749 |
| 32. | Hanover | 20.0% | 7.2%(+12.8)#32 | 6.2%(+13.7)#758 |
| 33. | Roachester | 19.9% | 7.2%(+12.8)#33 | 6.2%(+13.7)#761 |
| 34. | Amberley | 19.2% | 7.2%(+12.0)#34 | 6.2%(+12.9)#820 |
| 35. | Crown City | 19.1% | 7.2%(+12.0)#35 | 6.2%(+12.9)#829 |
| 36. | Marble Cliff | 19.1% | 7.2%(+11.9)#36 | 6.2%(+12.8)#831 |
| 37. | Birmingham | 18.9% | 7.2%(+11.8)#37 | 6.2%(+12.7)#852 |
| 38. | Hamburg | 18.5% | 7.2%(+11.3)#38 | 6.2%(+12.2)#899 |
| 39. | New Athens | 18.4% | 7.2%(+11.2)#39 | 6.2%(+12.1)#907 |
| 40. | Remington | 18.3% | 7.2%(+11.2)#40 | 6.2%(+12.1)#911 |
| 41. | Mount Healthy Heights | 18.2% | 7.2%(+11.0)#41 | 6.2%(+11.9)#942 |
| 42. | Newton Falls | 17.3% | 7.2%(+10.1)#42 | 6.2%(+11.0)#1,039 |
| 43. | Ottawa Hills | 17.3% | 7.2%(+10.1)#43 | 6.2%(+11.0)#1,041 |
| 44. | Bratenahl | 17.1% | 7.2%(+9.98)#44 | 6.2%(+10.9)#1,065 |
| 45. | Dellroy | 17.1% | 7.2%(+9.97)#45 | 6.2%(+10.9)#1,069 |
| 46. | Minford | 17.0% | 7.2%(+9.85)#46 | 6.2%(+10.8)#1,084 |
| 47. | Waverly | 17.0% | 7.2%(+9.84)#47 | 6.2%(+10.8)#1,085 |
| 48. | Vinton | 16.9% | 7.2%(+9.78)#48 | 6.2%(+10.7)#1,095 |
| 49. | Miller City | 16.9% | 7.2%(+9.77)#49 | 6.2%(+10.7)#1,098 |
| 50. | Dunlap | 16.6% | 7.2%(+9.49)#50 | 6.2%(+10.4)#1,165 |
| 51. | Hayesville | 16.5% | 7.2%(+9.40)#51 | 6.2%(+10.3)#1,171 |
| 52. | Put In Bay | 16.3% | 7.2%(+9.13)#52 | 6.2%(+10.0)#1,221 |
| 53. | Darbyville | 16.2% | 7.2%(+9.09)#53 | 6.2%(+9.99)#1,232 |
| 54. | Summerside | 16.2% | 7.2%(+9.08)#54 | 6.2%(+9.99)#1,234 |
| 55. | Eldorado | 16.0% | 7.2%(+8.82)#55 | 6.2%(+9.72)#1,285 |
| 56. | Choctaw Lake | 15.9% | 7.2%(+8.75)#56 | 6.2%(+9.66)#1,301 |
| 57. | Fort Jennings | 15.7% | 7.2%(+8.50)#57 | 6.2%(+9.41)#1,363 |
| 58. | Hills And Dales | 15.6% | 7.2%(+8.47)#58 | 6.2%(+9.38)#1,366 |
| 59. | Solon | 15.6% | 7.2%(+8.44)#59 | 6.2%(+9.35)#1,371 |
| 60. | Lucasville | 15.6% | 7.2%(+8.41)#60 | 6.2%(+9.32)#1,381 |
| 61. | Oceola | 15.5% | 7.2%(+8.34)#61 | 6.2%(+9.25)#1,398 |
| 62. | Beachwood | 15.4% | 7.2%(+8.29)#62 | 6.2%(+9.20)#1,403 |
| 63. | Devola | 15.3% | 7.2%(+8.20)#63 | 6.2%(+9.10)#1,431 |
| 64. | Fredericktown | 15.3% | 7.2%(+8.15)#64 | 6.2%(+9.05)#1,445 |
| 65. | Jeromesville | 15.3% | 7.2%(+8.14)#65 | 6.2%(+9.05)#1,446 |
| 66. | Mcarthur | 15.2% | 7.2%(+8.02)#66 | 6.2%(+8.93)#1,469 |
| 67. | Northwood | 15.2% | 7.2%(+8.01)#67 | 6.2%(+8.92)#1,470 |
| 68. | Richmond | 15.0% | 7.2%(+7.89)#68 | 6.2%(+8.80)#1,496 |
| 69. | Massieville | 15.0% | 7.2%(+7.85)#69 | 6.2%(+8.76)#1,505 |
| 70. | Dry Ridge | 14.9% | 7.2%(+7.75)#70 | 6.2%(+8.66)#1,526 |
| 71. | Grandview Heights | 14.8% | 7.2%(+7.67)#71 | 6.2%(+8.58)#1,544 |
| 72. | Gates Mills | 14.8% | 7.2%(+7.67)#72 | 6.2%(+8.58)#1,545 |
| 73. | Arlington | 14.7% | 7.2%(+7.57)#73 | 6.2%(+8.47)#1,570 |
| 74. | Shaker Heights | 14.7% | 7.2%(+7.54)#74 | 6.2%(+8.44)#1,581 |
| 75. | Morral | 14.6% | 7.2%(+7.48)#75 | 6.2%(+8.39)#1,597 |
| 76. | Hessville | 14.6% | 7.2%(+7.48)#76 | 6.2%(+8.39)#1,605 |
| 77. | Sardis | 14.6% | 7.2%(+7.46)#77 | 6.2%(+8.36)#1,616 |
| 78. | New Albany | 14.6% | 7.2%(+7.43)#78 | 6.2%(+8.34)#1,625 |
| 79. | South Vienna | 14.5% | 7.2%(+7.34)#79 | 6.2%(+8.24)#1,652 |
| 80. | Genoa | 14.5% | 7.2%(+7.32)#80 | 6.2%(+8.22)#1,661 |
| 81. | Bentleyville | 14.4% | 7.2%(+7.23)#81 | 6.2%(+8.13)#1,683 |
| 82. | Riverlea | 14.3% | 7.2%(+7.18)#82 | 6.2%(+8.09)#1,690 |
| 83. | Belle Valley | 14.3% | 7.2%(+7.13)#83 | 6.2%(+8.04)#1,712 |
| 84. | Rome Stout | 14.3% | 7.2%(+7.13)#84 | 6.2%(+8.04)#1,725 |
| 85. | Frankfort | 14.2% | 7.2%(+7.05)#85 | 6.2%(+7.95)#1,747 |
| 86. | Holland | 14.2% | 7.2%(+7.04)#86 | 6.2%(+7.95)#1,749 |
| 87. | Syracuse | 14.2% | 7.2%(+7.03)#87 | 6.2%(+7.94)#1,754 |
| 88. | Orange | 14.2% | 7.2%(+7.02)#88 | 6.2%(+7.93)#1,758 |
| 89. | Williston | 14.1% | 7.2%(+6.98)#89 | 6.2%(+7.89)#1,766 |
| 90. | Lafferty | 14.1% | 7.2%(+6.95)#90 | 6.2%(+7.86)#1,779 |
| 91. | Evendale | 14.1% | 7.2%(+6.93)#91 | 6.2%(+7.83)#1,785 |
| 92. | Athalia | 14.0% | 7.2%(+6.90)#92 | 6.2%(+7.80)#1,792 |
| 93. | Fort Shawnee | 14.0% | 7.2%(+6.83)#93 | 6.2%(+7.74)#1,812 |
| 94. | Maineville | 13.8% | 7.2%(+6.70)#94 | 6.2%(+7.60)#1,847 |
| 95. | Sixteen Mile Stand | 13.8% | 7.2%(+6.64)#95 | 6.2%(+7.55)#1,876 |
| 96. | Rudolph | 13.7% | 7.2%(+6.54)#96 | 6.2%(+7.45)#1,919 |
| 97. | North Lima | 13.7% | 7.2%(+6.53)#97 | 6.2%(+7.44)#1,923 |
| 98. | Georgetown | 13.7% | 7.2%(+6.52)#98 | 6.2%(+7.43)#1,927 |
| 99. | Northridge | 13.6% | 7.2%(+6.41)#99 | 6.2%(+7.32)#1,951 |
| 100. | Kirtland Hills | 13.5% | 7.2%(+6.35)#100 | 6.2%(+7.25)#1,982 |
Common Questions
What are the Top 10 Cities with the Highest Percentage of Population Employed in Health Diagnosing & Treating in Ohio?
Top 10 Cities with the Highest Percentage of Population Employed in Health Diagnosing & Treating in Ohio are:
#1
100.0%
#2
100.0%
#3
67.5%
#4
48.7%
#5
46.1%
#6
40.0%
#7
39.4%
#8
39.1%
#9
37.2%
#10
36.7%
What city has the Highest Percentage of Population Employed in Health Diagnosing & Treating in Ohio?
Crystal Rock has the Highest Percentage of Population Employed in Health Diagnosing & Treating in Ohio with 100.0%.
What is the Percentage of Population Employed in Health Diagnosing & Treating in the State of Ohio?
Percentage of Population Employed in Health Diagnosing & Treating in Ohio is 7.2%.
What is the Percentage of Population Employed in Health Diagnosing & Treating in the United States?
Percentage of Population Employed in Health Diagnosing & Treating in the United States is 6.2%.