States with the Highest Percentage of Population Employed in Health Diagnosing & Treating
RELATED REPORTS & OPTIONS
Health Diagnosing & Treating
United States
Compare States
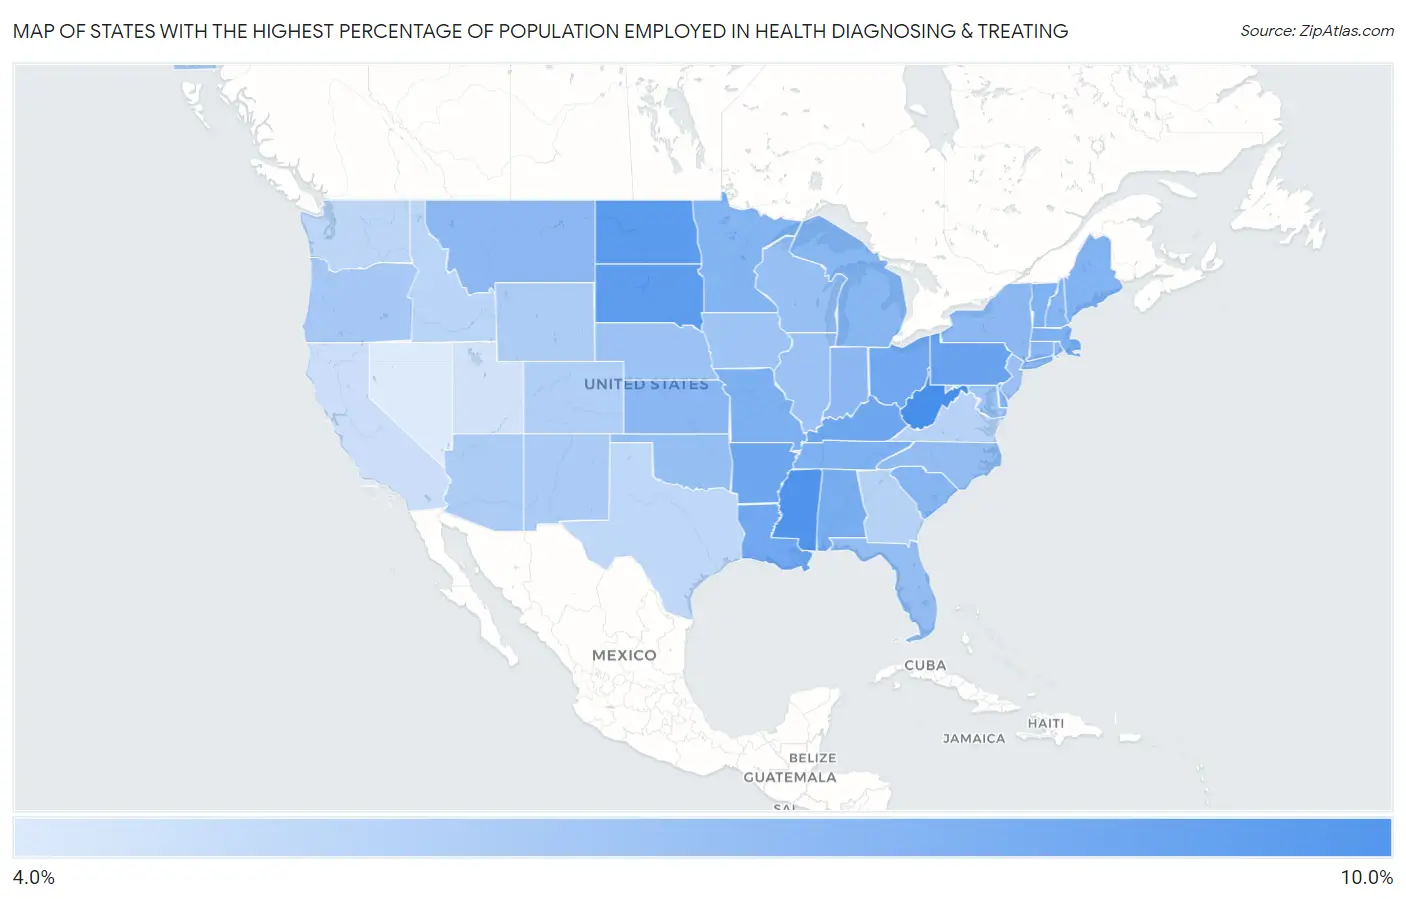
Map of States with the Highest Percentage of Population Employed in Health Diagnosing & Treating
4.0%
10.0%
States with the Highest Percentage of Population Employed in Health Diagnosing & Treating in the United States
| State | % Employed | vs State Median | vs National | |
| 1. | West Virginia | 8.0% | 6.6% (+1.46) | 6.2%(+1.77) |
| 2. | Mississippi | 7.8% | 6.6% (+1.28) | 6.2%(+1.59) |
| 3. | North Dakota | 7.6% | 6.6% (+1.02) | 6.2%(+1.33) |
| 4. | South Dakota | 7.5% | 6.6% (+0.988) | 6.2%(+1.30) |
| 5. | Pennsylvania | 7.4% | 6.6% (+0.795) | 6.2%(+1.11) |
| 6. | Kentucky | 7.2% | 6.6% (+0.654) | 6.2%(+0.965) |
| 7. | Arkansas | 7.2% | 6.6% (+0.623) | 6.2%(+0.933) |
| 8. | Louisiana | 7.2% | 6.6% (+0.611) | 6.2%(+0.922) |
| 9. | Ohio | 7.2% | 6.6% (+0.596) | 6.2%(+0.907) |
| 10. | Alabama | 7.0% | 6.6% (+0.467) | 6.2%(+0.778) |
| 11. | Missouri | 6.9% | 6.6% (+0.359) | 6.2%(+0.670) |
| 12. | Massachusetts | 6.9% | 6.6% (+0.348) | 6.2%(+0.659) |
| 13. | Tennessee | 6.9% | 6.6% (+0.306) | 6.2%(+0.617) |
| 14. | Vermont | 6.9% | 6.6% (+0.299) | 6.2%(+0.609) |
| 15. | Maine | 6.8% | 6.6% (+0.271) | 6.2%(+0.581) |
| 16. | Minnesota | 6.8% | 6.6% (+0.206) | 6.2%(+0.517) |
| 17. | Delaware | 6.8% | 6.6% (+0.194) | 6.2%(+0.505) |
| 18. | New Hampshire | 6.7% | 6.6% (+0.175) | 6.2%(+0.486) |
| 19. | South Carolina | 6.7% | 6.6% (+0.168) | 6.2%(+0.478) |
| 20. | Connecticut | 6.7% | 6.6% (+0.122) | 6.2%(+0.433) |
| 21. | Michigan | 6.6% | 6.6% (+0.090) | 6.2%(+0.401) |
| 22. | Kansas | 6.6% | 6.6% (+0.040) | 6.2%(+0.351) |
| 23. | New York | 6.6% | 6.6% (+0.016) | 6.2%(+0.327) |
| 24. | Rhode Island | 6.6% | 6.6% (+0.014) | 6.2%(+0.325) |
| 25. | Montana | 6.6% | 6.6% (+0.005) | 6.2%(+0.315) |
| 26. | Indiana | 6.6% | 6.6% (-0.005) | 6.2%(+0.306) |
| 27. | Florida | 6.4% | 6.6% (-0.107) | 6.2%(+0.204) |
| 28. | North Carolina | 6.4% | 6.6% (-0.134) | 6.2%(+0.176) |
| 29. | Oklahoma | 6.4% | 6.6% (-0.184) | 6.2%(+0.126) |
| 30. | Wisconsin | 6.3% | 6.6% (-0.216) | 6.2%(+0.095) |
| 31. | New Jersey | 6.2% | 6.6% (-0.314) | 6.2%(-0.003) |
| 32. | Illinois | 6.2% | 6.6% (-0.319) | 6.2%(-0.008) |
| 33. | Nebraska | 6.2% | 6.6% (-0.332) | 6.2%(-0.021) |
| 34. | Maryland | 6.2% | 6.6% (-0.348) | 6.2%(-0.038) |
| 35. | Iowa | 6.2% | 6.6% (-0.391) | 6.2%(-0.080) |
| 36. | Oregon | 6.1% | 6.6% (-0.487) | 6.2%(-0.176) |
| 37. | New Mexico | 5.9% | 6.6% (-0.615) | 6.2%(-0.305) |
| 38. | Wyoming | 5.9% | 6.6% (-0.652) | 6.2%(-0.341) |
| 39. | Arizona | 5.9% | 6.6% (-0.674) | 6.2%(-0.364) |
| 40. | Colorado | 5.8% | 6.6% (-0.748) | 6.2%(-0.437) |
| 41. | Alaska | 5.8% | 6.6% (-0.805) | 6.2%(-0.494) |
| 42. | Hawaii | 5.7% | 6.6% (-0.820) | 6.2%(-0.509) |
| 43. | Georgia | 5.7% | 6.6% (-0.850) | 6.2%(-0.539) |
| 44. | Virginia | 5.7% | 6.6% (-0.898) | 6.2%(-0.588) |
| 45. | Idaho | 5.6% | 6.6% (-0.951) | 6.2%(-0.640) |
| 46. | Washington | 5.6% | 6.6% (-1.00) | 6.2%(-0.691) |
| 47. | Texas | 5.5% | 6.6% (-1.04) | 6.2%(-0.726) |
| 48. | California | 5.3% | 6.6% (-1.24) | 6.2%(-0.934) |
| 49. | Utah | 5.1% | 6.6% (-1.43) | 6.2%(-1.12) |
| 50. | Nevada | 4.9% | 6.6% (-1.64) | 6.2%(-1.33) |
1
Common Questions
What are the Top 10 States with the Highest Percentage of Population Employed in Health Diagnosing & Treating in the United States?
Top 10 States with the Highest Percentage of Population Employed in Health Diagnosing & Treating in the United States are:
#1
8.0%
#2
7.8%
#3
7.6%
#4
7.5%
#5
7.4%
#6
7.2%
#7
7.2%
#8
7.2%
#9
7.2%
#10
7.0%
What state has the Highest Percentage of Population Employed in Health Diagnosing & Treating in the United States?
West Virginia has the Highest Percentage of Population Employed in Health Diagnosing & Treating in the United States with 8.0%.
What is the Percentage of Population Employed in Health Diagnosing & Treating in the United States?
Percentage of Population Employed in Health Diagnosing & Treating in the United States is 6.2%.