Minkler, CA Map & Demographics
Minkler Map
Minkler Overview
$45,786
PER CAPITA INCOME
$61,297
AVG FAMILY INCOME
$60,853
AVG HOUSEHOLD INCOME
42.1%
WAGE / INCOME GAP [ % ]
57.9¢/ $1
WAGE / INCOME GAP [ $ ]
0.46
INEQUALITY / GINI INDEX
683
TOTAL POPULATION
205
MALE POPULATION
478
FEMALE POPULATION
42.89
MALES / 100 FEMALES
233.17
FEMALES / 100 MALES
53.6
MEDIAN AGE
2.0
AVG FAMILY SIZE
1.9
AVG HOUSEHOLD SIZE
285
LABOR FORCE [ PEOPLE ]
43.0%
PERCENT IN LABOR FORCE
Income in Minkler
Income Overview in Minkler
Per Capita Income in Minkler is $45,786, while median incomes of families and households are $61,297 and $60,853 respectively.
| Characteristic | Number | Measure |
| Per Capita Income | 683 | $45,786 |
| Median Family Income | 235 | $61,297 |
| Mean Family Income | 235 | $103,106 |
| Median Household Income | 365 | $60,853 |
| Mean Household Income | 365 | $87,476 |
| Income Deficit | 235 | $0 |
| Wage / Income Gap (%) | 683 | 42.11% |
| Wage / Income Gap ($) | 683 | 57.89¢ per $1 |
| Gini / Inequality Index | 683 | 0.46 |
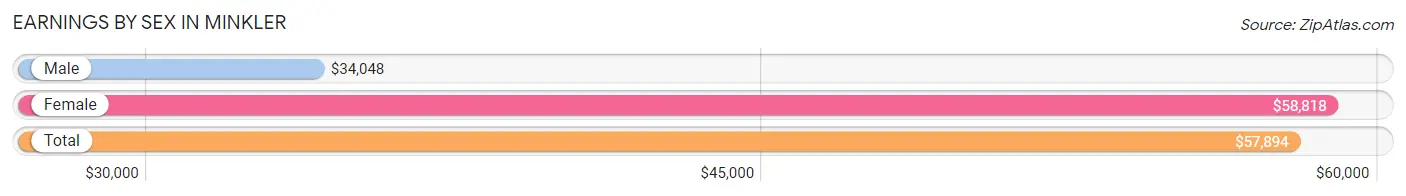
Earnings by Sex in Minkler
Average Earnings in Minkler are $57,894, $34,048 for men and $58,818 for women, a difference of 42.1%.
| Sex | Number | Average Earnings |
| Male | 108 (33.9%) | $34,048 |
| Female | 211 (66.1%) | $58,818 |
| Total | 319 (100.0%) | $57,894 |
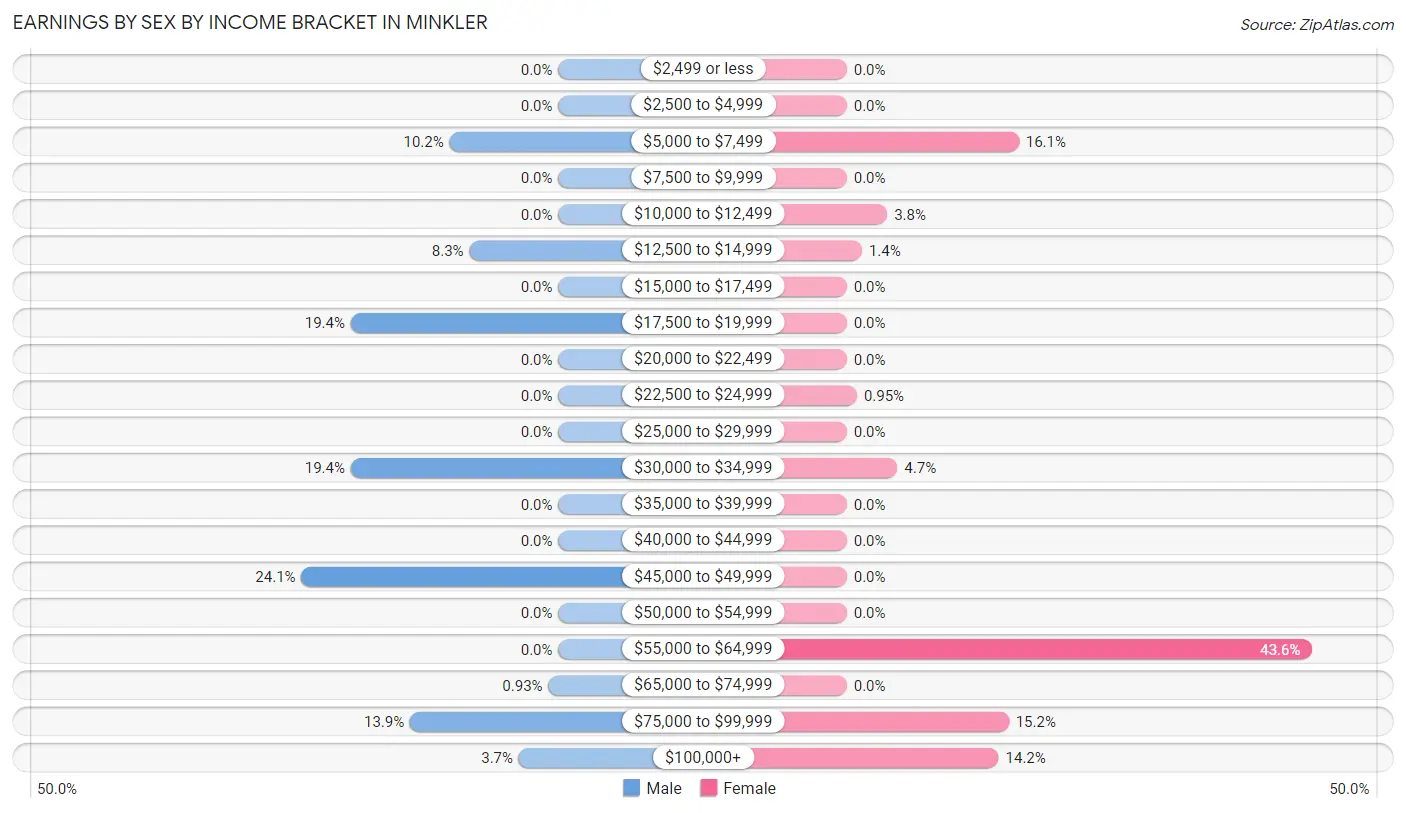
Earnings by Sex by Income Bracket in Minkler
The most common earnings brackets in Minkler are $45,000 to $49,999 for men (26 | 24.1%) and $55,000 to $64,999 for women (92 | 43.6%).
| Income | Male | Female |
| $2,499 or less | 0 (0.0%) | 0 (0.0%) |
| $2,500 to $4,999 | 0 (0.0%) | 0 (0.0%) |
| $5,000 to $7,499 | 11 (10.2%) | 34 (16.1%) |
| $7,500 to $9,999 | 0 (0.0%) | 0 (0.0%) |
| $10,000 to $12,499 | 0 (0.0%) | 8 (3.8%) |
| $12,500 to $14,999 | 9 (8.3%) | 3 (1.4%) |
| $15,000 to $17,499 | 0 (0.0%) | 0 (0.0%) |
| $17,500 to $19,999 | 21 (19.4%) | 0 (0.0%) |
| $20,000 to $22,499 | 0 (0.0%) | 0 (0.0%) |
| $22,500 to $24,999 | 0 (0.0%) | 2 (0.9%) |
| $25,000 to $29,999 | 0 (0.0%) | 0 (0.0%) |
| $30,000 to $34,999 | 21 (19.4%) | 10 (4.7%) |
| $35,000 to $39,999 | 0 (0.0%) | 0 (0.0%) |
| $40,000 to $44,999 | 0 (0.0%) | 0 (0.0%) |
| $45,000 to $49,999 | 26 (24.1%) | 0 (0.0%) |
| $50,000 to $54,999 | 0 (0.0%) | 0 (0.0%) |
| $55,000 to $64,999 | 0 (0.0%) | 92 (43.6%) |
| $65,000 to $74,999 | 1 (0.9%) | 0 (0.0%) |
| $75,000 to $99,999 | 15 (13.9%) | 32 (15.2%) |
| $100,000+ | 4 (3.7%) | 30 (14.2%) |
| Total | 108 (100.0%) | 211 (100.0%) |
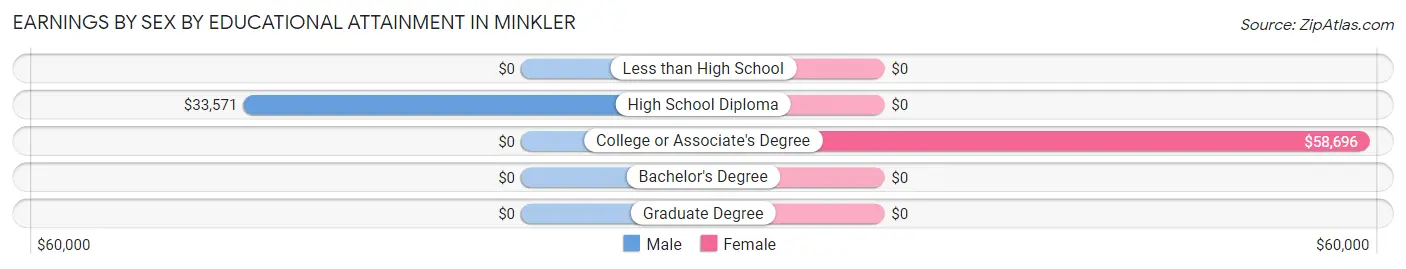
Earnings by Sex by Educational Attainment in Minkler
| Educational Attainment | Male Income | Female Income |
| Less than High School | - | - |
| High School Diploma | $33,571 | $0 |
| College or Associate's Degree | - | - |
| Bachelor's Degree | - | - |
| Graduate Degree | - | - |
| Total | - | - |
Family Income in Minkler
Family Income Brackets in Minkler
According to the Minkler family income data, there are 116 families falling into the $50,000 to $74,999 income range, which is the most common income bracket and makes up 49.4% of all families.
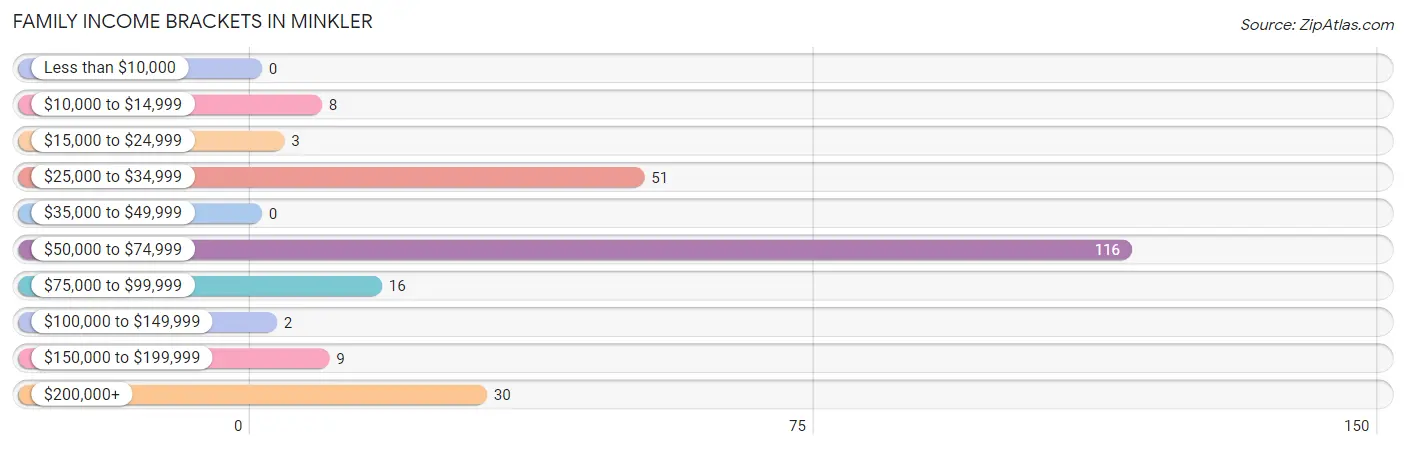
| Income Bracket | # Families | % Families |
| Less than $10,000 | 0 | 0.0% |
| $10,000 to $14,999 | 8 | 3.4% |
| $15,000 to $24,999 | 3 | 1.3% |
| $25,000 to $34,999 | 51 | 21.7% |
| $35,000 to $49,999 | 0 | 0.0% |
| $50,000 to $74,999 | 116 | 49.4% |
| $75,000 to $99,999 | 16 | 6.8% |
| $100,000 to $149,999 | 2 | 0.9% |
| $150,000 to $199,999 | 9 | 3.8% |
| $200,000+ | 30 | 12.8% |
Family Income by Famaliy Size in Minkler
2-person families (233 | 99.2%) account for the highest median family income in Minkler with $61,273 per family, while 2-person families (233 | 99.2%) have the highest median income of $30,636 per family member.
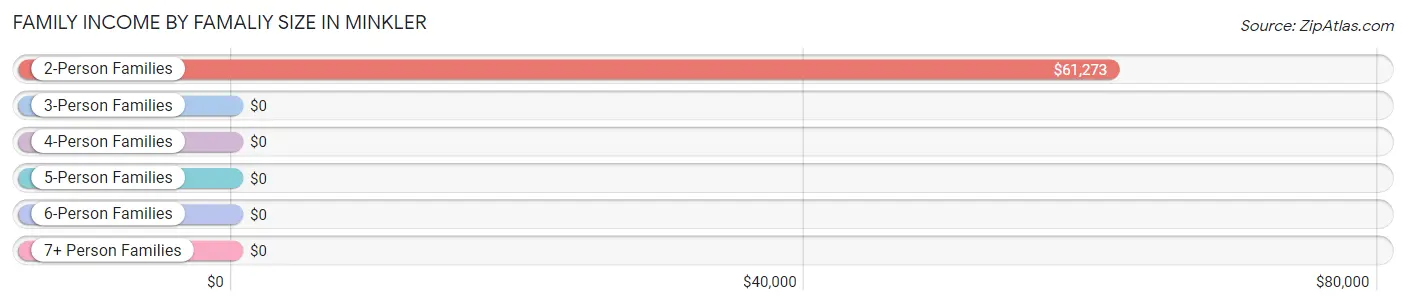
| Income Bracket | # Families | Median Income |
| 2-Person Families | 233 (99.2%) | $61,273 |
| 3-Person Families | 2 (0.9%) | $0 |
| 4-Person Families | 0 (0.0%) | $0 |
| 5-Person Families | 0 (0.0%) | $0 |
| 6-Person Families | 0 (0.0%) | $0 |
| 7+ Person Families | 0 (0.0%) | $0 |
| Total | 235 (100.0%) | $61,297 |
Family Income by Number of Earners in Minkler
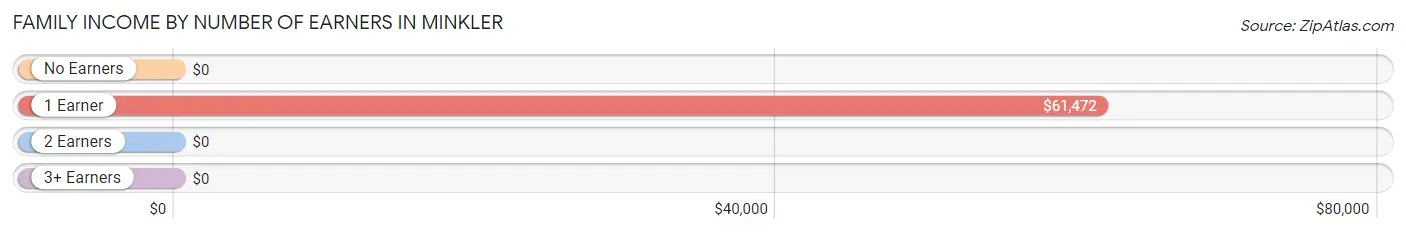
| Number of Earners | # Families | Median Income |
| No Earners | 54 (23.0%) | $0 |
| 1 Earner | 142 (60.4%) | $61,472 |
| 2 Earners | 39 (16.6%) | $0 |
| 3+ Earners | 0 (0.0%) | $0 |
| Total | 235 (100.0%) | $61,297 |
Household Income in Minkler
Household Income Brackets in Minkler
With 174 households falling in the category, the $50,000 to $74,999 income range is the most frequent in Minkler, accounting for 47.7% of all households.
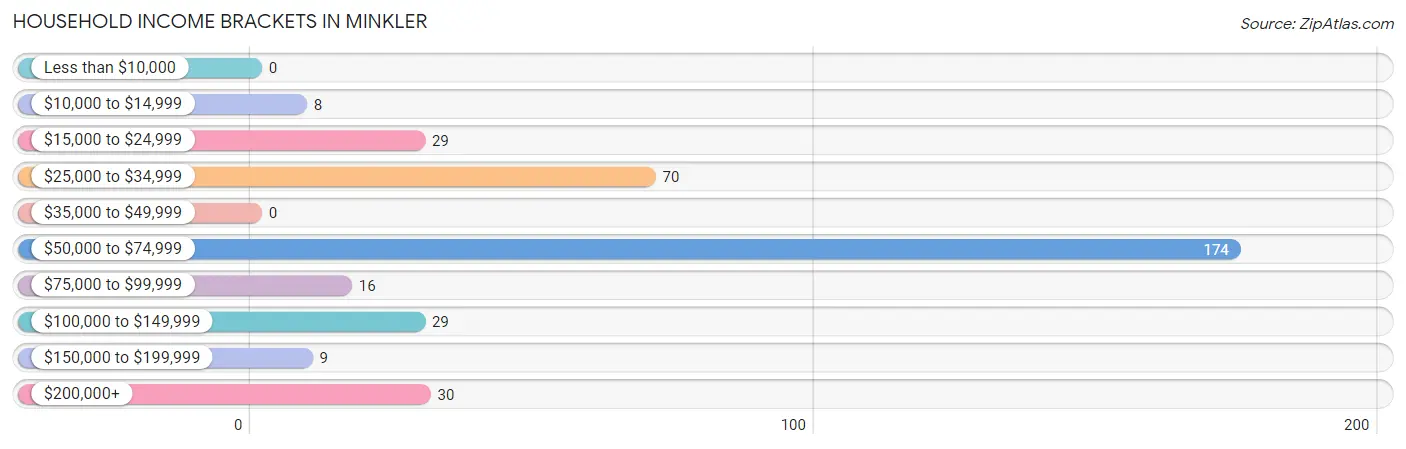
| Income Bracket | # Households | % Households |
| Less than $10,000 | 0 | 0.0% |
| $10,000 to $14,999 | 8 | 2.2% |
| $15,000 to $24,999 | 29 | 7.9% |
| $25,000 to $34,999 | 70 | 19.2% |
| $35,000 to $49,999 | 0 | 0.0% |
| $50,000 to $74,999 | 174 | 47.7% |
| $75,000 to $99,999 | 16 | 4.4% |
| $100,000 to $149,999 | 29 | 7.9% |
| $150,000 to $199,999 | 9 | 2.5% |
| $200,000+ | 30 | 8.2% |
Household Income by Householder Age in Minkler
The median household income in Minkler is $60,853, with the highest median household income of $61,390 found in the 45 to 64 years age bracket for the primary householder. A total of 175 households (47.9%) fall into this category. Meanwhile, the 15 to 24 years age bracket for the primary householder has the lowest median household income of $0, with 23 households (6.3%) in this group.
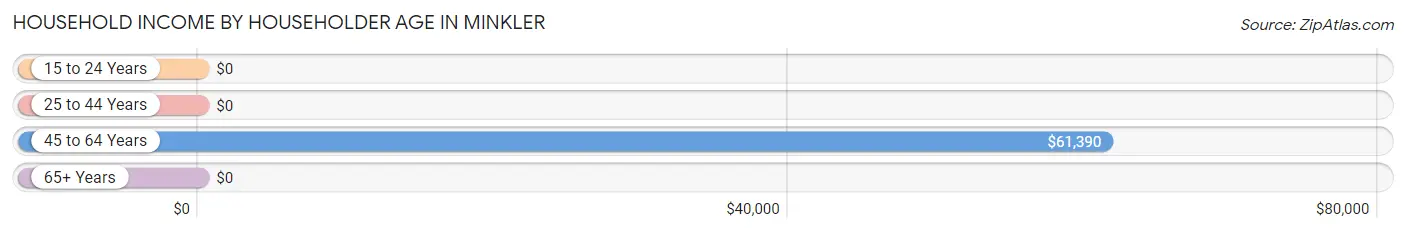
| Income Bracket | # Households | Median Income |
| 15 to 24 Years | 23 (6.3%) | $0 |
| 25 to 44 Years | 9 (2.5%) | $0 |
| 45 to 64 Years | 175 (47.9%) | $61,390 |
| 65+ Years | 158 (43.3%) | $0 |
| Total | 365 (100.0%) | $60,853 |
Poverty in Minkler
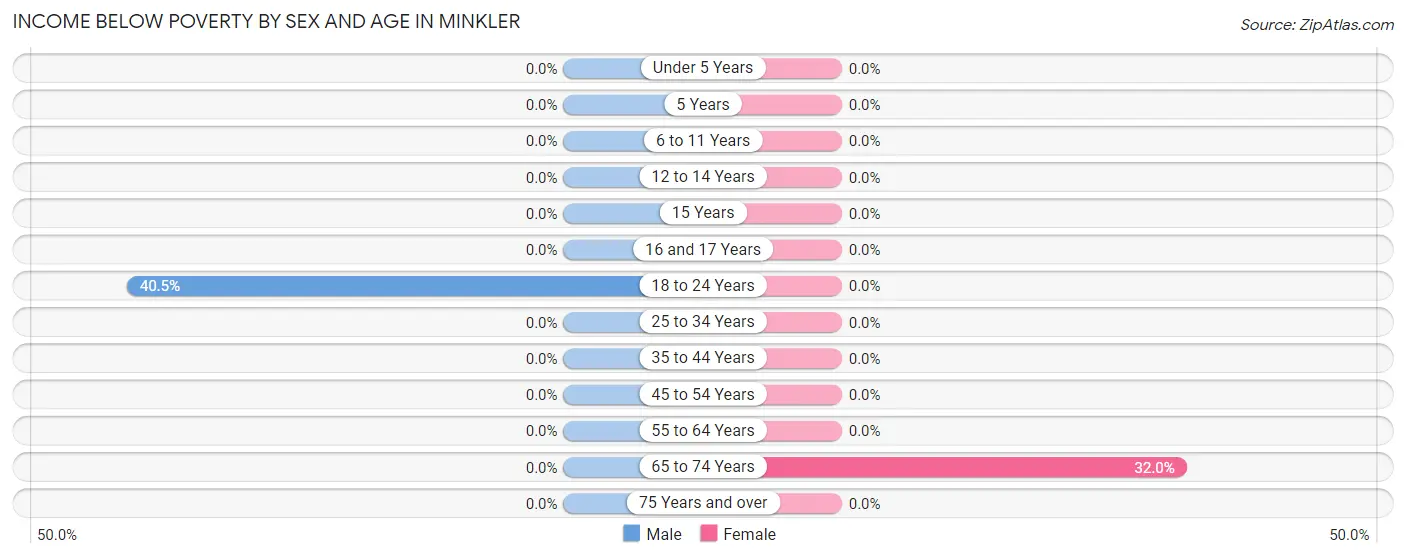
Income Below Poverty by Sex and Age in Minkler
With 15.6% poverty level for males and 1.8% for females among the residents of Minkler, 18 to 24 year old males and 65 to 74 year old females are the most vulnerable to poverty, with 32 males (40.5%) and 8 females (32.0%) in their respective age groups living below the poverty level.
| Age Bracket | Male | Female |
| Under 5 Years | 0 (0.0%) | 0 (0.0%) |
| 5 Years | 0 (0.0%) | 0 (0.0%) |
| 6 to 11 Years | 0 (0.0%) | 0 (0.0%) |
| 12 to 14 Years | 0 (0.0%) | 0 (0.0%) |
| 15 Years | 0 (0.0%) | 0 (0.0%) |
| 16 and 17 Years | 0 (0.0%) | 0 (0.0%) |
| 18 to 24 Years | 32 (40.5%) | 0 (0.0%) |
| 25 to 34 Years | 0 (0.0%) | 0 (0.0%) |
| 35 to 44 Years | 0 (0.0%) | 0 (0.0%) |
| 45 to 54 Years | 0 (0.0%) | 0 (0.0%) |
| 55 to 64 Years | 0 (0.0%) | 0 (0.0%) |
| 65 to 74 Years | 0 (0.0%) | 8 (32.0%) |
| 75 Years and over | 0 (0.0%) | 0 (0.0%) |
| Total | 32 (15.6%) | 8 (1.8%) |
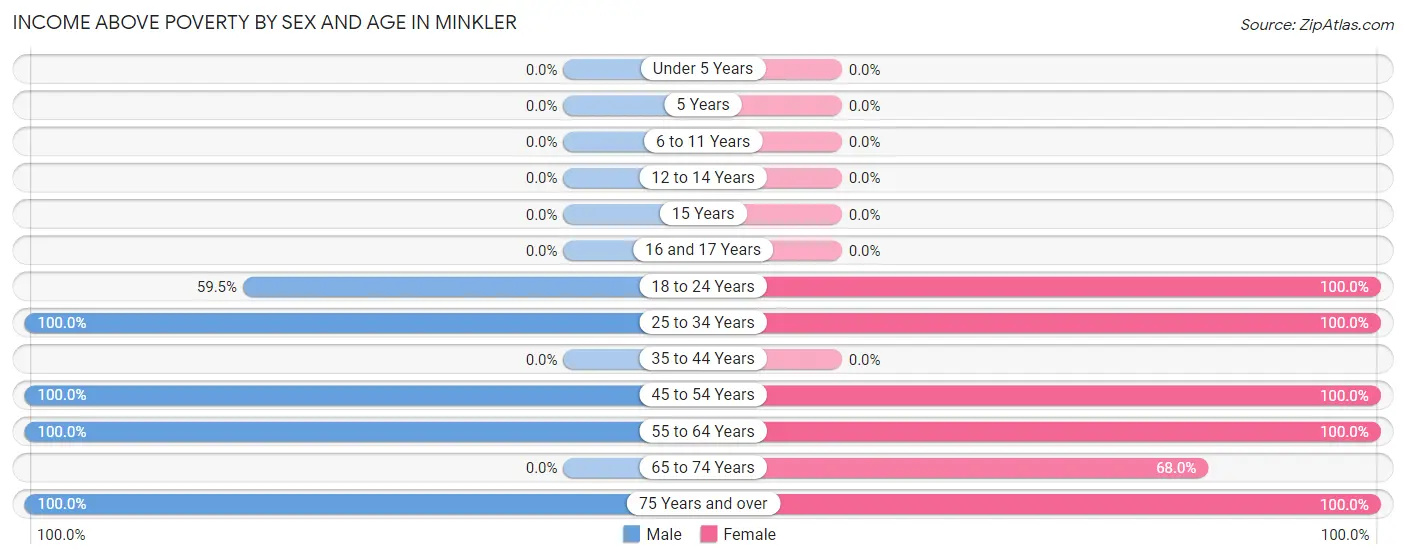
Income Above Poverty by Sex and Age in Minkler
According to the poverty statistics in Minkler, males aged 25 to 34 years and females aged 18 to 24 years are the age groups that are most secure financially, with 100.0% of males and 100.0% of females in these age groups living above the poverty line.
| Age Bracket | Male | Female |
| Under 5 Years | 0 (0.0%) | 0 (0.0%) |
| 5 Years | 0 (0.0%) | 0 (0.0%) |
| 6 to 11 Years | 0 (0.0%) | 0 (0.0%) |
| 12 to 14 Years | 0 (0.0%) | 0 (0.0%) |
| 15 Years | 0 (0.0%) | 0 (0.0%) |
| 16 and 17 Years | 0 (0.0%) | 0 (0.0%) |
| 18 to 24 Years | 47 (59.5%) | 57 (100.0%) |
| 25 to 34 Years | 9 (100.0%) | 12 (100.0%) |
| 35 to 44 Years | 0 (0.0%) | 0 (0.0%) |
| 45 to 54 Years | 5 (100.0%) | 199 (100.0%) |
| 55 to 64 Years | 7 (100.0%) | 72 (100.0%) |
| 65 to 74 Years | 0 (0.0%) | 17 (68.0%) |
| 75 Years and over | 105 (100.0%) | 93 (100.0%) |
| Total | 173 (84.4%) | 450 (98.3%) |
Income Below Poverty Among Married-Couple Families in Minkler
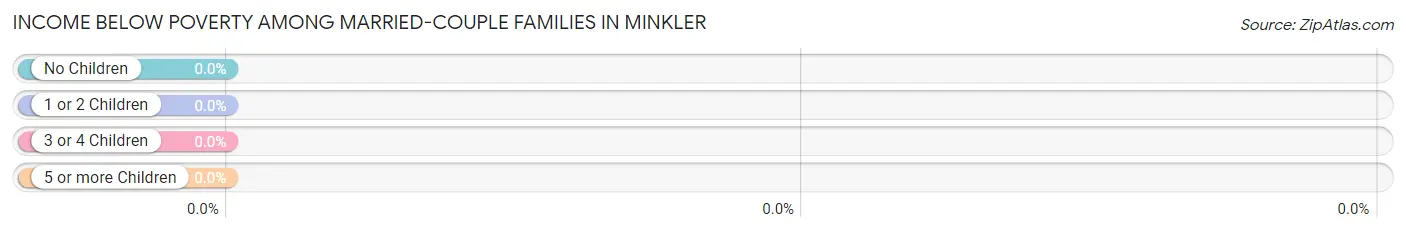
| Children | Above Poverty | Below Poverty |
| No Children | 190 (100.0%) | 0 (0.0%) |
| 1 or 2 Children | 0 (0.0%) | 0 (0.0%) |
| 3 or 4 Children | 0 (0.0%) | 0 (0.0%) |
| 5 or more Children | 0 (0.0%) | 0 (0.0%) |
| Total | 190 (100.0%) | 0 (0.0%) |
Income Below Poverty Among Single-Parent Households in Minkler
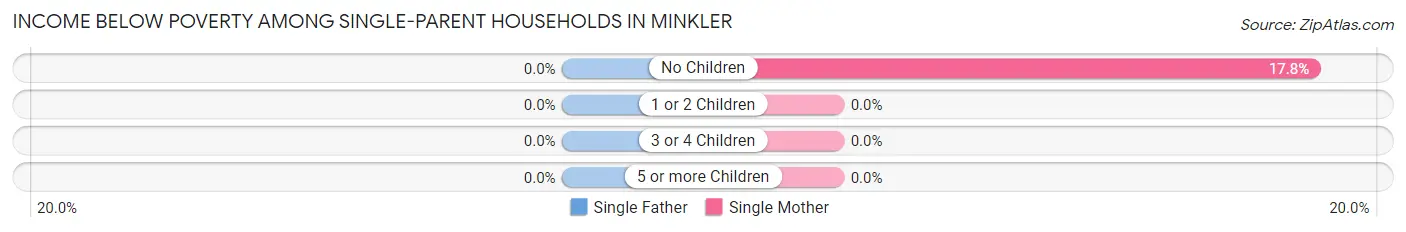
| Children | Single Father | Single Mother |
| No Children | 0 (0.0%) | 8 (17.8%) |
| 1 or 2 Children | 0 (0.0%) | 0 (0.0%) |
| 3 or 4 Children | 0 (0.0%) | 0 (0.0%) |
| 5 or more Children | 0 (0.0%) | 0 (0.0%) |
| Total | 0 (0.0%) | 8 (17.8%) |
Income Below Poverty Among Married-Couple vs Single-Parent Households in Minkler
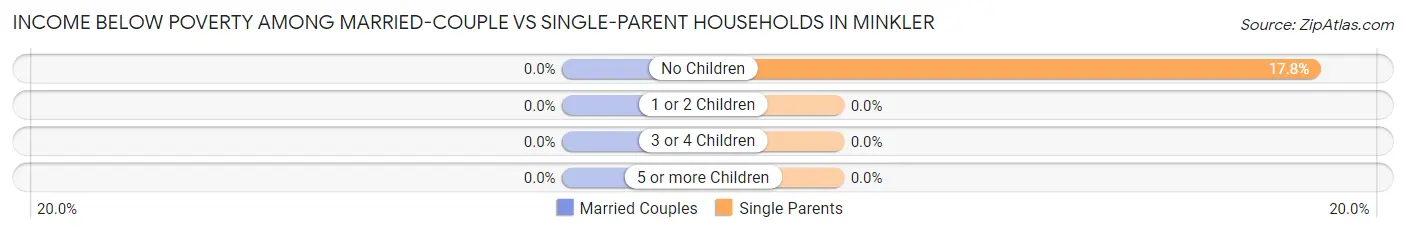
| Children | Married-Couple Families | Single-Parent Households |
| No Children | 0 (0.0%) | 8 (17.8%) |
| 1 or 2 Children | 0 (0.0%) | 0 (0.0%) |
| 3 or 4 Children | 0 (0.0%) | 0 (0.0%) |
| 5 or more Children | 0 (0.0%) | 0 (0.0%) |
| Total | 0 (0.0%) | 8 (17.8%) |
Race in Minkler
The most populous races in Minkler are White / Caucasian (570 | 83.5%), Hispanic or Latino (55 | 8.1%), and Some other Race (54 | 7.9%).
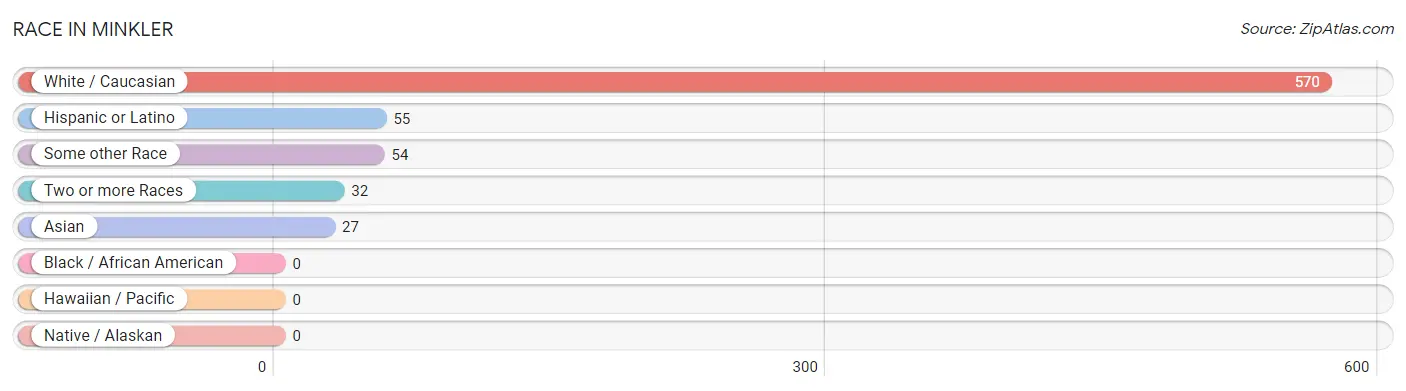
| Race | # Population | % Population |
| Asian | 27 | 4.0% |
| Black / African American | 0 | 0.0% |
| Hawaiian / Pacific | 0 | 0.0% |
| Hispanic or Latino | 55 | 8.1% |
| Native / Alaskan | 0 | 0.0% |
| White / Caucasian | 570 | 83.5% |
| Two or more Races | 32 | 4.7% |
| Some other Race | 54 | 7.9% |
| Total | 683 | 100.0% |
Ancestry in Minkler
The most populous ancestries reported in Minkler are English (177 | 25.9%), Irish (158 | 23.1%), German (80 | 11.7%), Dutch (61 | 8.9%), and Canadian (34 | 5.0%), together accounting for 74.7% of all Minkler residents.
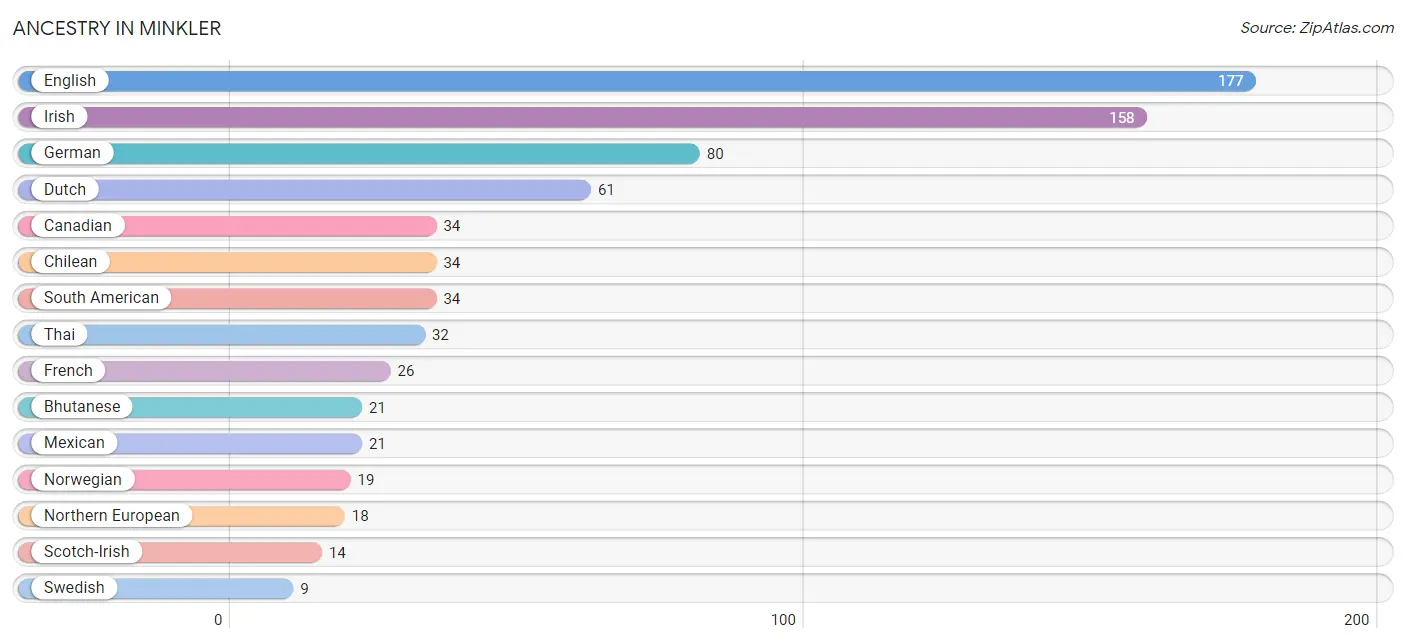
| Ancestry | # Population | % Population |
| American | 1 | 0.2% |
| Bhutanese | 21 | 3.1% |
| Canadian | 34 | 5.0% |
| Chilean | 34 | 5.0% |
| Dutch | 61 | 8.9% |
| English | 177 | 25.9% |
| French | 26 | 3.8% |
| French Canadian | 1 | 0.2% |
| German | 80 | 11.7% |
| Indian (Asian) | 6 | 0.9% |
| Irish | 158 | 23.1% |
| Italian | 2 | 0.3% |
| Mexican | 21 | 3.1% |
| Northern European | 18 | 2.6% |
| Norwegian | 19 | 2.8% |
| Scotch-Irish | 14 | 2.1% |
| South American | 34 | 5.0% |
| Swedish | 9 | 1.3% |
| Thai | 32 | 4.7% |
| Turkish | 2 | 0.3% | View All 20 Rows |
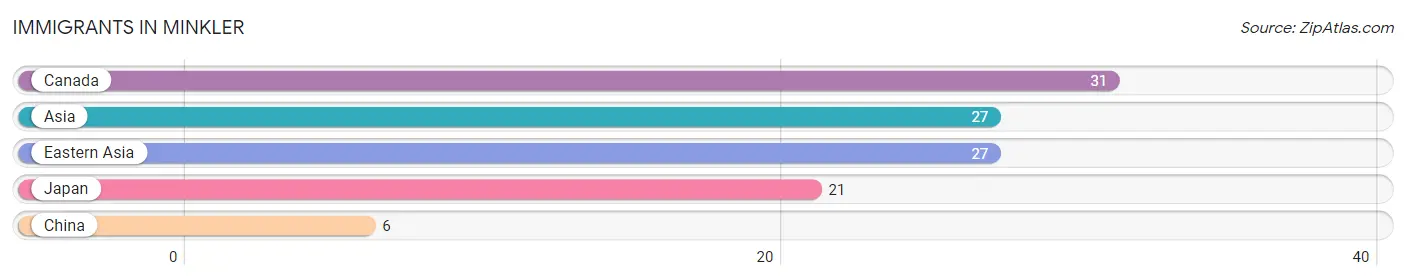
Immigrants in Minkler
The most numerous immigrant groups reported in Minkler came from Canada (31 | 4.5%), Asia (27 | 4.0%), Eastern Asia (27 | 4.0%), Japan (21 | 3.1%), and China (6 | 0.9%), together accounting for 16.4% of all Minkler residents.
| Immigration Origin | # Population | % Population |
| Asia | 27 | 4.0% |
| Canada | 31 | 4.5% |
| China | 6 | 0.9% |
| Eastern Asia | 27 | 4.0% |
| Japan | 21 | 3.1% | View All 5 Rows |
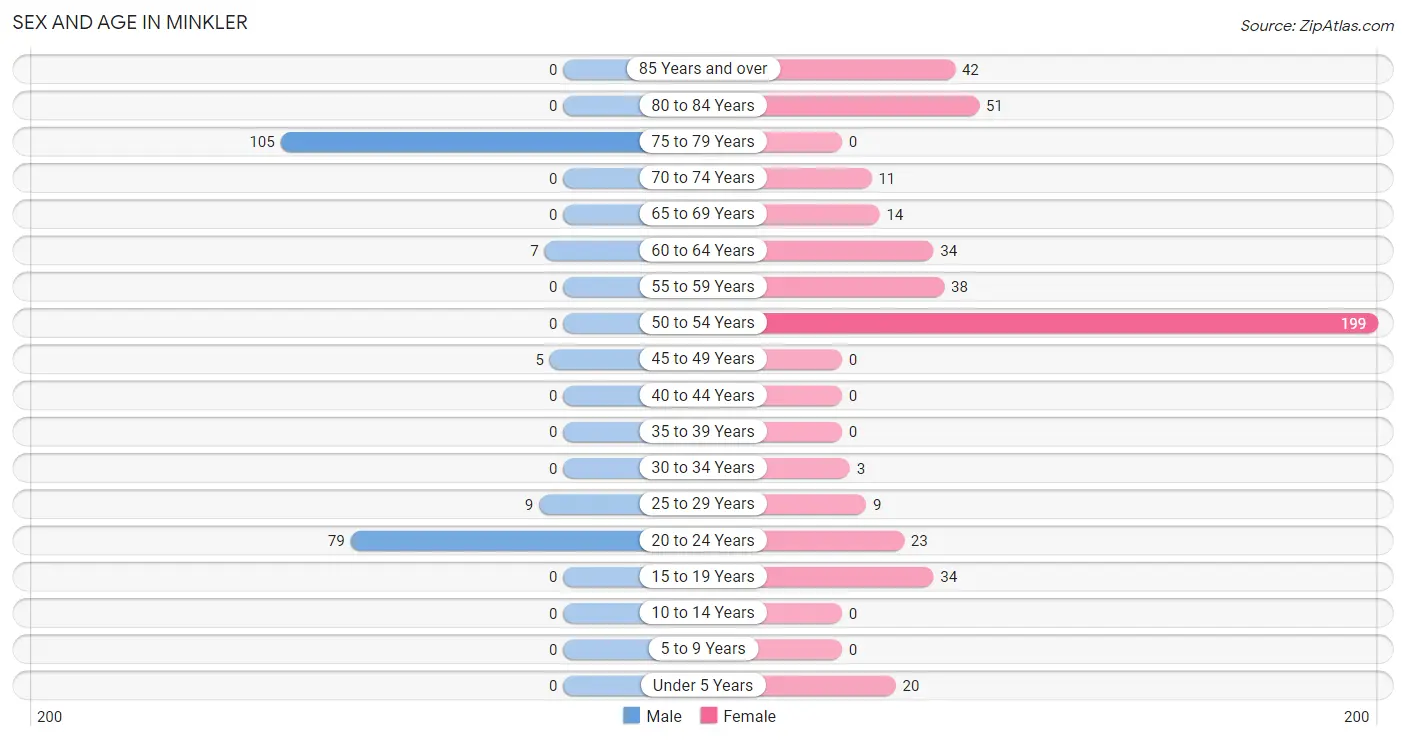
Sex and Age in Minkler
Sex and Age in Minkler
The most populous age groups in Minkler are 75 to 79 Years (105 | 51.2%) for men and 50 to 54 Years (199 | 41.6%) for women.
| Age Bracket | Male | Female |
| Under 5 Years | 0 (0.0%) | 20 (4.2%) |
| 5 to 9 Years | 0 (0.0%) | 0 (0.0%) |
| 10 to 14 Years | 0 (0.0%) | 0 (0.0%) |
| 15 to 19 Years | 0 (0.0%) | 34 (7.1%) |
| 20 to 24 Years | 79 (38.5%) | 23 (4.8%) |
| 25 to 29 Years | 9 (4.4%) | 9 (1.9%) |
| 30 to 34 Years | 0 (0.0%) | 3 (0.6%) |
| 35 to 39 Years | 0 (0.0%) | 0 (0.0%) |
| 40 to 44 Years | 0 (0.0%) | 0 (0.0%) |
| 45 to 49 Years | 5 (2.4%) | 0 (0.0%) |
| 50 to 54 Years | 0 (0.0%) | 199 (41.6%) |
| 55 to 59 Years | 0 (0.0%) | 38 (8.0%) |
| 60 to 64 Years | 7 (3.4%) | 34 (7.1%) |
| 65 to 69 Years | 0 (0.0%) | 14 (2.9%) |
| 70 to 74 Years | 0 (0.0%) | 11 (2.3%) |
| 75 to 79 Years | 105 (51.2%) | 0 (0.0%) |
| 80 to 84 Years | 0 (0.0%) | 51 (10.7%) |
| 85 Years and over | 0 (0.0%) | 42 (8.8%) |
| Total | 205 (100.0%) | 478 (100.0%) |
Families and Households in Minkler
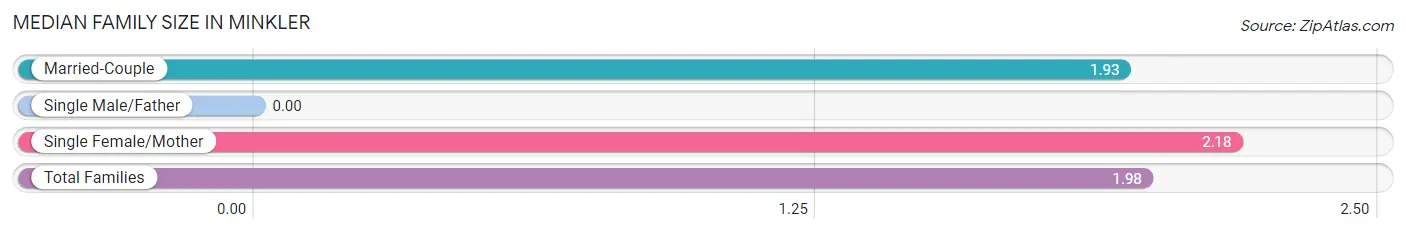
Median Family Size in Minkler
| Family Type | # Families | Family Size |
| Married-Couple | 190 (80.8%) | 1.93 |
| Single Male/Father | 0 (0.0%) | - |
| Single Female/Mother | 45 (19.2%) | 2.18 |
| Total Families | 235 (100.0%) | 1.98 |
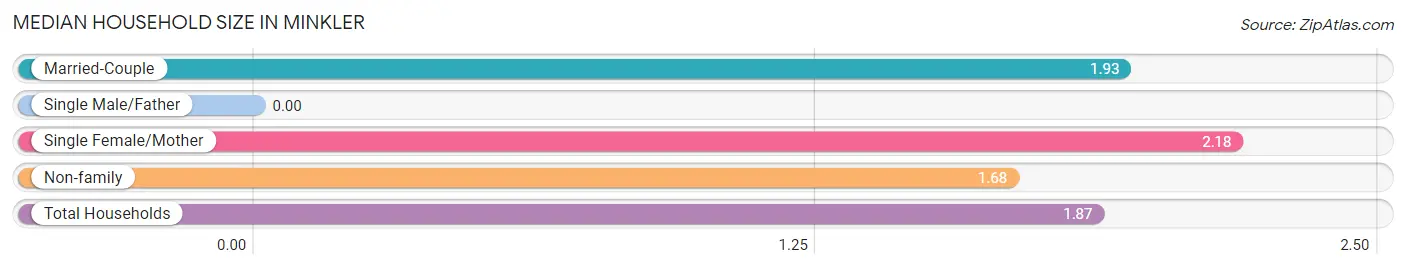
Median Household Size in Minkler
| Household Type | # Households | Household Size |
| Married-Couple | 190 (52.0%) | 1.93 |
| Single Male/Father | 0 (0.0%) | - |
| Single Female/Mother | 45 (12.3%) | 2.18 |
| Non-family | 130 (35.6%) | 1.68 |
| Total Households | 365 (100.0%) | 1.87 |
Household Size by Marriage Status in Minkler
Out of a total of 365 households in Minkler, 235 (64.4%) are family households, while 130 (35.6%) are nonfamily households. The most numerous type of family households are 2-person households, comprising 233, and the most common type of nonfamily households are 1-person households, comprising 89.
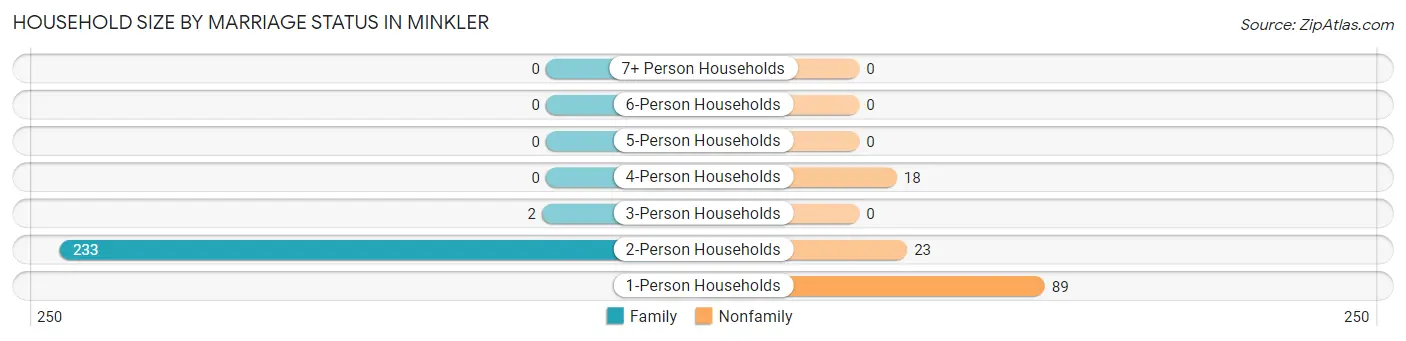
| Household Size | Family Households | Nonfamily Households |
| 1-Person Households | - | 89 (24.4%) |
| 2-Person Households | 233 (63.8%) | 23 (6.3%) |
| 3-Person Households | 2 (0.5%) | 0 (0.0%) |
| 4-Person Households | 0 (0.0%) | 18 (4.9%) |
| 5-Person Households | 0 (0.0%) | 0 (0.0%) |
| 6-Person Households | 0 (0.0%) | 0 (0.0%) |
| 7+ Person Households | 0 (0.0%) | 0 (0.0%) |
| Total | 235 (64.4%) | 130 (35.6%) |
Female Fertility in Minkler
Fertility by Age in Minkler
| Age Bracket | Women with Births | Births / 1,000 Women |
| 15 to 19 years | 0 (0.0%) | 0.0 |
| 20 to 34 years | 0 (0.0%) | 0.0 |
| 35 to 50 years | 0 (0.0%) | 0.0 |
| Total | 0 (0.0%) | 0.0 |
Fertility by Age by Marriage Status in Minkler
| Age Bracket | Married | Unmarried |
| 15 to 19 years | 0 (0.0%) | 0 (0.0%) |
| 20 to 34 years | 0 (0.0%) | 0 (0.0%) |
| 35 to 50 years | 0 (0.0%) | 0 (0.0%) |
| Total | 0 (0.0%) | 0 (0.0%) |
Fertility by Education in Minkler
| Educational Attainment | Women with Births | Births / 1,000 Women |
| Less than High School | 0 (0.0%) | 0.0 |
| High School Diploma | 0 (0.0%) | 0.0 |
| College or Associate's Degree | 0 (0.0%) | 0.0 |
| Bachelor's Degree | 0 (0.0%) | 0.0 |
| Graduate Degree | 0 (0.0%) | 0.0 |
| Total | 0 (0.0%) | 0.0 |
Fertility by Education by Marriage Status in Minkler

| Educational Attainment | Married | Unmarried |
| Less than High School | 0 (0.0%) | 0 (0.0%) |
| High School Diploma | 0 (0.0%) | 0 (0.0%) |
| College or Associate's Degree | 0 (0.0%) | 0 (0.0%) |
| Bachelor's Degree | 0 (0.0%) | 0 (0.0%) |
| Graduate Degree | 0 (0.0%) | 0 (0.0%) |
| Total | 0 (0.0%) | 0 (0.0%) |
Employment Characteristics in Minkler
Employment by Class of Employer in Minkler
Among the 285 employed individuals in Minkler, private company employees (190 | 66.7%), self-employed (not incorporated) (38 | 13.3%), and not-for-profit organizations (30 | 10.5%) make up the most common classes of employment.
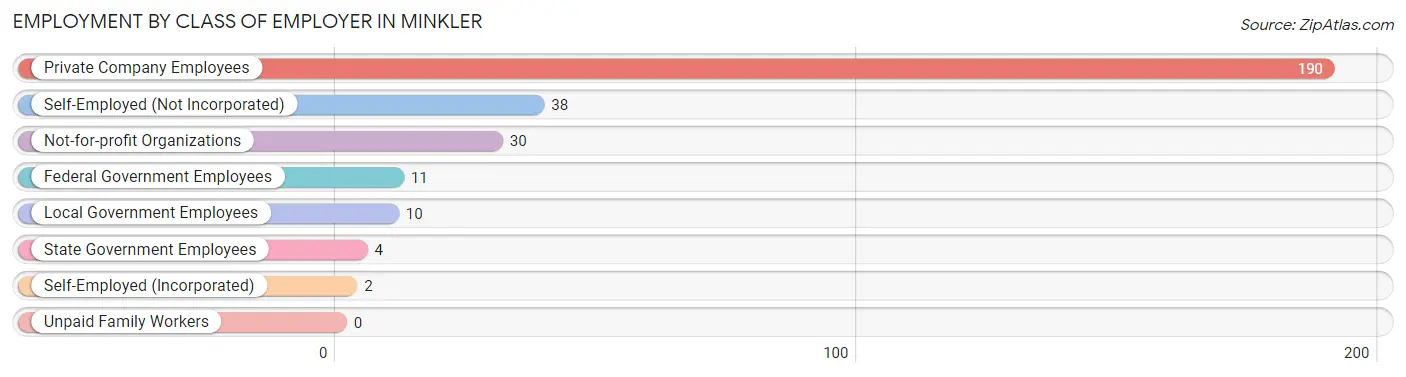
| Employer Class | # Employees | % Employees |
| Private Company Employees | 190 | 66.7% |
| Self-Employed (Incorporated) | 2 | 0.7% |
| Self-Employed (Not Incorporated) | 38 | 13.3% |
| Not-for-profit Organizations | 30 | 10.5% |
| Local Government Employees | 10 | 3.5% |
| State Government Employees | 4 | 1.4% |
| Federal Government Employees | 11 | 3.9% |
| Unpaid Family Workers | 0 | 0.0% |
| Total | 285 | 100.0% |
Employment Status by Age in Minkler
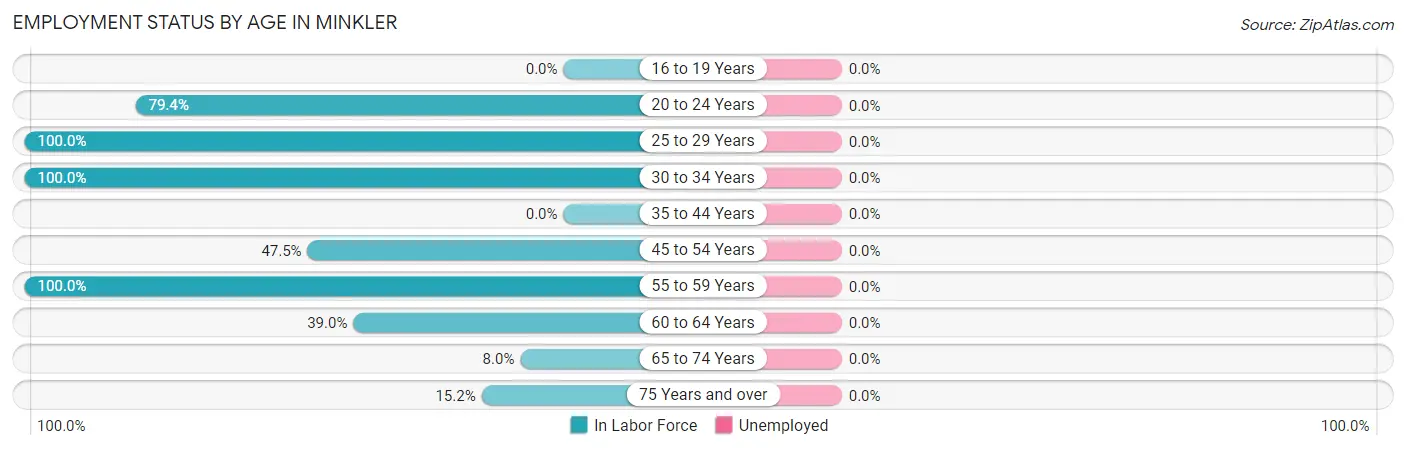
| Age Bracket | In Labor Force | Unemployed |
| 16 to 19 Years | 0 (0.0%) | 0 (0.0%) |
| 20 to 24 Years | 81 (79.4%) | 0 (0.0%) |
| 25 to 29 Years | 18 (100.0%) | 0 (0.0%) |
| 30 to 34 Years | 3 (100.0%) | 0 (0.0%) |
| 35 to 44 Years | 0 (0.0%) | 0 (0.0%) |
| 45 to 54 Years | 97 (47.5%) | 0 (0.0%) |
| 55 to 59 Years | 38 (100.0%) | 0 (0.0%) |
| 60 to 64 Years | 16 (39.0%) | 0 (0.0%) |
| 65 to 74 Years | 2 (8.0%) | 0 (0.0%) |
| 75 Years and over | 30 (15.2%) | 0 (0.0%) |
| Total | 285 (43.0%) | 0 (0.0%) |
Employment Status by Educational Attainment in Minkler
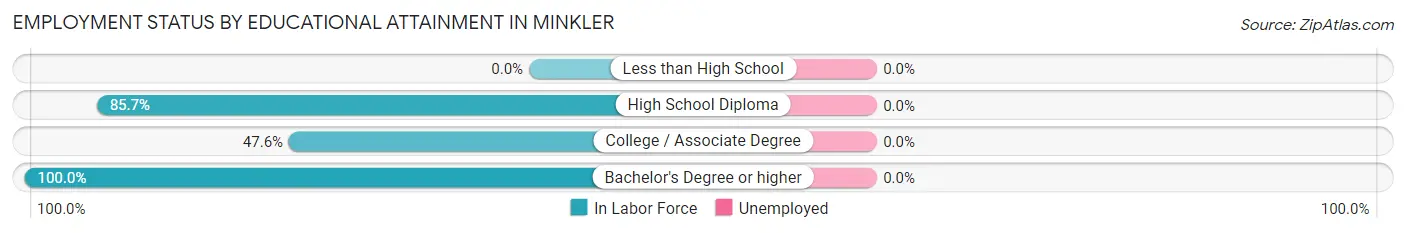
| Educational Attainment | In Labor Force | Unemployed |
| Less than High School | 0 (0.0%) | 0 (0.0%) |
| High School Diploma | 6 (85.7%) | 0 (0.0%) |
| College / Associate Degree | 119 (47.6%) | 0 (0.0%) |
| Bachelor's Degree or higher | 47 (100.0%) | 0 (0.0%) |
| Total | 172 (56.6%) | 0 (0.0%) |
Employment Occupations by Sex in Minkler
Management, Business, Science and Arts Occupations
The most common Management, Business, Science and Arts occupations in Minkler are Management (92 | 33.6%), Health Diagnosing & Treating (49 | 17.9%), Health Technologists (49 | 17.9%), and Business & Financial (2 | 0.7%).
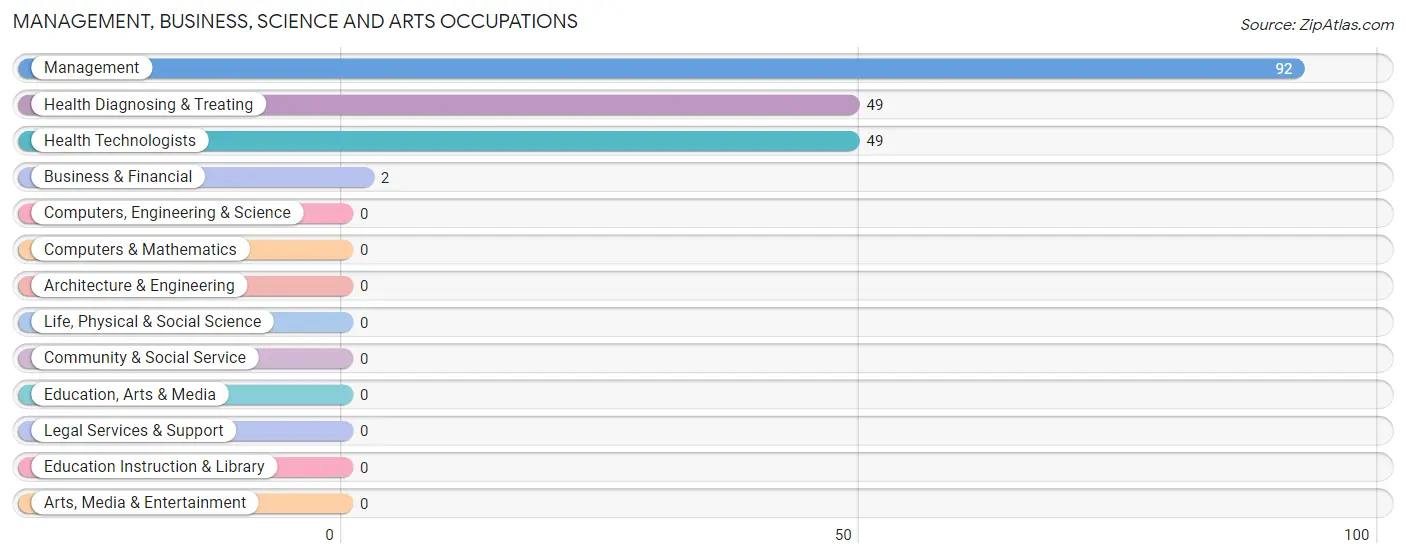
Management, Business, Science and Arts Occupations by Sex
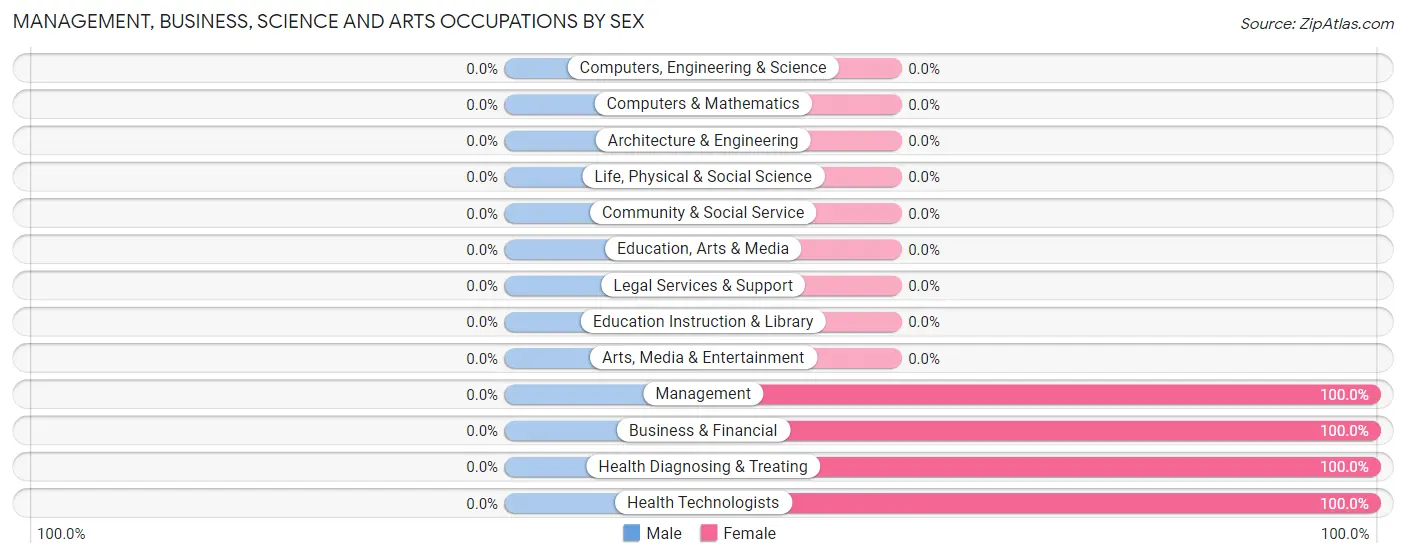
| Occupation | Male | Female |
| Management | 0 (0.0%) | 92 (100.0%) |
| Business & Financial | 0 (0.0%) | 2 (100.0%) |
| Computers, Engineering & Science | 0 (0.0%) | 0 (0.0%) |
| Computers & Mathematics | 0 (0.0%) | 0 (0.0%) |
| Architecture & Engineering | 0 (0.0%) | 0 (0.0%) |
| Life, Physical & Social Science | 0 (0.0%) | 0 (0.0%) |
| Community & Social Service | 0 (0.0%) | 0 (0.0%) |
| Education, Arts & Media | 0 (0.0%) | 0 (0.0%) |
| Legal Services & Support | 0 (0.0%) | 0 (0.0%) |
| Education Instruction & Library | 0 (0.0%) | 0 (0.0%) |
| Arts, Media & Entertainment | 0 (0.0%) | 0 (0.0%) |
| Health Diagnosing & Treating | 0 (0.0%) | 49 (100.0%) |
| Health Technologists | 0 (0.0%) | 49 (100.0%) |
| Total (Category) | 0 (0.0%) | 143 (100.0%) |
| Total (Overall) | 97 (35.4%) | 177 (64.6%) |
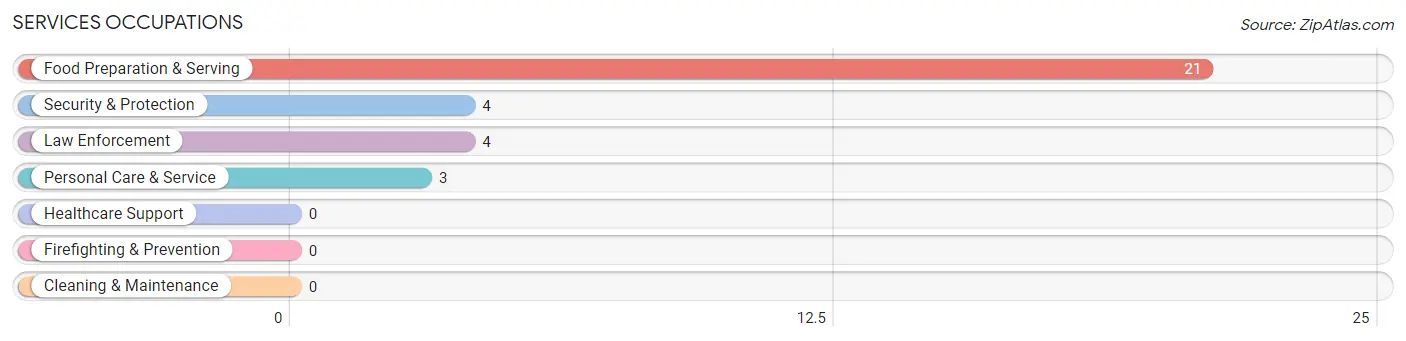
Services Occupations
The most common Services occupations in Minkler are Food Preparation & Serving (21 | 7.7%), Security & Protection (4 | 1.5%), Law Enforcement (4 | 1.5%), and Personal Care & Service (3 | 1.1%).
Services Occupations by Sex
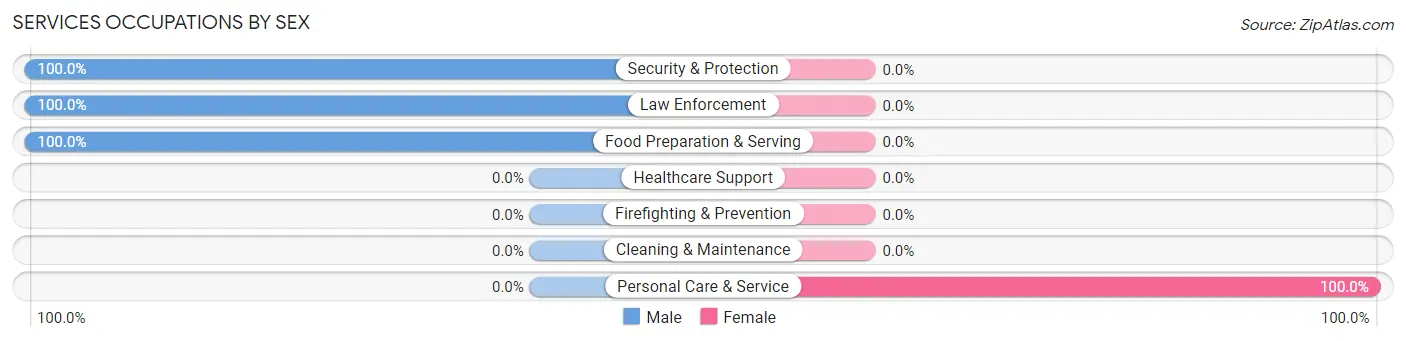
| Occupation | Male | Female |
| Healthcare Support | 0 (0.0%) | 0 (0.0%) |
| Security & Protection | 4 (100.0%) | 0 (0.0%) |
| Firefighting & Prevention | 0 (0.0%) | 0 (0.0%) |
| Law Enforcement | 4 (100.0%) | 0 (0.0%) |
| Food Preparation & Serving | 21 (100.0%) | 0 (0.0%) |
| Cleaning & Maintenance | 0 (0.0%) | 0 (0.0%) |
| Personal Care & Service | 0 (0.0%) | 3 (100.0%) |
| Total (Category) | 25 (89.3%) | 3 (10.7%) |
| Total (Overall) | 97 (35.4%) | 177 (64.6%) |
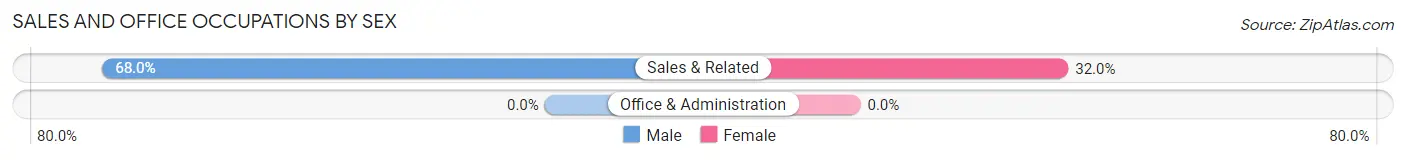
Sales and Office Occupations
The most common Sales and Office occupations in Minkler are , and Sales & Related (97 | 35.4%).
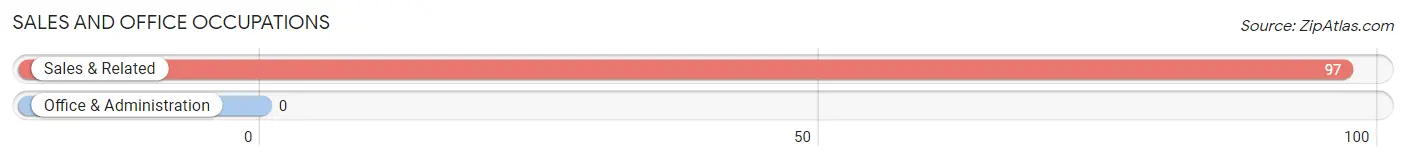
Sales and Office Occupations by Sex
| Occupation | Male | Female |
| Sales & Related | 66 (68.0%) | 31 (32.0%) |
| Office & Administration | 0 (0.0%) | 0 (0.0%) |
| Total (Category) | 66 (68.0%) | 31 (32.0%) |
| Total (Overall) | 97 (35.4%) | 177 (64.6%) |
Natural Resources, Construction and Maintenance Occupations
The most common Natural Resources, Construction and Maintenance occupations in Minkler are , and Construction & Extraction (6 | 2.2%).
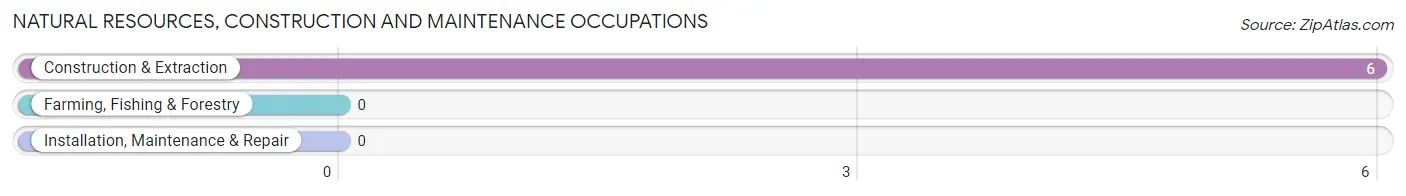
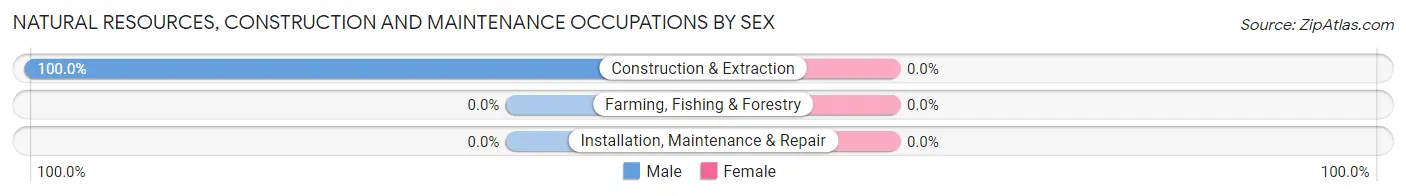
Natural Resources, Construction and Maintenance Occupations by Sex
| Occupation | Male | Female |
| Farming, Fishing & Forestry | 0 (0.0%) | 0 (0.0%) |
| Construction & Extraction | 6 (100.0%) | 0 (0.0%) |
| Installation, Maintenance & Repair | 0 (0.0%) | 0 (0.0%) |
| Total (Category) | 6 (100.0%) | 0 (0.0%) |
| Total (Overall) | 97 (35.4%) | 177 (64.6%) |
Production, Transportation and Moving Occupations
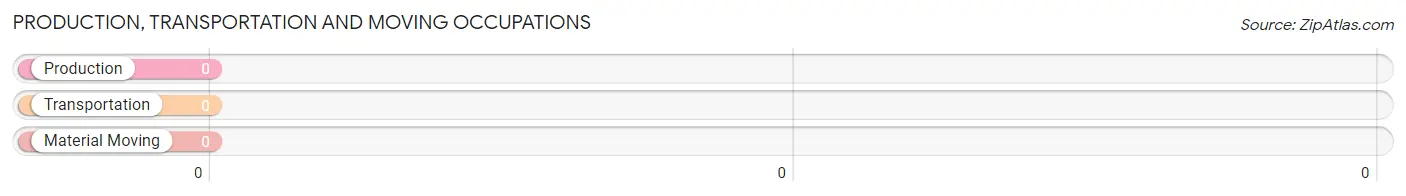
Production, Transportation and Moving Occupations by Sex
| Occupation | Male | Female |
| Production | 0 (0.0%) | 0 (0.0%) |
| Transportation | 0 (0.0%) | 0 (0.0%) |
| Material Moving | 0 (0.0%) | 0 (0.0%) |
| Total (Category) | 0 (0.0%) | 0 (0.0%) |
| Total (Overall) | 97 (35.4%) | 177 (64.6%) |
Employment Industries by Sex in Minkler
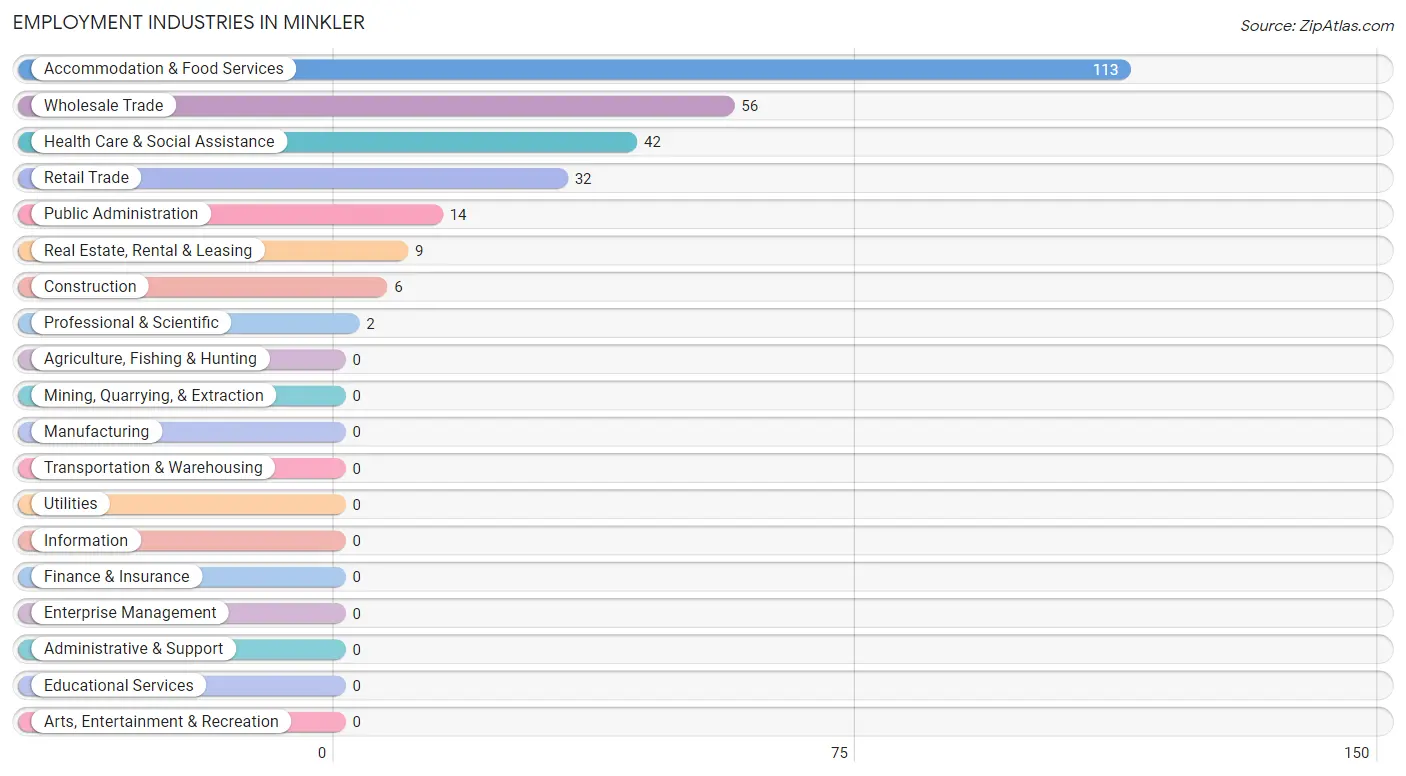
Employment Industries in Minkler
The major employment industries in Minkler include Accommodation & Food Services (113 | 41.2%), Wholesale Trade (56 | 20.4%), Health Care & Social Assistance (42 | 15.3%), Retail Trade (32 | 11.7%), and Public Administration (14 | 5.1%).
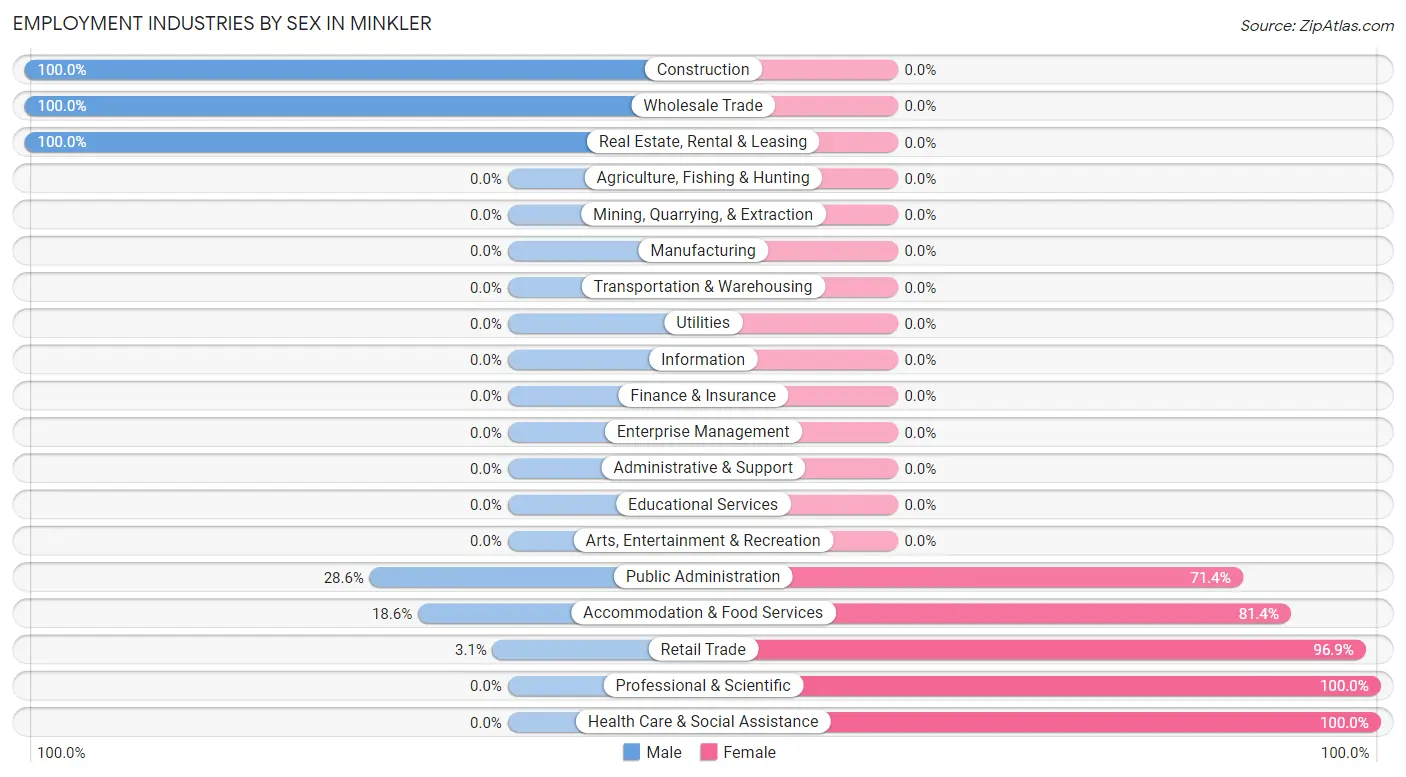
Employment Industries by Sex in Minkler
The Minkler industries that see more men than women are Construction (100.0%), Wholesale Trade (100.0%), and Real Estate, Rental & Leasing (100.0%), whereas the industries that tend to have a higher number of women are Professional & Scientific (100.0%), Health Care & Social Assistance (100.0%), and Retail Trade (96.9%).
| Industry | Male | Female |
| Agriculture, Fishing & Hunting | 0 (0.0%) | 0 (0.0%) |
| Mining, Quarrying, & Extraction | 0 (0.0%) | 0 (0.0%) |
| Construction | 6 (100.0%) | 0 (0.0%) |
| Manufacturing | 0 (0.0%) | 0 (0.0%) |
| Wholesale Trade | 56 (100.0%) | 0 (0.0%) |
| Retail Trade | 1 (3.1%) | 31 (96.9%) |
| Transportation & Warehousing | 0 (0.0%) | 0 (0.0%) |
| Utilities | 0 (0.0%) | 0 (0.0%) |
| Information | 0 (0.0%) | 0 (0.0%) |
| Finance & Insurance | 0 (0.0%) | 0 (0.0%) |
| Real Estate, Rental & Leasing | 9 (100.0%) | 0 (0.0%) |
| Professional & Scientific | 0 (0.0%) | 2 (100.0%) |
| Enterprise Management | 0 (0.0%) | 0 (0.0%) |
| Administrative & Support | 0 (0.0%) | 0 (0.0%) |
| Educational Services | 0 (0.0%) | 0 (0.0%) |
| Health Care & Social Assistance | 0 (0.0%) | 42 (100.0%) |
| Arts, Entertainment & Recreation | 0 (0.0%) | 0 (0.0%) |
| Accommodation & Food Services | 21 (18.6%) | 92 (81.4%) |
| Public Administration | 4 (28.6%) | 10 (71.4%) |
| Total | 97 (35.4%) | 177 (64.6%) |
Education in Minkler
School Enrollment in Minkler
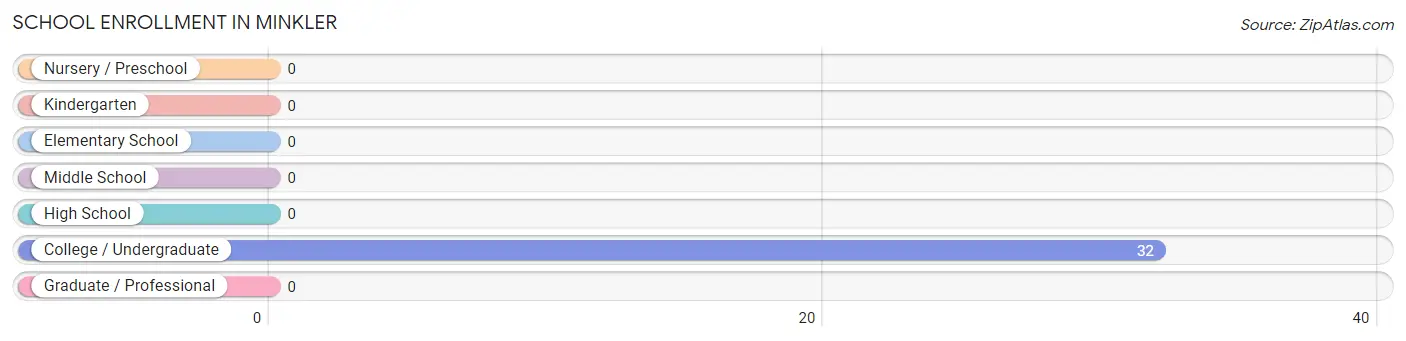
| School Level | # Students | % Students |
| Nursery / Preschool | 0 | 0.0% |
| Kindergarten | 0 | 0.0% |
| Elementary School | 0 | 0.0% |
| Middle School | 0 | 0.0% |
| High School | 0 | 0.0% |
| College / Undergraduate | 32 | 100.0% |
| Graduate / Professional | 0 | 0.0% |
| Total | 32 | 100.0% |
School Enrollment by Age by Funding Source in Minkler
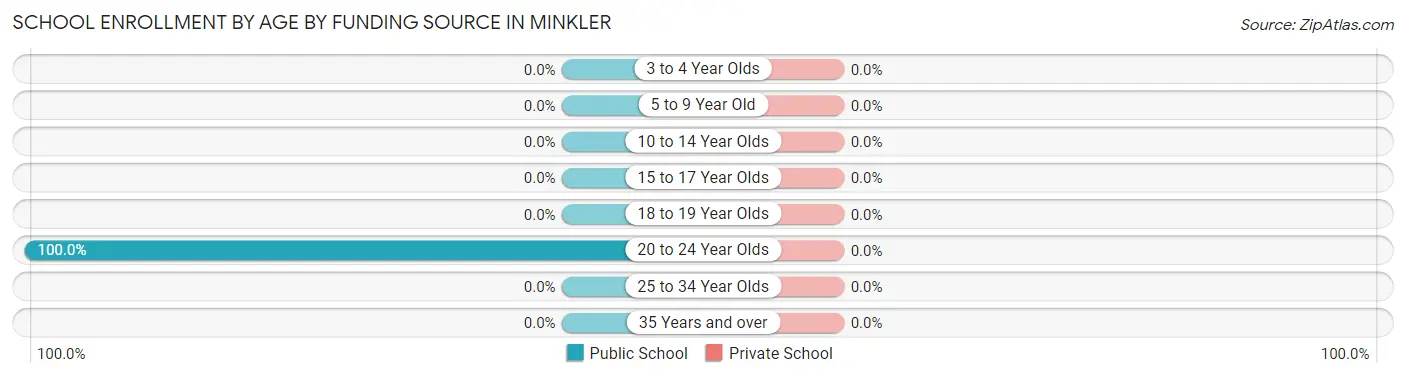
| Age Bracket | Public School | Private School |
| 3 to 4 Year Olds | 0 (0.0%) | 0 (0.0%) |
| 5 to 9 Year Old | 0 (0.0%) | 0 (0.0%) |
| 10 to 14 Year Olds | 0 (0.0%) | 0 (0.0%) |
| 15 to 17 Year Olds | 0 (0.0%) | 0 (0.0%) |
| 18 to 19 Year Olds | 0 (0.0%) | 0 (0.0%) |
| 20 to 24 Year Olds | 32 (100.0%) | 0 (0.0%) |
| 25 to 34 Year Olds | 0 (0.0%) | 0 (0.0%) |
| 35 Years and over | 0 (0.0%) | 0 (0.0%) |
| Total | 32 (100.0%) | 0 (0.0%) |
Educational Attainment by Field of Study in Minkler
Liberal arts & history (32 | 33.0%), literature & languages (30 | 30.9%), business (17 | 17.5%), education (16 | 16.5%), and bio, nature & agricultural (2 | 2.1%) are the most common fields of study among 97 individuals in Minkler who have obtained a bachelor's degree or higher.
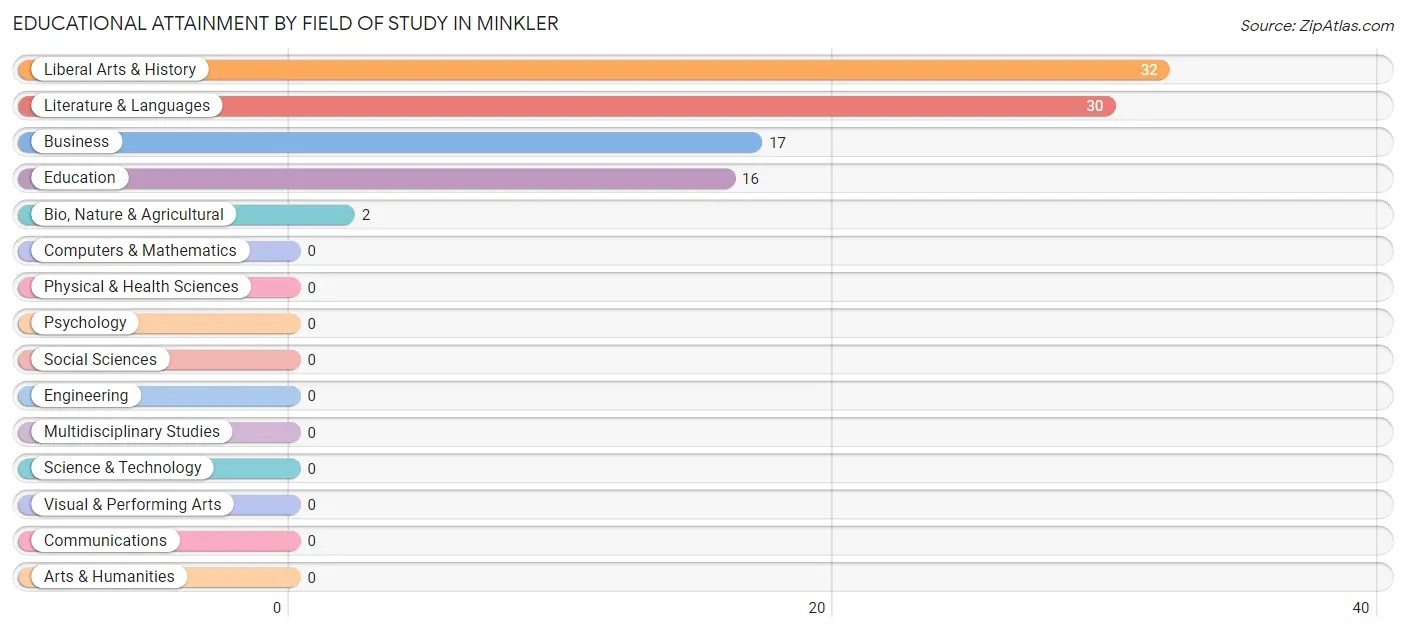
| Field of Study | # Graduates | % Graduates |
| Computers & Mathematics | 0 | 0.0% |
| Bio, Nature & Agricultural | 2 | 2.1% |
| Physical & Health Sciences | 0 | 0.0% |
| Psychology | 0 | 0.0% |
| Social Sciences | 0 | 0.0% |
| Engineering | 0 | 0.0% |
| Multidisciplinary Studies | 0 | 0.0% |
| Science & Technology | 0 | 0.0% |
| Business | 17 | 17.5% |
| Education | 16 | 16.5% |
| Literature & Languages | 30 | 30.9% |
| Liberal Arts & History | 32 | 33.0% |
| Visual & Performing Arts | 0 | 0.0% |
| Communications | 0 | 0.0% |
| Arts & Humanities | 0 | 0.0% |
| Total | 97 | 100.0% |
Transportation & Commute in Minkler
Vehicle Availability by Sex in Minkler
The most prevalent vehicle ownership categories in Minkler are males with 2 vehicles (66, accounting for 61.1%) and females with 2 vehicles (164, making up 37.3%).
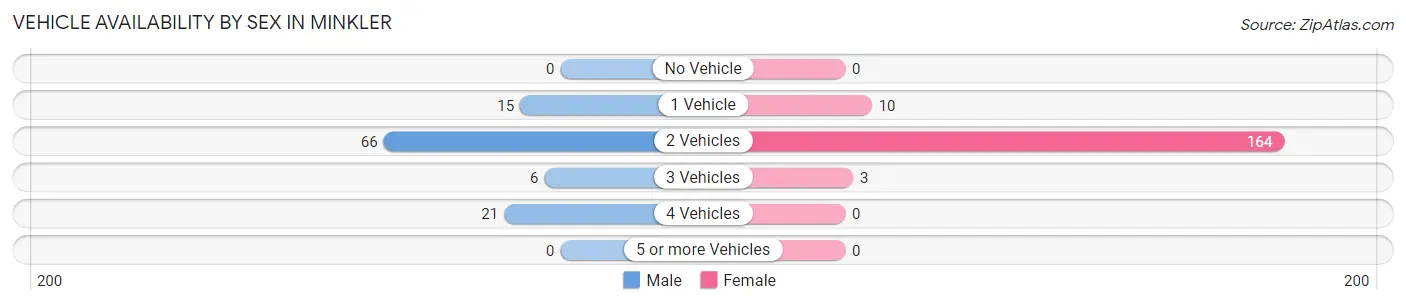
| Vehicles Available | Male | Female |
| No Vehicle | 0 (0.0%) | 0 (0.0%) |
| 1 Vehicle | 15 (13.9%) | 10 (5.7%) |
| 2 Vehicles | 66 (61.1%) | 164 (92.7%) |
| 3 Vehicles | 6 (5.6%) | 3 (1.7%) |
| 4 Vehicles | 21 (19.4%) | 0 (0.0%) |
| 5 or more Vehicles | 0 (0.0%) | 0 (0.0%) |
| Total | 108 (100.0%) | 177 (100.0%) |
Commute Time in Minkler
The most frequently occuring commute durations in Minkler are 30 to 34 minutes (77 commuters, 46.9%), 20 to 24 minutes (49 commuters, 29.9%), and 90 or more minutes (15 commuters, 9.1%).
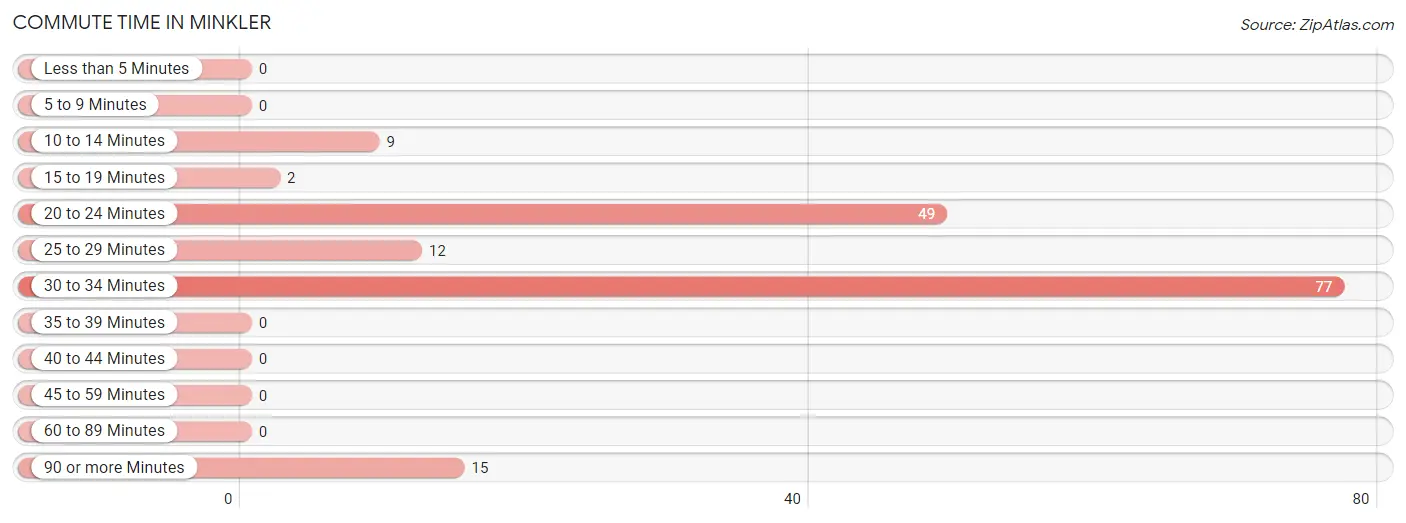
| Commute Time | # Commuters | % Commuters |
| Less than 5 Minutes | 0 | 0.0% |
| 5 to 9 Minutes | 0 | 0.0% |
| 10 to 14 Minutes | 9 | 5.5% |
| 15 to 19 Minutes | 2 | 1.2% |
| 20 to 24 Minutes | 49 | 29.9% |
| 25 to 29 Minutes | 12 | 7.3% |
| 30 to 34 Minutes | 77 | 46.9% |
| 35 to 39 Minutes | 0 | 0.0% |
| 40 to 44 Minutes | 0 | 0.0% |
| 45 to 59 Minutes | 0 | 0.0% |
| 60 to 89 Minutes | 0 | 0.0% |
| 90 or more Minutes | 15 | 9.1% |
Commute Time by Sex in Minkler
The most common commute times in Minkler are 30 to 34 minutes (47 commuters, 54.0%) for males and 20 to 24 minutes (33 commuters, 42.9%) for females.
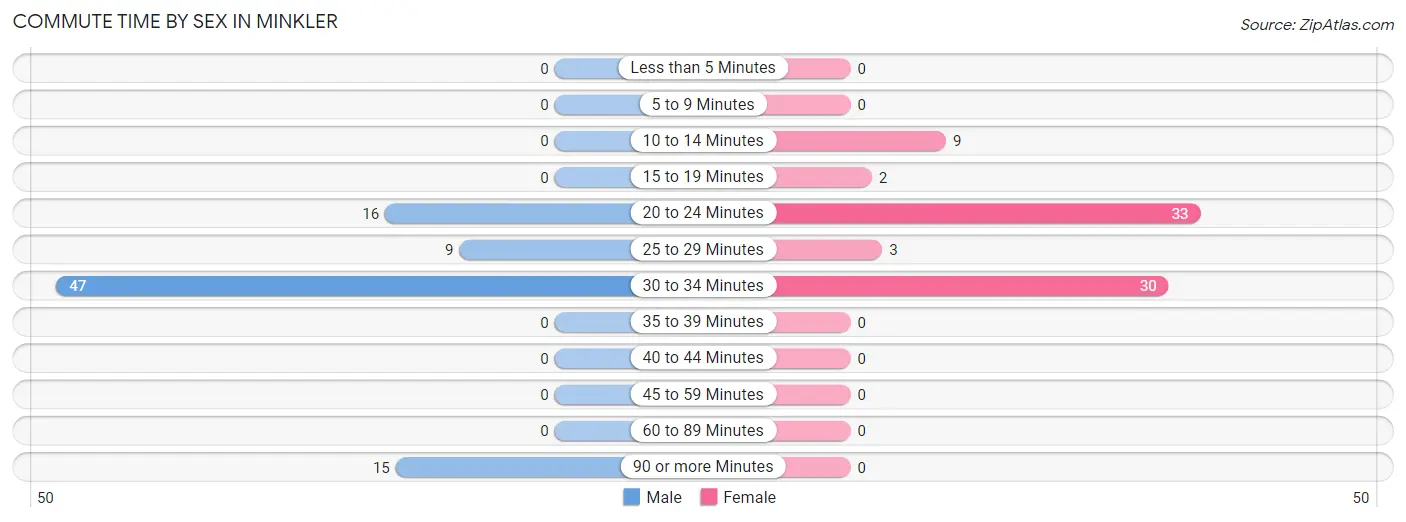
| Commute Time | Male | Female |
| Less than 5 Minutes | 0 (0.0%) | 0 (0.0%) |
| 5 to 9 Minutes | 0 (0.0%) | 0 (0.0%) |
| 10 to 14 Minutes | 0 (0.0%) | 9 (11.7%) |
| 15 to 19 Minutes | 0 (0.0%) | 2 (2.6%) |
| 20 to 24 Minutes | 16 (18.4%) | 33 (42.9%) |
| 25 to 29 Minutes | 9 (10.3%) | 3 (3.9%) |
| 30 to 34 Minutes | 47 (54.0%) | 30 (39.0%) |
| 35 to 39 Minutes | 0 (0.0%) | 0 (0.0%) |
| 40 to 44 Minutes | 0 (0.0%) | 0 (0.0%) |
| 45 to 59 Minutes | 0 (0.0%) | 0 (0.0%) |
| 60 to 89 Minutes | 0 (0.0%) | 0 (0.0%) |
| 90 or more Minutes | 15 (17.2%) | 0 (0.0%) |
Time of Departure to Work by Sex in Minkler
The most frequent times of departure to work in Minkler are 7:00 AM to 7:29 AM (56, 64.4%) for males and 7:00 AM to 7:29 AM (63, 81.8%) for females.
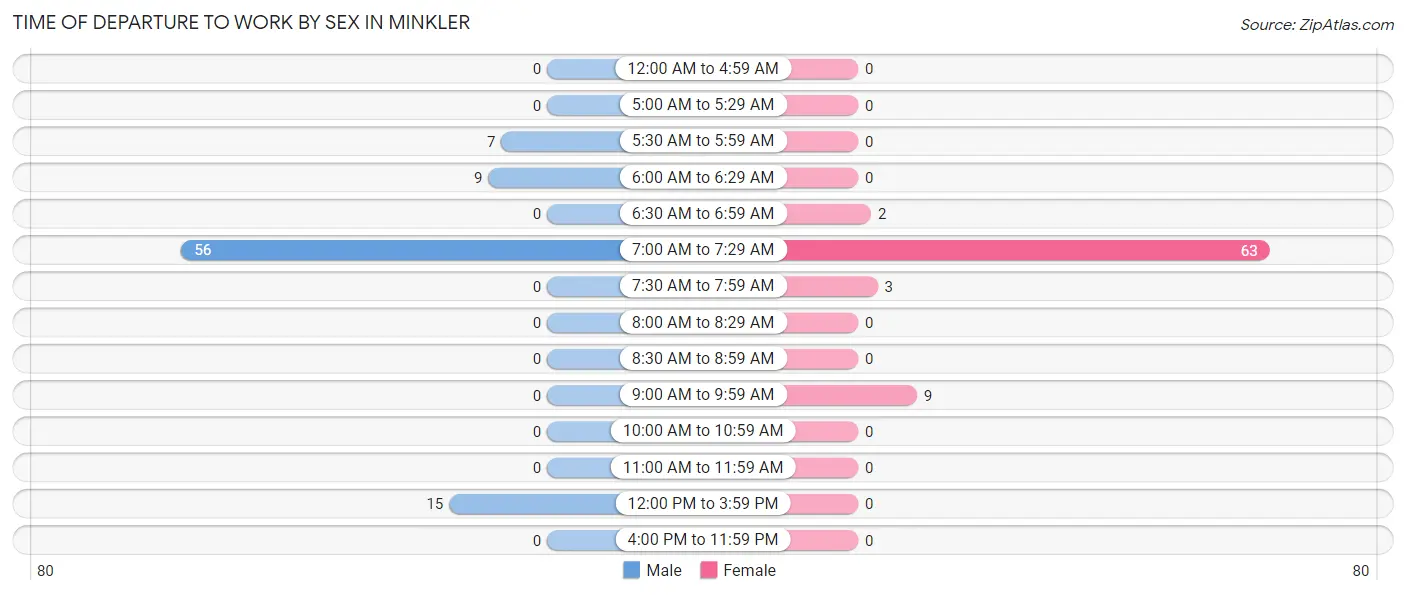
| Time of Departure | Male | Female |
| 12:00 AM to 4:59 AM | 0 (0.0%) | 0 (0.0%) |
| 5:00 AM to 5:29 AM | 0 (0.0%) | 0 (0.0%) |
| 5:30 AM to 5:59 AM | 7 (8.1%) | 0 (0.0%) |
| 6:00 AM to 6:29 AM | 9 (10.3%) | 0 (0.0%) |
| 6:30 AM to 6:59 AM | 0 (0.0%) | 2 (2.6%) |
| 7:00 AM to 7:29 AM | 56 (64.4%) | 63 (81.8%) |
| 7:30 AM to 7:59 AM | 0 (0.0%) | 3 (3.9%) |
| 8:00 AM to 8:29 AM | 0 (0.0%) | 0 (0.0%) |
| 8:30 AM to 8:59 AM | 0 (0.0%) | 0 (0.0%) |
| 9:00 AM to 9:59 AM | 0 (0.0%) | 9 (11.7%) |
| 10:00 AM to 10:59 AM | 0 (0.0%) | 0 (0.0%) |
| 11:00 AM to 11:59 AM | 0 (0.0%) | 0 (0.0%) |
| 12:00 PM to 3:59 PM | 15 (17.2%) | 0 (0.0%) |
| 4:00 PM to 11:59 PM | 0 (0.0%) | 0 (0.0%) |
| Total | 87 (100.0%) | 77 (100.0%) |
Housing Occupancy in Minkler
Occupancy by Ownership in Minkler
Of the total 365 dwellings in Minkler, owner-occupied units account for 284 (77.8%), while renter-occupied units make up 81 (22.2%).
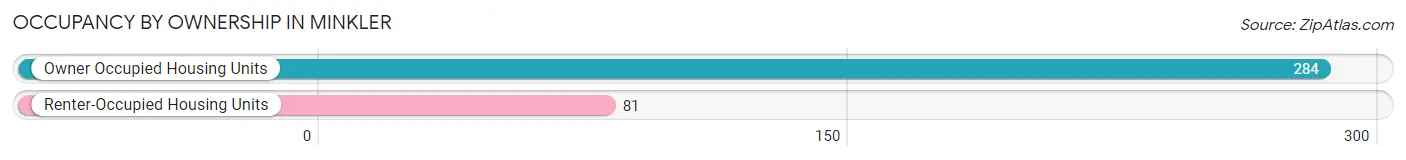
| Occupancy | # Housing Units | % Housing Units |
| Owner Occupied Housing Units | 284 | 77.8% |
| Renter-Occupied Housing Units | 81 | 22.2% |
| Total Occupied Housing Units | 365 | 100.0% |
Occupancy by Household Size in Minkler
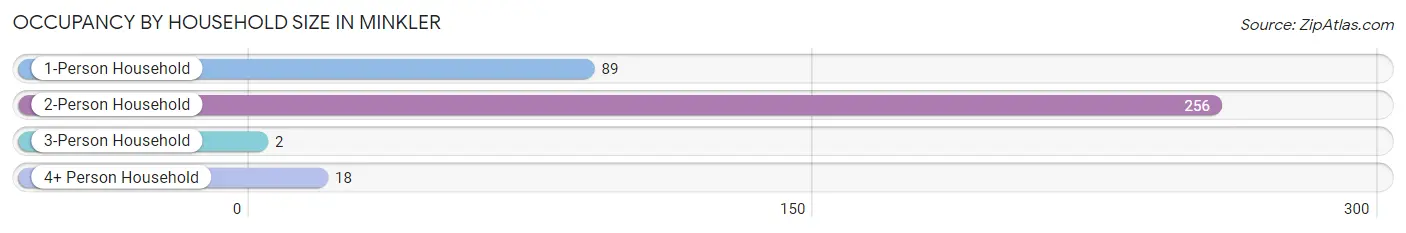
| Household Size | # Housing Units | % Housing Units |
| 1-Person Household | 89 | 24.4% |
| 2-Person Household | 256 | 70.1% |
| 3-Person Household | 2 | 0.5% |
| 4+ Person Household | 18 | 4.9% |
| Total Housing Units | 365 | 100.0% |
Occupancy by Ownership by Household Size in Minkler
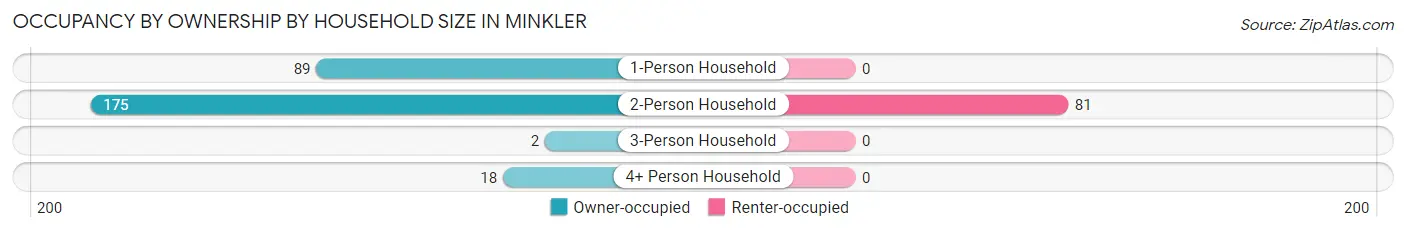
| Household Size | Owner-occupied | Renter-occupied |
| 1-Person Household | 89 (100.0%) | 0 (0.0%) |
| 2-Person Household | 175 (68.4%) | 81 (31.6%) |
| 3-Person Household | 2 (100.0%) | 0 (0.0%) |
| 4+ Person Household | 18 (100.0%) | 0 (0.0%) |
| Total Housing Units | 284 (77.8%) | 81 (22.2%) |
Occupancy by Educational Attainment in Minkler
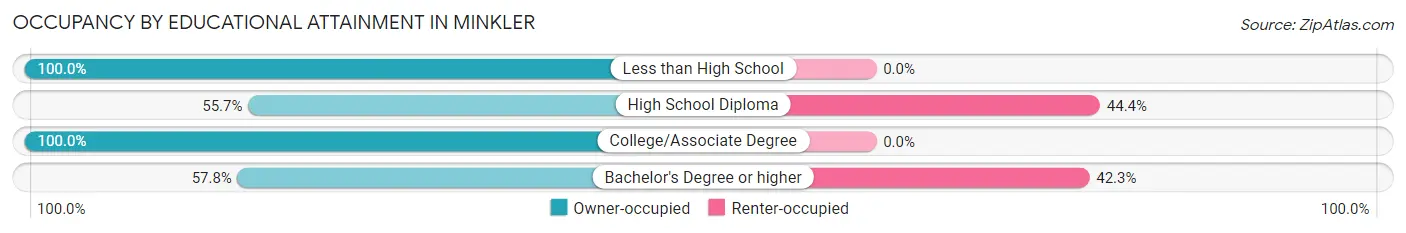
| Household Size | Owner-occupied | Renter-occupied |
| Less than High School | 22 (100.0%) | 0 (0.0%) |
| High School Diploma | 64 (55.6%) | 51 (44.4%) |
| College/Associate Degree | 157 (100.0%) | 0 (0.0%) |
| Bachelor's Degree or higher | 41 (57.8%) | 30 (42.2%) |
Occupancy by Age of Householder in Minkler
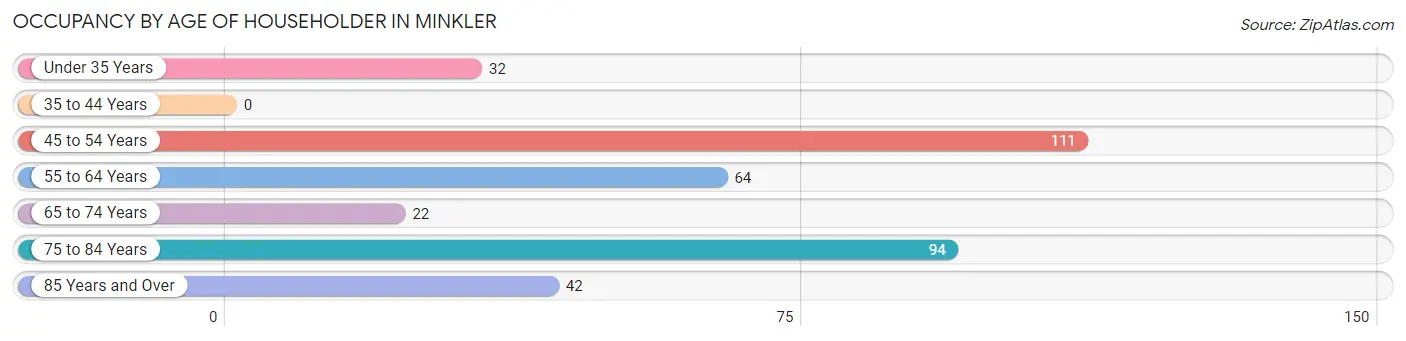
| Age Bracket | # Households | % Households |
| Under 35 Years | 32 | 8.8% |
| 35 to 44 Years | 0 | 0.0% |
| 45 to 54 Years | 111 | 30.4% |
| 55 to 64 Years | 64 | 17.5% |
| 65 to 74 Years | 22 | 6.0% |
| 75 to 84 Years | 94 | 25.8% |
| 85 Years and Over | 42 | 11.5% |
| Total | 365 | 100.0% |
Housing Finances in Minkler
Median Income by Occupancy in Minkler
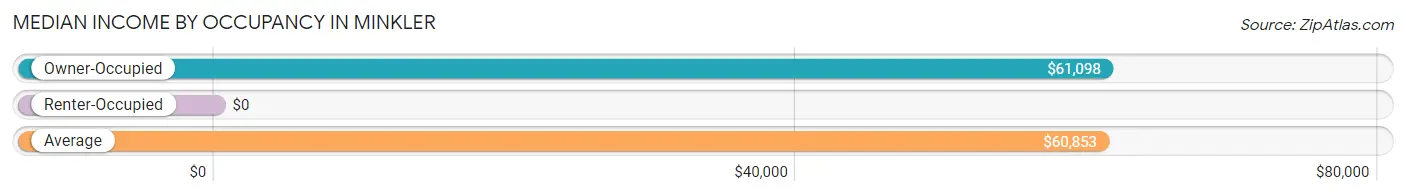
| Occupancy Type | # Households | Median Income |
| Owner-Occupied | 284 (77.8%) | $61,098 |
| Renter-Occupied | 81 (22.2%) | $0 |
| Average | 365 (100.0%) | $60,853 |
Occupancy by Householder Income Bracket in Minkler
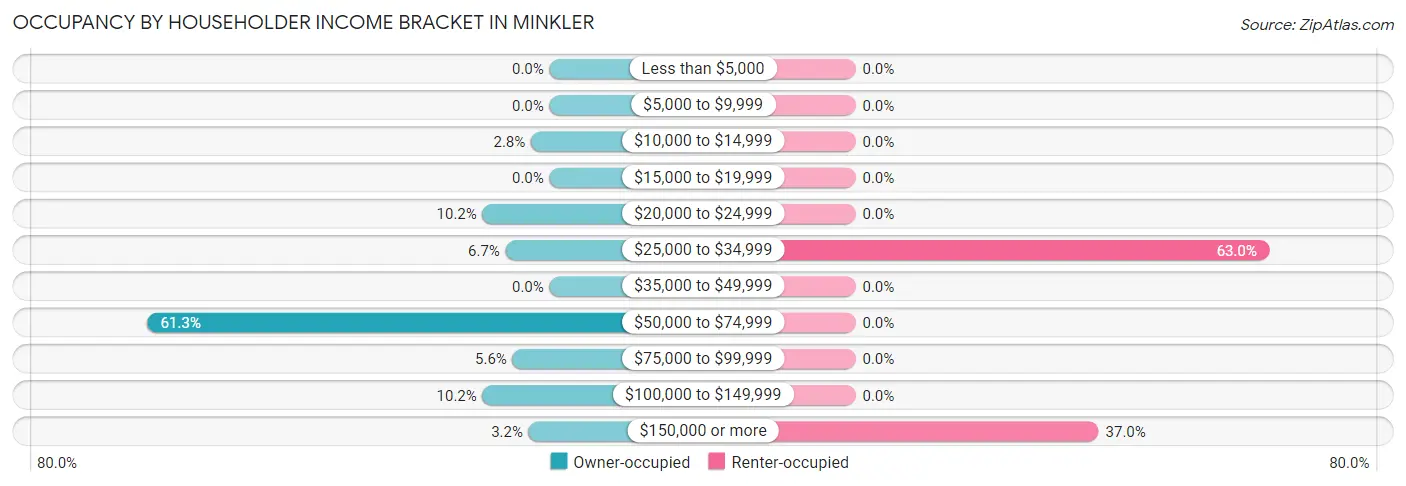
| Income Bracket | Owner-occupied | Renter-occupied |
| Less than $5,000 | 0 (0.0%) | 0 (0.0%) |
| $5,000 to $9,999 | 0 (0.0%) | 0 (0.0%) |
| $10,000 to $14,999 | 8 (2.8%) | 0 (0.0%) |
| $15,000 to $19,999 | 0 (0.0%) | 0 (0.0%) |
| $20,000 to $24,999 | 29 (10.2%) | 0 (0.0%) |
| $25,000 to $34,999 | 19 (6.7%) | 51 (63.0%) |
| $35,000 to $49,999 | 0 (0.0%) | 0 (0.0%) |
| $50,000 to $74,999 | 174 (61.3%) | 0 (0.0%) |
| $75,000 to $99,999 | 16 (5.6%) | 0 (0.0%) |
| $100,000 to $149,999 | 29 (10.2%) | 0 (0.0%) |
| $150,000 or more | 9 (3.2%) | 30 (37.0%) |
| Total | 284 (100.0%) | 81 (100.0%) |
Monthly Housing Cost Tiers in Minkler
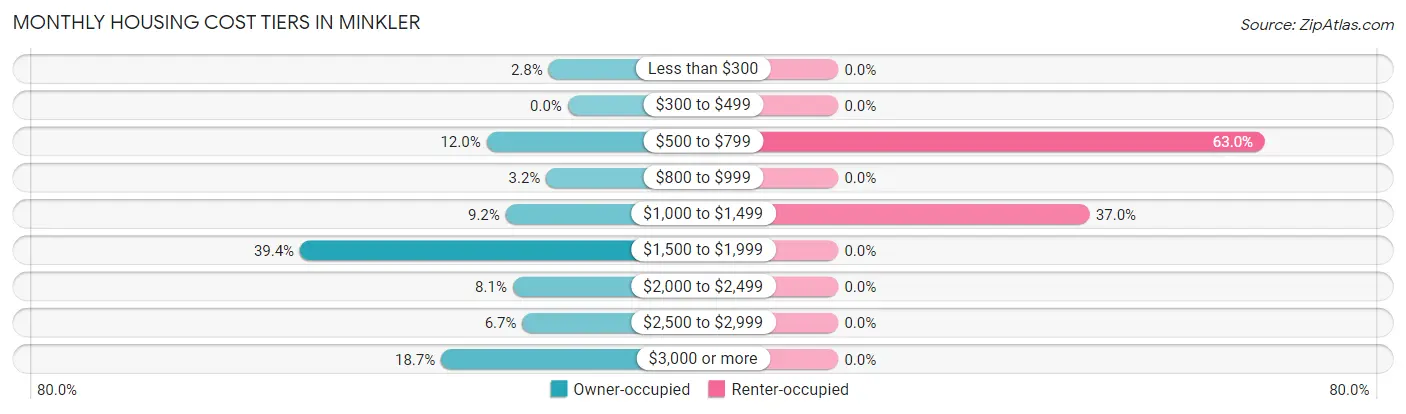
| Monthly Cost | Owner-occupied | Renter-occupied |
| Less than $300 | 8 (2.8%) | 0 (0.0%) |
| $300 to $499 | 0 (0.0%) | 0 (0.0%) |
| $500 to $799 | 34 (12.0%) | 51 (63.0%) |
| $800 to $999 | 9 (3.2%) | 0 (0.0%) |
| $1,000 to $1,499 | 26 (9.1%) | 30 (37.0%) |
| $1,500 to $1,999 | 112 (39.4%) | 0 (0.0%) |
| $2,000 to $2,499 | 23 (8.1%) | 0 (0.0%) |
| $2,500 to $2,999 | 19 (6.7%) | 0 (0.0%) |
| $3,000 or more | 53 (18.7%) | 0 (0.0%) |
| Total | 284 (100.0%) | 81 (100.0%) |
Physical Housing Characteristics in Minkler
Housing Structures in Minkler
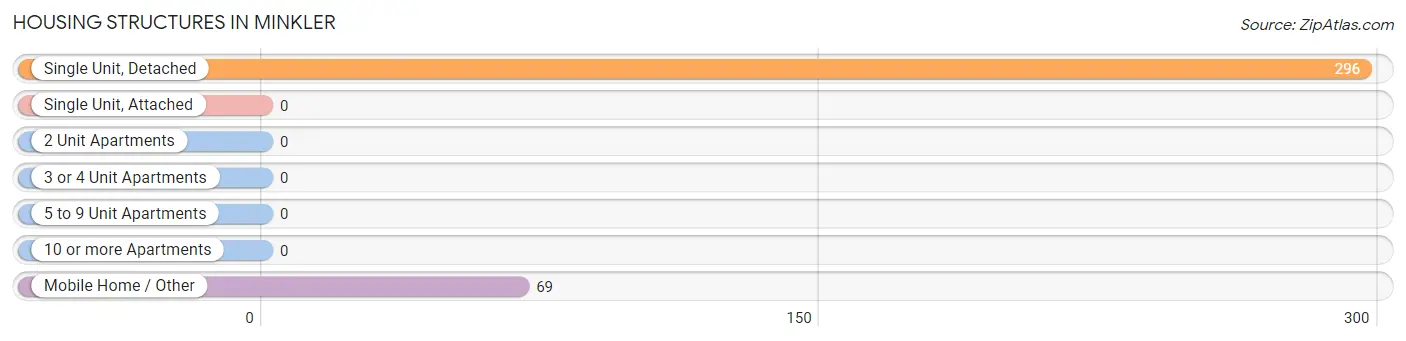
| Structure Type | # Housing Units | % Housing Units |
| Single Unit, Detached | 296 | 81.1% |
| Single Unit, Attached | 0 | 0.0% |
| 2 Unit Apartments | 0 | 0.0% |
| 3 or 4 Unit Apartments | 0 | 0.0% |
| 5 to 9 Unit Apartments | 0 | 0.0% |
| 10 or more Apartments | 0 | 0.0% |
| Mobile Home / Other | 69 | 18.9% |
| Total | 365 | 100.0% |
Housing Structures by Occupancy in Minkler
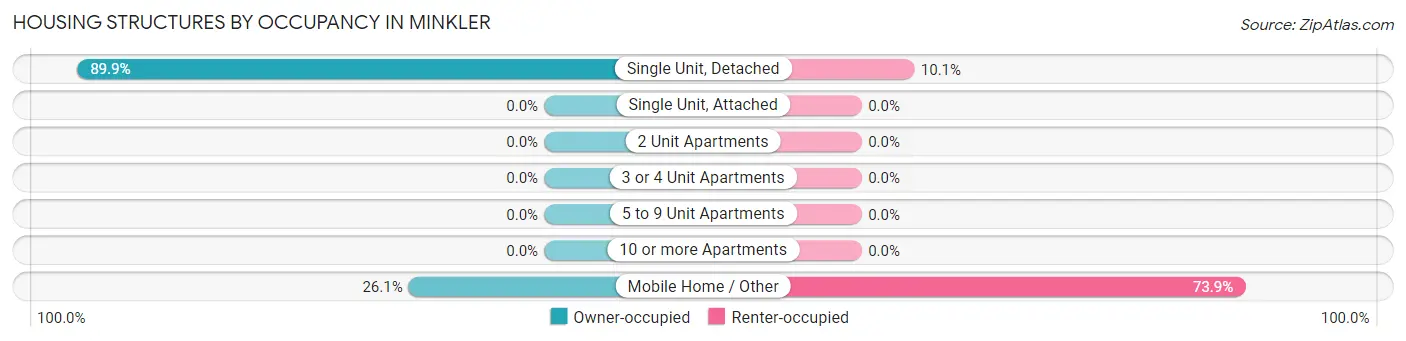
| Structure Type | Owner-occupied | Renter-occupied |
| Single Unit, Detached | 266 (89.9%) | 30 (10.1%) |
| Single Unit, Attached | 0 (0.0%) | 0 (0.0%) |
| 2 Unit Apartments | 0 (0.0%) | 0 (0.0%) |
| 3 or 4 Unit Apartments | 0 (0.0%) | 0 (0.0%) |
| 5 to 9 Unit Apartments | 0 (0.0%) | 0 (0.0%) |
| 10 or more Apartments | 0 (0.0%) | 0 (0.0%) |
| Mobile Home / Other | 18 (26.1%) | 51 (73.9%) |
| Total | 284 (77.8%) | 81 (22.2%) |
Housing Structures by Number of Rooms in Minkler
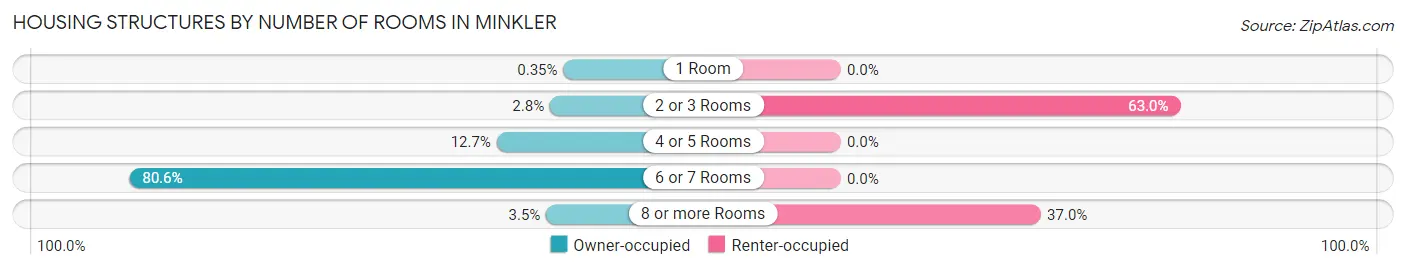
| Number of Rooms | Owner-occupied | Renter-occupied |
| 1 Room | 1 (0.4%) | 0 (0.0%) |
| 2 or 3 Rooms | 8 (2.8%) | 51 (63.0%) |
| 4 or 5 Rooms | 36 (12.7%) | 0 (0.0%) |
| 6 or 7 Rooms | 229 (80.6%) | 0 (0.0%) |
| 8 or more Rooms | 10 (3.5%) | 30 (37.0%) |
| Total | 284 (100.0%) | 81 (100.0%) |
Housing Structure by Heating Type in Minkler
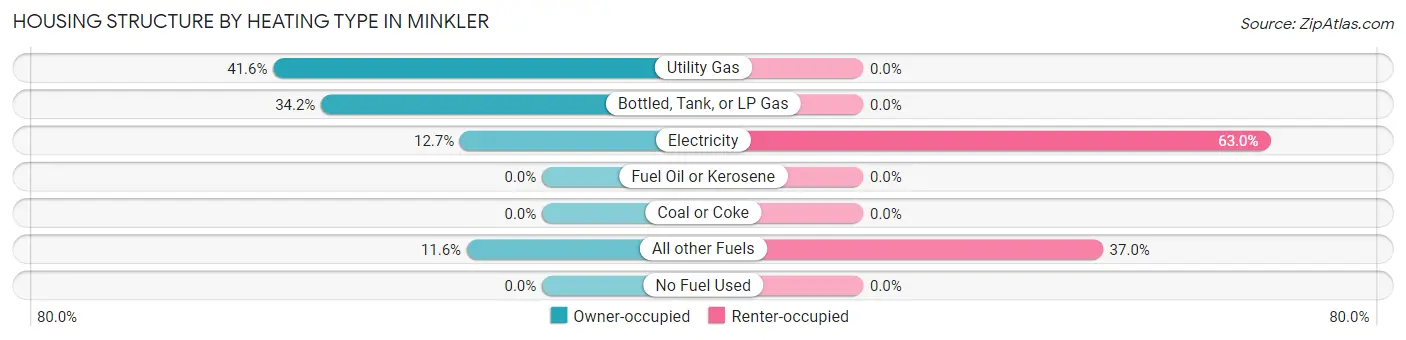
| Heating Type | Owner-occupied | Renter-occupied |
| Utility Gas | 118 (41.5%) | 0 (0.0%) |
| Bottled, Tank, or LP Gas | 97 (34.2%) | 0 (0.0%) |
| Electricity | 36 (12.7%) | 51 (63.0%) |
| Fuel Oil or Kerosene | 0 (0.0%) | 0 (0.0%) |
| Coal or Coke | 0 (0.0%) | 0 (0.0%) |
| All other Fuels | 33 (11.6%) | 30 (37.0%) |
| No Fuel Used | 0 (0.0%) | 0 (0.0%) |
| Total | 284 (100.0%) | 81 (100.0%) |
Household Vehicle Usage in Minkler
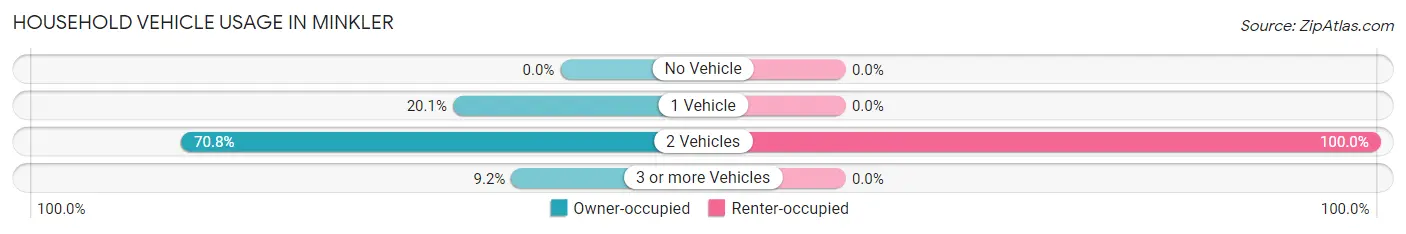
| Vehicles per Household | Owner-occupied | Renter-occupied |
| No Vehicle | 0 (0.0%) | 0 (0.0%) |
| 1 Vehicle | 57 (20.1%) | 0 (0.0%) |
| 2 Vehicles | 201 (70.8%) | 81 (100.0%) |
| 3 or more Vehicles | 26 (9.1%) | 0 (0.0%) |
| Total | 284 (100.0%) | 81 (100.0%) |
Real Estate & Mortgages in Minkler
Real Estate and Mortgage Overview in Minkler
| Characteristic | Without Mortgage | With Mortgage |
| Housing Units | 67 | 217 |
| Median Property Value | $368,900 | $598,500 |
| Median Household Income | - | - |
| Monthly Housing Costs | $667 | $53 |
| Real Estate Taxes | $3,068 | $0 |
Property Value by Mortgage Status in Minkler
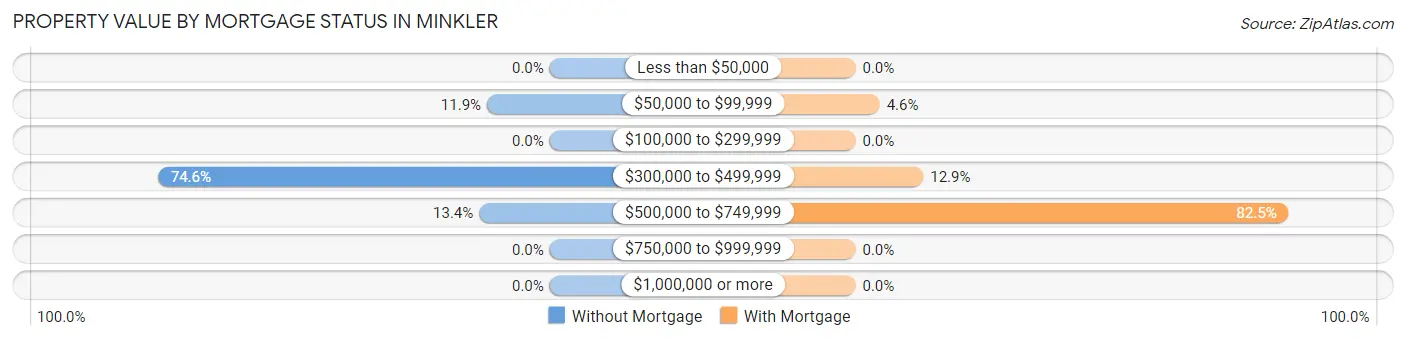
| Property Value | Without Mortgage | With Mortgage |
| Less than $50,000 | 0 (0.0%) | 0 (0.0%) |
| $50,000 to $99,999 | 8 (11.9%) | 10 (4.6%) |
| $100,000 to $299,999 | 0 (0.0%) | 0 (0.0%) |
| $300,000 to $499,999 | 50 (74.6%) | 28 (12.9%) |
| $500,000 to $749,999 | 9 (13.4%) | 179 (82.5%) |
| $750,000 to $999,999 | 0 (0.0%) | 0 (0.0%) |
| $1,000,000 or more | 0 (0.0%) | 0 (0.0%) |
| Total | 67 (100.0%) | 217 (100.0%) |
Household Income by Mortgage Status in Minkler
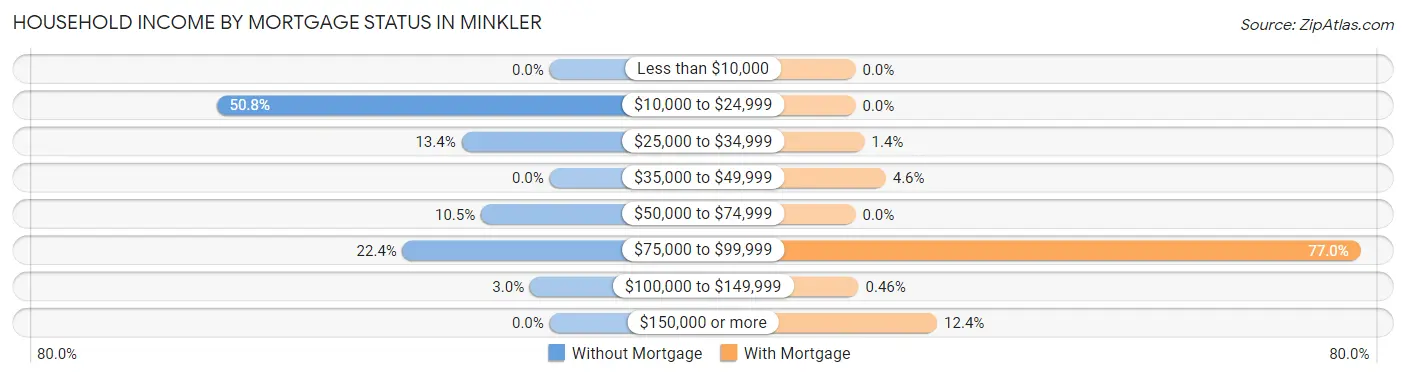
| Household Income | Without Mortgage | With Mortgage |
| Less than $10,000 | 0 (0.0%) | 0 (0.0%) |
| $10,000 to $24,999 | 34 (50.7%) | 0 (0.0%) |
| $25,000 to $34,999 | 9 (13.4%) | 3 (1.4%) |
| $35,000 to $49,999 | 0 (0.0%) | 10 (4.6%) |
| $50,000 to $74,999 | 7 (10.4%) | 0 (0.0%) |
| $75,000 to $99,999 | 15 (22.4%) | 167 (77.0%) |
| $100,000 to $149,999 | 2 (3.0%) | 1 (0.5%) |
| $150,000 or more | 0 (0.0%) | 27 (12.4%) |
| Total | 67 (100.0%) | 217 (100.0%) |
Property Value to Household Income Ratio in Minkler
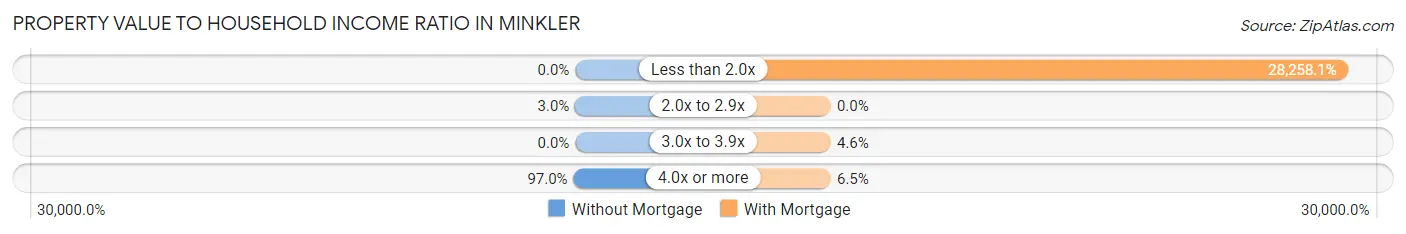
| Value-to-Income Ratio | Without Mortgage | With Mortgage |
| Less than 2.0x | 0 (0.0%) | 61,320 (28,258.1%) |
| 2.0x to 2.9x | 2 (3.0%) | 0 (0.0%) |
| 3.0x to 3.9x | 0 (0.0%) | 10 (4.6%) |
| 4.0x or more | 65 (97.0%) | 14 (6.5%) |
| Total | 67 (100.0%) | 217 (100.0%) |
Real Estate Taxes by Mortgage Status in Minkler
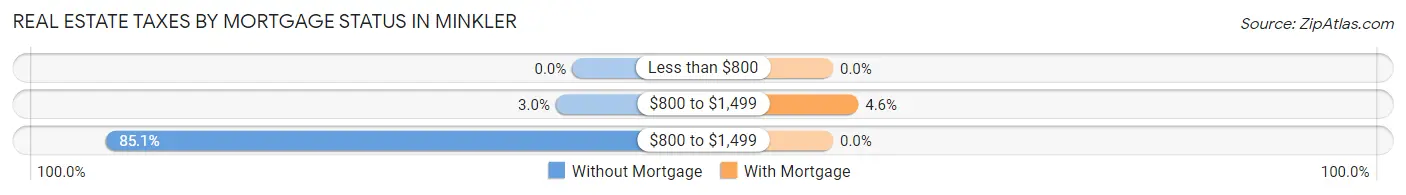
| Property Taxes | Without Mortgage | With Mortgage |
| Less than $800 | 0 (0.0%) | 0 (0.0%) |
| $800 to $1,499 | 2 (3.0%) | 10 (4.6%) |
| $800 to $1,499 | 57 (85.1%) | 0 (0.0%) |
| Total | 67 (100.0%) | 217 (100.0%) |
Health & Disability in Minkler
Health Insurance Coverage by Age in Minkler
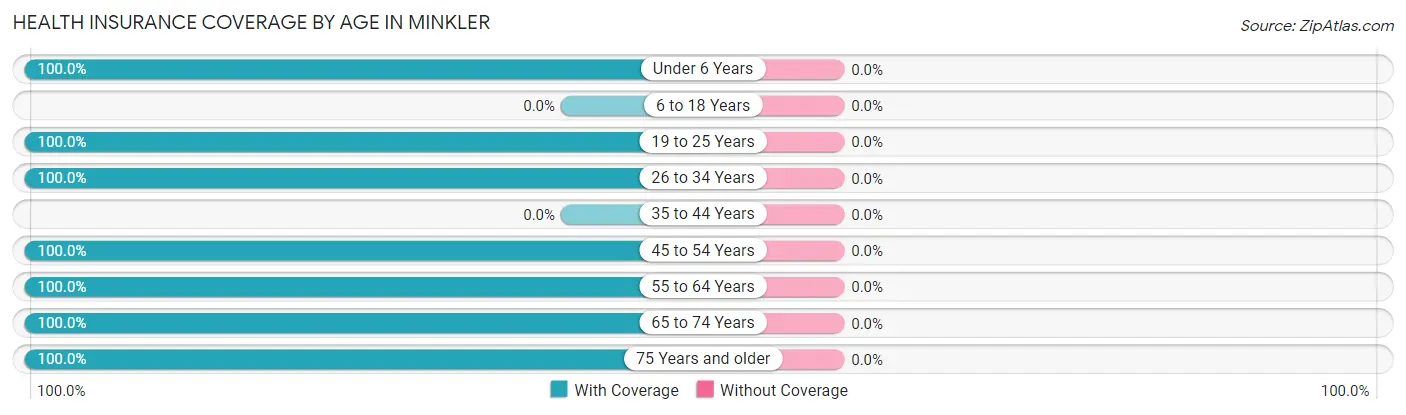
| Age Bracket | With Coverage | Without Coverage |
| Under 6 Years | 20 (100.0%) | 0 (0.0%) |
| 6 to 18 Years | 0 (0.0%) | 0 (0.0%) |
| 19 to 25 Years | 125 (100.0%) | 0 (0.0%) |
| 26 to 34 Years | 21 (100.0%) | 0 (0.0%) |
| 35 to 44 Years | 0 (0.0%) | 0 (0.0%) |
| 45 to 54 Years | 204 (100.0%) | 0 (0.0%) |
| 55 to 64 Years | 79 (100.0%) | 0 (0.0%) |
| 65 to 74 Years | 25 (100.0%) | 0 (0.0%) |
| 75 Years and older | 198 (100.0%) | 0 (0.0%) |
| Total | 672 (100.0%) | 0 (0.0%) |
Health Insurance Coverage by Citizenship Status in Minkler
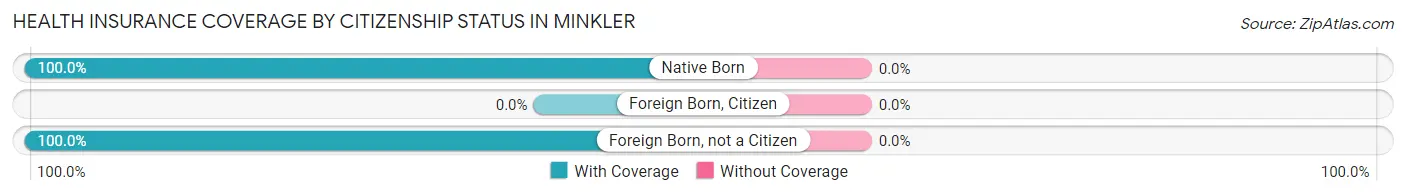
| Citizenship Status | With Coverage | Without Coverage |
| Native Born | 20 (100.0%) | 0 (0.0%) |
| Foreign Born, Citizen | 0 (0.0%) | 0 (0.0%) |
| Foreign Born, not a Citizen | 125 (100.0%) | 0 (0.0%) |
Health Insurance Coverage by Household Income in Minkler
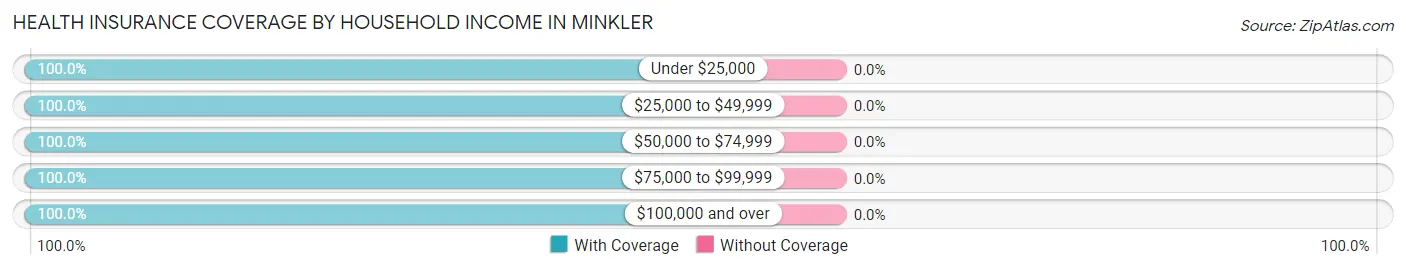
| Household Income | With Coverage | Without Coverage |
| Under $25,000 | 40 (100.0%) | 0 (0.0%) |
| $25,000 to $49,999 | 121 (100.0%) | 0 (0.0%) |
| $50,000 to $74,999 | 337 (100.0%) | 0 (0.0%) |
| $75,000 to $99,999 | 32 (100.0%) | 0 (0.0%) |
| $100,000 and over | 142 (100.0%) | 0 (0.0%) |
Public vs Private Health Insurance Coverage by Age in Minkler
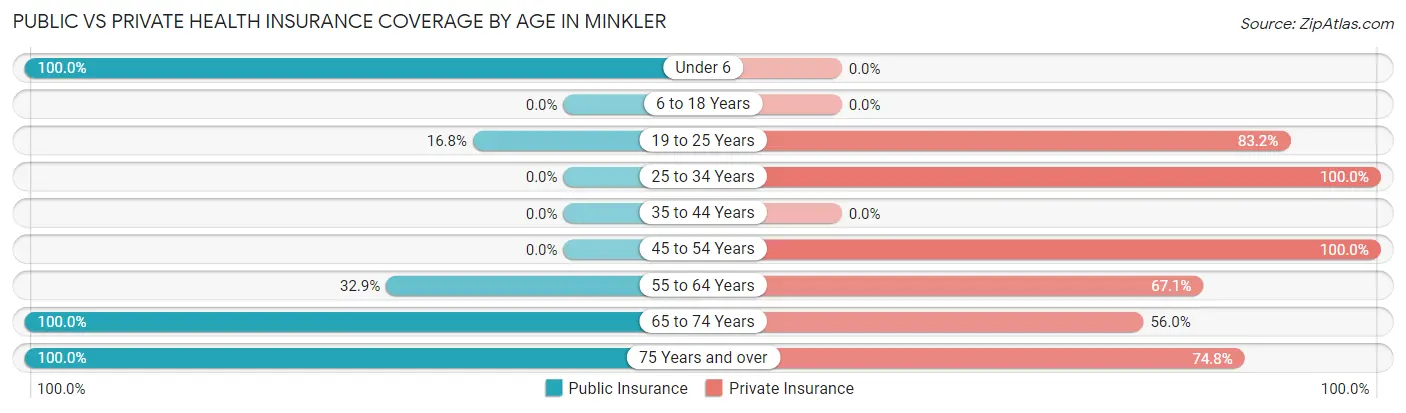
| Age Bracket | Public Insurance | Private Insurance |
| Under 6 | 20 (100.0%) | 0 (0.0%) |
| 6 to 18 Years | 0 (0.0%) | 0 (0.0%) |
| 19 to 25 Years | 21 (16.8%) | 104 (83.2%) |
| 25 to 34 Years | 0 (0.0%) | 21 (100.0%) |
| 35 to 44 Years | 0 (0.0%) | 0 (0.0%) |
| 45 to 54 Years | 0 (0.0%) | 204 (100.0%) |
| 55 to 64 Years | 26 (32.9%) | 53 (67.1%) |
| 65 to 74 Years | 25 (100.0%) | 14 (56.0%) |
| 75 Years and over | 198 (100.0%) | 148 (74.8%) |
| Total | 290 (43.1%) | 544 (80.9%) |
Disability Status by Sex by Age in Minkler
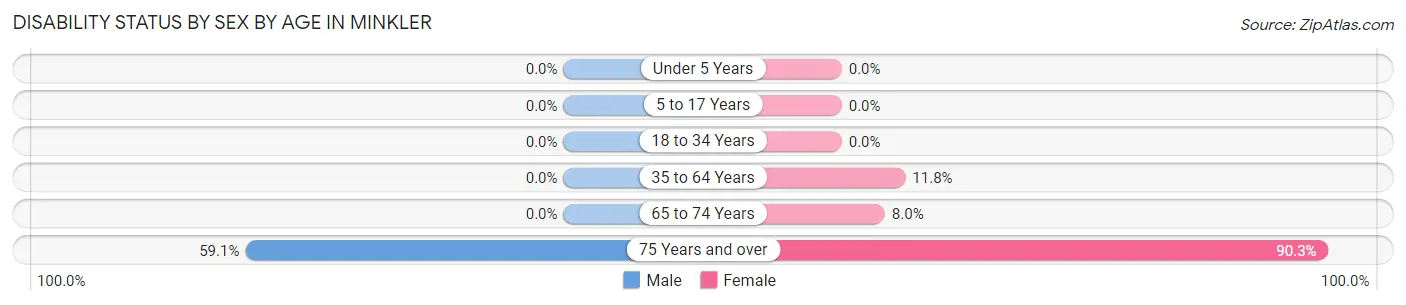
| Age Bracket | Male | Female |
| Under 5 Years | 0 (0.0%) | 0 (0.0%) |
| 5 to 17 Years | 0 (0.0%) | 0 (0.0%) |
| 18 to 34 Years | 0 (0.0%) | 0 (0.0%) |
| 35 to 64 Years | 0 (0.0%) | 32 (11.8%) |
| 65 to 74 Years | 0 (0.0%) | 2 (8.0%) |
| 75 Years and over | 62 (59.1%) | 84 (90.3%) |
Disability Class by Sex by Age in Minkler
Disability Class: Hearing Difficulty
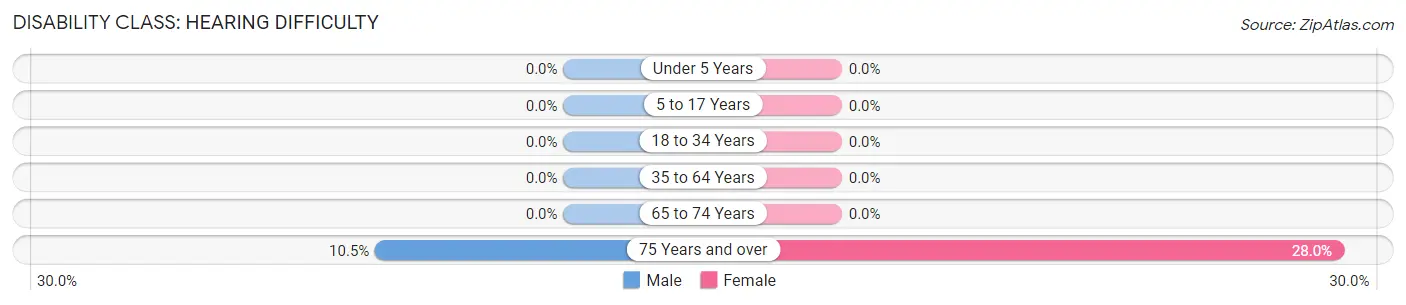
| Age Bracket | Male | Female |
| Under 5 Years | 0 (0.0%) | 0 (0.0%) |
| 5 to 17 Years | 0 (0.0%) | 0 (0.0%) |
| 18 to 34 Years | 0 (0.0%) | 0 (0.0%) |
| 35 to 64 Years | 0 (0.0%) | 0 (0.0%) |
| 65 to 74 Years | 0 (0.0%) | 0 (0.0%) |
| 75 Years and over | 11 (10.5%) | 26 (28.0%) |
Disability Class: Vision Difficulty
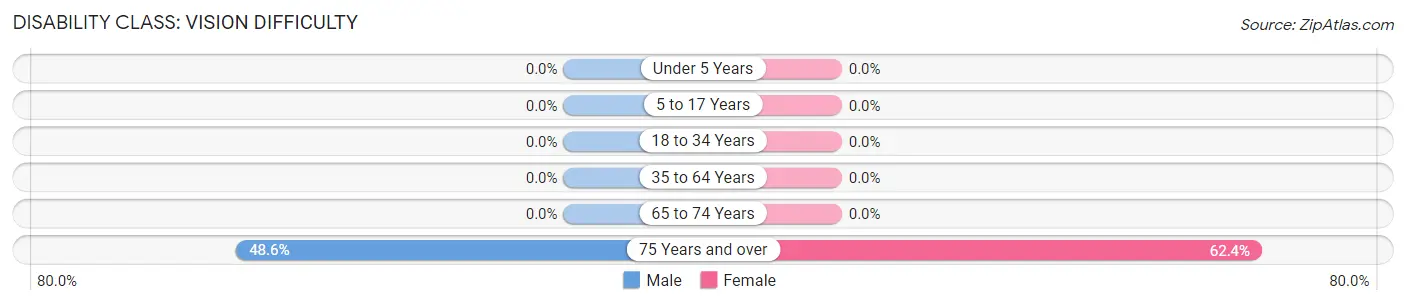
| Age Bracket | Male | Female |
| Under 5 Years | 0 (0.0%) | 0 (0.0%) |
| 5 to 17 Years | 0 (0.0%) | 0 (0.0%) |
| 18 to 34 Years | 0 (0.0%) | 0 (0.0%) |
| 35 to 64 Years | 0 (0.0%) | 0 (0.0%) |
| 65 to 74 Years | 0 (0.0%) | 0 (0.0%) |
| 75 Years and over | 51 (48.6%) | 58 (62.4%) |
Disability Class: Cognitive Difficulty
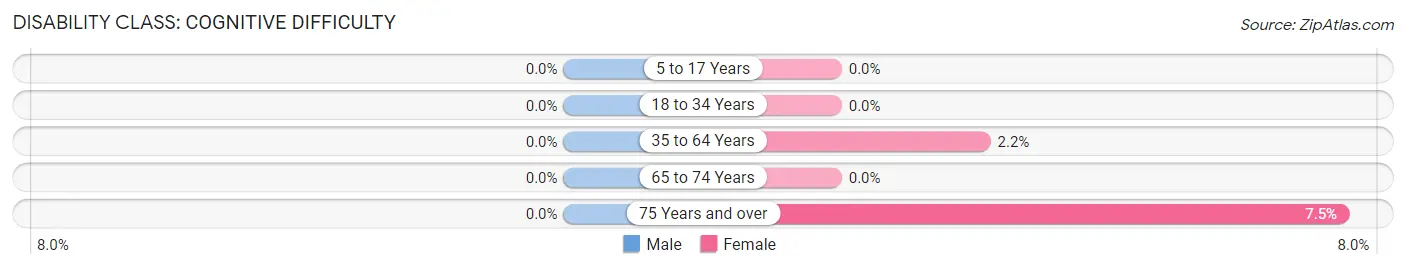
| Age Bracket | Male | Female |
| 5 to 17 Years | 0 (0.0%) | 0 (0.0%) |
| 18 to 34 Years | 0 (0.0%) | 0 (0.0%) |
| 35 to 64 Years | 0 (0.0%) | 6 (2.2%) |
| 65 to 74 Years | 0 (0.0%) | 0 (0.0%) |
| 75 Years and over | 0 (0.0%) | 7 (7.5%) |
Disability Class: Ambulatory Difficulty
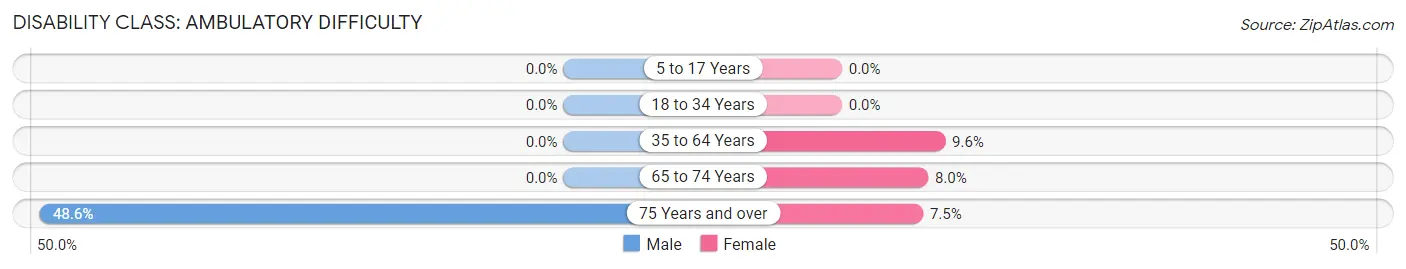
| Age Bracket | Male | Female |
| 5 to 17 Years | 0 (0.0%) | 0 (0.0%) |
| 18 to 34 Years | 0 (0.0%) | 0 (0.0%) |
| 35 to 64 Years | 0 (0.0%) | 26 (9.6%) |
| 65 to 74 Years | 0 (0.0%) | 2 (8.0%) |
| 75 Years and over | 51 (48.6%) | 7 (7.5%) |
Disability Class: Self-Care Difficulty
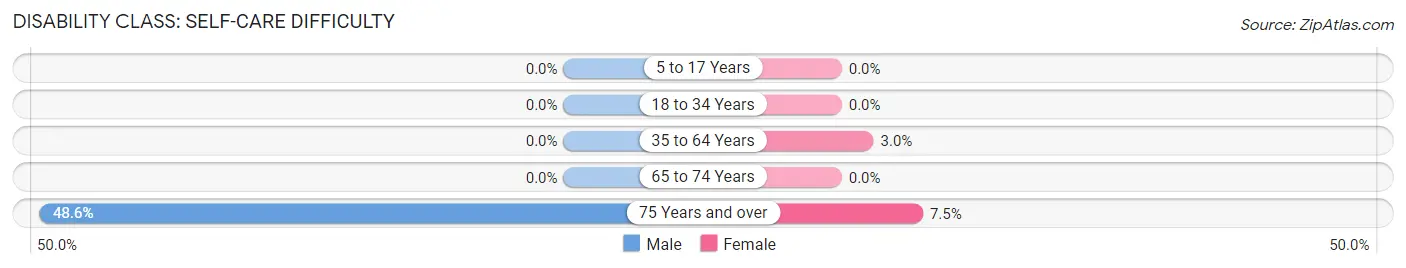
| Age Bracket | Male | Female |
| 5 to 17 Years | 0 (0.0%) | 0 (0.0%) |
| 18 to 34 Years | 0 (0.0%) | 0 (0.0%) |
| 35 to 64 Years | 0 (0.0%) | 8 (2.9%) |
| 65 to 74 Years | 0 (0.0%) | 0 (0.0%) |
| 75 Years and over | 51 (48.6%) | 7 (7.5%) |
Technology Access in Minkler
Computing Device Access in Minkler
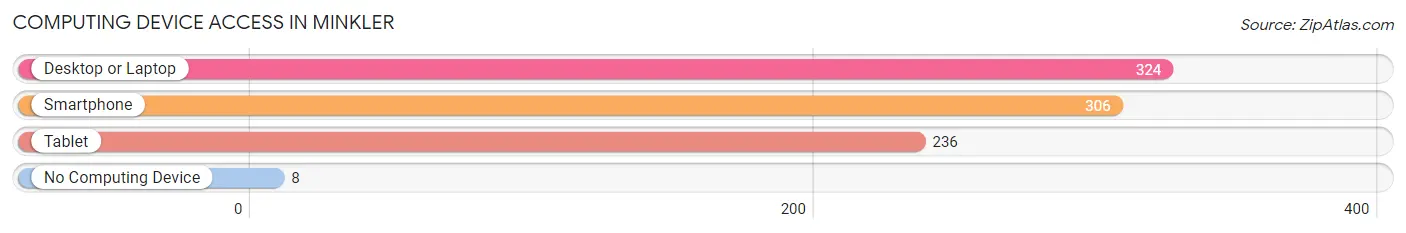
| Device Type | # Households | % Households |
| Desktop or Laptop | 324 | 88.8% |
| Smartphone | 306 | 83.8% |
| Tablet | 236 | 64.7% |
| No Computing Device | 8 | 2.2% |
| Total | 365 | 100.0% |
Internet Access in Minkler
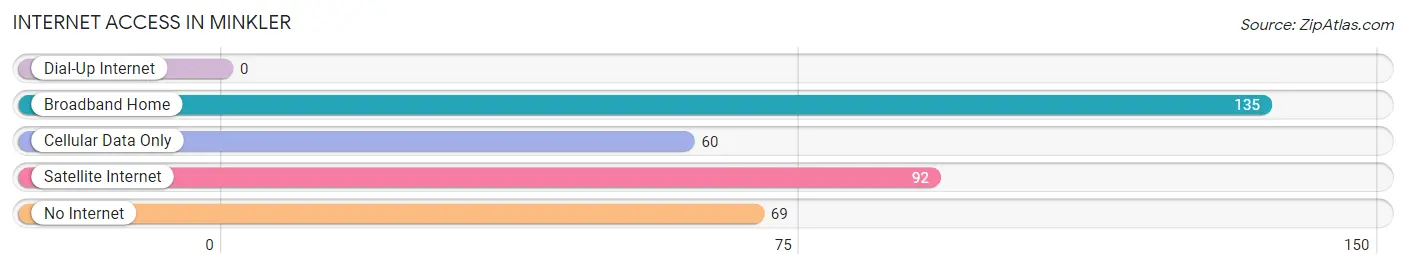
| Internet Type | # Households | % Households |
| Dial-Up Internet | 0 | 0.0% |
| Broadband Home | 135 | 37.0% |
| Cellular Data Only | 60 | 16.4% |
| Satellite Internet | 92 | 25.2% |
| No Internet | 69 | 18.9% |
| Total | 365 | 100.0% |
Minkler Summary
Minkler is a small unincorporated community located in Fresno County, California. It is situated in the foothills of the Sierra Nevada Mountains, approximately 25 miles east of Fresno. The population of Minkler is estimated to be around 500 people.
History
Minkler was founded in 1891 by a group of settlers from the Midwest. The settlers were looking for a place to settle and start a new life. The area was originally known as “Minkler’s Station”, named after the first settler, John Minkler. The settlers built a small store, a post office, and a school. The town grew slowly over the years, and by the early 1900s, it had become a thriving community.
In the 1920s, Minkler was a popular destination for tourists. The town was known for its beautiful scenery and its abundance of outdoor activities. People would come to Minkler to fish, hunt, and camp. The town also had a few small businesses, including a general store, a blacksmith, and a saloon.
In the 1950s, Minkler began to decline. The population decreased as people moved away to larger cities. The businesses closed, and the town became a ghost town. In the 1970s, the town was revitalized when a group of people moved to Minkler and started a new life. The town has since become a popular destination for outdoor enthusiasts.
Geography
Minkler is located in the foothills of the Sierra Nevada Mountains. The town is situated at an elevation of 1,800 feet. The area is known for its rolling hills, lush forests, and beautiful views of the mountains. The climate in Minkler is mild, with temperatures ranging from the mid-50s in the winter to the mid-90s in the summer.
Economy
Minkler’s economy is largely based on tourism. The town is a popular destination for outdoor enthusiasts, and it is home to several campgrounds, hiking trails, and fishing spots. The town also has a few small businesses, including a general store, a restaurant, and a gas station.
Demographics
The population of Minkler is estimated to be around 500 people. The town is predominantly white, with a small Hispanic population. The median household income is around $50,000, and the median home value is around $200,000. The town has a low crime rate and a high quality of life.
Common Questions
What is Per Capita Income in Minkler?
Per Capita income in Minkler is $45,786.
What is the Median Family Income in Minkler?
Median Family Income in Minkler is $61,297.
What is the Median Household income in Minkler?
Median Household Income in Minkler is $60,853.
What is Income or Wage Gap in Minkler?
Income or Wage Gap in Minkler is 42.1%.
Women in Minkler earn 57.9 cents for every dollar earned by a man.
What is Inequality or Gini Index in Minkler?
Inequality or Gini Index in Minkler is 0.46.
What is the Total Population of Minkler?
Total Population of Minkler is 683.
What is the Total Male Population of Minkler?
Total Male Population of Minkler is 205.
What is the Total Female Population of Minkler?
Total Female Population of Minkler is 478.
What is the Ratio of Males per 100 Females in Minkler?
There are 42.89 Males per 100 Females in Minkler.
What is the Ratio of Females per 100 Males in Minkler?
There are 233.17 Females per 100 Males in Minkler.
What is the Median Population Age in Minkler?
Median Population Age in Minkler is 53.6 Years.
What is the Average Family Size in Minkler
Average Family Size in Minkler is 2.0 People.
What is the Average Household Size in Minkler
Average Household Size in Minkler is 1.9 People.
How Large is the Labor Force in Minkler?
There are 285 People in the Labor Forcein in Minkler.
What is the Percentage of People in the Labor Force in Minkler?
43.0% of People are in the Labor Force in Minkler.