Cities with the Highest Percentage of Population Employed in Health Diagnosing & Treating in Oklahoma
RELATED REPORTS & OPTIONS
Health Diagnosing & Treating
Oklahoma
Compare Cities
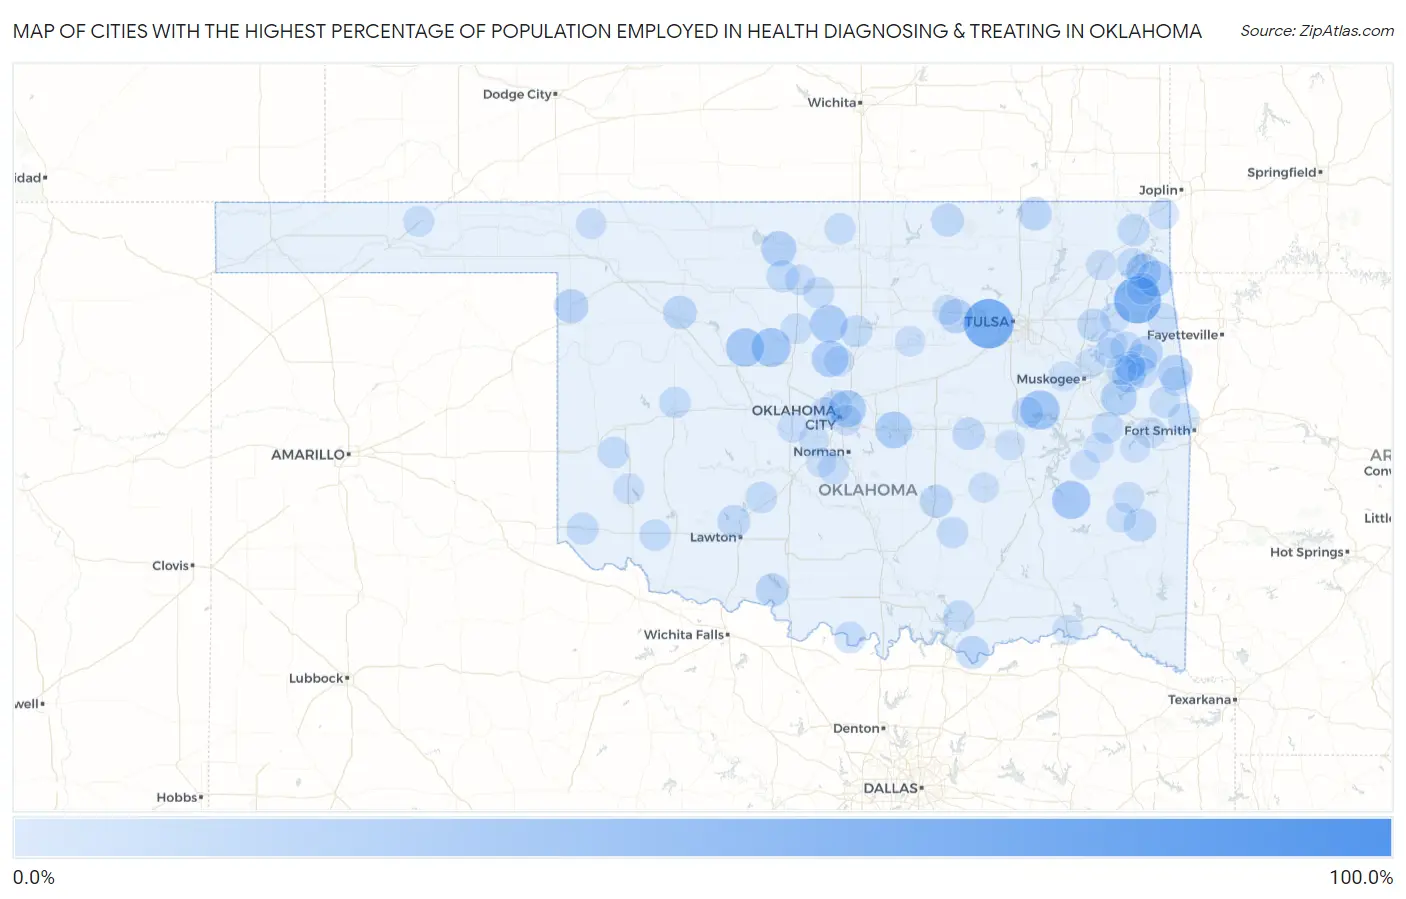
Map of Cities with the Highest Percentage of Population Employed in Health Diagnosing & Treating in Oklahoma
0.0%
100.0%
Cities with the Highest Percentage of Population Employed in Health Diagnosing & Treating in Oklahoma
| City | % Employed | vs State | vs National | |
| 1. | Vanoss | 100.0% | 6.4%(+93.6)#1 | 6.2%(+93.8)#11 |
| 2. | Lotsee | 66.7% | 6.4%(+60.3)#2 | 6.2%(+60.4)#36 |
| 3. | Bull Hollow | 59.6% | 6.4%(+53.2)#3 | 6.2%(+53.3)#43 |
| 4. | Sumner | 50.0% | 6.4%(+43.6)#4 | 6.2%(+43.8)#84 |
| 5. | Honey Hill | 45.7% | 6.4%(+39.3)#5 | 6.2%(+39.4)#102 |
| 6. | Bryant | 42.9% | 6.4%(+36.5)#6 | 6.2%(+36.6)#121 |
| 7. | Utica | 36.7% | 6.4%(+30.3)#7 | 6.2%(+30.4)#175 |
| 8. | Hitchita | 36.4% | 6.4%(+30.0)#8 | 6.2%(+30.1)#176 |
| 9. | Loyal | 35.5% | 6.4%(+29.1)#9 | 6.2%(+29.2)#196 |
| 10. | Lawtonka Acres | 34.2% | 6.4%(+27.8)#10 | 6.2%(+28.0)#214 |
| 11. | Gowen | 33.3% | 6.4%(+27.0)#11 | 6.2%(+27.1)#226 |
| 12. | Elohim | 33.3% | 6.4%(+27.0)#12 | 6.2%(+27.1)#236 |
| 13. | Hitchcock | 33.3% | 6.4%(+27.0)#13 | 6.2%(+27.1)#240 |
| 14. | Marshall | 31.2% | 6.4%(+24.8)#14 | 6.2%(+24.9)#288 |
| 15. | Lake Aluma | 29.6% | 6.4%(+23.3)#15 | 6.2%(+23.4)#313 |
| 16. | Dale | 28.8% | 6.4%(+22.4)#16 | 6.2%(+22.6)#324 |
| 17. | Cimarron City | 28.6% | 6.4%(+22.2)#17 | 6.2%(+22.3)#332 |
| 18. | Deer Lick | 27.5% | 6.4%(+21.1)#18 | 6.2%(+21.3)#363 |
| 19. | Paradise Hill | 26.7% | 6.4%(+20.3)#19 | 6.2%(+20.4)#383 |
| 20. | Zena | 25.0% | 6.4%(+18.6)#20 | 6.2%(+18.8)#439 |
| 21. | Elm Grove | 24.4% | 6.4%(+18.0)#21 | 6.2%(+18.1)#470 |
| 22. | Nash | 24.4% | 6.4%(+18.0)#22 | 6.2%(+18.1)#471 |
| 23. | Sparrowhawk | 22.9% | 6.4%(+16.5)#23 | 6.2%(+16.6)#557 |
| 24. | Terlton | 22.2% | 6.4%(+15.9)#24 | 6.2%(+16.0)#593 |
| 25. | Shattuck | 21.9% | 6.4%(+15.5)#25 | 6.2%(+15.6)#610 |
| 26. | Nashoba | 21.1% | 6.4%(+14.7)#26 | 6.2%(+14.8)#659 |
| 27. | Bug Tussle | 20.8% | 6.4%(+14.5)#27 | 6.2%(+14.6)#677 |
| 28. | Sportmans Shores | 20.8% | 6.4%(+14.5)#28 | 6.2%(+14.6)#678 |
| 29. | Chester | 20.0% | 6.4%(+13.6)#29 | 6.2%(+13.8)#750 |
| 30. | Hastings | 19.2% | 6.4%(+12.9)#30 | 6.2%(+13.0)#817 |
| 31. | Wann | 19.1% | 6.4%(+12.8)#31 | 6.2%(+12.9)#826 |
| 32. | Kemp | 19.0% | 6.4%(+12.6)#32 | 6.2%(+12.7)#843 |
| 33. | Eldon | 18.8% | 6.4%(+12.5)#33 | 6.2%(+12.6)#856 |
| 34. | Byng | 18.6% | 6.4%(+12.3)#34 | 6.2%(+12.4)#880 |
| 35. | Foraker | 18.2% | 6.4%(+11.8)#35 | 6.2%(+11.9)#941 |
| 36. | Whitesboro | 17.9% | 6.4%(+11.6)#36 | 6.2%(+11.7)#959 |
| 37. | Pettit | 17.8% | 6.4%(+11.4)#37 | 6.2%(+11.5)#981 |
| 38. | Pin Oak Acres | 17.6% | 6.4%(+11.2)#38 | 6.2%(+11.4)#998 |
| 39. | Medicine Park | 17.5% | 6.4%(+11.1)#39 | 6.2%(+11.2)#1,015 |
| 40. | Sunray | 17.4% | 6.4%(+11.0)#40 | 6.2%(+11.1)#1,023 |
| 41. | Bearden | 17.2% | 6.4%(+10.9)#41 | 6.2%(+11.0)#1,043 |
| 42. | Narcissa | 16.7% | 6.4%(+10.3)#42 | 6.2%(+10.4)#1,153 |
| 43. | Carrier | 16.3% | 6.4%(+9.91)#43 | 6.2%(+10.0)#1,222 |
| 44. | Nichols Hills | 15.9% | 6.4%(+9.56)#44 | 6.2%(+9.68)#1,296 |
| 45. | Mulhall | 15.8% | 6.4%(+9.45)#45 | 6.2%(+9.57)#1,321 |
| 46. | Gould | 15.8% | 6.4%(+9.42)#46 | 6.2%(+9.54)#1,326 |
| 47. | Welling | 15.3% | 6.4%(+8.88)#47 | 6.2%(+9.01)#1,455 |
| 48. | New Eucha | 15.2% | 6.4%(+8.81)#48 | 6.2%(+8.94)#1,467 |
| 49. | Grandview | 14.7% | 6.4%(+8.38)#49 | 6.2%(+8.50)#1,564 |
| 50. | Headrick | 14.7% | 6.4%(+8.33)#50 | 6.2%(+8.46)#1,578 |
| 51. | Carter | 14.6% | 6.4%(+8.26)#51 | 6.2%(+8.39)#1,600 |
| 52. | Simms | 14.4% | 6.4%(+8.04)#52 | 6.2%(+8.16)#1,676 |
| 53. | Leon | 14.3% | 6.4%(+7.91)#53 | 6.2%(+8.04)#1,718 |
| 54. | Cyril | 14.2% | 6.4%(+7.86)#54 | 6.2%(+7.98)#1,737 |
| 55. | Keys | 14.2% | 6.4%(+7.82)#55 | 6.2%(+7.94)#1,751 |
| 56. | Silo | 14.1% | 6.4%(+7.74)#56 | 6.2%(+7.87)#1,777 |
| 57. | Remy | 14.1% | 6.4%(+7.73)#57 | 6.2%(+7.85)#1,780 |
| 58. | Cleora | 14.0% | 6.4%(+7.66)#58 | 6.2%(+7.79)#1,795 |
| 59. | Grayson | 13.9% | 6.4%(+7.52)#59 | 6.2%(+7.64)#1,834 |
| 60. | Arapaho | 13.8% | 6.4%(+7.39)#60 | 6.2%(+7.52)#1,882 |
| 61. | Stonewall | 13.7% | 6.4%(+7.37)#61 | 6.2%(+7.50)#1,888 |
| 62. | Deer Creek | 13.5% | 6.4%(+7.14)#62 | 6.2%(+7.27)#1,976 |
| 63. | Cole | 13.1% | 6.4%(+6.69)#63 | 6.2%(+6.82)#2,151 |
| 64. | Stoney Point | 13.0% | 6.4%(+6.67)#64 | 6.2%(+6.80)#2,161 |
| 65. | Dripping Springs | 13.0% | 6.4%(+6.67)#65 | 6.2%(+6.80)#2,167 |
| 66. | Hennessey | 12.8% | 6.4%(+6.47)#66 | 6.2%(+6.59)#2,271 |
| 67. | Fairmont | 12.5% | 6.4%(+6.13)#67 | 6.2%(+6.26)#2,436 |
| 68. | Hooker | 12.4% | 6.4%(+6.06)#68 | 6.2%(+6.19)#2,465 |
| 69. | Le Flore | 12.2% | 6.4%(+5.87)#69 | 6.2%(+6.00)#2,559 |
| 70. | Smith Village | 12.1% | 6.4%(+5.75)#70 | 6.2%(+5.88)#2,623 |
| 71. | Granite | 11.9% | 6.4%(+5.53)#71 | 6.2%(+5.66)#2,721 |
| 72. | Brent | 11.8% | 6.4%(+5.39)#72 | 6.2%(+5.52)#2,788 |
| 73. | Buffalo | 11.6% | 6.4%(+5.23)#73 | 6.2%(+5.35)#2,909 |
| 74. | North Enid | 11.6% | 6.4%(+5.21)#74 | 6.2%(+5.33)#2,927 |
| 75. | Ripley | 11.3% | 6.4%(+4.95)#75 | 6.2%(+5.08)#3,109 |
| 76. | Woodlawn Park | 11.3% | 6.4%(+4.95)#76 | 6.2%(+5.08)#3,110 |
| 77. | Tenkiller | 11.2% | 6.4%(+4.84)#77 | 6.2%(+4.97)#3,176 |
| 78. | Park Hill | 11.2% | 6.4%(+4.81)#78 | 6.2%(+4.94)#3,200 |
| 79. | Big Cabin | 11.1% | 6.4%(+4.74)#79 | 6.2%(+4.87)#3,255 |
| 80. | Peoria | 11.1% | 6.4%(+4.74)#80 | 6.2%(+4.87)#3,260 |
| 81. | Peckham | 11.1% | 6.4%(+4.74)#81 | 6.2%(+4.87)#3,270 |
| 82. | Cedar Valley | 11.0% | 6.4%(+4.68)#82 | 6.2%(+4.80)#3,303 |
| 83. | Union City | 10.9% | 6.4%(+4.49)#83 | 6.2%(+4.62)#3,418 |
| 84. | Zeb | 10.7% | 6.4%(+4.38)#84 | 6.2%(+4.50)#3,522 |
| 85. | Hallett | 10.7% | 6.4%(+4.34)#85 | 6.2%(+4.47)#3,553 |
| 86. | Keota | 10.7% | 6.4%(+4.28)#86 | 6.2%(+4.41)#3,593 |
| 87. | Tuttle | 10.5% | 6.4%(+4.18)#87 | 6.2%(+4.30)#3,691 |
| 88. | Grant | 10.5% | 6.4%(+4.16)#88 | 6.2%(+4.28)#3,718 |
| 89. | Okay | 10.4% | 6.4%(+4.07)#89 | 6.2%(+4.19)#3,781 |
| 90. | Calvin | 10.4% | 6.4%(+4.03)#90 | 6.2%(+4.16)#3,820 |
| 91. | Lost City | 10.3% | 6.4%(+3.97)#91 | 6.2%(+4.10)#3,867 |
| 92. | Hulbert | 10.3% | 6.4%(+3.95)#92 | 6.2%(+4.08)#3,888 |
| 93. | Whitefield | 10.3% | 6.4%(+3.91)#93 | 6.2%(+4.04)#3,930 |
| 94. | Taft | 10.3% | 6.4%(+3.89)#94 | 6.2%(+4.01)#3,963 |
| 95. | Bell | 10.2% | 6.4%(+3.83)#95 | 6.2%(+3.96)#4,007 |
| 96. | Snake Creek | 10.2% | 6.4%(+3.83)#96 | 6.2%(+3.96)#4,009 |
| 97. | Dustin | 10.2% | 6.4%(+3.80)#97 | 6.2%(+3.92)#4,048 |
| 98. | Talihina | 10.1% | 6.4%(+3.72)#98 | 6.2%(+3.85)#4,115 |
| 99. | Blanchard | 10.0% | 6.4%(+3.59)#99 | 6.2%(+3.72)#4,254 |
| 100. | Quinton | 9.9% | 6.4%(+3.56)#100 | 6.2%(+3.68)#4,281 |
Common Questions
What are the Top 10 Cities with the Highest Percentage of Population Employed in Health Diagnosing & Treating in Oklahoma?
Top 10 Cities with the Highest Percentage of Population Employed in Health Diagnosing & Treating in Oklahoma are:
#1
66.7%
#2
59.6%
#3
36.4%
#4
35.5%
#5
33.3%
#6
33.3%
#7
31.2%
#8
29.6%
#9
28.8%
#10
28.6%
What city has the Highest Percentage of Population Employed in Health Diagnosing & Treating in Oklahoma?
Lotsee has the Highest Percentage of Population Employed in Health Diagnosing & Treating in Oklahoma with 66.7%.
What is the Percentage of Population Employed in Health Diagnosing & Treating in the State of Oklahoma?
Percentage of Population Employed in Health Diagnosing & Treating in Oklahoma is 6.4%.
What is the Percentage of Population Employed in Health Diagnosing & Treating in the United States?
Percentage of Population Employed in Health Diagnosing & Treating in the United States is 6.2%.