Cities with the Highest Percentage of Population Employed in Health Diagnosing & Treating in Nevada
RELATED REPORTS & OPTIONS
Health Diagnosing & Treating
Nevada
Compare Cities
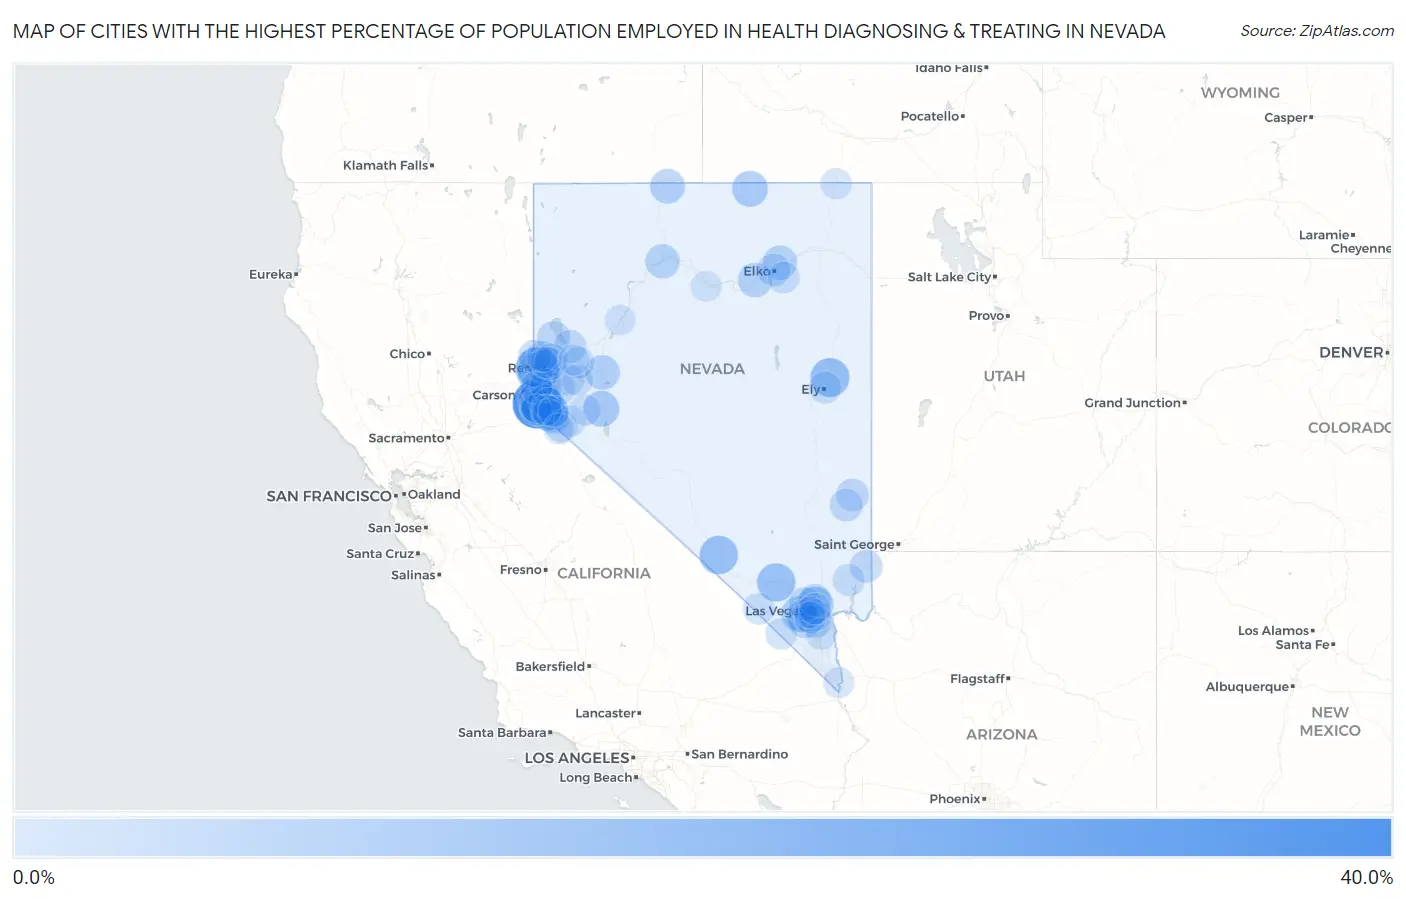
Map of Cities with the Highest Percentage of Population Employed in Health Diagnosing & Treating in Nevada
0.0%
40.0%
Cities with the Highest Percentage of Population Employed in Health Diagnosing & Treating in Nevada
| City | % Employed | vs State | vs National | |
| 1. | Lakeridge | 38.9% | 4.9%(+34.0)#1 | 6.2%(+32.6)#154 |
| 2. | Mogul | 26.2% | 4.9%(+21.3)#2 | 6.2%(+20.0)#403 |
| 3. | Mcgill | 17.2% | 4.9%(+12.3)#3 | 6.2%(+10.9)#1,054 |
| 4. | Beatty | 16.0% | 4.9%(+11.1)#4 | 6.2%(+9.79)#1,280 |
| 5. | Indian Springs | 15.9% | 4.9%(+11.0)#5 | 6.2%(+9.66)#1,303 |
| 6. | Glenbrook | 14.7% | 4.9%(+9.75)#6 | 6.2%(+8.42)#1,587 |
| 7. | Nellis Afb | 12.9% | 4.9%(+8.04)#7 | 6.2%(+6.70)#2,216 |
| 8. | Kingsbury | 12.6% | 4.9%(+7.65)#8 | 6.2%(+6.32)#2,393 |
| 9. | East Valley | 11.5% | 4.9%(+6.54)#9 | 6.2%(+5.21)#3,023 |
| 10. | Schurz | 11.4% | 4.9%(+6.45)#10 | 6.2%(+5.12)#3,079 |
| 11. | Owyhee | 10.9% | 4.9%(+6.03)#11 | 6.2%(+4.70)#3,365 |
| 12. | Skyland | 10.9% | 4.9%(+6.01)#12 | 6.2%(+4.68)#3,374 |
| 13. | Summerlin South | 9.7% | 4.9%(+4.77)#13 | 6.2%(+3.44)#4,559 |
| 14. | Fort Mcdermitt | 8.9% | 4.9%(+4.02)#14 | 6.2%(+2.68)#5,522 |
| 15. | Fallon | 8.9% | 4.9%(+3.95)#15 | 6.2%(+2.62)#5,607 |
| 16. | Carlin | 8.3% | 4.9%(+3.36)#16 | 6.2%(+2.03)#6,524 |
| 17. | Verdi | 8.1% | 4.9%(+3.21)#17 | 6.2%(+1.87)#6,787 |
| 18. | Winnemucca | 8.0% | 4.9%(+3.10)#18 | 6.2%(+1.77)#6,969 |
| 19. | Osino | 7.9% | 4.9%(+3.03)#19 | 6.2%(+1.70)#7,109 |
| 20. | Ruhenstroth | 7.7% | 4.9%(+2.82)#20 | 6.2%(+1.49)#7,500 |
| 21. | Zephyr Cove | 7.7% | 4.9%(+2.81)#21 | 6.2%(+1.48)#7,522 |
| 22. | Enterprise | 7.0% | 4.9%(+2.06)#22 | 6.2%(+0.728)#9,241 |
| 23. | Indian Hills | 6.1% | 4.9%(+1.18)#23 | 6.2%(-0.157)#11,517 |
| 24. | Henderson | 5.9% | 4.9%(+0.944)#24 | 6.2%(-0.389)#12,109 |
| 25. | Sutcliffe | 5.7% | 4.9%(+0.802)#25 | 6.2%(-0.531)#12,507 |
| 26. | Reno | 5.4% | 4.9%(+0.532)#26 | 6.2%(-0.801)#13,272 |
| 27. | Cold Springs | 5.4% | 4.9%(+0.512)#27 | 6.2%(-0.820)#13,331 |
| 28. | Spanish Springs | 5.4% | 4.9%(+0.458)#28 | 6.2%(-0.875)#13,488 |
| 29. | Panaca | 5.2% | 4.9%(+0.336)#29 | 6.2%(-0.997)#13,849 |
| 30. | Dayton | 5.2% | 4.9%(+0.317)#30 | 6.2%(-1.02)#13,911 |
| 31. | Caliente | 5.2% | 4.9%(+0.290)#31 | 6.2%(-1.04)#14,000 |
| 32. | Nixon | 5.2% | 4.9%(+0.283)#32 | 6.2%(-1.05)#14,021 |
| 33. | Las Vegas | 5.2% | 4.9%(+0.273)#33 | 6.2%(-1.06)#14,062 |
| 34. | Elko | 5.1% | 4.9%(+0.195)#34 | 6.2%(-1.14)#14,282 |
| 35. | Spring Valley | 5.0% | 4.9%(+0.076)#35 | 6.2%(-1.26)#14,656 |
| 36. | Carson | 4.9% | 4.9%(+0.037)#36 | 6.2%(-1.30)#14,775 |
| 37. | Mesquite | 4.7% | 4.9%(-0.173)#37 | 6.2%(-1.51)#15,409 |
| 38. | Carter Springs | 4.6% | 4.9%(-0.304)#38 | 6.2%(-1.64)#15,768 |
| 39. | Washoe Valley | 4.4% | 4.9%(-0.491)#39 | 6.2%(-1.82)#16,314 |
| 40. | Sparks | 4.3% | 4.9%(-0.564)#40 | 6.2%(-1.90)#16,576 |
| 41. | North Las Vegas | 4.1% | 4.9%(-0.836)#41 | 6.2%(-2.17)#17,383 |
| 42. | Ely | 4.0% | 4.9%(-0.902)#42 | 6.2%(-2.24)#17,554 |
| 43. | Johnson Lane | 4.0% | 4.9%(-0.904)#43 | 6.2%(-2.24)#17,560 |
| 44. | Whitney | 4.0% | 4.9%(-0.910)#44 | 6.2%(-2.24)#17,572 |
| 45. | Incline Village | 3.9% | 4.9%(-1.03)#45 | 6.2%(-2.36)#17,945 |
| 46. | Moapa Valley | 3.8% | 4.9%(-1.14)#46 | 6.2%(-2.47)#18,245 |
| 47. | Spring Creek | 3.7% | 4.9%(-1.17)#47 | 6.2%(-2.50)#18,341 |
| 48. | Gardnerville | 3.6% | 4.9%(-1.28)#48 | 6.2%(-2.61)#18,621 |
| 49. | Topaz Ranch Estates | 3.5% | 4.9%(-1.38)#49 | 6.2%(-2.71)#18,883 |
| 50. | Paradise | 3.3% | 4.9%(-1.65)#50 | 6.2%(-2.99)#19,584 |
| 51. | Gardnerville Ranchos | 3.0% | 4.9%(-1.89)#51 | 6.2%(-3.22)#20,171 |
| 52. | Sandy Valley | 2.9% | 4.9%(-2.03)#52 | 6.2%(-3.36)#20,528 |
| 53. | Pahrump | 2.9% | 4.9%(-2.04)#53 | 6.2%(-3.37)#20,545 |
| 54. | Smith Valley | 2.8% | 4.9%(-2.10)#54 | 6.2%(-3.43)#20,708 |
| 55. | Fernley | 2.8% | 4.9%(-2.14)#55 | 6.2%(-3.47)#20,806 |
| 56. | Boulder City | 2.8% | 4.9%(-2.16)#56 | 6.2%(-3.49)#20,835 |
| 57. | Winchester | 2.6% | 4.9%(-2.27)#57 | 6.2%(-3.60)#21,105 |
| 58. | Sun Valley | 2.6% | 4.9%(-2.34)#58 | 6.2%(-3.67)#21,254 |
| 59. | Yerington | 2.5% | 4.9%(-2.36)#59 | 6.2%(-3.70)#21,312 |
| 60. | Stagecoach | 2.5% | 4.9%(-2.38)#60 | 6.2%(-3.71)#21,358 |
| 61. | Silver Springs | 2.5% | 4.9%(-2.39)#61 | 6.2%(-3.73)#21,378 |
| 62. | Sunrise Manor | 2.5% | 4.9%(-2.44)#62 | 6.2%(-3.77)#21,485 |
| 63. | Lemmon Valley | 2.5% | 4.9%(-2.45)#63 | 6.2%(-3.79)#21,517 |
| 64. | Stateline | 2.2% | 4.9%(-2.69)#64 | 6.2%(-4.02)#21,985 |
| 65. | Wadsworth | 2.1% | 4.9%(-2.83)#65 | 6.2%(-4.17)#22,292 |
| 66. | Jackpot | 2.0% | 4.9%(-2.89)#66 | 6.2%(-4.22)#22,408 |
| 67. | Laughlin | 1.5% | 4.9%(-3.40)#67 | 6.2%(-4.73)#23,413 |
| 68. | Topaz Lake | 1.4% | 4.9%(-3.48)#68 | 6.2%(-4.82)#23,538 |
| 69. | Minden | 1.4% | 4.9%(-3.50)#69 | 6.2%(-4.83)#23,560 |
| 70. | Fish Springs | 1.4% | 4.9%(-3.50)#70 | 6.2%(-4.83)#23,562 |
| 71. | Battle Mountain | 1.3% | 4.9%(-3.58)#71 | 6.2%(-4.92)#23,707 |
| 72. | Lovelock | 1.2% | 4.9%(-3.71)#72 | 6.2%(-5.05)#23,892 |
1
2Common Questions
What are the Top 10 Cities with the Highest Percentage of Population Employed in Health Diagnosing & Treating in Nevada?
Top 10 Cities with the Highest Percentage of Population Employed in Health Diagnosing & Treating in Nevada are:
#1
38.9%
#2
26.2%
#3
17.2%
#4
16.0%
#5
15.9%
#6
14.7%
#7
12.9%
#8
12.6%
#9
11.5%
#10
11.4%
What city has the Highest Percentage of Population Employed in Health Diagnosing & Treating in Nevada?
Lakeridge has the Highest Percentage of Population Employed in Health Diagnosing & Treating in Nevada with 38.9%.
What is the Percentage of Population Employed in Health Diagnosing & Treating in the State of Nevada?
Percentage of Population Employed in Health Diagnosing & Treating in Nevada is 4.9%.
What is the Percentage of Population Employed in Health Diagnosing & Treating in the United States?
Percentage of Population Employed in Health Diagnosing & Treating in the United States is 6.2%.