Cities with the Highest Percentage of Population Employed in Health Diagnosing & Treating in Connecticut
RELATED REPORTS & OPTIONS
Health Diagnosing & Treating
Connecticut
Compare Cities
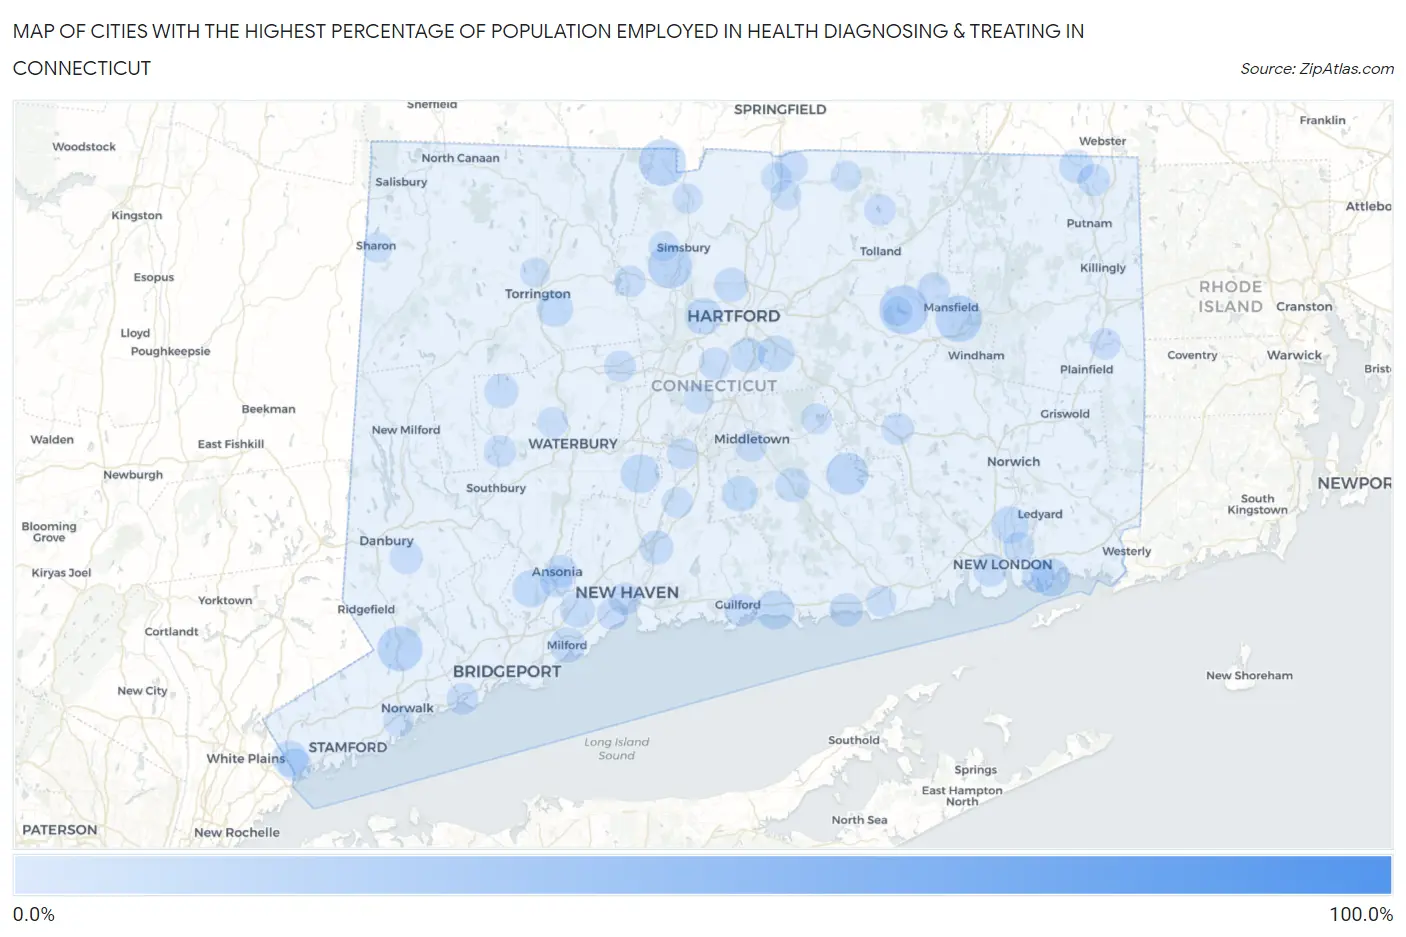
Map of Cities with the Highest Percentage of Population Employed in Health Diagnosing & Treating in Connecticut
0.0%
100.0%
Cities with the Highest Percentage of Population Employed in Health Diagnosing & Treating in Connecticut
| City | % Employed | vs State | vs National | |
| 1. | Candlewood Lake Club | 88.1% | 6.7%(+81.4)#1 | 6.2%(+81.9)#21 |
| 2. | Hawleyville | 26.3% | 6.7%(+19.6)#2 | 6.2%(+20.1)#396 |
| 3. | Knollcrest | 24.2% | 6.7%(+17.5)#3 | 6.2%(+18.0)#481 |
| 4. | Gaylordsville | 22.7% | 6.7%(+16.0)#4 | 6.2%(+16.4)#569 |
| 5. | Murray | 19.1% | 6.7%(+12.5)#5 | 6.2%(+12.9)#827 |
| 6. | South Coventry | 17.5% | 6.7%(+10.8)#6 | 6.2%(+11.2)#1,012 |
| 7. | Route 7 Gateway | 17.3% | 6.7%(+10.6)#7 | 6.2%(+11.0)#1,040 |
| 8. | North Granby | 16.1% | 6.7%(+9.43)#8 | 6.2%(+9.86)#1,265 |
| 9. | Mansfield Center | 15.9% | 6.7%(+9.27)#9 | 6.2%(+9.70)#1,294 |
| 10. | Cannondale | 15.0% | 6.7%(+8.30)#10 | 6.2%(+8.73)#1,515 |
| 11. | Litchfield Borough | 14.4% | 6.7%(+7.76)#11 | 6.2%(+8.19)#1,667 |
| 12. | Weatogue | 14.4% | 6.7%(+7.69)#12 | 6.2%(+8.12)#1,687 |
| 13. | Plattsville | 14.2% | 6.7%(+7.57)#13 | 6.2%(+8.00)#1,732 |
| 14. | Candlewood Knolls | 13.9% | 6.7%(+7.21)#14 | 6.2%(+7.64)#1,833 |
| 15. | Indian Field | 13.8% | 6.7%(+7.12)#15 | 6.2%(+7.55)#1,867 |
| 16. | Sacred Heart University | 13.5% | 6.7%(+6.79)#16 | 6.2%(+7.22)#1,992 |
| 17. | Moodus | 13.2% | 6.7%(+6.52)#17 | 6.2%(+6.96)#2,106 |
| 18. | Botsford | 12.7% | 6.7%(+6.00)#18 | 6.2%(+6.44)#2,344 |
| 19. | East | 12.6% | 6.7%(+5.89)#19 | 6.2%(+6.33)#2,389 |
| 20. | Madison Center | 11.3% | 6.7%(+4.66)#20 | 6.2%(+5.10)#3,095 |
| 21. | Cheshire Village | 11.3% | 6.7%(+4.57)#21 | 6.2%(+5.01)#3,151 |
| 22. | Taylor Corners | 11.2% | 6.7%(+4.53)#22 | 6.2%(+4.96)#3,183 |
| 23. | Quasset Lake | 11.0% | 6.7%(+4.36)#23 | 6.2%(+4.79)#3,313 |
| 24. | Noank | 10.8% | 6.7%(+4.08)#24 | 6.2%(+4.51)#3,512 |
| 25. | Gales Ferry | 10.5% | 6.7%(+3.79)#25 | 6.2%(+4.23)#3,759 |
| 26. | Shelton | 10.5% | 6.7%(+3.77)#26 | 6.2%(+4.21)#3,773 |
| 27. | Woodmont Borough | 10.1% | 6.7%(+3.45)#27 | 6.2%(+3.88)#4,088 |
| 28. | West Hartford | 10.1% | 6.7%(+3.44)#28 | 6.2%(+3.87)#4,095 |
| 29. | Daniels Farm | 10.0% | 6.7%(+3.33)#29 | 6.2%(+3.76)#4,190 |
| 30. | Glastonbury Center | 9.9% | 6.7%(+3.23)#30 | 6.2%(+3.66)#4,309 |
| 31. | Northwest Harwinton | 9.8% | 6.7%(+3.08)#31 | 6.2%(+3.52)#4,477 |
| 32. | Glenville | 9.4% | 6.7%(+2.75)#32 | 6.2%(+3.18)#4,857 |
| 33. | Durham | 9.3% | 6.7%(+2.66)#33 | 6.2%(+3.10)#4,977 |
| 34. | Greens Farms | 9.2% | 6.7%(+2.56)#34 | 6.2%(+2.99)#5,088 |
| 35. | Milford City Balance | 9.2% | 6.7%(+2.55)#35 | 6.2%(+2.98)#5,095 |
| 36. | Lake Chaffee | 9.0% | 6.7%(+2.28)#36 | 6.2%(+2.71)#5,487 |
| 37. | Wethersfield | 8.9% | 6.7%(+2.22)#37 | 6.2%(+2.66)#5,566 |
| 38. | West Mountain | 8.9% | 6.7%(+2.21)#38 | 6.2%(+2.64)#5,584 |
| 39. | Orange | 8.9% | 6.7%(+2.19)#39 | 6.2%(+2.63)#5,599 |
| 40. | Blue Hills | 8.7% | 6.7%(+2.04)#40 | 6.2%(+2.47)#5,825 |
| 41. | Higganum | 8.7% | 6.7%(+2.01)#41 | 6.2%(+2.45)#5,873 |
| 42. | Cornwall | 8.6% | 6.7%(+1.89)#42 | 6.2%(+2.33)#6,063 |
| 43. | Bethlehem Village | 8.5% | 6.7%(+1.85)#43 | 6.2%(+2.29)#6,112 |
| 44. | North Haven | 8.4% | 6.7%(+1.72)#44 | 6.2%(+2.15)#6,324 |
| 45. | Quinebaug | 8.4% | 6.7%(+1.69)#45 | 6.2%(+2.12)#6,368 |
| 46. | West Cornwall | 8.3% | 6.7%(+1.66)#46 | 6.2%(+2.09)#6,439 |
| 47. | Stepney | 8.1% | 6.7%(+1.45)#47 | 6.2%(+1.88)#6,771 |
| 48. | Westbrook Center | 8.1% | 6.7%(+1.39)#48 | 6.2%(+1.82)#6,870 |
| 49. | Pemberwick | 8.0% | 6.7%(+1.33)#49 | 6.2%(+1.77)#6,975 |
| 50. | Waterford | 8.0% | 6.7%(+1.29)#50 | 6.2%(+1.72)#7,049 |
| 51. | Bethel | 7.9% | 6.7%(+1.27)#51 | 6.2%(+1.70)#7,103 |
| 52. | Brookfield Center | 7.9% | 6.7%(+1.26)#52 | 6.2%(+1.69)#7,122 |
| 53. | Mill Plain | 7.9% | 6.7%(+1.25)#53 | 6.2%(+1.68)#7,129 |
| 54. | Newtown Borough | 7.9% | 6.7%(+1.22)#54 | 6.2%(+1.65)#7,179 |
| 55. | Poquonock Bridge | 7.9% | 6.7%(+1.21)#55 | 6.2%(+1.64)#7,214 |
| 56. | Sherwood Manor | 7.9% | 6.7%(+1.19)#56 | 6.2%(+1.63)#7,235 |
| 57. | Ball Pond | 7.9% | 6.7%(+1.19)#57 | 6.2%(+1.63)#7,237 |
| 58. | Guilford Center | 7.9% | 6.7%(+1.18)#58 | 6.2%(+1.61)#7,269 |
| 59. | Groton Long Point Borough | 7.8% | 6.7%(+1.13)#59 | 6.2%(+1.57)#7,354 |
| 60. | Candlewood Isle | 7.8% | 6.7%(+1.10)#60 | 6.2%(+1.53)#7,429 |
| 61. | Storrs | 7.7% | 6.7%(+0.989)#61 | 6.2%(+1.42)#7,645 |
| 62. | New Haven | 7.5% | 6.7%(+0.807)#62 | 6.2%(+1.24)#8,041 |
| 63. | Ansonia | 7.4% | 6.7%(+0.748)#63 | 6.2%(+1.18)#8,161 |
| 64. | Colchester | 7.4% | 6.7%(+0.704)#64 | 6.2%(+1.14)#8,272 |
| 65. | North Grosvenor Dale | 7.3% | 6.7%(+0.639)#65 | 6.2%(+1.07)#8,434 |
| 66. | Newington | 7.3% | 6.7%(+0.632)#66 | 6.2%(+1.06)#8,453 |
| 67. | Woodbury Center | 7.3% | 6.7%(+0.595)#67 | 6.2%(+1.03)#8,536 |
| 68. | Derby | 7.3% | 6.7%(+0.580)#68 | 6.2%(+1.01)#8,571 |
| 69. | Lake Bungee | 7.2% | 6.7%(+0.527)#69 | 6.2%(+0.960)#8,676 |
| 70. | Southport | 7.0% | 6.7%(+0.344)#70 | 6.2%(+0.777)#9,107 |
| 71. | Trumbull Center | 7.0% | 6.7%(+0.297)#71 | 6.2%(+0.730)#9,235 |
| 72. | Coleytown | 6.9% | 6.7%(+0.237)#72 | 6.2%(+0.670)#9,385 |
| 73. | Bristol | 6.9% | 6.7%(+0.206)#73 | 6.2%(+0.639)#9,471 |
| 74. | Middletown | 6.8% | 6.7%(+0.167)#74 | 6.2%(+0.600)#9,558 |
| 75. | Crystal Lake | 6.8% | 6.7%(+0.144)#75 | 6.2%(+0.577)#9,615 |
| 76. | West Haven | 6.8% | 6.7%(+0.084)#76 | 6.2%(+0.517)#9,770 |
| 77. | Collinsville | 6.8% | 6.7%(+0.082)#77 | 6.2%(+0.515)#9,779 |
| 78. | Meriden | 6.8% | 6.7%(+0.082)#78 | 6.2%(+0.515)#9,781 |
| 79. | Moosup | 6.7% | 6.7%(-0.004)#79 | 6.2%(+0.430)#9,981 |
| 80. | Conning Towers Nautilus Park | 6.6% | 6.7%(-0.061)#80 | 6.2%(+0.372)#10,143 |
| 81. | Norwalk | 6.6% | 6.7%(-0.102)#81 | 6.2%(+0.332)#10,247 |
| 82. | Oakville | 6.6% | 6.7%(-0.110)#82 | 6.2%(+0.323)#10,278 |
| 83. | Wallingford Center | 6.6% | 6.7%(-0.126)#83 | 6.2%(+0.307)#10,317 |
| 84. | Lake Pocotopaug | 6.5% | 6.7%(-0.152)#84 | 6.2%(+0.282)#10,376 |
| 85. | Somers | 6.5% | 6.7%(-0.205)#85 | 6.2%(+0.229)#10,511 |
| 86. | Old Saybrook Center | 6.4% | 6.7%(-0.315)#86 | 6.2%(+0.118)#10,806 |
| 87. | Thompsonville | 6.3% | 6.7%(-0.378)#87 | 6.2%(+0.055)#10,967 |
| 88. | Candlewood Shores | 6.3% | 6.7%(-0.389)#88 | 6.2%(+0.044)#10,997 |
| 89. | Salmon Brook | 6.2% | 6.7%(-0.467)#89 | 6.2%(-0.034)#11,193 |
| 90. | Inglenook | 6.2% | 6.7%(-0.477)#90 | 6.2%(-0.043)#11,218 |
| 91. | Southwood Acres | 6.2% | 6.7%(-0.523)#91 | 6.2%(-0.089)#11,332 |
| 92. | Bigelow Corners | 6.1% | 6.7%(-0.529)#92 | 6.2%(-0.096)#11,357 |
| 93. | New Canaan | 6.1% | 6.7%(-0.550)#93 | 6.2%(-0.116)#11,398 |
| 94. | Lakes East | 6.1% | 6.7%(-0.563)#94 | 6.2%(-0.130)#11,441 |
| 95. | Kensington | 6.1% | 6.7%(-0.564)#95 | 6.2%(-0.131)#11,442 |
| 96. | Coventry Lake | 6.1% | 6.7%(-0.568)#96 | 6.2%(-0.135)#11,456 |
| 97. | Northford | 6.1% | 6.7%(-0.589)#97 | 6.2%(-0.156)#11,515 |
| 98. | Sharon | 6.0% | 6.7%(-0.648)#98 | 6.2%(-0.215)#11,662 |
| 99. | Torrington | 6.0% | 6.7%(-0.709)#99 | 6.2%(-0.275)#11,829 |
| 100. | West Simsbury | 5.9% | 6.7%(-0.775)#100 | 6.2%(-0.342)#11,985 |
Common Questions
What are the Top 10 Cities with the Highest Percentage of Population Employed in Health Diagnosing & Treating in Connecticut?
Top 10 Cities with the Highest Percentage of Population Employed in Health Diagnosing & Treating in Connecticut are:
#1
17.5%
#2
16.1%
#3
15.9%
#4
15.0%
#5
14.4%
#6
13.2%
#7
11.3%
#8
11.3%
#9
10.8%
#10
10.5%
What city has the Highest Percentage of Population Employed in Health Diagnosing & Treating in Connecticut?
South Coventry has the Highest Percentage of Population Employed in Health Diagnosing & Treating in Connecticut with 17.5%.
What is the Percentage of Population Employed in Health Diagnosing & Treating in the State of Connecticut?
Percentage of Population Employed in Health Diagnosing & Treating in Connecticut is 6.7%.
What is the Percentage of Population Employed in Health Diagnosing & Treating in the United States?
Percentage of Population Employed in Health Diagnosing & Treating in the United States is 6.2%.