Etna, CA Map & Demographics
Etna Map
Etna Overview
$26,286
PER CAPITA INCOME
$66,827
AVG FAMILY INCOME
$51,667
AVG HOUSEHOLD INCOME
27.0%
WAGE / INCOME GAP [ % ]
73.0¢/ $1
WAGE / INCOME GAP [ $ ]
0.39
INEQUALITY / GINI INDEX
717
TOTAL POPULATION
338
MALE POPULATION
379
FEMALE POPULATION
89.18
MALES / 100 FEMALES
112.13
FEMALES / 100 MALES
42.5
MEDIAN AGE
3.1
AVG FAMILY SIZE
2.5
AVG HOUSEHOLD SIZE
316
LABOR FORCE [ PEOPLE ]
54.2%
PERCENT IN LABOR FORCE
18.0%
UNEMPLOYMENT RATE
Etna Zip Codes
Etna Area Codes
Income in Etna
Income Overview in Etna
Per Capita Income in Etna is $26,286, while median incomes of families and households are $66,827 and $51,667 respectively.
| Characteristic | Number | Measure |
| Per Capita Income | 717 | $26,286 |
| Median Family Income | 169 | $66,827 |
| Mean Family Income | 169 | $69,909 |
| Median Household Income | 280 | $51,667 |
| Mean Household Income | 280 | $57,258 |
| Income Deficit | 169 | $0 |
| Wage / Income Gap (%) | 717 | 26.99% |
| Wage / Income Gap ($) | 717 | 73.01¢ per $1 |
| Gini / Inequality Index | 717 | 0.39 |
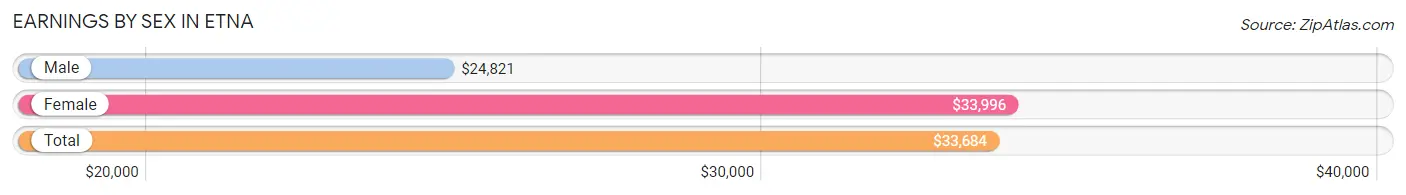
Earnings by Sex in Etna
Average Earnings in Etna are $33,684, $24,821 for men and $33,996 for women, a difference of 27.0%.
| Sex | Number | Average Earnings |
| Male | 123 (40.2%) | $24,821 |
| Female | 183 (59.8%) | $33,996 |
| Total | 306 (100.0%) | $33,684 |
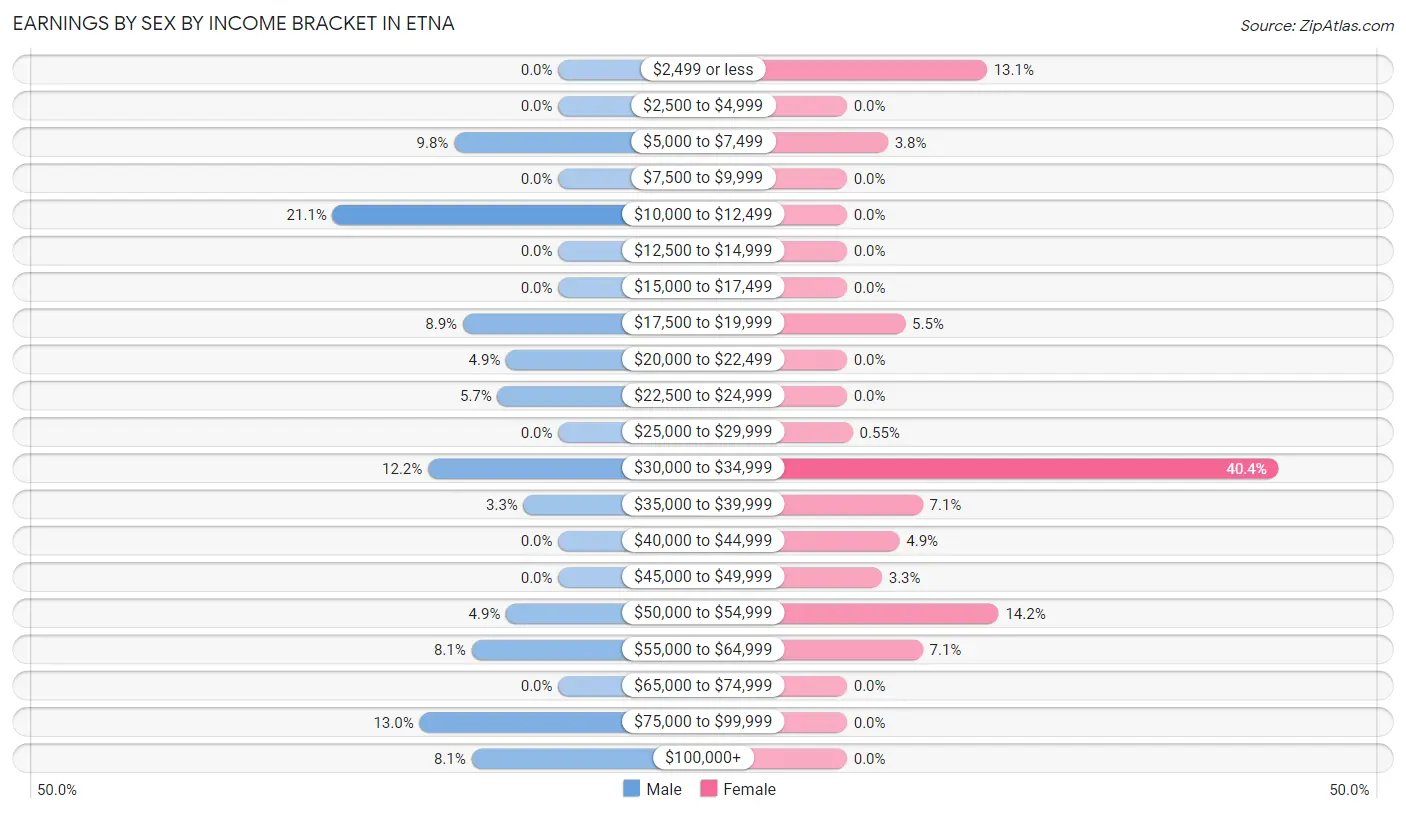
Earnings by Sex by Income Bracket in Etna
The most common earnings brackets in Etna are $10,000 to $12,499 for men (26 | 21.1%) and $30,000 to $34,999 for women (74 | 40.4%).
| Income | Male | Female |
| $2,499 or less | 0 (0.0%) | 24 (13.1%) |
| $2,500 to $4,999 | 0 (0.0%) | 0 (0.0%) |
| $5,000 to $7,499 | 12 (9.8%) | 7 (3.8%) |
| $7,500 to $9,999 | 0 (0.0%) | 0 (0.0%) |
| $10,000 to $12,499 | 26 (21.1%) | 0 (0.0%) |
| $12,500 to $14,999 | 0 (0.0%) | 0 (0.0%) |
| $15,000 to $17,499 | 0 (0.0%) | 0 (0.0%) |
| $17,500 to $19,999 | 11 (8.9%) | 10 (5.5%) |
| $20,000 to $22,499 | 6 (4.9%) | 0 (0.0%) |
| $22,500 to $24,999 | 7 (5.7%) | 0 (0.0%) |
| $25,000 to $29,999 | 0 (0.0%) | 1 (0.5%) |
| $30,000 to $34,999 | 15 (12.2%) | 74 (40.4%) |
| $35,000 to $39,999 | 4 (3.3%) | 13 (7.1%) |
| $40,000 to $44,999 | 0 (0.0%) | 9 (4.9%) |
| $45,000 to $49,999 | 0 (0.0%) | 6 (3.3%) |
| $50,000 to $54,999 | 6 (4.9%) | 26 (14.2%) |
| $55,000 to $64,999 | 10 (8.1%) | 13 (7.1%) |
| $65,000 to $74,999 | 0 (0.0%) | 0 (0.0%) |
| $75,000 to $99,999 | 16 (13.0%) | 0 (0.0%) |
| $100,000+ | 10 (8.1%) | 0 (0.0%) |
| Total | 123 (100.0%) | 183 (100.0%) |
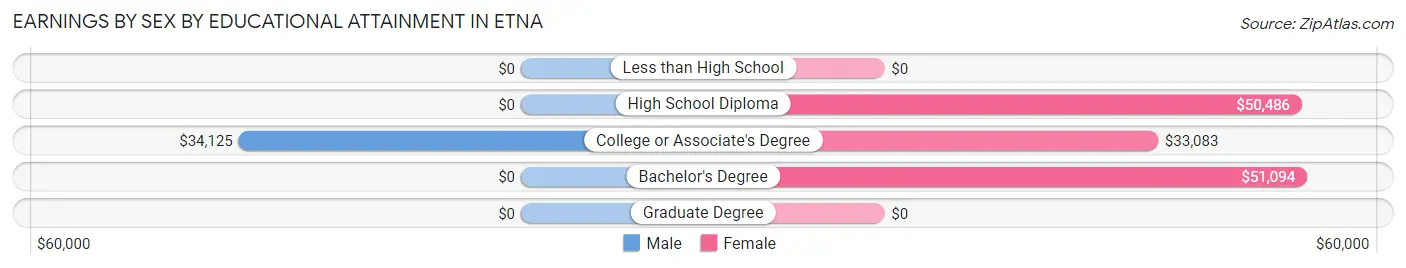
Earnings by Sex by Educational Attainment in Etna
Average earnings in Etna are $33,250 for men and $34,016 for women, a difference of 2.2%. Men with an educational attainment of college or associate's degree enjoy the highest average annual earnings of $34,125, while those with college or associate's degree education earn the least with $34,125. Women with an educational attainment of bachelor's degree earn the most with the average annual earnings of $51,094, while those with college or associate's degree education have the smallest earnings of $33,083.
| Educational Attainment | Male Income | Female Income |
| Less than High School | - | - |
| High School Diploma | - | - |
| College or Associate's Degree | $34,125 | $33,083 |
| Bachelor's Degree | - | - |
| Graduate Degree | - | - |
| Total | $33,250 | $34,016 |
Family Income in Etna
Family Income Brackets in Etna
According to the Etna family income data, there are 72 families falling into the $50,000 to $74,999 income range, which is the most common income bracket and makes up 42.6% of all families.

| Income Bracket | # Families | % Families |
| Less than $10,000 | 23 | 13.6% |
| $10,000 to $14,999 | 0 | 0.0% |
| $15,000 to $24,999 | 0 | 0.0% |
| $25,000 to $34,999 | 0 | 0.0% |
| $35,000 to $49,999 | 24 | 14.2% |
| $50,000 to $74,999 | 72 | 42.6% |
| $75,000 to $99,999 | 10 | 5.9% |
| $100,000 to $149,999 | 34 | 20.1% |
| $150,000 to $199,999 | 6 | 3.6% |
| $200,000+ | 0 | 0.0% |
Family Income by Famaliy Size in Etna
2-person families (128 | 75.7%) account for the highest median family income in Etna with $65,577 per family, while 2-person families (128 | 75.7%) have the highest median income of $32,788 per family member.
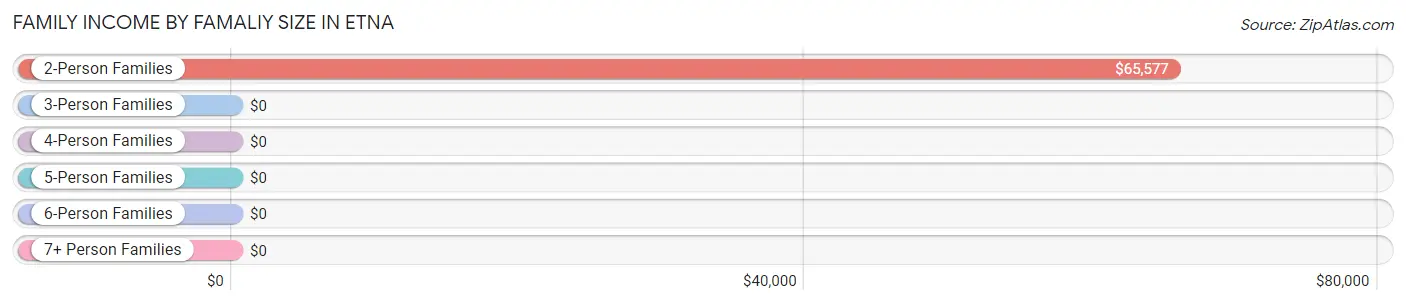
| Income Bracket | # Families | Median Income |
| 2-Person Families | 128 (75.7%) | $65,577 |
| 3-Person Families | 14 (8.3%) | $0 |
| 4-Person Families | 0 (0.0%) | $0 |
| 5-Person Families | 9 (5.3%) | $0 |
| 6-Person Families | 12 (7.1%) | $0 |
| 7+ Person Families | 6 (3.5%) | $0 |
| Total | 169 (100.0%) | $66,827 |
Family Income by Number of Earners in Etna
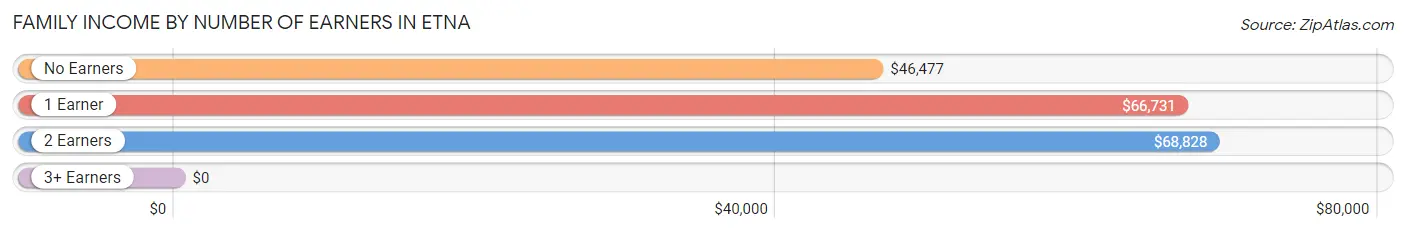
| Number of Earners | # Families | Median Income |
| No Earners | 51 (30.2%) | $46,477 |
| 1 Earner | 68 (40.2%) | $66,731 |
| 2 Earners | 43 (25.4%) | $68,828 |
| 3+ Earners | 7 (4.1%) | $0 |
| Total | 169 (100.0%) | $66,827 |
Household Income in Etna
Household Income Brackets in Etna
With 80 households falling in the category, the $50,000 to $74,999 income range is the most frequent in Etna, accounting for 28.6% of all households.
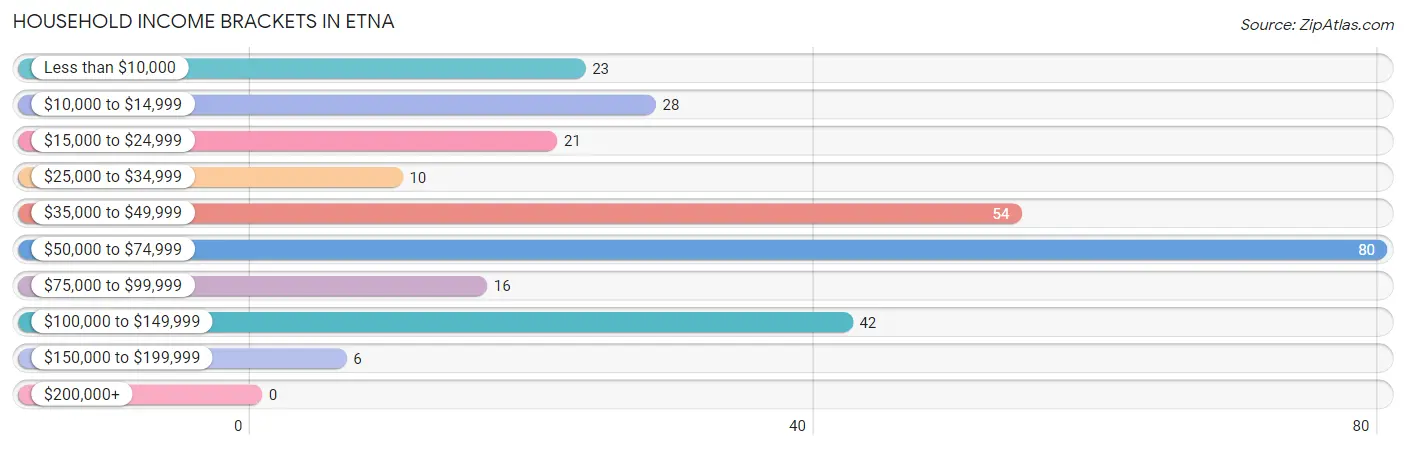
| Income Bracket | # Households | % Households |
| Less than $10,000 | 23 | 8.2% |
| $10,000 to $14,999 | 28 | 10.0% |
| $15,000 to $24,999 | 21 | 7.5% |
| $25,000 to $34,999 | 10 | 3.6% |
| $35,000 to $49,999 | 54 | 19.3% |
| $50,000 to $74,999 | 80 | 28.6% |
| $75,000 to $99,999 | 16 | 5.7% |
| $100,000 to $149,999 | 42 | 15.0% |
| $150,000 to $199,999 | 6 | 2.1% |
| $200,000+ | 0 | 0.0% |
Household Income by Householder Age in Etna
The median household income in Etna is $51,667, with the highest median household income of $65,385 found in the 45 to 64 years age bracket for the primary householder. A total of 94 households (33.6%) fall into this category. Meanwhile, the 15 to 24 years age bracket for the primary householder has the lowest median household income of $0, with 1 households (0.4%) in this group.
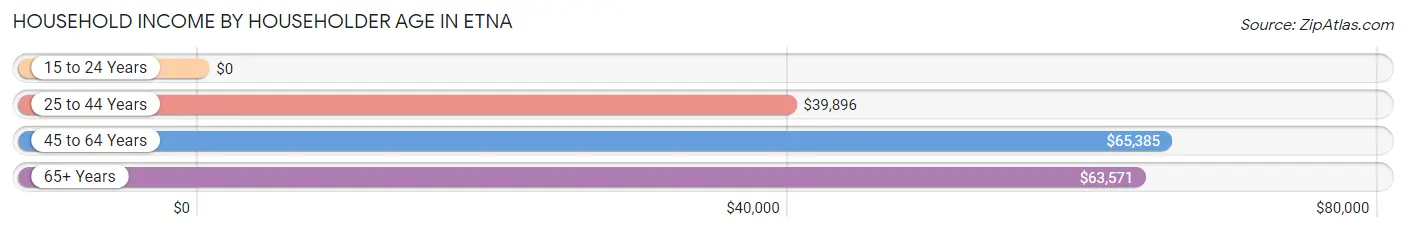
| Income Bracket | # Households | Median Income |
| 15 to 24 Years | 1 (0.4%) | $0 |
| 25 to 44 Years | 97 (34.6%) | $39,896 |
| 45 to 64 Years | 94 (33.6%) | $65,385 |
| 65+ Years | 88 (31.4%) | $63,571 |
| Total | 280 (100.0%) | $51,667 |
Poverty in Etna
Income Below Poverty by Sex and Age in Etna
With 9.8% poverty level for males and 19.8% for females among the residents of Etna, 35 to 44 year old males and 16 and 17 year old females are the most vulnerable to poverty, with 16 males (48.5%) and 7 females (100.0%) in their respective age groups living below the poverty level.
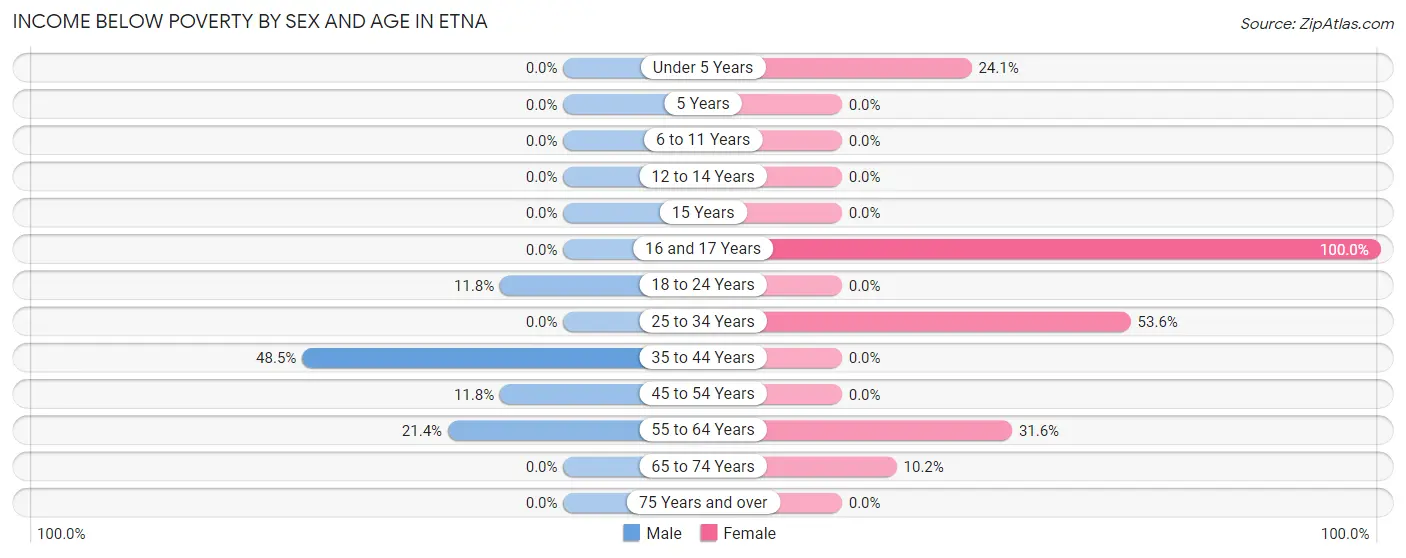
| Age Bracket | Male | Female |
| Under 5 Years | 0 (0.0%) | 13 (24.1%) |
| 5 Years | 0 (0.0%) | 0 (0.0%) |
| 6 to 11 Years | 0 (0.0%) | 0 (0.0%) |
| 12 to 14 Years | 0 (0.0%) | 0 (0.0%) |
| 15 Years | 0 (0.0%) | 0 (0.0%) |
| 16 and 17 Years | 0 (0.0%) | 7 (100.0%) |
| 18 to 24 Years | 2 (11.8%) | 0 (0.0%) |
| 25 to 34 Years | 0 (0.0%) | 37 (53.6%) |
| 35 to 44 Years | 16 (48.5%) | 0 (0.0%) |
| 45 to 54 Years | 8 (11.8%) | 0 (0.0%) |
| 55 to 64 Years | 6 (21.4%) | 12 (31.6%) |
| 65 to 74 Years | 0 (0.0%) | 6 (10.2%) |
| 75 Years and over | 0 (0.0%) | 0 (0.0%) |
| Total | 32 (9.8%) | 75 (19.8%) |
Income Above Poverty by Sex and Age in Etna
According to the poverty statistics in Etna, males aged under 5 years and females aged 6 to 11 years are the age groups that are most secure financially, with 100.0% of males and 100.0% of females in these age groups living above the poverty line.
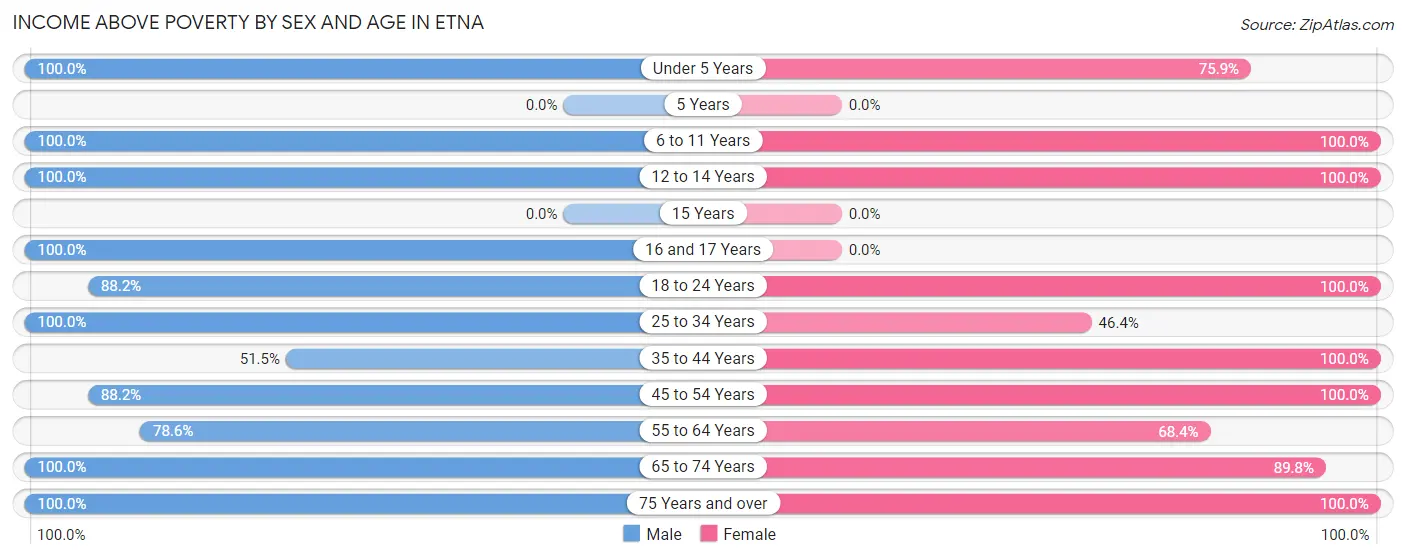
| Age Bracket | Male | Female |
| Under 5 Years | 17 (100.0%) | 41 (75.9%) |
| 5 Years | 0 (0.0%) | 0 (0.0%) |
| 6 to 11 Years | 26 (100.0%) | 6 (100.0%) |
| 12 to 14 Years | 11 (100.0%) | 8 (100.0%) |
| 15 Years | 0 (0.0%) | 0 (0.0%) |
| 16 and 17 Years | 13 (100.0%) | 0 (0.0%) |
| 18 to 24 Years | 15 (88.2%) | 16 (100.0%) |
| 25 to 34 Years | 24 (100.0%) | 32 (46.4%) |
| 35 to 44 Years | 17 (51.5%) | 60 (100.0%) |
| 45 to 54 Years | 60 (88.2%) | 44 (100.0%) |
| 55 to 64 Years | 22 (78.6%) | 26 (68.4%) |
| 65 to 74 Years | 75 (100.0%) | 53 (89.8%) |
| 75 Years and over | 14 (100.0%) | 18 (100.0%) |
| Total | 294 (90.2%) | 304 (80.2%) |
Income Below Poverty Among Married-Couple Families in Etna
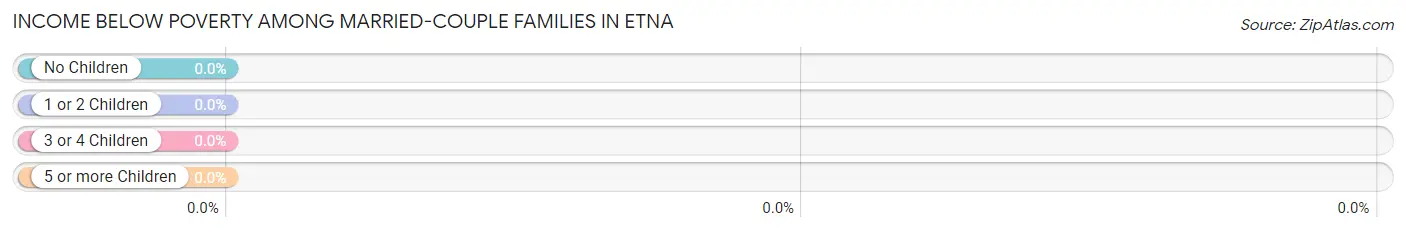
| Children | Above Poverty | Below Poverty |
| No Children | 57 (100.0%) | 0 (0.0%) |
| 1 or 2 Children | 21 (100.0%) | 0 (0.0%) |
| 3 or 4 Children | 14 (100.0%) | 0 (0.0%) |
| 5 or more Children | 6 (100.0%) | 0 (0.0%) |
| Total | 98 (100.0%) | 0 (0.0%) |
Income Below Poverty Among Single-Parent Households in Etna
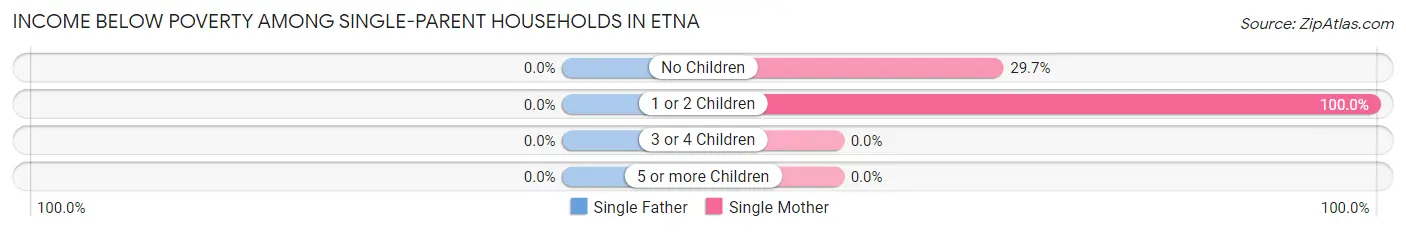
| Children | Single Father | Single Mother |
| No Children | 0 (0.0%) | 11 (29.7%) |
| 1 or 2 Children | 0 (0.0%) | 12 (100.0%) |
| 3 or 4 Children | 0 (0.0%) | 0 (0.0%) |
| 5 or more Children | 0 (0.0%) | 0 (0.0%) |
| Total | 0 (0.0%) | 23 (46.9%) |
Income Below Poverty Among Married-Couple vs Single-Parent Households in Etna
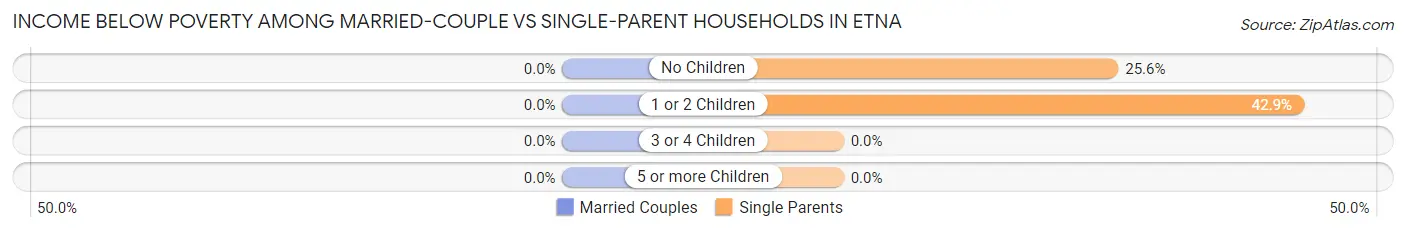
| Children | Married-Couple Families | Single-Parent Households |
| No Children | 0 (0.0%) | 11 (25.6%) |
| 1 or 2 Children | 0 (0.0%) | 12 (42.9%) |
| 3 or 4 Children | 0 (0.0%) | 0 (0.0%) |
| 5 or more Children | 0 (0.0%) | 0 (0.0%) |
| Total | 0 (0.0%) | 23 (32.4%) |
Race in Etna
The most populous races in Etna are White / Caucasian (573 | 79.9%), Two or more Races (81 | 11.3%), and Black / African American (42 | 5.9%).
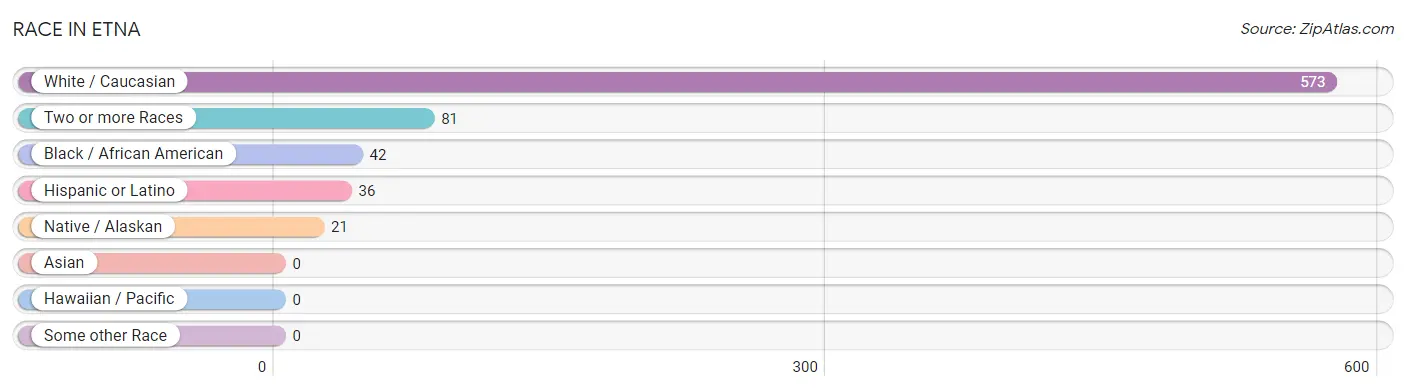
| Race | # Population | % Population |
| Asian | 0 | 0.0% |
| Black / African American | 42 | 5.9% |
| Hawaiian / Pacific | 0 | 0.0% |
| Hispanic or Latino | 36 | 5.0% |
| Native / Alaskan | 21 | 2.9% |
| White / Caucasian | 573 | 79.9% |
| Two or more Races | 81 | 11.3% |
| Some other Race | 0 | 0.0% |
| Total | 717 | 100.0% |
Ancestry in Etna
The most populous ancestries reported in Etna are English (182 | 25.4%), German (142 | 19.8%), Irish (85 | 11.8%), Scottish (66 | 9.2%), and Portuguese (54 | 7.5%), together accounting for 73.8% of all Etna residents.
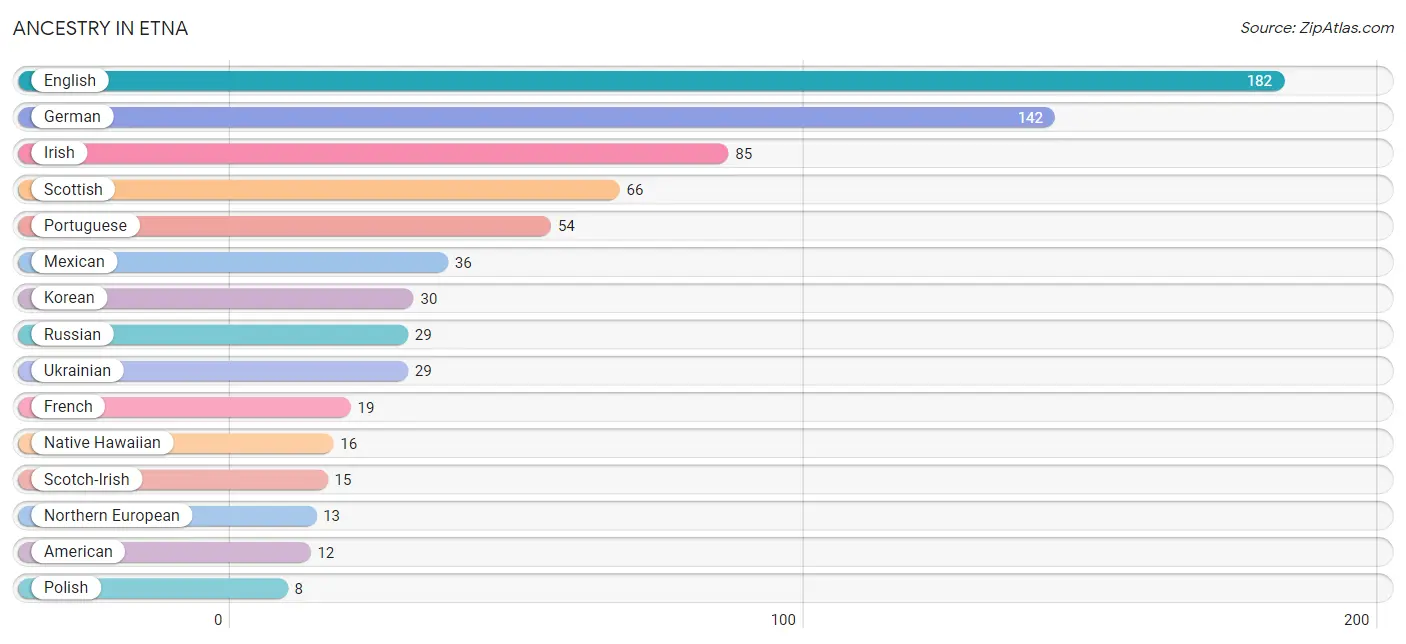
| Ancestry | # Population | % Population |
| American | 12 | 1.7% |
| Blackfeet | 1 | 0.1% |
| Cherokee | 3 | 0.4% |
| Danish | 7 | 1.0% |
| Dutch | 7 | 1.0% |
| English | 182 | 25.4% |
| French | 19 | 2.6% |
| German | 142 | 19.8% |
| Irish | 85 | 11.8% |
| Italian | 5 | 0.7% |
| Korean | 30 | 4.2% |
| Mexican | 36 | 5.0% |
| Native Hawaiian | 16 | 2.2% |
| Northern European | 13 | 1.8% |
| Polish | 8 | 1.1% |
| Portuguese | 54 | 7.5% |
| Russian | 29 | 4.0% |
| Scotch-Irish | 15 | 2.1% |
| Scottish | 66 | 9.2% |
| Swedish | 7 | 1.0% |
| Tlingit-Haida | 8 | 1.1% |
| Ukrainian | 29 | 4.0% | View All 22 Rows |
Immigrants in Etna
The most numerous immigrant groups reported in Etna came from Eastern Europe (6 | 0.8%), Europe (6 | 0.8%), and Ukraine (6 | 0.8%), together accounting for 2.5% of all Etna residents.
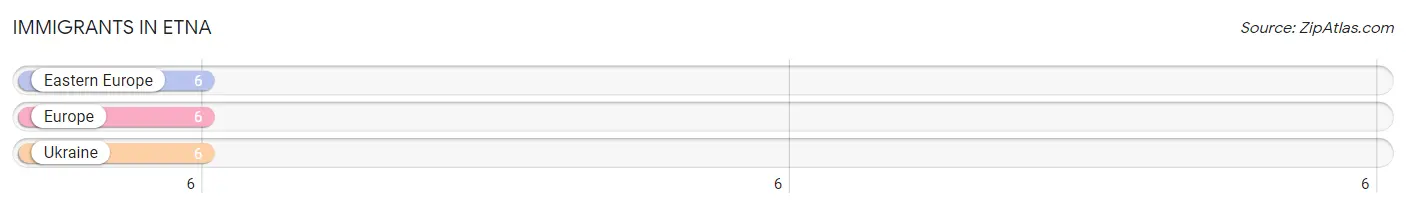
| Immigration Origin | # Population | % Population |
| Eastern Europe | 6 | 0.8% |
| Europe | 6 | 0.8% |
| Ukraine | 6 | 0.8% | View All 3 Rows |
Sex and Age in Etna
Sex and Age in Etna
The most populous age groups in Etna are 65 to 69 Years (64 | 18.9%) for men and 40 to 44 Years (57 | 15.0%) for women.
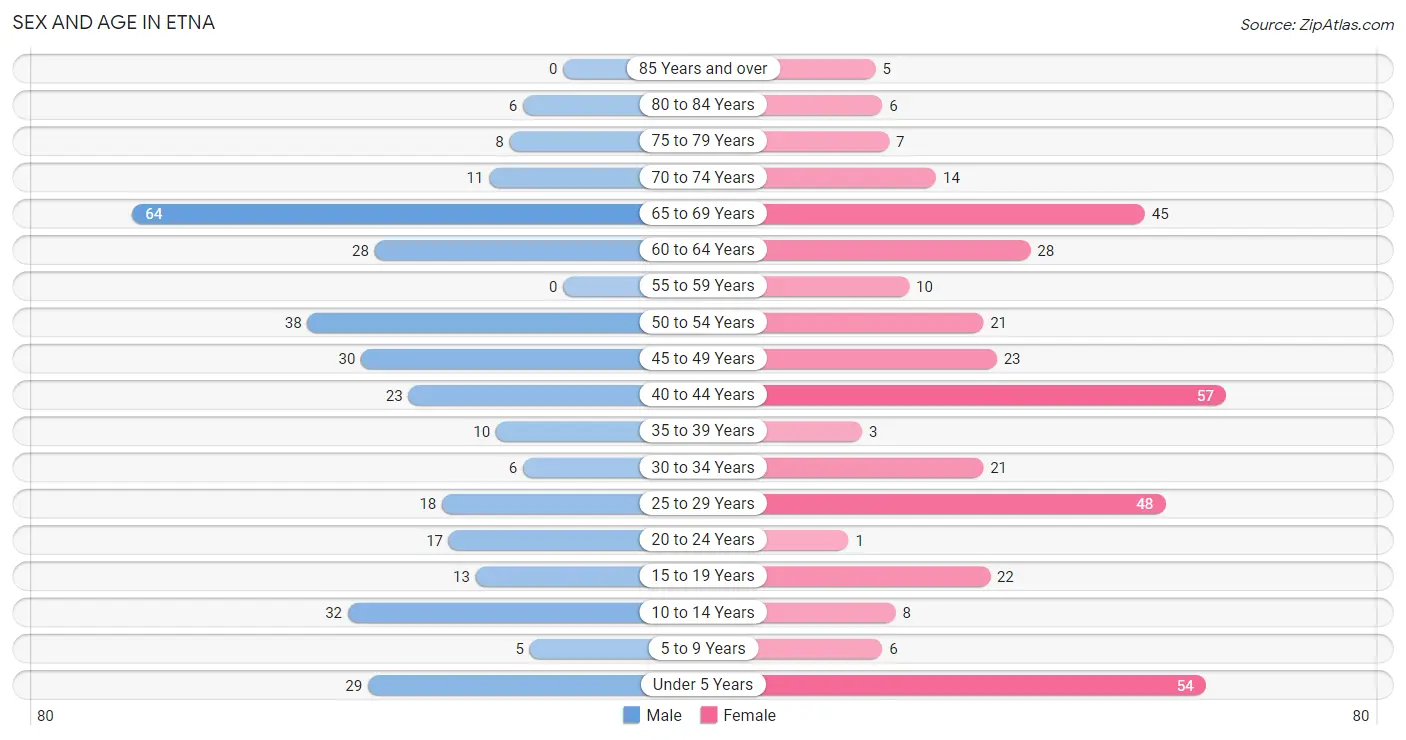
| Age Bracket | Male | Female |
| Under 5 Years | 29 (8.6%) | 54 (14.2%) |
| 5 to 9 Years | 5 (1.5%) | 6 (1.6%) |
| 10 to 14 Years | 32 (9.5%) | 8 (2.1%) |
| 15 to 19 Years | 13 (3.8%) | 22 (5.8%) |
| 20 to 24 Years | 17 (5.0%) | 1 (0.3%) |
| 25 to 29 Years | 18 (5.3%) | 48 (12.7%) |
| 30 to 34 Years | 6 (1.8%) | 21 (5.5%) |
| 35 to 39 Years | 10 (3.0%) | 3 (0.8%) |
| 40 to 44 Years | 23 (6.8%) | 57 (15.0%) |
| 45 to 49 Years | 30 (8.9%) | 23 (6.1%) |
| 50 to 54 Years | 38 (11.2%) | 21 (5.5%) |
| 55 to 59 Years | 0 (0.0%) | 10 (2.6%) |
| 60 to 64 Years | 28 (8.3%) | 28 (7.4%) |
| 65 to 69 Years | 64 (18.9%) | 45 (11.9%) |
| 70 to 74 Years | 11 (3.3%) | 14 (3.7%) |
| 75 to 79 Years | 8 (2.4%) | 7 (1.8%) |
| 80 to 84 Years | 6 (1.8%) | 6 (1.6%) |
| 85 Years and over | 0 (0.0%) | 5 (1.3%) |
| Total | 338 (100.0%) | 379 (100.0%) |
Families and Households in Etna
Median Family Size in Etna
The median family size in Etna is 3.12 persons per family, with married-couple families (98 | 58.0%) accounting for the largest median family size of 3.35 persons per family. On the other hand, single female/mother families (49 | 29.0%) represent the smallest median family size with 2.71 persons per family.
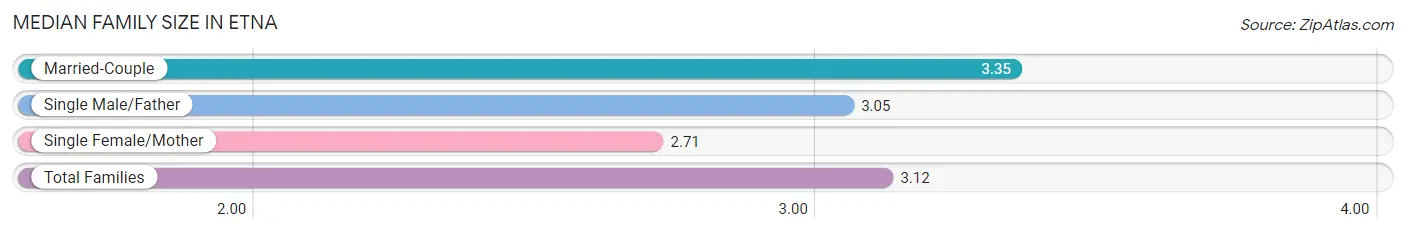
| Family Type | # Families | Family Size |
| Married-Couple | 98 (58.0%) | 3.35 |
| Single Male/Father | 22 (13.0%) | 3.05 |
| Single Female/Mother | 49 (29.0%) | 2.71 |
| Total Families | 169 (100.0%) | 3.12 |
Median Household Size in Etna
The median household size in Etna is 2.45 persons per household, with married-couple households (98 | 35.0%) accounting for the largest median household size of 3.42 persons per household. non-family households (111 | 39.6%) represent the smallest median household size with 1.22 persons per household.
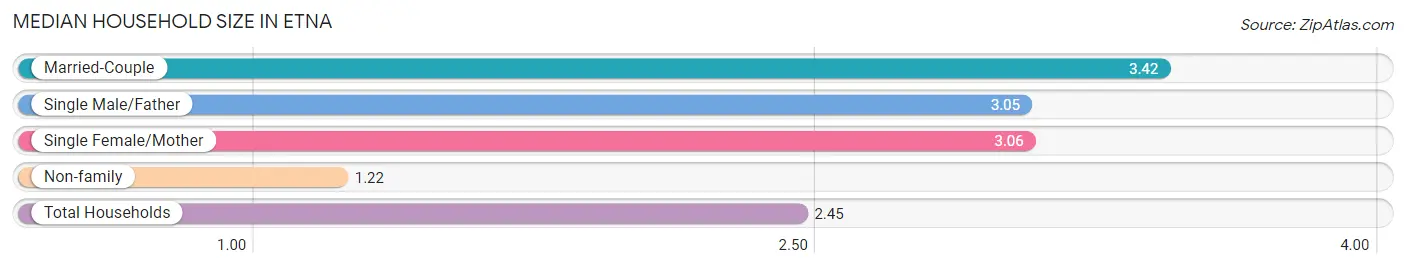
| Household Type | # Households | Household Size |
| Married-Couple | 98 (35.0%) | 3.42 |
| Single Male/Father | 22 (7.9%) | 3.05 |
| Single Female/Mother | 49 (17.5%) | 3.06 |
| Non-family | 111 (39.6%) | 1.22 |
| Total Households | 280 (100.0%) | 2.45 |
Household Size by Marriage Status in Etna
Out of a total of 280 households in Etna, 169 (60.4%) are family households, while 111 (39.6%) are nonfamily households. The most numerous type of family households are 2-person households, comprising 108, and the most common type of nonfamily households are 1-person households, comprising 93.
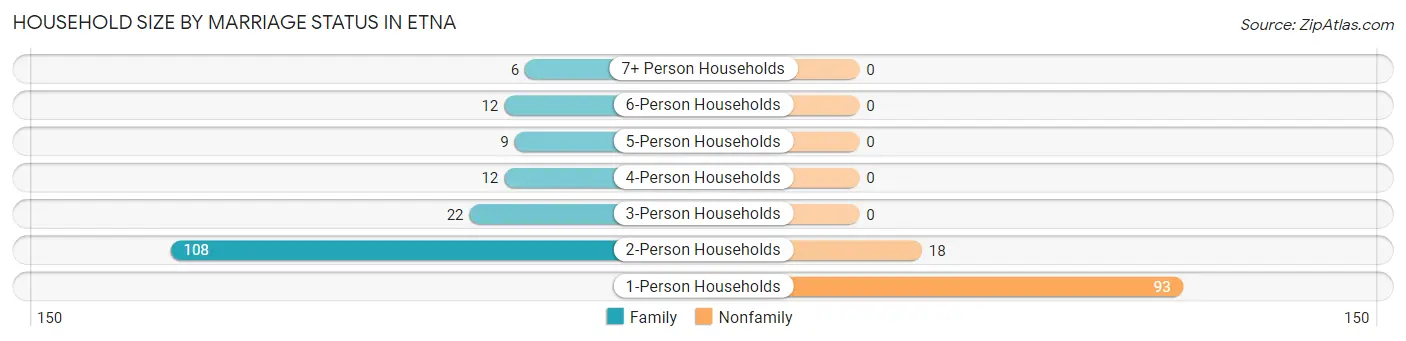
| Household Size | Family Households | Nonfamily Households |
| 1-Person Households | - | 93 (33.2%) |
| 2-Person Households | 108 (38.6%) | 18 (6.4%) |
| 3-Person Households | 22 (7.9%) | 0 (0.0%) |
| 4-Person Households | 12 (4.3%) | 0 (0.0%) |
| 5-Person Households | 9 (3.2%) | 0 (0.0%) |
| 6-Person Households | 12 (4.3%) | 0 (0.0%) |
| 7+ Person Households | 6 (2.1%) | 0 (0.0%) |
| Total | 169 (60.4%) | 111 (39.6%) |
Female Fertility in Etna
Fertility by Age in Etna
| Age Bracket | Women with Births | Births / 1,000 Women |
| 15 to 19 years | 0 (0.0%) | 0.0 |
| 20 to 34 years | 0 (0.0%) | 0.0 |
| 35 to 50 years | 0 (0.0%) | 0.0 |
| Total | 0 (0.0%) | 0.0 |
Fertility by Age by Marriage Status in Etna
| Age Bracket | Married | Unmarried |
| 15 to 19 years | 0 (0.0%) | 0 (0.0%) |
| 20 to 34 years | 0 (0.0%) | 0 (0.0%) |
| 35 to 50 years | 0 (0.0%) | 0 (0.0%) |
| Total | 0 (0.0%) | 0 (0.0%) |
Fertility by Education in Etna
| Educational Attainment | Women with Births | Births / 1,000 Women |
| Less than High School | 0 (0.0%) | 0.0 |
| High School Diploma | 0 (0.0%) | 0.0 |
| College or Associate's Degree | 0 (0.0%) | 0.0 |
| Bachelor's Degree | 0 (0.0%) | 0.0 |
| Graduate Degree | 0 (0.0%) | 0.0 |
| Total | 0 (0.0%) | 0.0 |
Fertility by Education by Marriage Status in Etna
| Educational Attainment | Married | Unmarried |
| Less than High School | 0 (0.0%) | 0 (0.0%) |
| High School Diploma | 0 (0.0%) | 0 (0.0%) |
| College or Associate's Degree | 0 (0.0%) | 0 (0.0%) |
| Bachelor's Degree | 0 (0.0%) | 0 (0.0%) |
| Graduate Degree | 0 (0.0%) | 0 (0.0%) |
| Total | 0 (0.0%) | 0 (0.0%) |
Employment Characteristics in Etna
Employment by Class of Employer in Etna
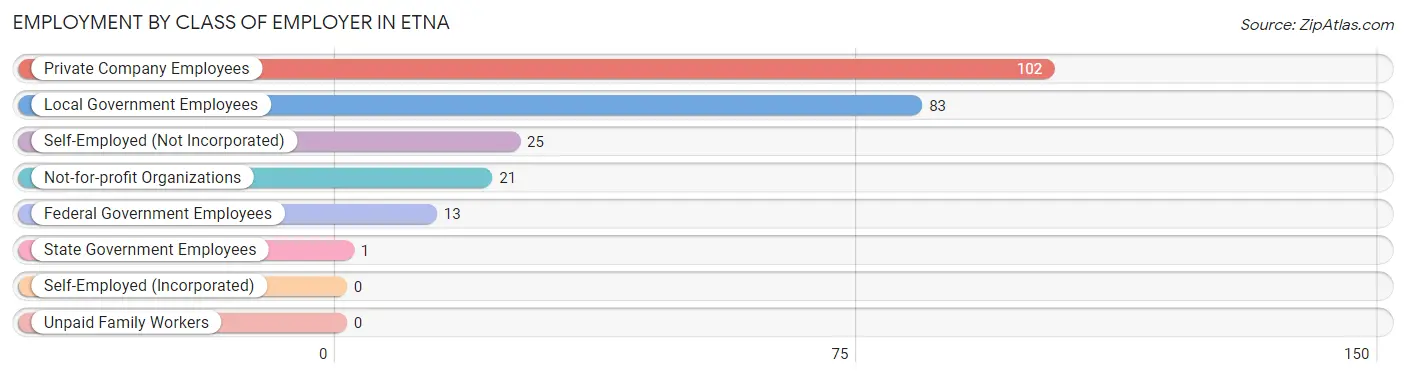
Among the 245 employed individuals in Etna, private company employees (102 | 41.6%), local government employees (83 | 33.9%), and self-employed (not incorporated) (25 | 10.2%) make up the most common classes of employment.
| Employer Class | # Employees | % Employees |
| Private Company Employees | 102 | 41.6% |
| Self-Employed (Incorporated) | 0 | 0.0% |
| Self-Employed (Not Incorporated) | 25 | 10.2% |
| Not-for-profit Organizations | 21 | 8.6% |
| Local Government Employees | 83 | 33.9% |
| State Government Employees | 1 | 0.4% |
| Federal Government Employees | 13 | 5.3% |
| Unpaid Family Workers | 0 | 0.0% |
| Total | 245 | 100.0% |
Employment Status by Age in Etna
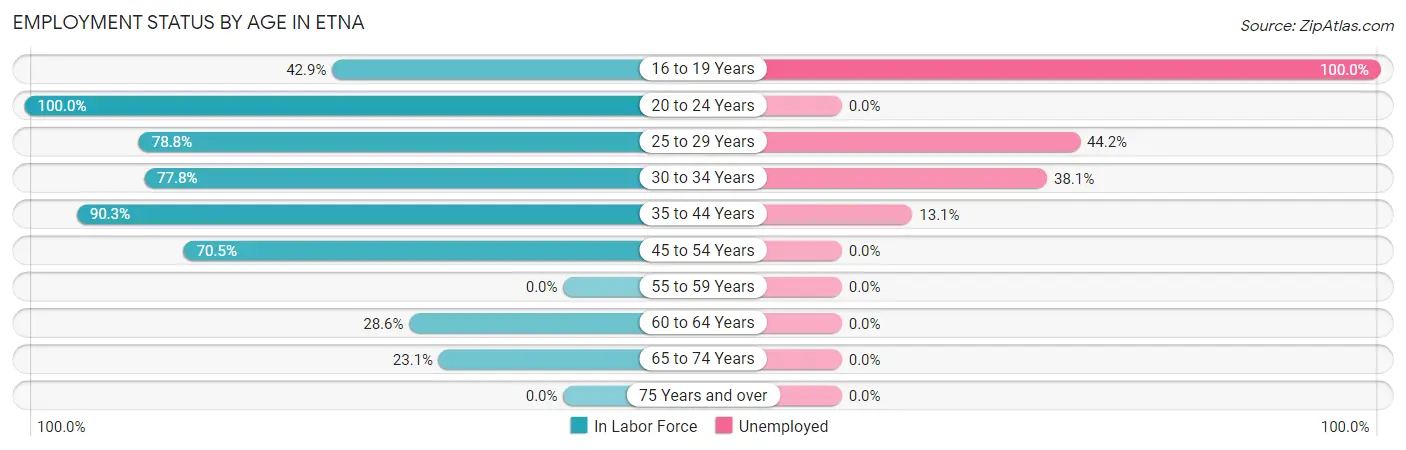
According to the labor force statistics for Etna, out of the total population over 16 years of age (583), 54.2% or 316 individuals are in the labor force, with 18.0% or 57 of them unemployed. The age group with the highest labor force participation rate is 20 to 24 years, with 100.0% or 18 individuals in the labor force. Within the labor force, the 16 to 19 years age range has the highest percentage of unemployed individuals, with 100.0% or 15 of them being unemployed.
| Age Bracket | In Labor Force | Unemployed |
| 16 to 19 Years | 15 (42.9%) | 15 (100.0%) |
| 20 to 24 Years | 18 (100.0%) | 0 (0.0%) |
| 25 to 29 Years | 52 (78.8%) | 23 (44.2%) |
| 30 to 34 Years | 21 (77.8%) | 8 (38.1%) |
| 35 to 44 Years | 84 (90.3%) | 11 (13.1%) |
| 45 to 54 Years | 79 (70.5%) | 0 (0.0%) |
| 55 to 59 Years | 0 (0.0%) | 0 (0.0%) |
| 60 to 64 Years | 16 (28.6%) | 0 (0.0%) |
| 65 to 74 Years | 31 (23.1%) | 0 (0.0%) |
| 75 Years and over | 0 (0.0%) | 0 (0.0%) |
| Total | 316 (54.2%) | 57 (18.0%) |
Employment Status by Educational Attainment in Etna
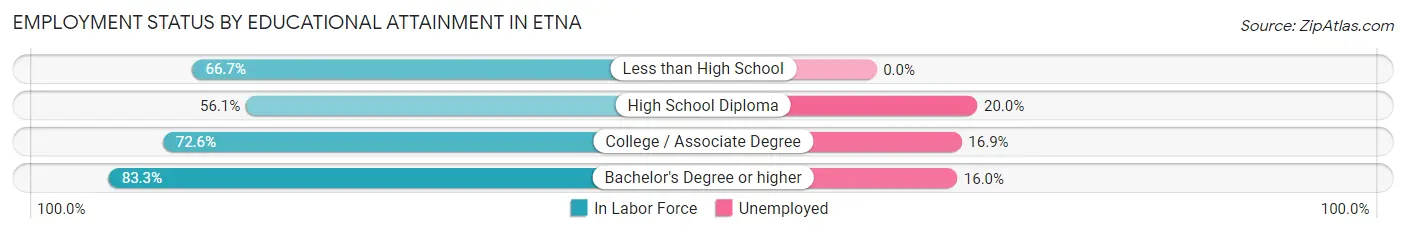
According to labor force statistics for Etna, 69.2% of individuals (252) out of the total population between 25 and 64 years of age (364) are in the labor force, with 16.7% or 42 of them being unemployed. The group with the highest labor force participation rate are those with the educational attainment of bachelor's degree or higher, with 83.3% or 50 individuals in the labor force. Within the labor force, individuals with high school diploma education have the highest percentage of unemployment, with 20.0% or 12 of them being unemployed.
| Educational Attainment | In Labor Force | Unemployed |
| Less than High School | 12 (66.7%) | 0 (0.0%) |
| High School Diploma | 60 (56.1%) | 21 (20.0%) |
| College / Associate Degree | 130 (72.6%) | 30 (16.9%) |
| Bachelor's Degree or higher | 50 (83.3%) | 10 (16.0%) |
| Total | 252 (69.2%) | 61 (16.7%) |
Employment Occupations by Sex in Etna
Management, Business, Science and Arts Occupations
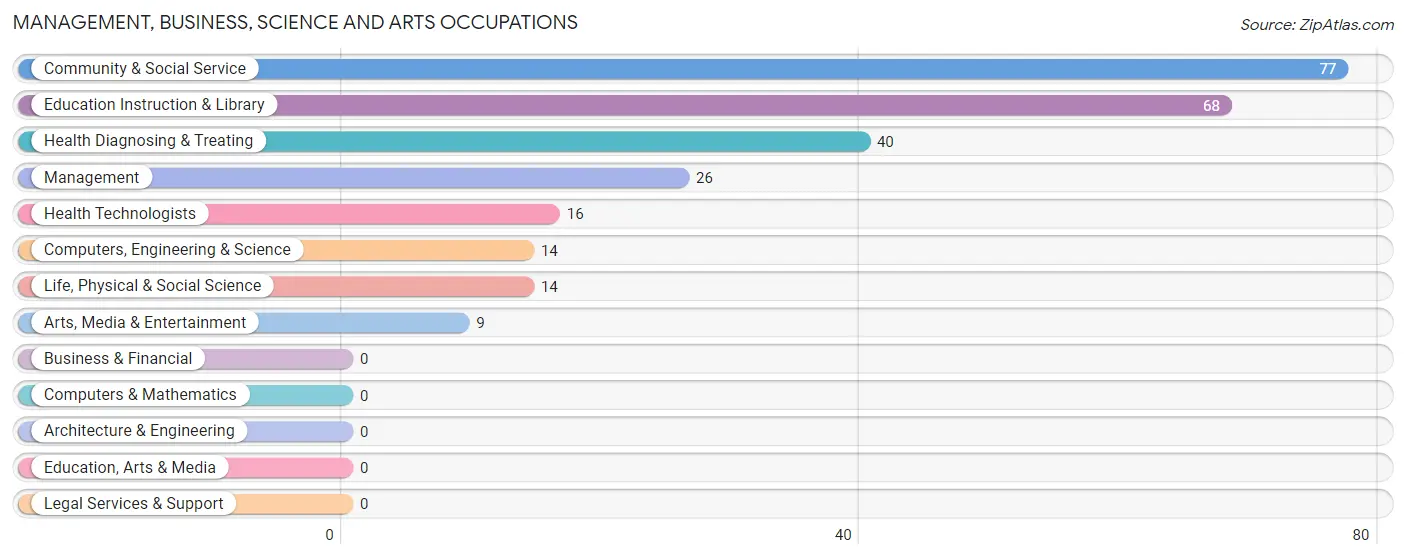
The most common Management, Business, Science and Arts occupations in Etna are Community & Social Service (77 | 29.7%), Education Instruction & Library (68 | 26.3%), Health Diagnosing & Treating (40 | 15.4%), Management (26 | 10.0%), and Health Technologists (16 | 6.2%).
Management, Business, Science and Arts Occupations by Sex
Within the Management, Business, Science and Arts occupations in Etna, the most male-oriented occupations are Health Technologists (100.0%), Management (69.2%), and Health Diagnosing & Treating (40.0%), while the most female-oriented occupations are Computers, Engineering & Science (100.0%), Life, Physical & Social Science (100.0%), and Education Instruction & Library (100.0%).
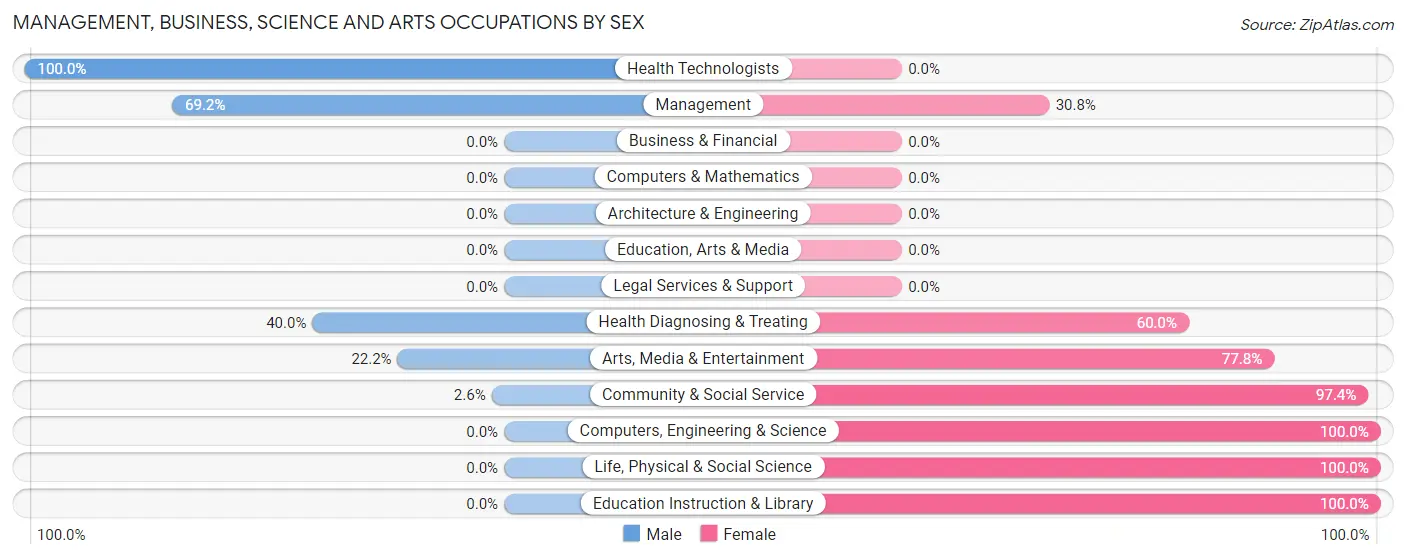
| Occupation | Male | Female |
| Management | 18 (69.2%) | 8 (30.8%) |
| Business & Financial | 0 (0.0%) | 0 (0.0%) |
| Computers, Engineering & Science | 0 (0.0%) | 14 (100.0%) |
| Computers & Mathematics | 0 (0.0%) | 0 (0.0%) |
| Architecture & Engineering | 0 (0.0%) | 0 (0.0%) |
| Life, Physical & Social Science | 0 (0.0%) | 14 (100.0%) |
| Community & Social Service | 2 (2.6%) | 75 (97.4%) |
| Education, Arts & Media | 0 (0.0%) | 0 (0.0%) |
| Legal Services & Support | 0 (0.0%) | 0 (0.0%) |
| Education Instruction & Library | 0 (0.0%) | 68 (100.0%) |
| Arts, Media & Entertainment | 2 (22.2%) | 7 (77.8%) |
| Health Diagnosing & Treating | 16 (40.0%) | 24 (60.0%) |
| Health Technologists | 16 (100.0%) | 0 (0.0%) |
| Total (Category) | 36 (22.9%) | 121 (77.1%) |
| Total (Overall) | 118 (45.6%) | 141 (54.4%) |
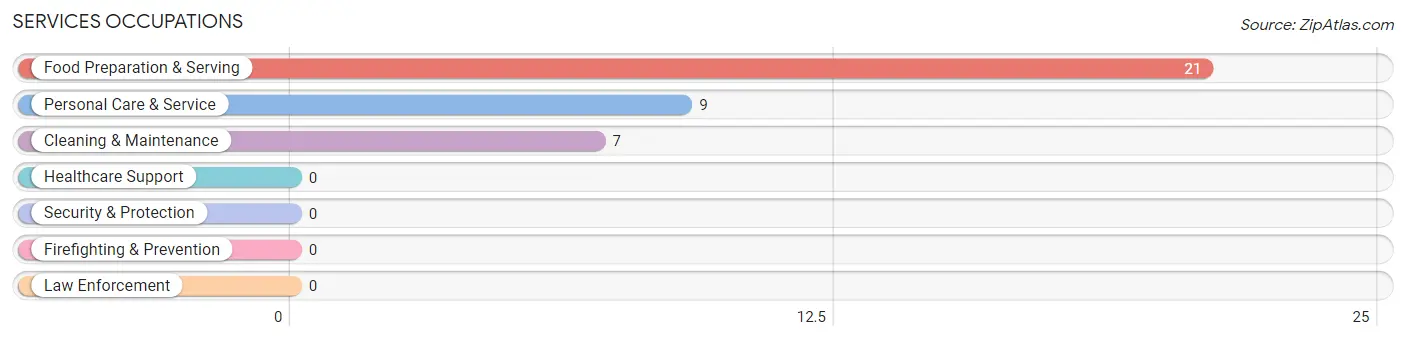
Services Occupations
The most common Services occupations in Etna are Food Preparation & Serving (21 | 8.1%), Personal Care & Service (9 | 3.5%), and Cleaning & Maintenance (7 | 2.7%).
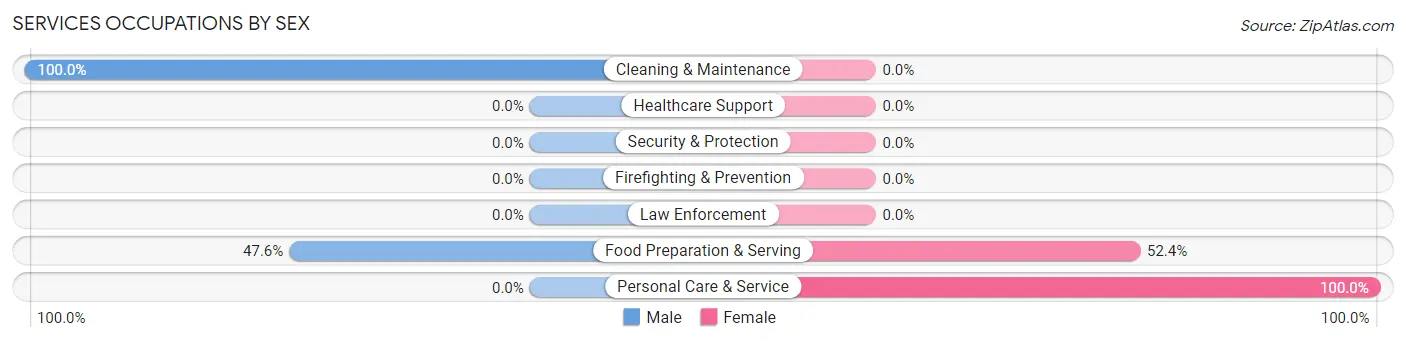
Services Occupations by Sex
Within the Services occupations in Etna, the most male-oriented occupations are Cleaning & Maintenance (100.0%), and Food Preparation & Serving (47.6%), while the most female-oriented occupations are Personal Care & Service (100.0%), and Food Preparation & Serving (52.4%).
| Occupation | Male | Female |
| Healthcare Support | 0 (0.0%) | 0 (0.0%) |
| Security & Protection | 0 (0.0%) | 0 (0.0%) |
| Firefighting & Prevention | 0 (0.0%) | 0 (0.0%) |
| Law Enforcement | 0 (0.0%) | 0 (0.0%) |
| Food Preparation & Serving | 10 (47.6%) | 11 (52.4%) |
| Cleaning & Maintenance | 7 (100.0%) | 0 (0.0%) |
| Personal Care & Service | 0 (0.0%) | 9 (100.0%) |
| Total (Category) | 17 (46.0%) | 20 (54.0%) |
| Total (Overall) | 118 (45.6%) | 141 (54.4%) |
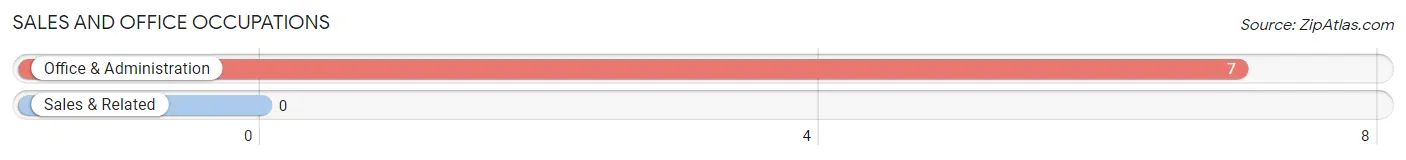
Sales and Office Occupations
The most common Sales and Office occupations in Etna are , and Office & Administration (7 | 2.7%).
Sales and Office Occupations by Sex

| Occupation | Male | Female |
| Sales & Related | 0 (0.0%) | 0 (0.0%) |
| Office & Administration | 7 (100.0%) | 0 (0.0%) |
| Total (Category) | 7 (100.0%) | 0 (0.0%) |
| Total (Overall) | 118 (45.6%) | 141 (54.4%) |
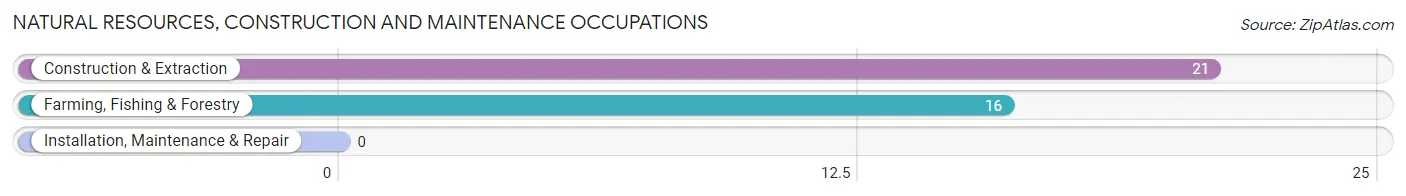
Natural Resources, Construction and Maintenance Occupations
The most common Natural Resources, Construction and Maintenance occupations in Etna are Construction & Extraction (21 | 8.1%), and Farming, Fishing & Forestry (16 | 6.2%).
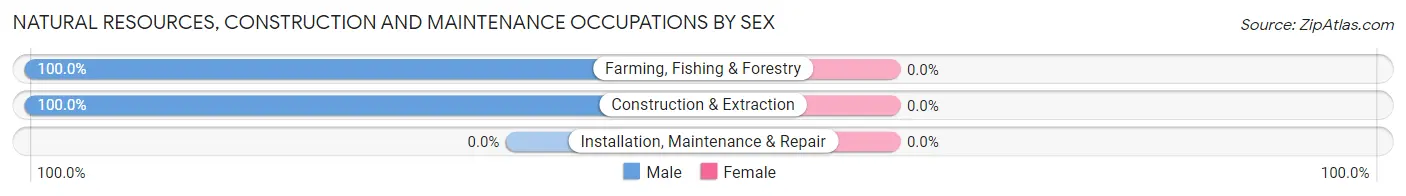
Natural Resources, Construction and Maintenance Occupations by Sex
| Occupation | Male | Female |
| Farming, Fishing & Forestry | 16 (100.0%) | 0 (0.0%) |
| Construction & Extraction | 21 (100.0%) | 0 (0.0%) |
| Installation, Maintenance & Repair | 0 (0.0%) | 0 (0.0%) |
| Total (Category) | 37 (100.0%) | 0 (0.0%) |
| Total (Overall) | 118 (45.6%) | 141 (54.4%) |
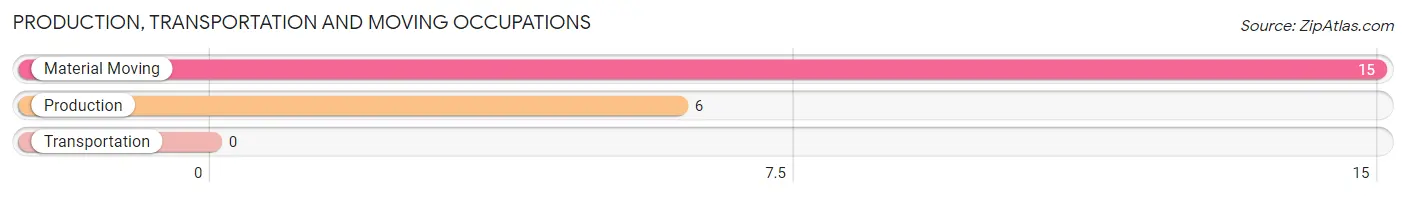
Production, Transportation and Moving Occupations
The most common Production, Transportation and Moving occupations in Etna are Material Moving (15 | 5.8%), and Production (6 | 2.3%).
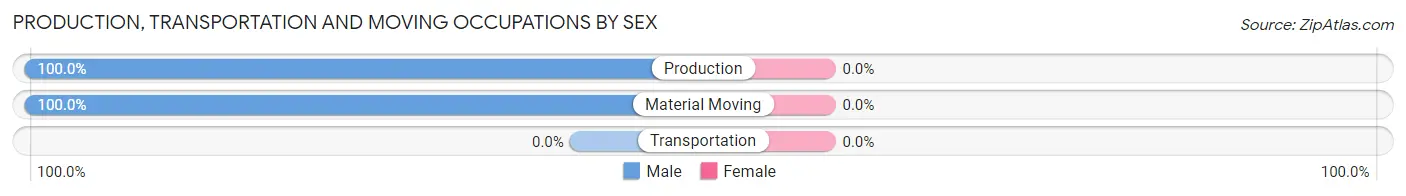
Production, Transportation and Moving Occupations by Sex
| Occupation | Male | Female |
| Production | 6 (100.0%) | 0 (0.0%) |
| Transportation | 0 (0.0%) | 0 (0.0%) |
| Material Moving | 15 (100.0%) | 0 (0.0%) |
| Total (Category) | 21 (100.0%) | 0 (0.0%) |
| Total (Overall) | 118 (45.6%) | 141 (54.4%) |
Employment Industries by Sex in Etna
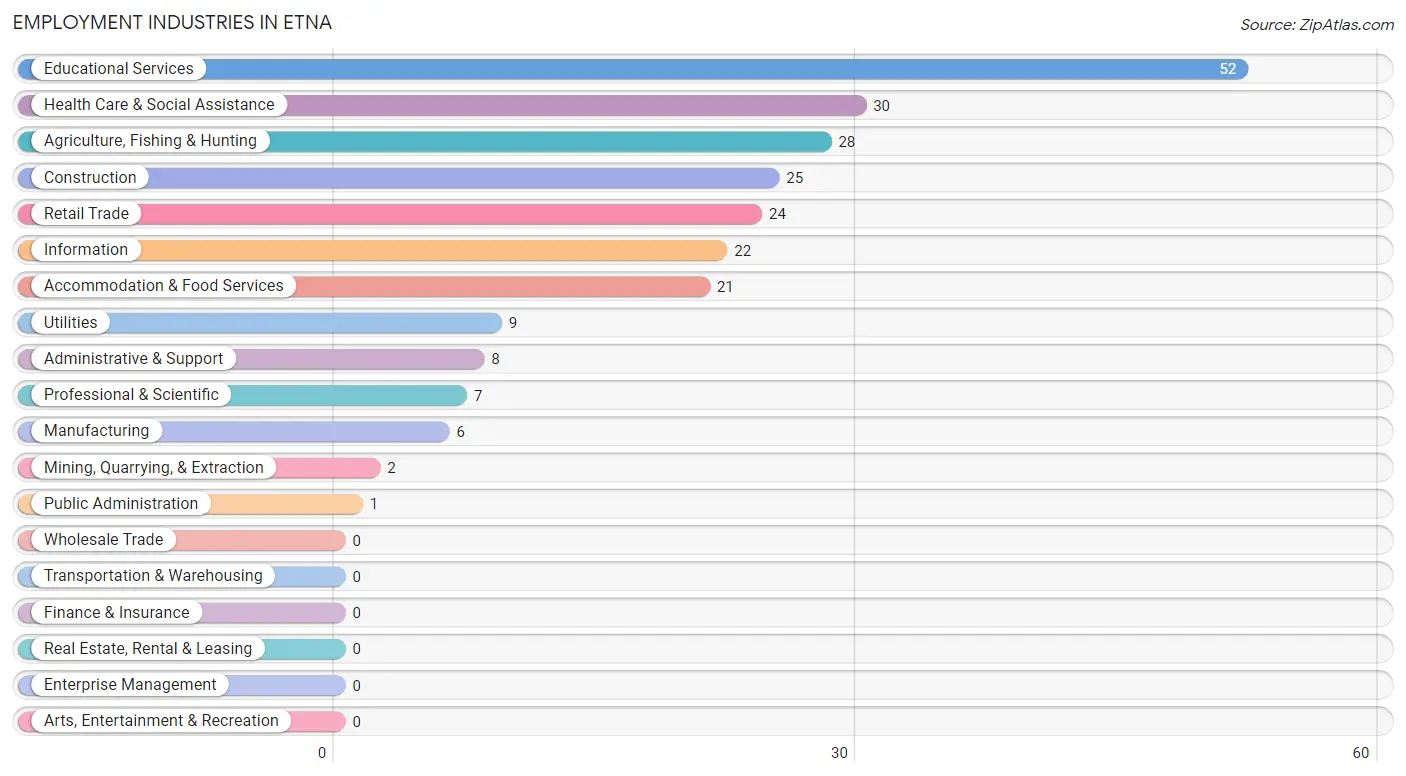
Employment Industries in Etna
The major employment industries in Etna include Educational Services (52 | 20.1%), Health Care & Social Assistance (30 | 11.6%), Agriculture, Fishing & Hunting (28 | 10.8%), Construction (25 | 9.7%), and Retail Trade (24 | 9.3%).
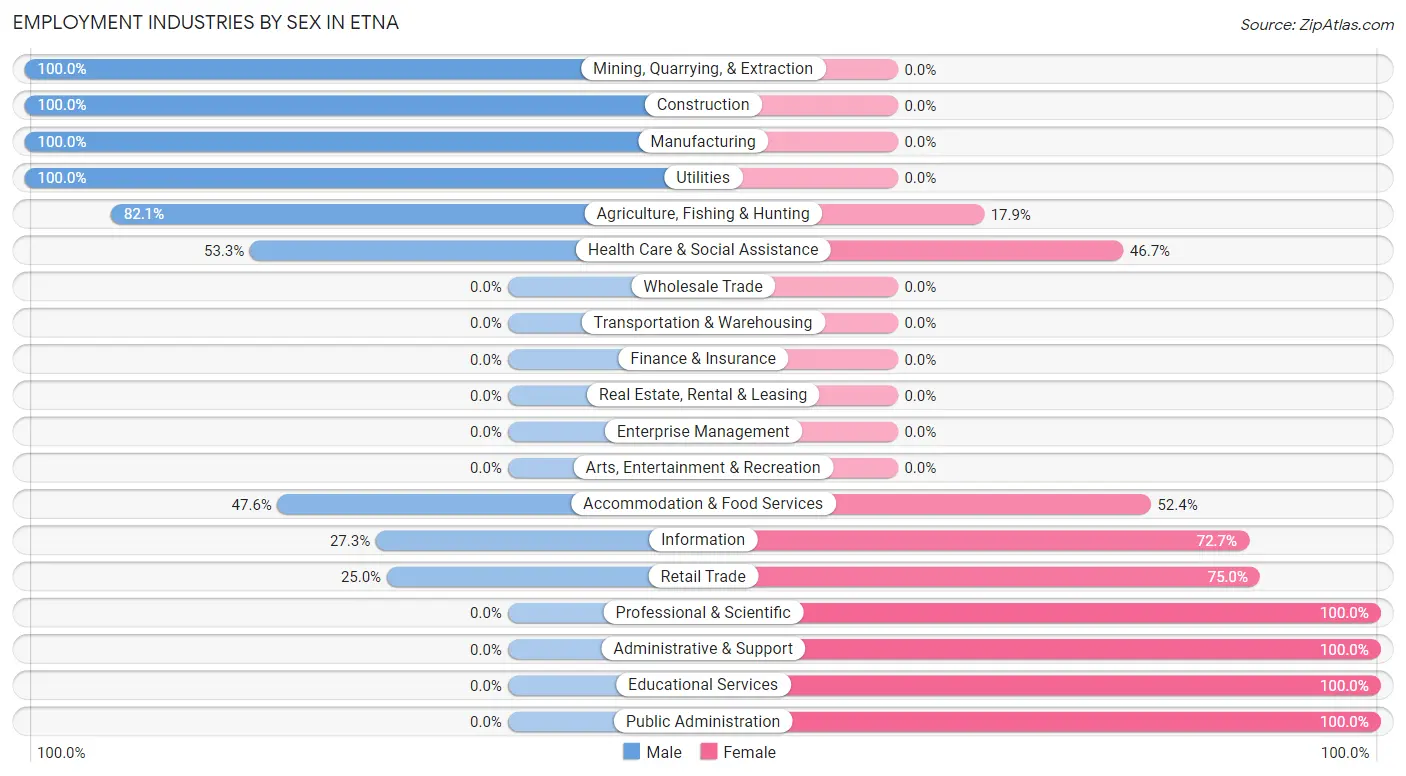
Employment Industries by Sex in Etna
The Etna industries that see more men than women are Mining, Quarrying, & Extraction (100.0%), Construction (100.0%), and Manufacturing (100.0%), whereas the industries that tend to have a higher number of women are Professional & Scientific (100.0%), Administrative & Support (100.0%), and Educational Services (100.0%).
| Industry | Male | Female |
| Agriculture, Fishing & Hunting | 23 (82.1%) | 5 (17.9%) |
| Mining, Quarrying, & Extraction | 2 (100.0%) | 0 (0.0%) |
| Construction | 25 (100.0%) | 0 (0.0%) |
| Manufacturing | 6 (100.0%) | 0 (0.0%) |
| Wholesale Trade | 0 (0.0%) | 0 (0.0%) |
| Retail Trade | 6 (25.0%) | 18 (75.0%) |
| Transportation & Warehousing | 0 (0.0%) | 0 (0.0%) |
| Utilities | 9 (100.0%) | 0 (0.0%) |
| Information | 6 (27.3%) | 16 (72.7%) |
| Finance & Insurance | 0 (0.0%) | 0 (0.0%) |
| Real Estate, Rental & Leasing | 0 (0.0%) | 0 (0.0%) |
| Professional & Scientific | 0 (0.0%) | 7 (100.0%) |
| Enterprise Management | 0 (0.0%) | 0 (0.0%) |
| Administrative & Support | 0 (0.0%) | 8 (100.0%) |
| Educational Services | 0 (0.0%) | 52 (100.0%) |
| Health Care & Social Assistance | 16 (53.3%) | 14 (46.7%) |
| Arts, Entertainment & Recreation | 0 (0.0%) | 0 (0.0%) |
| Accommodation & Food Services | 10 (47.6%) | 11 (52.4%) |
| Public Administration | 0 (0.0%) | 1 (100.0%) |
| Total | 118 (45.6%) | 141 (54.4%) |
Education in Etna
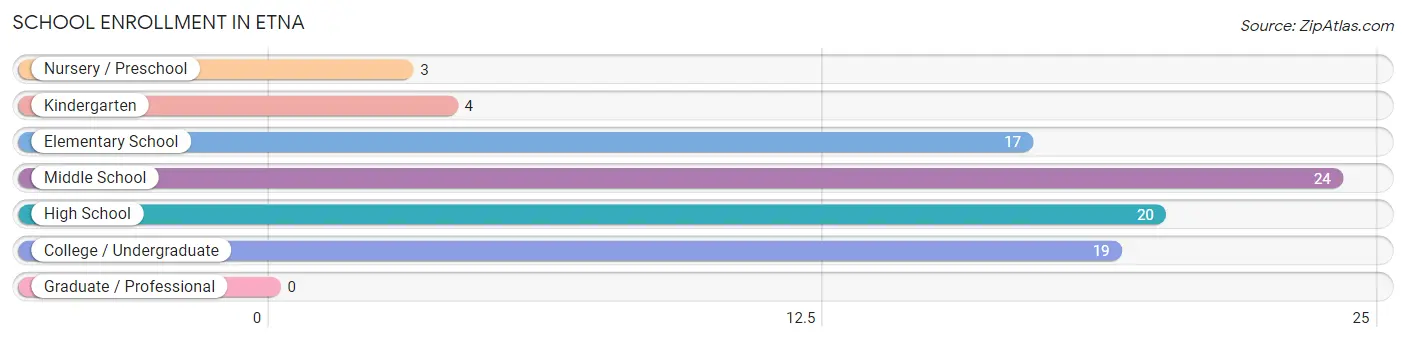
School Enrollment in Etna
The most common levels of schooling among the 87 students in Etna are middle school (24 | 27.6%), high school (20 | 23.0%), and college / undergraduate (19 | 21.8%).
| School Level | # Students | % Students |
| Nursery / Preschool | 3 | 3.5% |
| Kindergarten | 4 | 4.6% |
| Elementary School | 17 | 19.5% |
| Middle School | 24 | 27.6% |
| High School | 20 | 23.0% |
| College / Undergraduate | 19 | 21.8% |
| Graduate / Professional | 0 | 0.0% |
| Total | 87 | 100.0% |
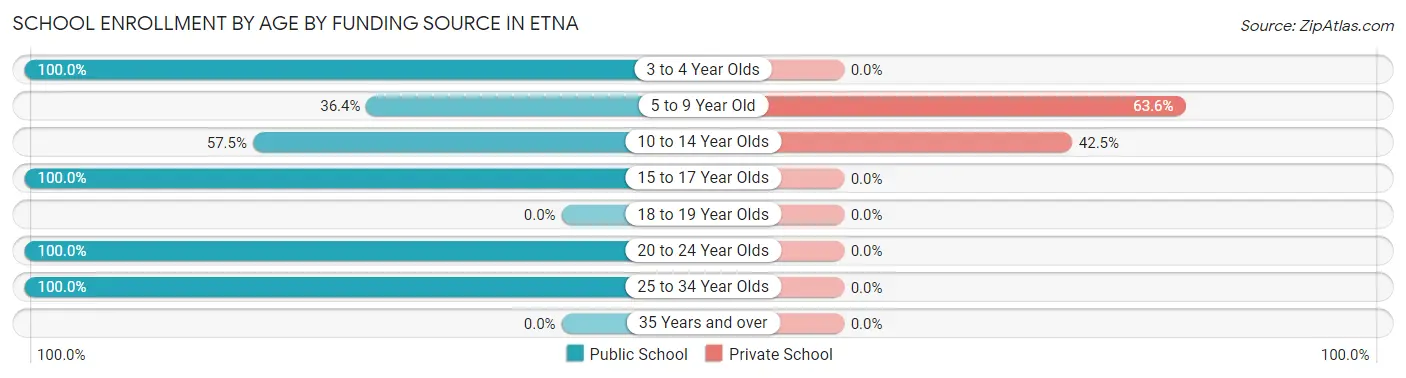
School Enrollment by Age by Funding Source in Etna
Out of a total of 87 students who are enrolled in schools in Etna, 24 (27.6%) attend a private institution, while the remaining 63 (72.4%) are enrolled in public schools. The age group of 5 to 9 year old has the highest likelihood of being enrolled in private schools, with 7 (63.6% in the age bracket) enrolled. Conversely, the age group of 3 to 4 year olds has the lowest likelihood of being enrolled in a private school, with 3 (100.0% in the age bracket) attending a public institution.
| Age Bracket | Public School | Private School |
| 3 to 4 Year Olds | 3 (100.0%) | 0 (0.0%) |
| 5 to 9 Year Old | 4 (36.4%) | 7 (63.6%) |
| 10 to 14 Year Olds | 23 (57.5%) | 17 (42.5%) |
| 15 to 17 Year Olds | 20 (100.0%) | 0 (0.0%) |
| 18 to 19 Year Olds | 0 (0.0%) | 0 (0.0%) |
| 20 to 24 Year Olds | 2 (100.0%) | 0 (0.0%) |
| 25 to 34 Year Olds | 11 (100.0%) | 0 (0.0%) |
| 35 Years and over | 0 (0.0%) | 0 (0.0%) |
| Total | 63 (72.4%) | 24 (27.6%) |
Educational Attainment by Field of Study in Etna
Social sciences (24 | 28.6%), business (16 | 19.1%), literature & languages (16 | 19.1%), computers & mathematics (6 | 7.1%), and bio, nature & agricultural (5 | 5.9%) are the most common fields of study among 84 individuals in Etna who have obtained a bachelor's degree or higher.
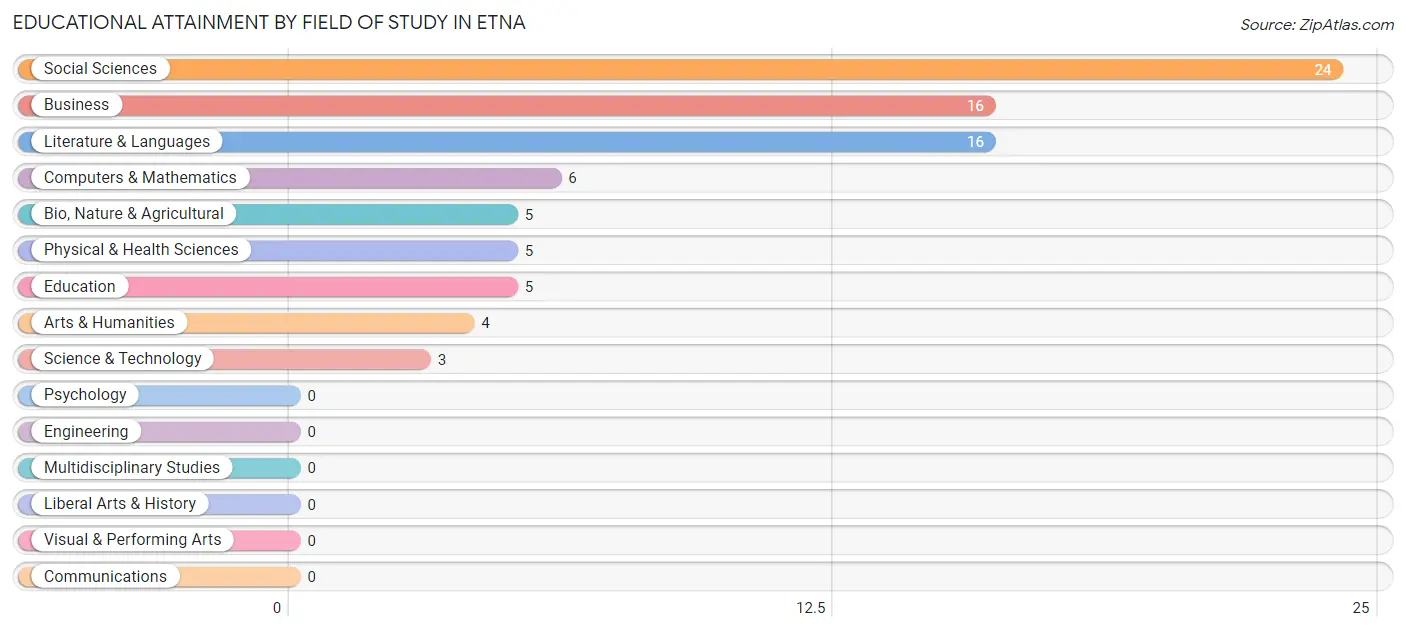
| Field of Study | # Graduates | % Graduates |
| Computers & Mathematics | 6 | 7.1% |
| Bio, Nature & Agricultural | 5 | 5.9% |
| Physical & Health Sciences | 5 | 5.9% |
| Psychology | 0 | 0.0% |
| Social Sciences | 24 | 28.6% |
| Engineering | 0 | 0.0% |
| Multidisciplinary Studies | 0 | 0.0% |
| Science & Technology | 3 | 3.6% |
| Business | 16 | 19.1% |
| Education | 5 | 5.9% |
| Literature & Languages | 16 | 19.1% |
| Liberal Arts & History | 0 | 0.0% |
| Visual & Performing Arts | 0 | 0.0% |
| Communications | 0 | 0.0% |
| Arts & Humanities | 4 | 4.8% |
| Total | 84 | 100.0% |
Transportation & Commute in Etna
Vehicle Availability by Sex in Etna
The most prevalent vehicle ownership categories in Etna are males with 1 vehicle (49, accounting for 47.1%) and females with 1 vehicle (2, making up 34.7%).
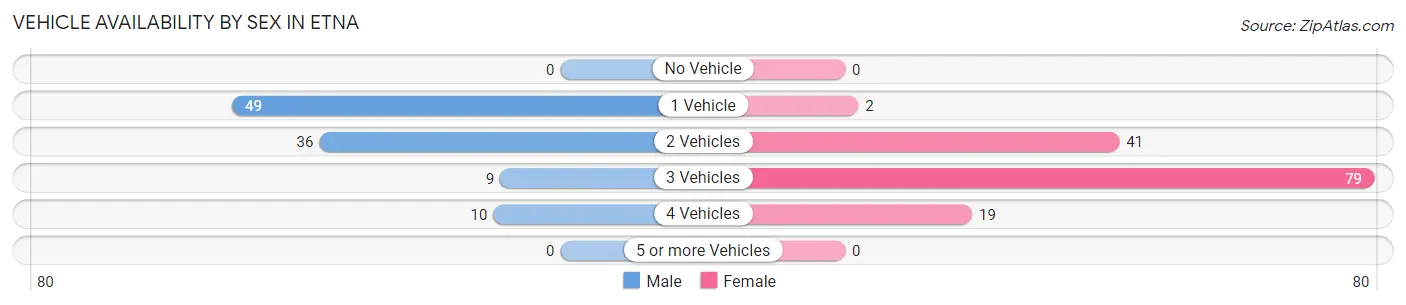
| Vehicles Available | Male | Female |
| No Vehicle | 0 (0.0%) | 0 (0.0%) |
| 1 Vehicle | 49 (47.1%) | 2 (1.4%) |
| 2 Vehicles | 36 (34.6%) | 41 (29.1%) |
| 3 Vehicles | 9 (8.6%) | 79 (56.0%) |
| 4 Vehicles | 10 (9.6%) | 19 (13.5%) |
| 5 or more Vehicles | 0 (0.0%) | 0 (0.0%) |
| Total | 104 (100.0%) | 141 (100.0%) |
Commute Time in Etna
The most frequently occuring commute durations in Etna are 35 to 39 minutes (71 commuters, 31.3%), less than 5 minutes (54 commuters, 23.8%), and 30 to 34 minutes (24 commuters, 10.6%).
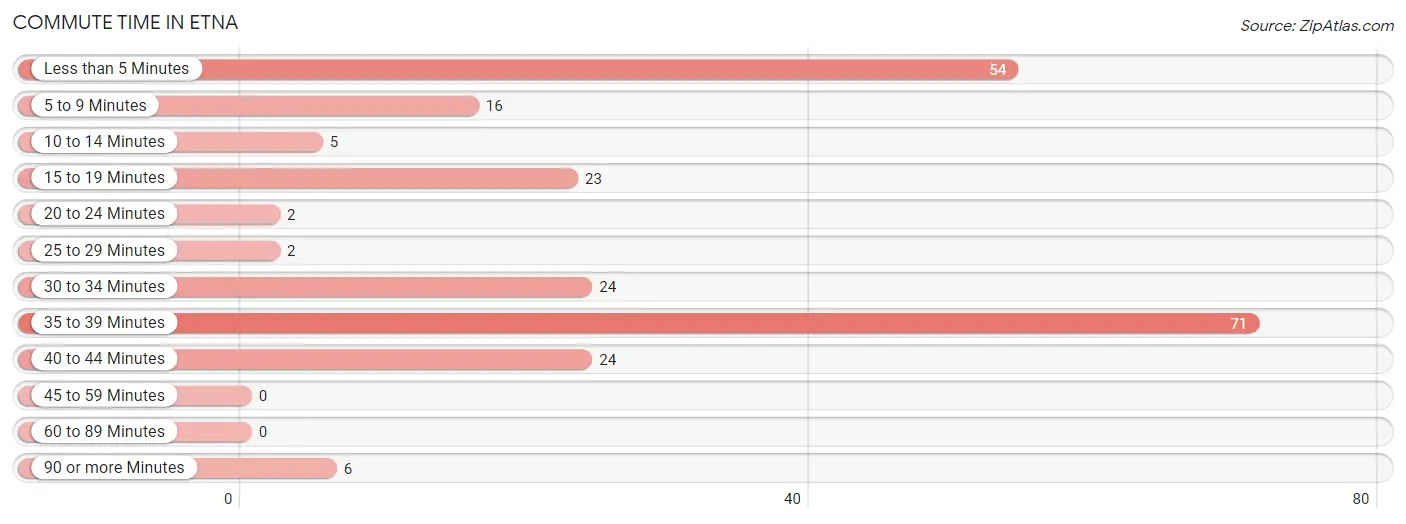
| Commute Time | # Commuters | % Commuters |
| Less than 5 Minutes | 54 | 23.8% |
| 5 to 9 Minutes | 16 | 7.0% |
| 10 to 14 Minutes | 5 | 2.2% |
| 15 to 19 Minutes | 23 | 10.1% |
| 20 to 24 Minutes | 2 | 0.9% |
| 25 to 29 Minutes | 2 | 0.9% |
| 30 to 34 Minutes | 24 | 10.6% |
| 35 to 39 Minutes | 71 | 31.3% |
| 40 to 44 Minutes | 24 | 10.6% |
| 45 to 59 Minutes | 0 | 0.0% |
| 60 to 89 Minutes | 0 | 0.0% |
| 90 or more Minutes | 6 | 2.6% |
Commute Time by Sex in Etna
The most common commute times in Etna are less than 5 minutes (25 commuters, 24.0%) for males and 35 to 39 minutes (61 commuters, 49.6%) for females.
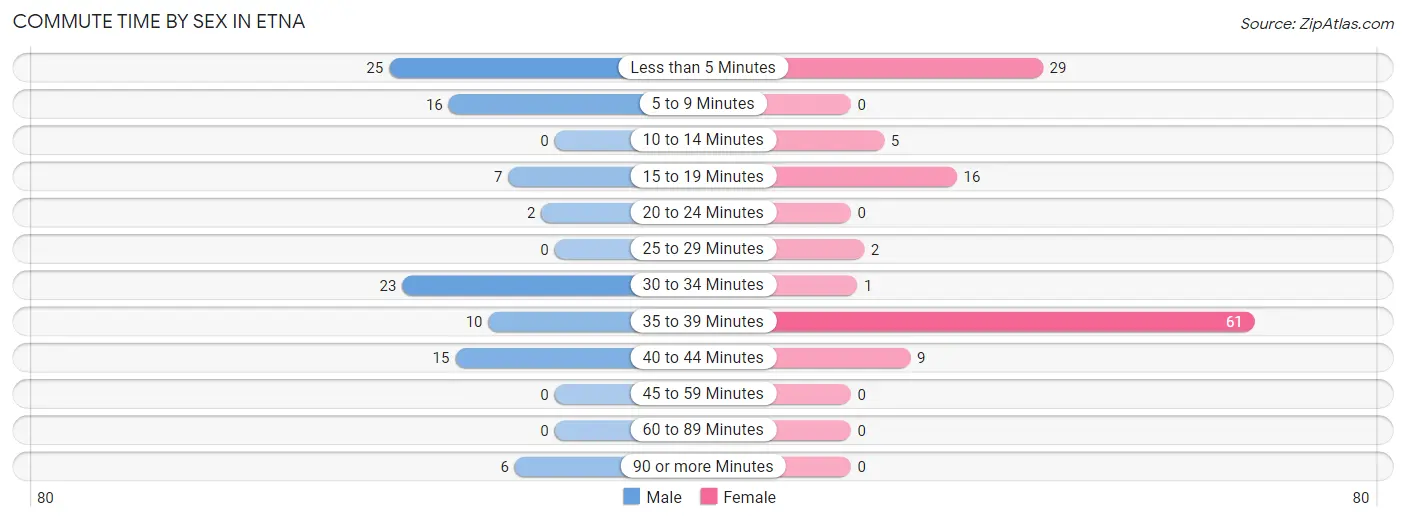
| Commute Time | Male | Female |
| Less than 5 Minutes | 25 (24.0%) | 29 (23.6%) |
| 5 to 9 Minutes | 16 (15.4%) | 0 (0.0%) |
| 10 to 14 Minutes | 0 (0.0%) | 5 (4.1%) |
| 15 to 19 Minutes | 7 (6.7%) | 16 (13.0%) |
| 20 to 24 Minutes | 2 (1.9%) | 0 (0.0%) |
| 25 to 29 Minutes | 0 (0.0%) | 2 (1.6%) |
| 30 to 34 Minutes | 23 (22.1%) | 1 (0.8%) |
| 35 to 39 Minutes | 10 (9.6%) | 61 (49.6%) |
| 40 to 44 Minutes | 15 (14.4%) | 9 (7.3%) |
| 45 to 59 Minutes | 0 (0.0%) | 0 (0.0%) |
| 60 to 89 Minutes | 0 (0.0%) | 0 (0.0%) |
| 90 or more Minutes | 6 (5.8%) | 0 (0.0%) |
Time of Departure to Work by Sex in Etna
The most frequent times of departure to work in Etna are 6:30 AM to 6:59 AM (20, 19.2%) for males and 7:30 AM to 7:59 AM (50, 40.6%) for females.
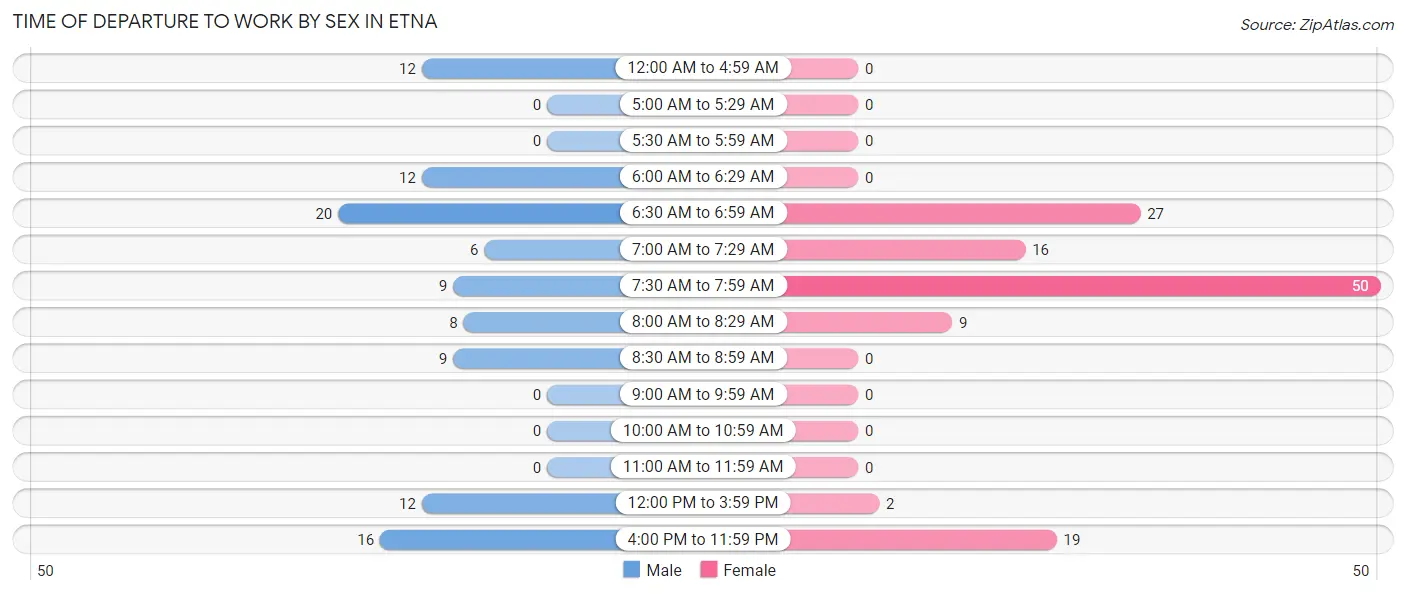
| Time of Departure | Male | Female |
| 12:00 AM to 4:59 AM | 12 (11.5%) | 0 (0.0%) |
| 5:00 AM to 5:29 AM | 0 (0.0%) | 0 (0.0%) |
| 5:30 AM to 5:59 AM | 0 (0.0%) | 0 (0.0%) |
| 6:00 AM to 6:29 AM | 12 (11.5%) | 0 (0.0%) |
| 6:30 AM to 6:59 AM | 20 (19.2%) | 27 (22.0%) |
| 7:00 AM to 7:29 AM | 6 (5.8%) | 16 (13.0%) |
| 7:30 AM to 7:59 AM | 9 (8.6%) | 50 (40.6%) |
| 8:00 AM to 8:29 AM | 8 (7.7%) | 9 (7.3%) |
| 8:30 AM to 8:59 AM | 9 (8.6%) | 0 (0.0%) |
| 9:00 AM to 9:59 AM | 0 (0.0%) | 0 (0.0%) |
| 10:00 AM to 10:59 AM | 0 (0.0%) | 0 (0.0%) |
| 11:00 AM to 11:59 AM | 0 (0.0%) | 0 (0.0%) |
| 12:00 PM to 3:59 PM | 12 (11.5%) | 2 (1.6%) |
| 4:00 PM to 11:59 PM | 16 (15.4%) | 19 (15.4%) |
| Total | 104 (100.0%) | 123 (100.0%) |
Housing Occupancy in Etna
Occupancy by Ownership in Etna
Of the total 280 dwellings in Etna, owner-occupied units account for 173 (61.8%), while renter-occupied units make up 107 (38.2%).
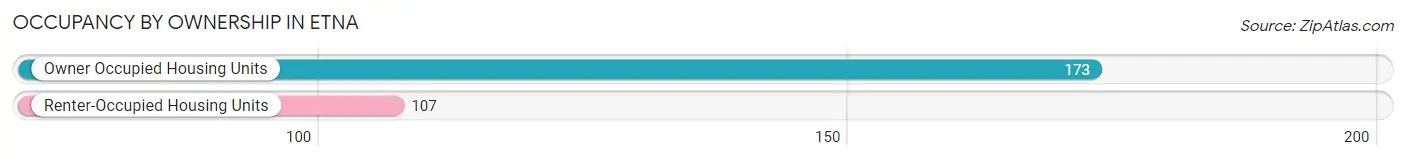
| Occupancy | # Housing Units | % Housing Units |
| Owner Occupied Housing Units | 173 | 61.8% |
| Renter-Occupied Housing Units | 107 | 38.2% |
| Total Occupied Housing Units | 280 | 100.0% |
Occupancy by Household Size in Etna
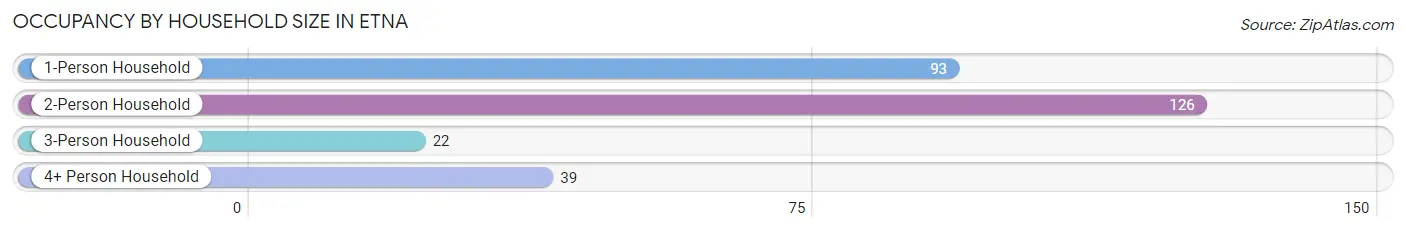
| Household Size | # Housing Units | % Housing Units |
| 1-Person Household | 93 | 33.2% |
| 2-Person Household | 126 | 45.0% |
| 3-Person Household | 22 | 7.9% |
| 4+ Person Household | 39 | 13.9% |
| Total Housing Units | 280 | 100.0% |
Occupancy by Ownership by Household Size in Etna
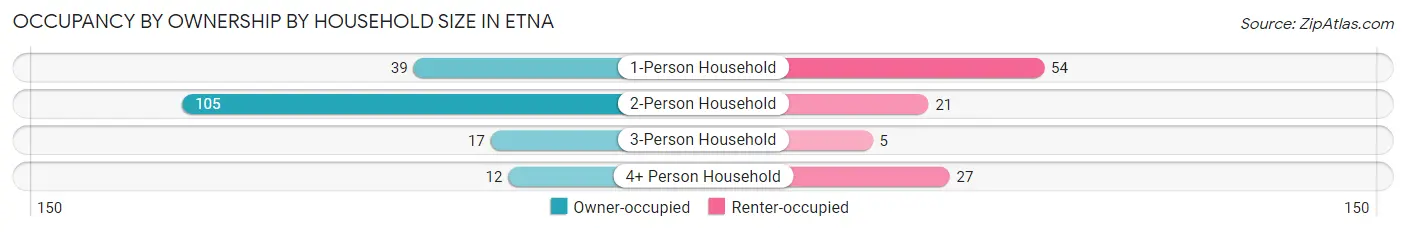
| Household Size | Owner-occupied | Renter-occupied |
| 1-Person Household | 39 (41.9%) | 54 (58.1%) |
| 2-Person Household | 105 (83.3%) | 21 (16.7%) |
| 3-Person Household | 17 (77.3%) | 5 (22.7%) |
| 4+ Person Household | 12 (30.8%) | 27 (69.2%) |
| Total Housing Units | 173 (61.8%) | 107 (38.2%) |
Occupancy by Educational Attainment in Etna
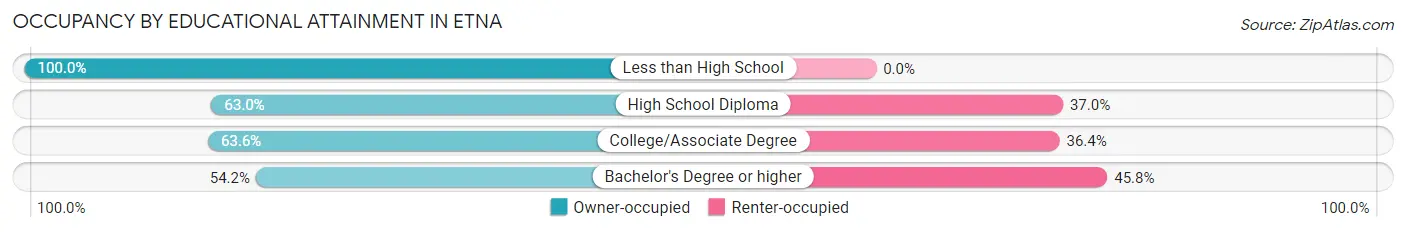
| Household Size | Owner-occupied | Renter-occupied |
| Less than High School | 6 (100.0%) | 0 (0.0%) |
| High School Diploma | 51 (63.0%) | 30 (37.0%) |
| College/Associate Degree | 77 (63.6%) | 44 (36.4%) |
| Bachelor's Degree or higher | 39 (54.2%) | 33 (45.8%) |
Occupancy by Age of Householder in Etna
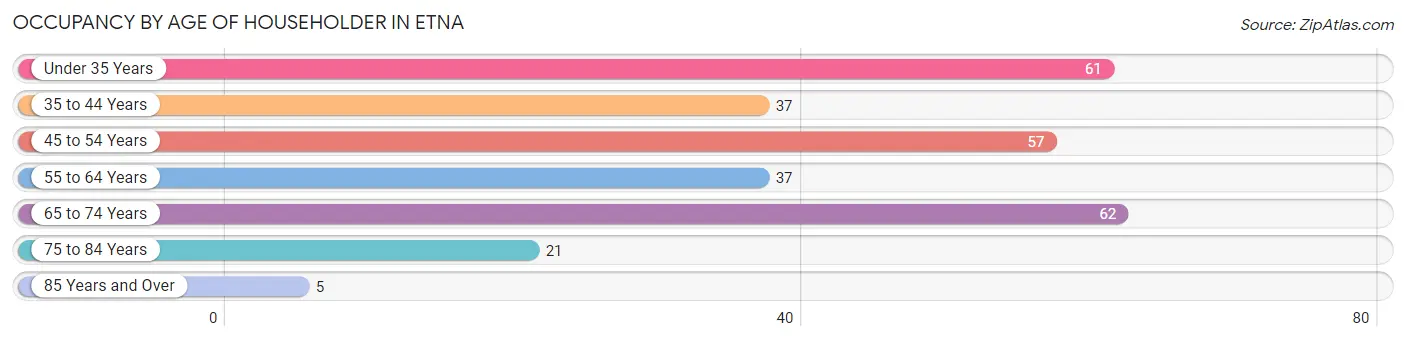
| Age Bracket | # Households | % Households |
| Under 35 Years | 61 | 21.8% |
| 35 to 44 Years | 37 | 13.2% |
| 45 to 54 Years | 57 | 20.4% |
| 55 to 64 Years | 37 | 13.2% |
| 65 to 74 Years | 62 | 22.1% |
| 75 to 84 Years | 21 | 7.5% |
| 85 Years and Over | 5 | 1.8% |
| Total | 280 | 100.0% |
Housing Finances in Etna
Median Income by Occupancy in Etna
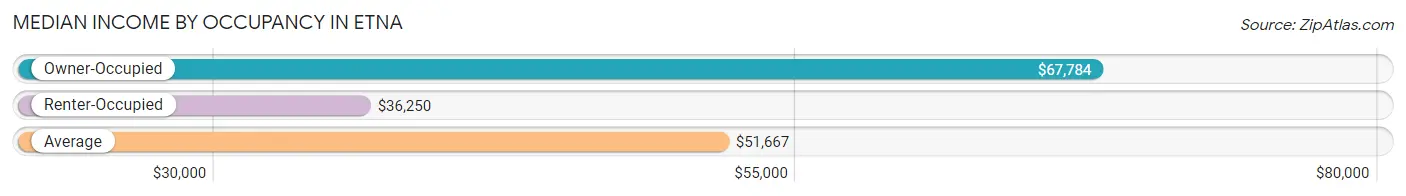
| Occupancy Type | # Households | Median Income |
| Owner-Occupied | 173 (61.8%) | $67,784 |
| Renter-Occupied | 107 (38.2%) | $36,250 |
| Average | 280 (100.0%) | $51,667 |
Occupancy by Householder Income Bracket in Etna
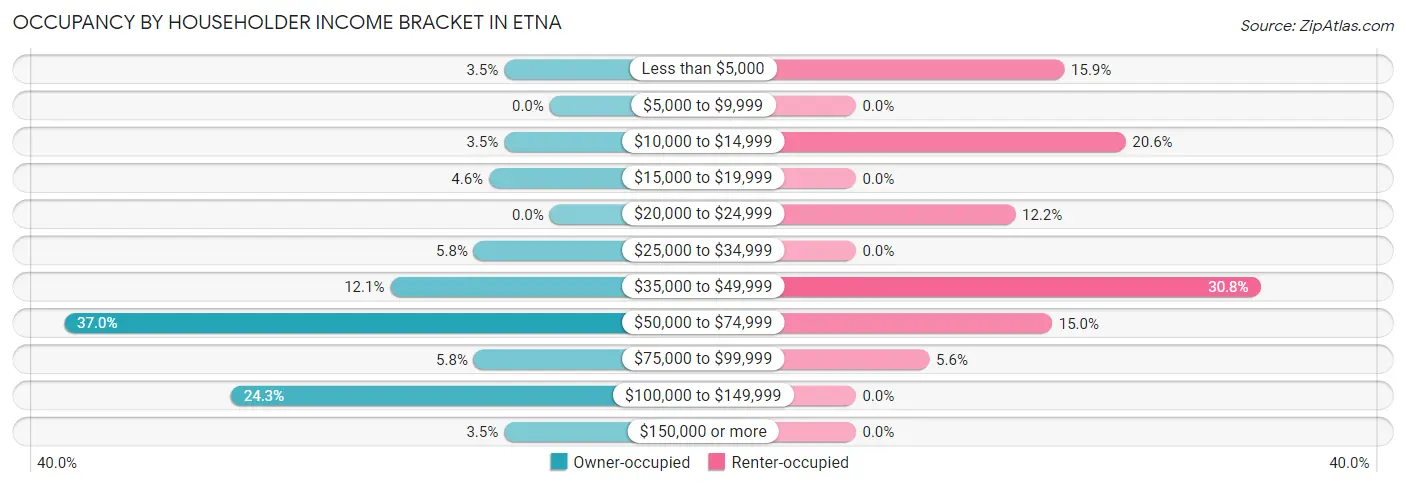
| Income Bracket | Owner-occupied | Renter-occupied |
| Less than $5,000 | 6 (3.5%) | 17 (15.9%) |
| $5,000 to $9,999 | 0 (0.0%) | 0 (0.0%) |
| $10,000 to $14,999 | 6 (3.5%) | 22 (20.6%) |
| $15,000 to $19,999 | 8 (4.6%) | 0 (0.0%) |
| $20,000 to $24,999 | 0 (0.0%) | 13 (12.1%) |
| $25,000 to $34,999 | 10 (5.8%) | 0 (0.0%) |
| $35,000 to $49,999 | 21 (12.1%) | 33 (30.8%) |
| $50,000 to $74,999 | 64 (37.0%) | 16 (14.9%) |
| $75,000 to $99,999 | 10 (5.8%) | 6 (5.6%) |
| $100,000 to $149,999 | 42 (24.3%) | 0 (0.0%) |
| $150,000 or more | 6 (3.5%) | 0 (0.0%) |
| Total | 173 (100.0%) | 107 (100.0%) |
Monthly Housing Cost Tiers in Etna
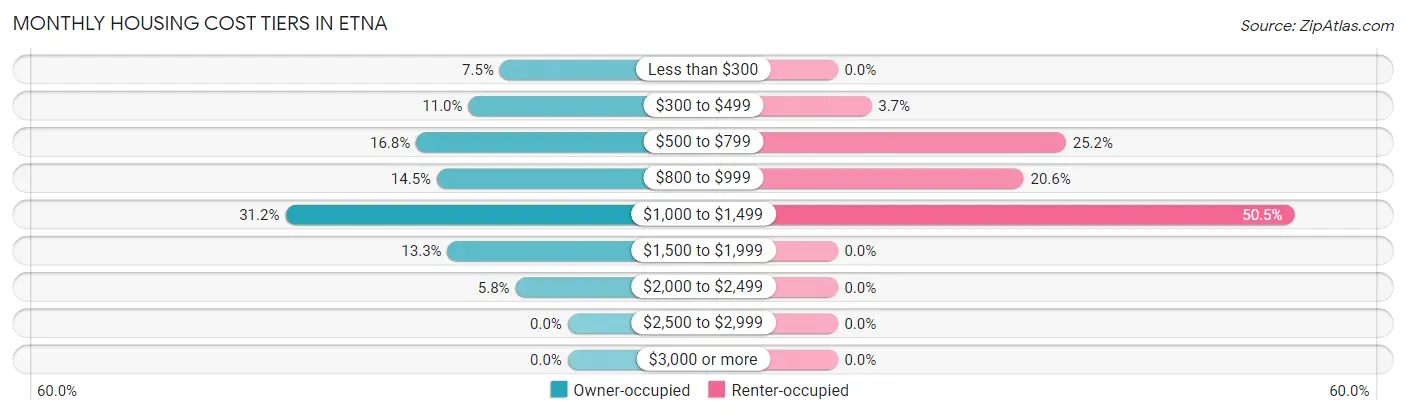
| Monthly Cost | Owner-occupied | Renter-occupied |
| Less than $300 | 13 (7.5%) | 0 (0.0%) |
| $300 to $499 | 19 (11.0%) | 4 (3.7%) |
| $500 to $799 | 29 (16.8%) | 27 (25.2%) |
| $800 to $999 | 25 (14.4%) | 22 (20.6%) |
| $1,000 to $1,499 | 54 (31.2%) | 54 (50.5%) |
| $1,500 to $1,999 | 23 (13.3%) | 0 (0.0%) |
| $2,000 to $2,499 | 10 (5.8%) | 0 (0.0%) |
| $2,500 to $2,999 | 0 (0.0%) | 0 (0.0%) |
| $3,000 or more | 0 (0.0%) | 0 (0.0%) |
| Total | 173 (100.0%) | 107 (100.0%) |
Physical Housing Characteristics in Etna
Housing Structures in Etna
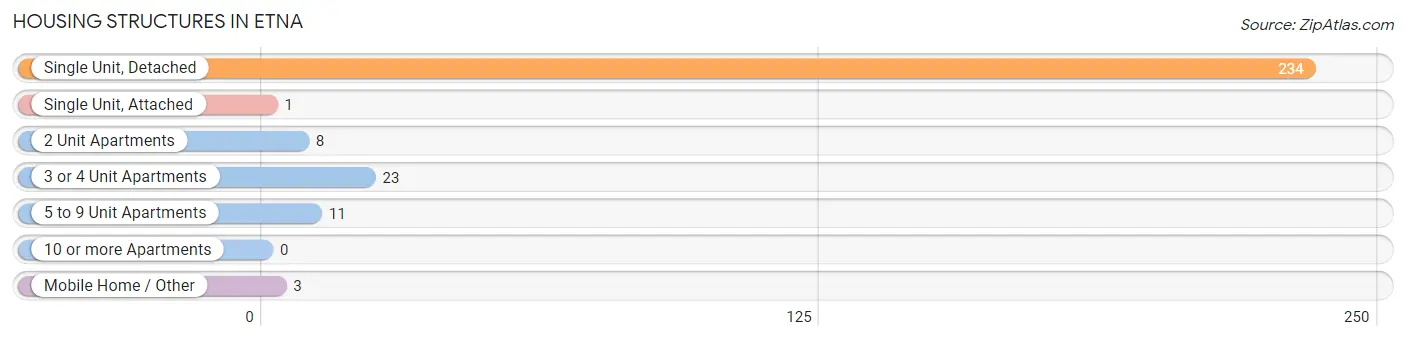
| Structure Type | # Housing Units | % Housing Units |
| Single Unit, Detached | 234 | 83.6% |
| Single Unit, Attached | 1 | 0.4% |
| 2 Unit Apartments | 8 | 2.9% |
| 3 or 4 Unit Apartments | 23 | 8.2% |
| 5 to 9 Unit Apartments | 11 | 3.9% |
| 10 or more Apartments | 0 | 0.0% |
| Mobile Home / Other | 3 | 1.1% |
| Total | 280 | 100.0% |
Housing Structures by Occupancy in Etna
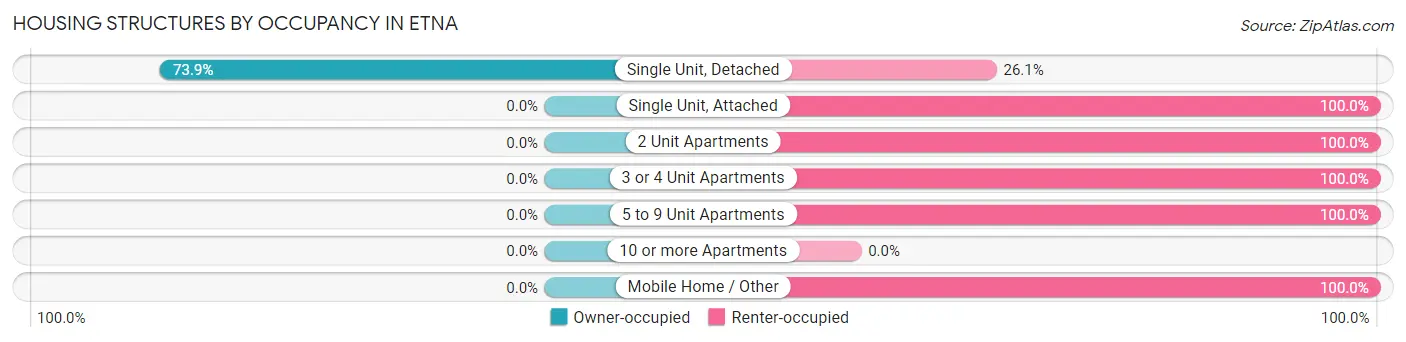
| Structure Type | Owner-occupied | Renter-occupied |
| Single Unit, Detached | 173 (73.9%) | 61 (26.1%) |
| Single Unit, Attached | 0 (0.0%) | 1 (100.0%) |
| 2 Unit Apartments | 0 (0.0%) | 8 (100.0%) |
| 3 or 4 Unit Apartments | 0 (0.0%) | 23 (100.0%) |
| 5 to 9 Unit Apartments | 0 (0.0%) | 11 (100.0%) |
| 10 or more Apartments | 0 (0.0%) | 0 (0.0%) |
| Mobile Home / Other | 0 (0.0%) | 3 (100.0%) |
| Total | 173 (61.8%) | 107 (38.2%) |
Housing Structures by Number of Rooms in Etna
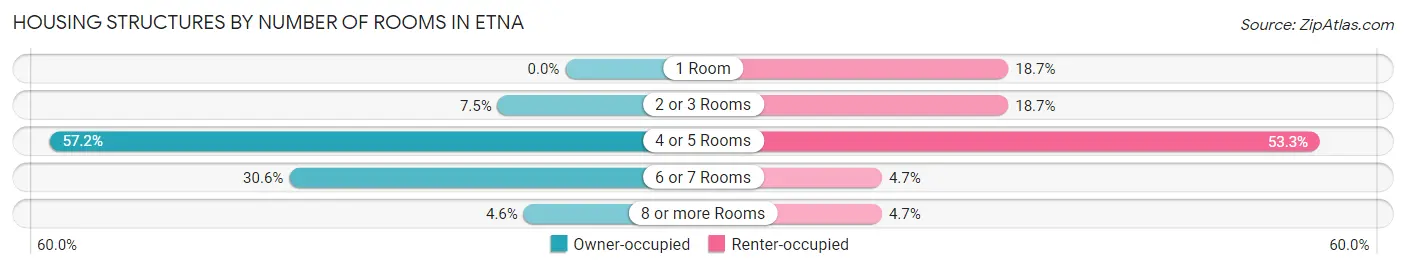
| Number of Rooms | Owner-occupied | Renter-occupied |
| 1 Room | 0 (0.0%) | 20 (18.7%) |
| 2 or 3 Rooms | 13 (7.5%) | 20 (18.7%) |
| 4 or 5 Rooms | 99 (57.2%) | 57 (53.3%) |
| 6 or 7 Rooms | 53 (30.6%) | 5 (4.7%) |
| 8 or more Rooms | 8 (4.6%) | 5 (4.7%) |
| Total | 173 (100.0%) | 107 (100.0%) |
Housing Structure by Heating Type in Etna
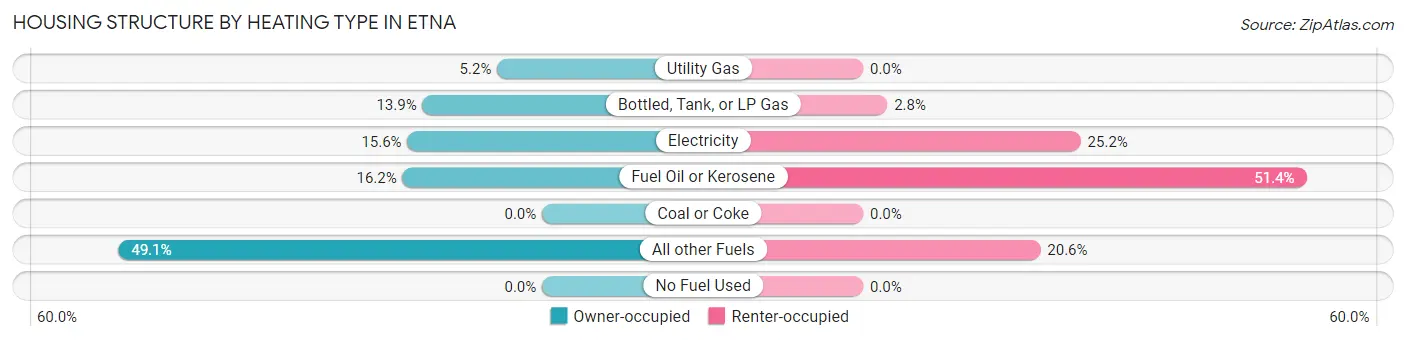
| Heating Type | Owner-occupied | Renter-occupied |
| Utility Gas | 9 (5.2%) | 0 (0.0%) |
| Bottled, Tank, or LP Gas | 24 (13.9%) | 3 (2.8%) |
| Electricity | 27 (15.6%) | 27 (25.2%) |
| Fuel Oil or Kerosene | 28 (16.2%) | 55 (51.4%) |
| Coal or Coke | 0 (0.0%) | 0 (0.0%) |
| All other Fuels | 85 (49.1%) | 22 (20.6%) |
| No Fuel Used | 0 (0.0%) | 0 (0.0%) |
| Total | 173 (100.0%) | 107 (100.0%) |
Household Vehicle Usage in Etna
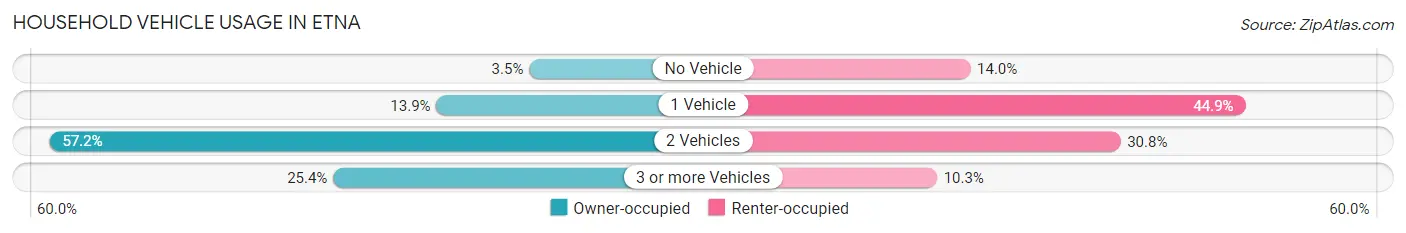
| Vehicles per Household | Owner-occupied | Renter-occupied |
| No Vehicle | 6 (3.5%) | 15 (14.0%) |
| 1 Vehicle | 24 (13.9%) | 48 (44.9%) |
| 2 Vehicles | 99 (57.2%) | 33 (30.8%) |
| 3 or more Vehicles | 44 (25.4%) | 11 (10.3%) |
| Total | 173 (100.0%) | 107 (100.0%) |
Real Estate & Mortgages in Etna
Real Estate and Mortgage Overview in Etna
| Characteristic | Without Mortgage | With Mortgage |
| Housing Units | 55 | 118 |
| Median Property Value | $279,200 | $221,400 |
| Median Household Income | $66,442 | $0 |
| Monthly Housing Costs | $459 | $0 |
| Real Estate Taxes | $1,417 | $9 |
Property Value by Mortgage Status in Etna
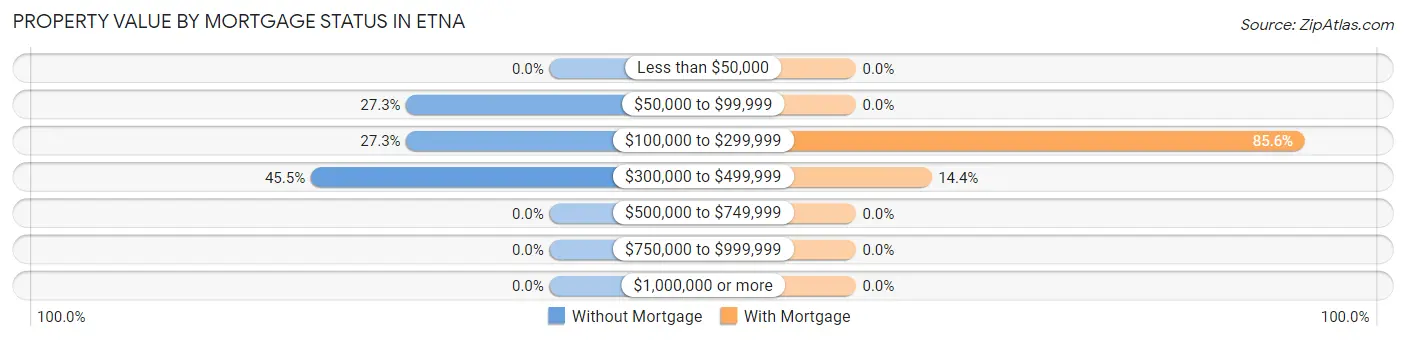
| Property Value | Without Mortgage | With Mortgage |
| Less than $50,000 | 0 (0.0%) | 0 (0.0%) |
| $50,000 to $99,999 | 15 (27.3%) | 0 (0.0%) |
| $100,000 to $299,999 | 15 (27.3%) | 101 (85.6%) |
| $300,000 to $499,999 | 25 (45.5%) | 17 (14.4%) |
| $500,000 to $749,999 | 0 (0.0%) | 0 (0.0%) |
| $750,000 to $999,999 | 0 (0.0%) | 0 (0.0%) |
| $1,000,000 or more | 0 (0.0%) | 0 (0.0%) |
| Total | 55 (100.0%) | 118 (100.0%) |
Household Income by Mortgage Status in Etna
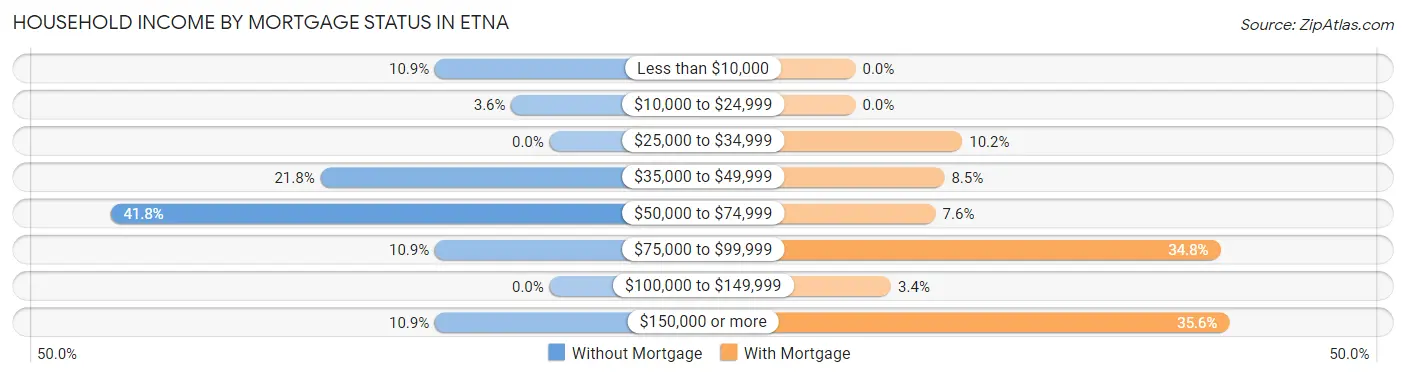
| Household Income | Without Mortgage | With Mortgage |
| Less than $10,000 | 6 (10.9%) | 0 (0.0%) |
| $10,000 to $24,999 | 2 (3.6%) | 0 (0.0%) |
| $25,000 to $34,999 | 0 (0.0%) | 12 (10.2%) |
| $35,000 to $49,999 | 12 (21.8%) | 10 (8.5%) |
| $50,000 to $74,999 | 23 (41.8%) | 9 (7.6%) |
| $75,000 to $99,999 | 6 (10.9%) | 41 (34.7%) |
| $100,000 to $149,999 | 0 (0.0%) | 4 (3.4%) |
| $150,000 or more | 6 (10.9%) | 42 (35.6%) |
| Total | 55 (100.0%) | 118 (100.0%) |
Property Value to Household Income Ratio in Etna
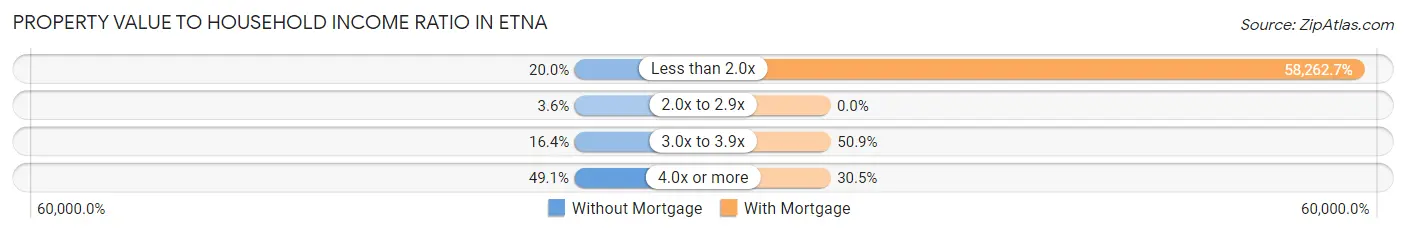
| Value-to-Income Ratio | Without Mortgage | With Mortgage |
| Less than 2.0x | 11 (20.0%) | 68,750 (58,262.7%) |
| 2.0x to 2.9x | 2 (3.6%) | 0 (0.0%) |
| 3.0x to 3.9x | 9 (16.4%) | 60 (50.8%) |
| 4.0x or more | 27 (49.1%) | 36 (30.5%) |
| Total | 55 (100.0%) | 118 (100.0%) |
Real Estate Taxes by Mortgage Status in Etna
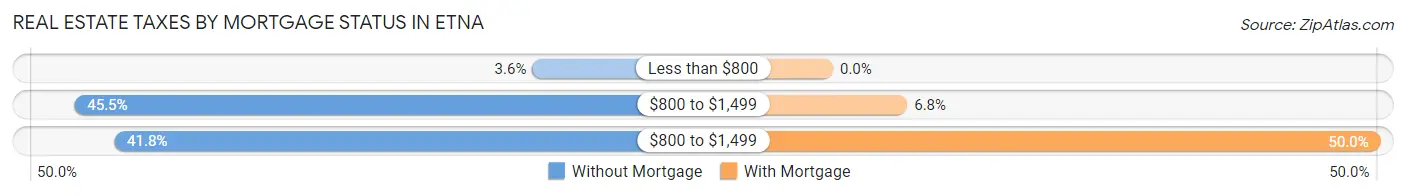
| Property Taxes | Without Mortgage | With Mortgage |
| Less than $800 | 2 (3.6%) | 0 (0.0%) |
| $800 to $1,499 | 25 (45.5%) | 8 (6.8%) |
| $800 to $1,499 | 23 (41.8%) | 59 (50.0%) |
| Total | 55 (100.0%) | 118 (100.0%) |
Health & Disability in Etna
Health Insurance Coverage by Age in Etna
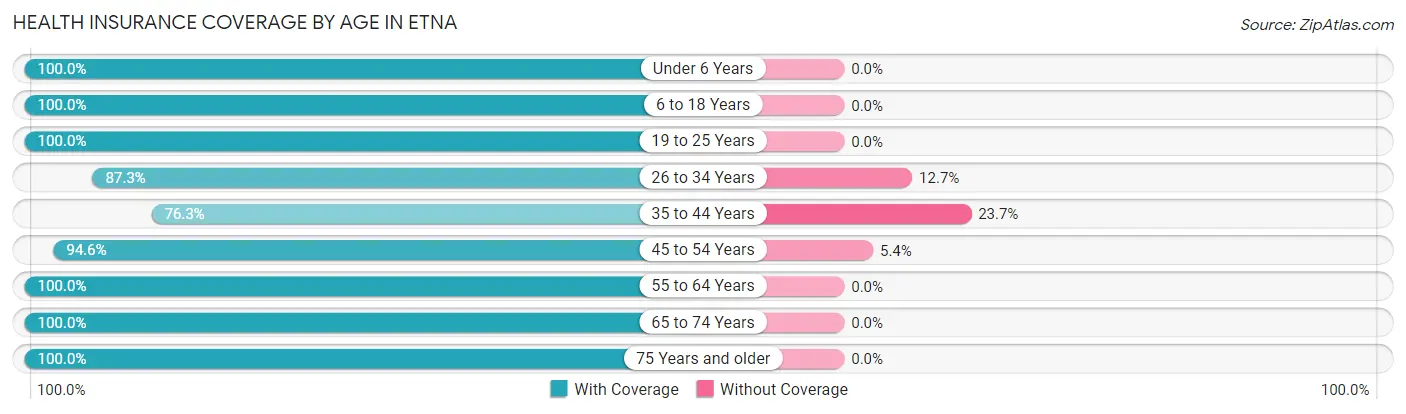
| Age Bracket | With Coverage | Without Coverage |
| Under 6 Years | 83 (100.0%) | 0 (0.0%) |
| 6 to 18 Years | 86 (100.0%) | 0 (0.0%) |
| 19 to 25 Years | 32 (100.0%) | 0 (0.0%) |
| 26 to 34 Years | 69 (87.3%) | 10 (12.7%) |
| 35 to 44 Years | 71 (76.3%) | 22 (23.7%) |
| 45 to 54 Years | 106 (94.6%) | 6 (5.4%) |
| 55 to 64 Years | 66 (100.0%) | 0 (0.0%) |
| 65 to 74 Years | 134 (100.0%) | 0 (0.0%) |
| 75 Years and older | 32 (100.0%) | 0 (0.0%) |
| Total | 679 (94.7%) | 38 (5.3%) |
Health Insurance Coverage by Citizenship Status in Etna
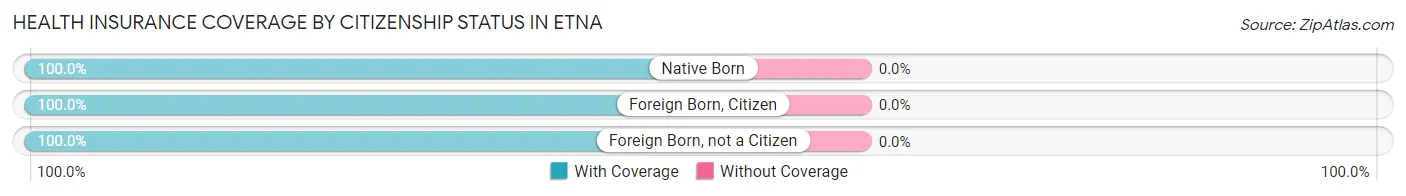
| Citizenship Status | With Coverage | Without Coverage |
| Native Born | 83 (100.0%) | 0 (0.0%) |
| Foreign Born, Citizen | 86 (100.0%) | 0 (0.0%) |
| Foreign Born, not a Citizen | 32 (100.0%) | 0 (0.0%) |
Health Insurance Coverage by Household Income in Etna
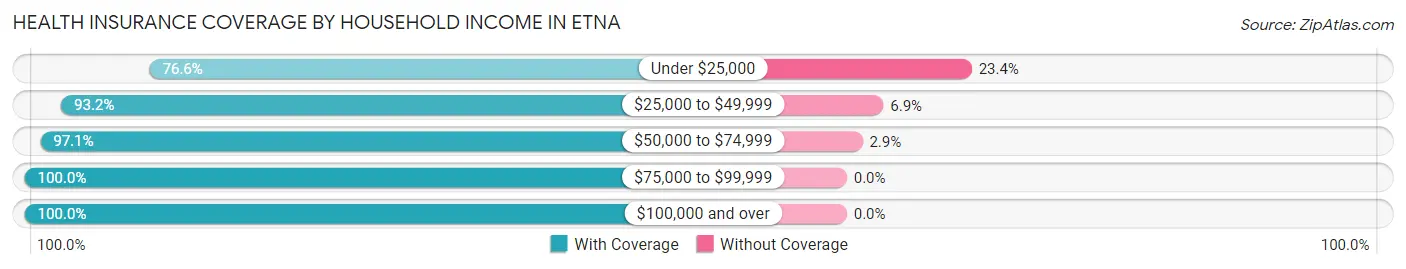
| Household Income | With Coverage | Without Coverage |
| Under $25,000 | 72 (76.6%) | 22 (23.4%) |
| $25,000 to $49,999 | 136 (93.1%) | 10 (6.9%) |
| $50,000 to $74,999 | 198 (97.1%) | 6 (2.9%) |
| $75,000 to $99,999 | 62 (100.0%) | 0 (0.0%) |
| $100,000 and over | 181 (100.0%) | 0 (0.0%) |
Public vs Private Health Insurance Coverage by Age in Etna
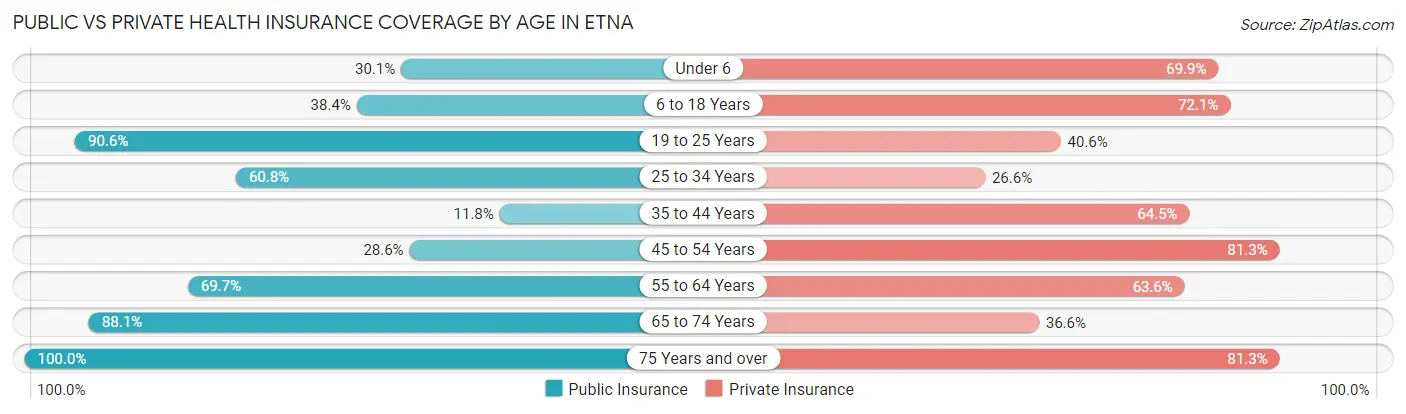
| Age Bracket | Public Insurance | Private Insurance |
| Under 6 | 25 (30.1%) | 58 (69.9%) |
| 6 to 18 Years | 33 (38.4%) | 62 (72.1%) |
| 19 to 25 Years | 29 (90.6%) | 13 (40.6%) |
| 25 to 34 Years | 48 (60.8%) | 21 (26.6%) |
| 35 to 44 Years | 11 (11.8%) | 60 (64.5%) |
| 45 to 54 Years | 32 (28.6%) | 91 (81.2%) |
| 55 to 64 Years | 46 (69.7%) | 42 (63.6%) |
| 65 to 74 Years | 118 (88.1%) | 49 (36.6%) |
| 75 Years and over | 32 (100.0%) | 26 (81.2%) |
| Total | 374 (52.2%) | 422 (58.9%) |
Disability Status by Sex by Age in Etna
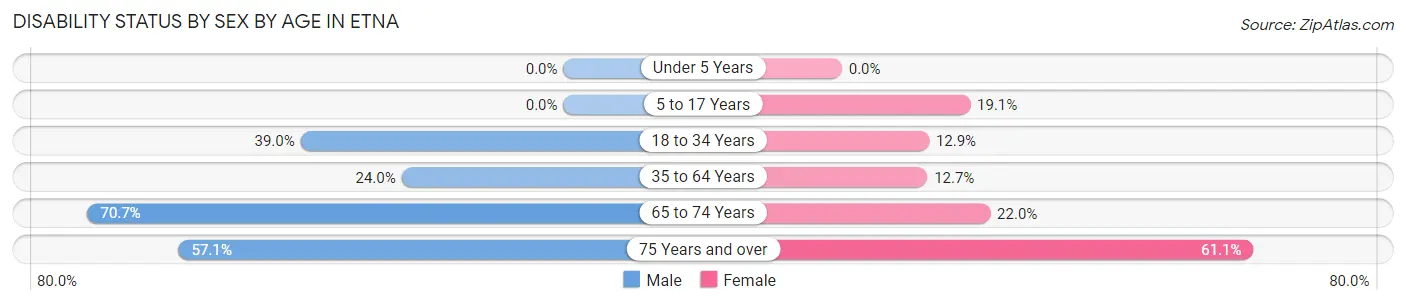
| Age Bracket | Male | Female |
| Under 5 Years | 0 (0.0%) | 0 (0.0%) |
| 5 to 17 Years | 0 (0.0%) | 4 (19.1%) |
| 18 to 34 Years | 16 (39.0%) | 11 (12.9%) |
| 35 to 64 Years | 31 (24.0%) | 18 (12.7%) |
| 65 to 74 Years | 53 (70.7%) | 13 (22.0%) |
| 75 Years and over | 8 (57.1%) | 11 (61.1%) |
Disability Class by Sex by Age in Etna
Disability Class: Hearing Difficulty
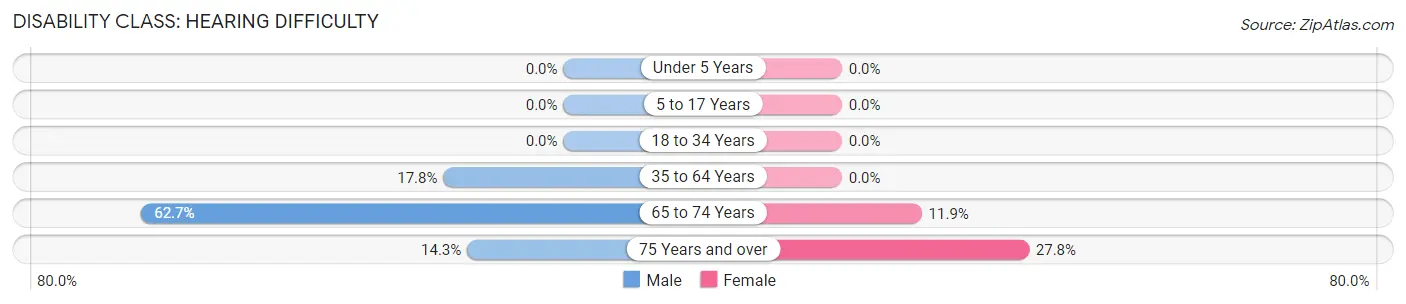
| Age Bracket | Male | Female |
| Under 5 Years | 0 (0.0%) | 0 (0.0%) |
| 5 to 17 Years | 0 (0.0%) | 0 (0.0%) |
| 18 to 34 Years | 0 (0.0%) | 0 (0.0%) |
| 35 to 64 Years | 23 (17.8%) | 0 (0.0%) |
| 65 to 74 Years | 47 (62.7%) | 7 (11.9%) |
| 75 Years and over | 2 (14.3%) | 5 (27.8%) |
Disability Class: Vision Difficulty
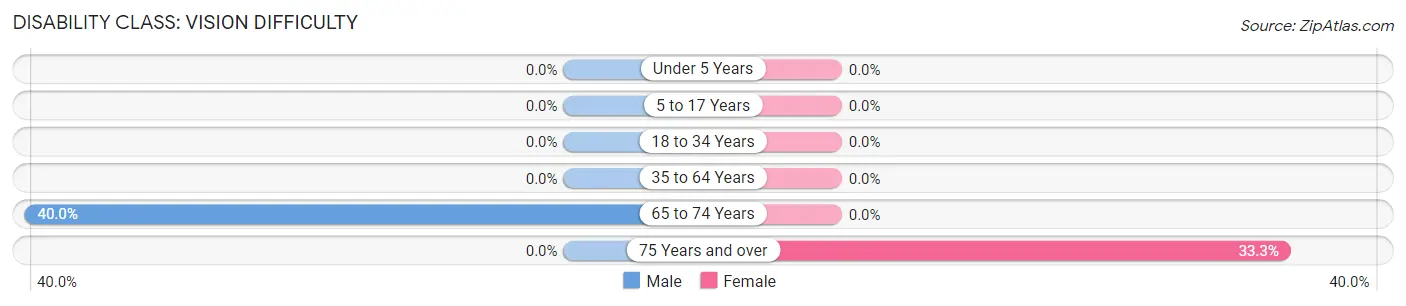
| Age Bracket | Male | Female |
| Under 5 Years | 0 (0.0%) | 0 (0.0%) |
| 5 to 17 Years | 0 (0.0%) | 0 (0.0%) |
| 18 to 34 Years | 0 (0.0%) | 0 (0.0%) |
| 35 to 64 Years | 0 (0.0%) | 0 (0.0%) |
| 65 to 74 Years | 30 (40.0%) | 0 (0.0%) |
| 75 Years and over | 0 (0.0%) | 6 (33.3%) |
Disability Class: Cognitive Difficulty
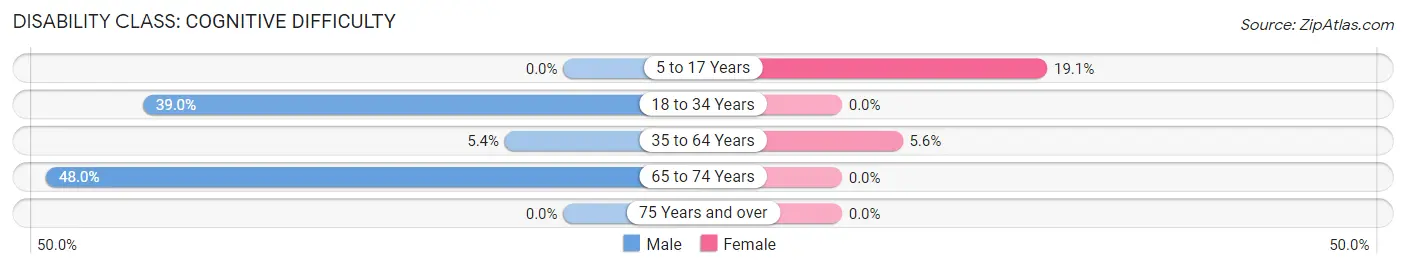
| Age Bracket | Male | Female |
| 5 to 17 Years | 0 (0.0%) | 4 (19.1%) |
| 18 to 34 Years | 16 (39.0%) | 0 (0.0%) |
| 35 to 64 Years | 7 (5.4%) | 8 (5.6%) |
| 65 to 74 Years | 36 (48.0%) | 0 (0.0%) |
| 75 Years and over | 0 (0.0%) | 0 (0.0%) |
Disability Class: Ambulatory Difficulty
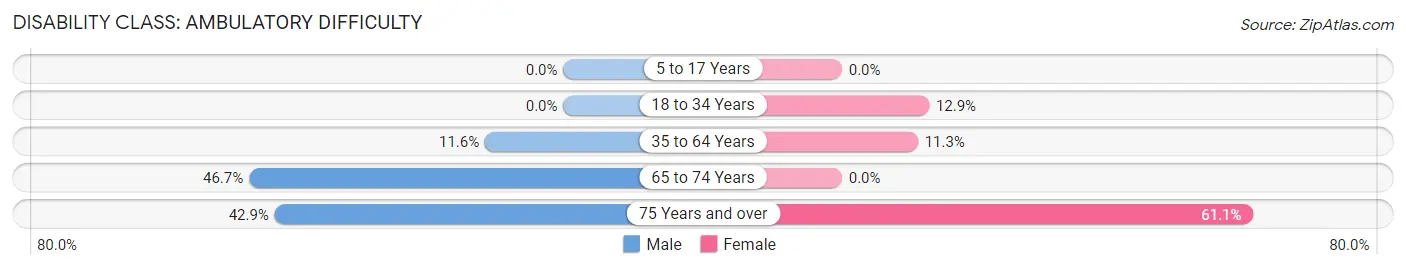
| Age Bracket | Male | Female |
| 5 to 17 Years | 0 (0.0%) | 0 (0.0%) |
| 18 to 34 Years | 0 (0.0%) | 11 (12.9%) |
| 35 to 64 Years | 15 (11.6%) | 16 (11.3%) |
| 65 to 74 Years | 35 (46.7%) | 0 (0.0%) |
| 75 Years and over | 6 (42.9%) | 11 (61.1%) |
Disability Class: Self-Care Difficulty
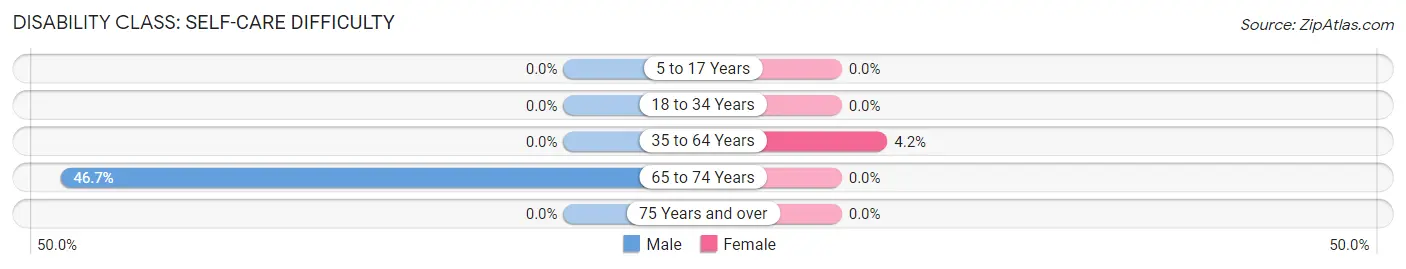
| Age Bracket | Male | Female |
| 5 to 17 Years | 0 (0.0%) | 0 (0.0%) |
| 18 to 34 Years | 0 (0.0%) | 0 (0.0%) |
| 35 to 64 Years | 0 (0.0%) | 6 (4.2%) |
| 65 to 74 Years | 35 (46.7%) | 0 (0.0%) |
| 75 Years and over | 0 (0.0%) | 0 (0.0%) |
Technology Access in Etna
Computing Device Access in Etna
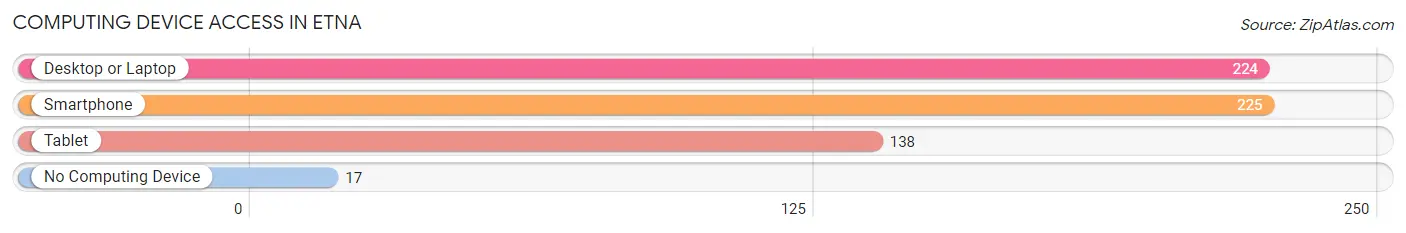
| Device Type | # Households | % Households |
| Desktop or Laptop | 224 | 80.0% |
| Smartphone | 225 | 80.4% |
| Tablet | 138 | 49.3% |
| No Computing Device | 17 | 6.1% |
| Total | 280 | 100.0% |
Internet Access in Etna
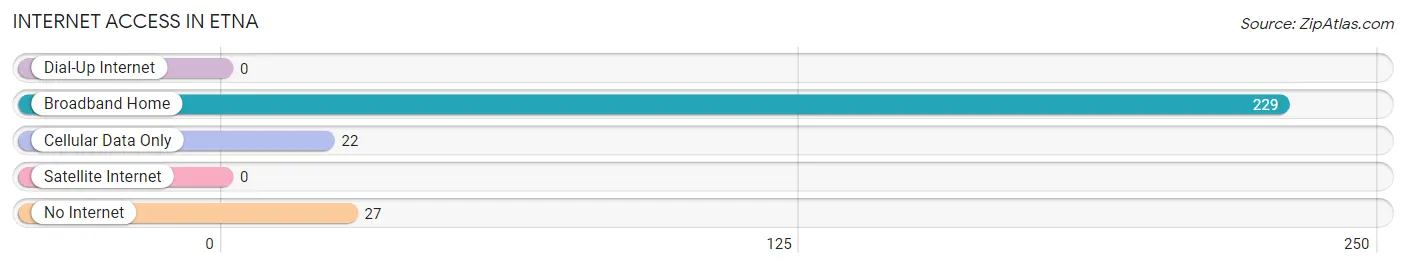
| Internet Type | # Households | % Households |
| Dial-Up Internet | 0 | 0.0% |
| Broadband Home | 229 | 81.8% |
| Cellular Data Only | 22 | 7.9% |
| Satellite Internet | 0 | 0.0% |
| No Internet | 27 | 9.6% |
| Total | 280 | 100.0% |
Etna Summary
Etna is a small town located in Siskiyou County, California, United States. It is situated in the Scott Valley, a narrow valley in the Klamath Mountains. The town is located at the junction of State Route 3 and State Route 96, about 20 miles (32 km) east of Yreka, the county seat. The population of Etna was 590 at the 2010 census.
History
The area around Etna was first settled in the 1850s by miners and ranchers. The town was founded in 1854 and named after Mount Etna in Sicily. The first post office was established in 1855.
In the late 19th century, Etna was a bustling center of commerce, with several stores, hotels, saloons, and a newspaper. The town was also home to a number of Chinese immigrants who worked in the local mines and on the railroads.
Geography
Etna is located at 41°45′N 122°45′W (41.75, -122.75). According to the United States Census Bureau, the town has a total area of 0.6 square miles (1.6 km2), all of it land.
The town is situated in the Scott Valley, a narrow valley in the Klamath Mountains. The valley is surrounded by mountains, including Mount Shasta to the north and the Marble Mountains to the south.
Economy
The economy of Etna is largely based on agriculture and timber. The town is home to several farms and ranches, as well as a sawmill.
The town is also home to a number of small businesses, including restaurants, stores, and a gas station.
Demographics
As of the census of 2000, there were 590 people, 246 households, and 162 families residing in the town. The population density was 990.2 people per square mile (382.2/km2). There were 270 housing units at an average density of 447.2 per square mile (173.2/km2). The racial makeup of the town was 91.2% White, 0.2% African American, 2.7% Native American, 0.2% Asian, 0.2% Pacific Islander, 2.7% from other races, and 2.7% from two or more races. Hispanic or Latino of any race were 5.6% of the population.
There were 246 households, out of which 28.9% had children under the age of 18 living with them, 51.2% were married couples living together, 9.3% had a female householder with no husband present, and 34.6% were non-families. 29.3% of all households were made up of individuals, and 13.4% had someone living alone who was 65 years of age or older. The average household size was 2.40 and the average family size was 2.94.
In the town, the population was spread out, with 25.3% under the age of 18, 6.2% from 18 to 24, 24.6% from 25 to 44, 27.3% from 45 to 64, and 16.6% who were 65 years of age or older. The median age was 41 years. For every 100 females, there were 97.4 males. For every 100 females age 18 and over, there were 94.2 males.
The median income for a household in the town was $30,000, and the median income for a family was $35,000. Males had a median income of $30,000 versus $20,000 for females. The per capita income for the town was $15,000. About 11.7% of families and 15.2% of the population were below the poverty line, including 19.2% of those under age 18 and 8.3% of those age 65 or over.
Common Questions
What is Per Capita Income in Etna?
Per Capita income in Etna is $26,286.
What is the Median Family Income in Etna?
Median Family Income in Etna is $66,827.
What is the Median Household income in Etna?
Median Household Income in Etna is $51,667.
What is Income or Wage Gap in Etna?
Income or Wage Gap in Etna is 27.0%.
Women in Etna earn 73.0 cents for every dollar earned by a man.
What is Inequality or Gini Index in Etna?
Inequality or Gini Index in Etna is 0.39.
What is the Total Population of Etna?
Total Population of Etna is 717.
What is the Total Male Population of Etna?
Total Male Population of Etna is 338.
What is the Total Female Population of Etna?
Total Female Population of Etna is 379.
What is the Ratio of Males per 100 Females in Etna?
There are 89.18 Males per 100 Females in Etna.
What is the Ratio of Females per 100 Males in Etna?
There are 112.13 Females per 100 Males in Etna.
What is the Median Population Age in Etna?
Median Population Age in Etna is 42.5 Years.
What is the Average Family Size in Etna
Average Family Size in Etna is 3.1 People.
What is the Average Household Size in Etna
Average Household Size in Etna is 2.5 People.
How Large is the Labor Force in Etna?
There are 316 People in the Labor Forcein in Etna.
What is the Percentage of People in the Labor Force in Etna?
54.2% of People are in the Labor Force in Etna.
What is the Unemployment Rate in Etna?
Unemployment Rate in Etna is 18.0%.