Cities with the Highest Percentage of Population Employed in Health Diagnosing & Treating in Minnesota
RELATED REPORTS & OPTIONS
Health Diagnosing & Treating
Minnesota
Compare Cities
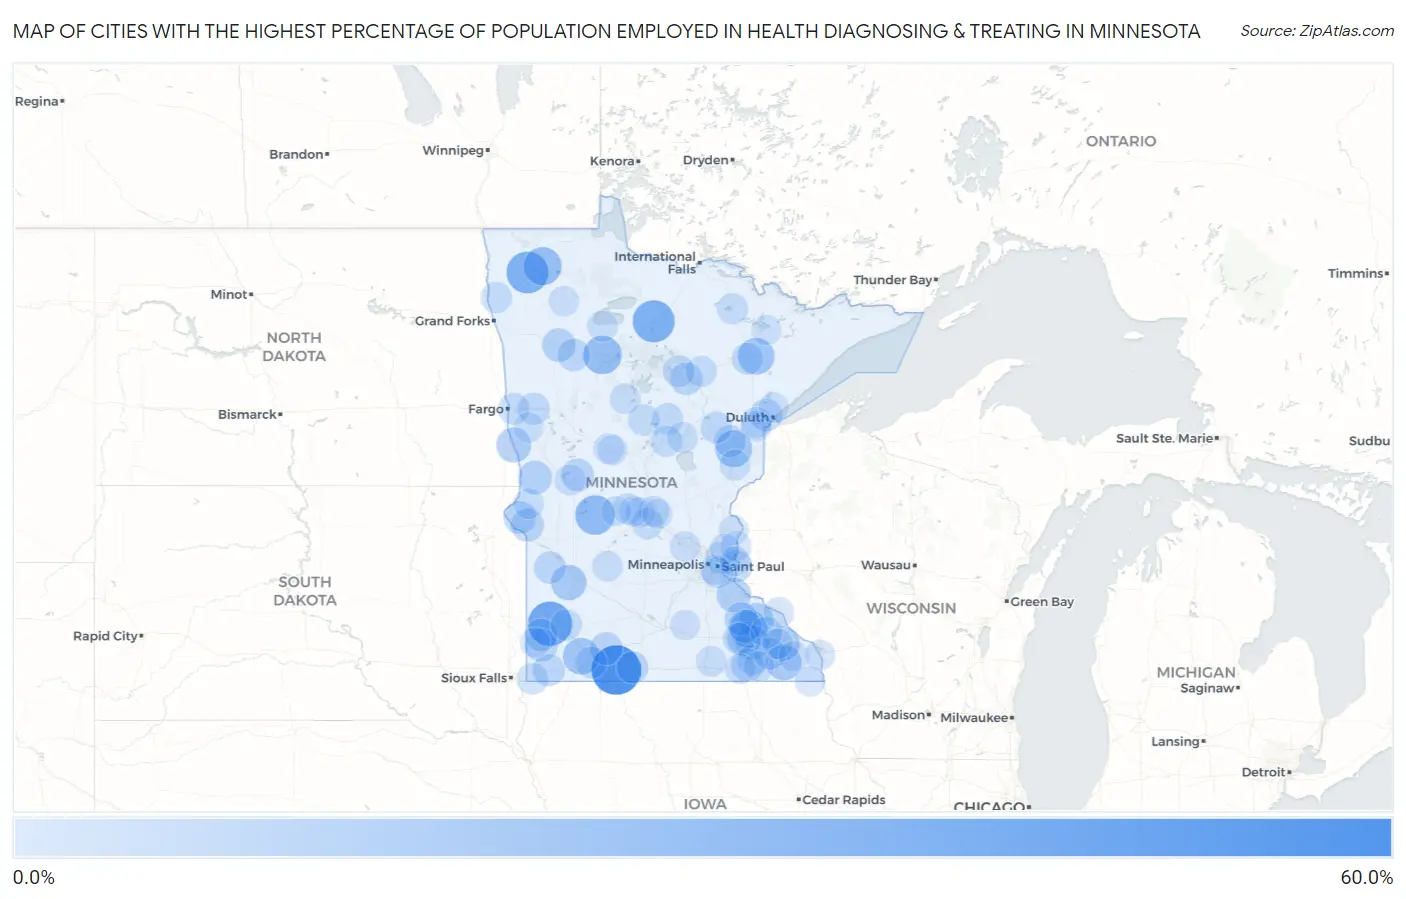
Map of Cities with the Highest Percentage of Population Employed in Health Diagnosing & Treating in Minnesota
0.0%
60.0%
Cities with the Highest Percentage of Population Employed in Health Diagnosing & Treating in Minnesota
| City | % Employed | vs State | vs National | |
| 1. | Alpha | 55.4% | 6.8%(+48.7)#1 | 6.2%(+49.2)#55 |
| 2. | Florence | 42.9% | 6.8%(+36.1)#2 | 6.2%(+36.6)#122 |
| 3. | Mizpah | 37.5% | 6.8%(+30.7)#3 | 6.2%(+31.3)#164 |
| 4. | Strandquist | 37.2% | 6.8%(+30.4)#4 | 6.2%(+31.0)#169 |
| 5. | Hubbard | 33.3% | 6.8%(+26.6)#5 | 6.2%(+27.1)#237 |
| 6. | Sedan | 31.6% | 6.8%(+24.8)#6 | 6.2%(+25.3)#281 |
| 7. | Solway | 29.3% | 6.8%(+22.5)#7 | 6.2%(+23.1)#317 |
| 8. | Strathcona | 28.6% | 6.8%(+21.8)#8 | 6.2%(+22.3)#336 |
| 9. | Oronoco | 27.1% | 6.8%(+20.4)#9 | 6.2%(+20.9)#371 |
| 10. | Marion | 26.2% | 6.8%(+19.5)#10 | 6.2%(+20.0)#402 |
| 11. | Sturgeon Lake | 25.4% | 6.8%(+18.7)#11 | 6.2%(+19.2)#424 |
| 12. | Mckinley | 25.0% | 6.8%(+18.2)#12 | 6.2%(+18.8)#443 |
| 13. | Kinbrae | 25.0% | 6.8%(+18.2)#13 | 6.2%(+18.8)#450 |
| 14. | Hazel Run | 22.2% | 6.8%(+15.5)#14 | 6.2%(+16.0)#589 |
| 15. | Whalan | 22.2% | 6.8%(+15.5)#15 | 6.2%(+16.0)#590 |
| 16. | Kent | 21.1% | 6.8%(+14.3)#16 | 6.2%(+14.8)#660 |
| 17. | Utica | 20.6% | 6.8%(+13.9)#17 | 6.2%(+14.4)#694 |
| 18. | Zumbro Falls | 20.2% | 6.8%(+13.4)#18 | 6.2%(+14.0)#722 |
| 19. | Miesville | 19.6% | 6.8%(+12.8)#19 | 6.2%(+13.4)#787 |
| 20. | Rochester | 19.0% | 6.8%(+12.3)#20 | 6.2%(+12.8)#839 |
| 21. | Nashua | 18.8% | 6.8%(+12.0)#21 | 6.2%(+12.5)#866 |
| 22. | Byron | 18.3% | 6.8%(+11.5)#22 | 6.2%(+12.0)#921 |
| 23. | Mcintosh | 17.6% | 6.8%(+10.8)#23 | 6.2%(+11.3)#1,000 |
| 24. | Zumbrota | 17.4% | 6.8%(+10.7)#24 | 6.2%(+11.2)#1,018 |
| 25. | Pine Island | 17.1% | 6.8%(+10.3)#25 | 6.2%(+10.8)#1,074 |
| 26. | Clinton | 16.9% | 6.8%(+10.1)#26 | 6.2%(+10.6)#1,109 |
| 27. | Bingham Lake | 16.7% | 6.8%(+9.90)#27 | 6.2%(+10.4)#1,151 |
| 28. | Hatfield | 16.7% | 6.8%(+9.90)#28 | 6.2%(+10.4)#1,158 |
| 29. | Barry | 16.7% | 6.8%(+9.90)#29 | 6.2%(+10.4)#1,162 |
| 30. | Holland | 16.2% | 6.8%(+9.45)#30 | 6.2%(+9.97)#1,239 |
| 31. | Millerville | 16.1% | 6.8%(+9.37)#31 | 6.2%(+9.88)#1,257 |
| 32. | Cohasset | 15.8% | 6.8%(+9.07)#32 | 6.2%(+9.59)#1,317 |
| 33. | Lengby | 15.8% | 6.8%(+9.03)#33 | 6.2%(+9.54)#1,331 |
| 34. | Grand Meadow | 15.8% | 6.8%(+9.01)#34 | 6.2%(+9.52)#1,337 |
| 35. | Hermantown | 15.7% | 6.8%(+8.93)#35 | 6.2%(+9.45)#1,353 |
| 36. | Lakeland Shores | 15.3% | 6.8%(+8.57)#36 | 6.2%(+9.09)#1,433 |
| 37. | Magnolia | 15.1% | 6.8%(+8.36)#37 | 6.2%(+8.88)#1,478 |
| 38. | Dawson | 15.0% | 6.8%(+8.28)#38 | 6.2%(+8.80)#1,495 |
| 39. | Kettle River | 14.8% | 6.8%(+8.05)#39 | 6.2%(+8.57)#1,551 |
| 40. | Welcome | 14.7% | 6.8%(+7.95)#40 | 6.2%(+8.47)#1,571 |
| 41. | Hawley | 14.4% | 6.8%(+7.66)#41 | 6.2%(+8.18)#1,671 |
| 42. | Kasson | 14.4% | 6.8%(+7.65)#42 | 6.2%(+8.17)#1,675 |
| 43. | Zemple | 14.3% | 6.8%(+7.52)#43 | 6.2%(+8.04)#1,715 |
| 44. | Tamarack | 14.3% | 6.8%(+7.52)#44 | 6.2%(+8.04)#1,721 |
| 45. | Gem Lake | 14.2% | 6.8%(+7.46)#45 | 6.2%(+7.98)#1,739 |
| 46. | Chatfield | 14.2% | 6.8%(+7.42)#46 | 6.2%(+7.94)#1,755 |
| 47. | Elgin | 14.1% | 6.8%(+7.36)#47 | 6.2%(+7.88)#1,771 |
| 48. | Okabena | 14.1% | 6.8%(+7.36)#48 | 6.2%(+7.87)#1,775 |
| 49. | Leonidas | 13.8% | 6.8%(+7.03)#49 | 6.2%(+7.55)#1,873 |
| 50. | Dilworth | 13.5% | 6.8%(+6.69)#50 | 6.2%(+7.21)#2,004 |
| 51. | Sunfish Lake | 13.4% | 6.8%(+6.60)#51 | 6.2%(+7.11)#2,035 |
| 52. | Garvin | 13.3% | 6.8%(+6.57)#52 | 6.2%(+7.09)#2,051 |
| 53. | Alvarado | 13.3% | 6.8%(+6.52)#53 | 6.2%(+7.04)#2,073 |
| 54. | Hills | 13.2% | 6.8%(+6.44)#54 | 6.2%(+6.96)#2,104 |
| 55. | Pickwick | 13.1% | 6.8%(+6.35)#55 | 6.2%(+6.87)#2,134 |
| 56. | Chickamaw Beach | 13.1% | 6.8%(+6.33)#56 | 6.2%(+6.85)#2,137 |
| 57. | Emily | 13.0% | 6.8%(+6.26)#57 | 6.2%(+6.78)#2,177 |
| 58. | Ironton | 13.0% | 6.8%(+6.23)#58 | 6.2%(+6.74)#2,197 |
| 59. | Orr | 12.8% | 6.8%(+6.00)#59 | 6.2%(+6.51)#2,303 |
| 60. | Rockville | 12.7% | 6.8%(+5.98)#60 | 6.2%(+6.49)#2,311 |
| 61. | Taconite | 12.6% | 6.8%(+5.86)#61 | 6.2%(+6.38)#2,368 |
| 62. | Racine | 12.6% | 6.8%(+5.83)#62 | 6.2%(+6.35)#2,383 |
| 63. | Freeport | 12.4% | 6.8%(+5.68)#63 | 6.2%(+6.20)#2,461 |
| 64. | Evansville | 12.2% | 6.8%(+5.40)#64 | 6.2%(+5.92)#2,597 |
| 65. | Askov | 12.0% | 6.8%(+5.27)#65 | 6.2%(+5.79)#2,658 |
| 66. | Scanlon | 12.0% | 6.8%(+5.20)#66 | 6.2%(+5.72)#2,694 |
| 67. | Aitkin | 11.9% | 6.8%(+5.15)#67 | 6.2%(+5.66)#2,717 |
| 68. | Carlton | 11.8% | 6.8%(+5.04)#68 | 6.2%(+5.55)#2,775 |
| 69. | Akeley | 11.8% | 6.8%(+5.00)#69 | 6.2%(+5.52)#2,792 |
| 70. | Little Rock | 11.7% | 6.8%(+4.95)#70 | 6.2%(+5.47)#2,828 |
| 71. | Blomkest | 11.7% | 6.8%(+4.95)#71 | 6.2%(+5.47)#2,831 |
| 72. | Dumont | 11.7% | 6.8%(+4.94)#72 | 6.2%(+5.46)#2,835 |
| 73. | Sartell | 11.7% | 6.8%(+4.94)#73 | 6.2%(+5.46)#2,836 |
| 74. | Wabasha | 11.6% | 6.8%(+4.86)#74 | 6.2%(+5.37)#2,891 |
| 75. | Verndale | 11.6% | 6.8%(+4.85)#75 | 6.2%(+5.37)#2,893 |
| 76. | Hollandale | 11.5% | 6.8%(+4.78)#76 | 6.2%(+5.29)#2,951 |
| 77. | St Charles | 11.5% | 6.8%(+4.74)#77 | 6.2%(+5.25)#2,990 |
| 78. | Goodridge | 11.1% | 6.8%(+4.35)#78 | 6.2%(+4.87)#3,261 |
| 79. | Rushford | 11.1% | 6.8%(+4.30)#79 | 6.2%(+4.82)#3,295 |
| 80. | Elkton | 11.0% | 6.8%(+4.20)#80 | 6.2%(+4.71)#3,355 |
| 81. | La Crescent | 10.9% | 6.8%(+4.11)#81 | 6.2%(+4.62)#3,410 |
| 82. | Eitzen | 10.9% | 6.8%(+4.09)#82 | 6.2%(+4.61)#3,427 |
| 83. | Marine On St Croix | 10.8% | 6.8%(+4.07)#83 | 6.2%(+4.59)#3,447 |
| 84. | Avon | 10.8% | 6.8%(+4.07)#84 | 6.2%(+4.59)#3,449 |
| 85. | St Michael | 10.8% | 6.8%(+4.06)#85 | 6.2%(+4.58)#3,460 |
| 86. | Albany | 10.8% | 6.8%(+4.03)#86 | 6.2%(+4.55)#3,474 |
| 87. | Spring Valley | 10.8% | 6.8%(+4.00)#87 | 6.2%(+4.52)#3,506 |
| 88. | Elysian | 10.8% | 6.8%(+3.99)#88 | 6.2%(+4.51)#3,516 |
| 89. | Dresbach | 10.7% | 6.8%(+3.98)#89 | 6.2%(+4.50)#3,528 |
| 90. | Rice Lake | 10.7% | 6.8%(+3.92)#90 | 6.2%(+4.43)#3,571 |
| 91. | Sauk Rapids | 10.7% | 6.8%(+3.91)#91 | 6.2%(+4.43)#3,577 |
| 92. | Lilydale | 10.7% | 6.8%(+3.90)#92 | 6.2%(+4.42)#3,585 |
| 93. | Barnesville | 10.6% | 6.8%(+3.85)#93 | 6.2%(+4.37)#3,625 |
| 94. | Pipestone | 10.5% | 6.8%(+3.76)#94 | 6.2%(+4.28)#3,703 |
| 95. | Meire Grove | 10.5% | 6.8%(+3.76)#95 | 6.2%(+4.28)#3,719 |
| 96. | Aldrich | 10.5% | 6.8%(+3.76)#96 | 6.2%(+4.28)#3,725 |
| 97. | Soudan | 10.5% | 6.8%(+3.71)#97 | 6.2%(+4.23)#3,761 |
| 98. | Center City | 10.4% | 6.8%(+3.65)#98 | 6.2%(+4.17)#3,804 |
| 99. | Hugo | 10.4% | 6.8%(+3.60)#99 | 6.2%(+4.11)#3,858 |
| 100. | Bayport | 10.3% | 6.8%(+3.57)#100 | 6.2%(+4.08)#3,884 |
Common Questions
What are the Top 10 Cities with the Highest Percentage of Population Employed in Health Diagnosing & Treating in Minnesota?
Top 10 Cities with the Highest Percentage of Population Employed in Health Diagnosing & Treating in Minnesota are:
#1
55.4%
#2
42.9%
#3
37.5%
#4
37.2%
#5
31.6%
#6
29.3%
#7
28.6%
#8
27.1%
#9
25.4%
#10
25.0%
What city has the Highest Percentage of Population Employed in Health Diagnosing & Treating in Minnesota?
Alpha has the Highest Percentage of Population Employed in Health Diagnosing & Treating in Minnesota with 55.4%.
What is the Percentage of Population Employed in Health Diagnosing & Treating in the State of Minnesota?
Percentage of Population Employed in Health Diagnosing & Treating in Minnesota is 6.8%.
What is the Percentage of Population Employed in Health Diagnosing & Treating in the United States?
Percentage of Population Employed in Health Diagnosing & Treating in the United States is 6.2%.