Cities with the Highest Percentage of Population Employed in Health Diagnosing & Treating in Utah
RELATED REPORTS & OPTIONS
Health Diagnosing & Treating
Utah
Compare Cities
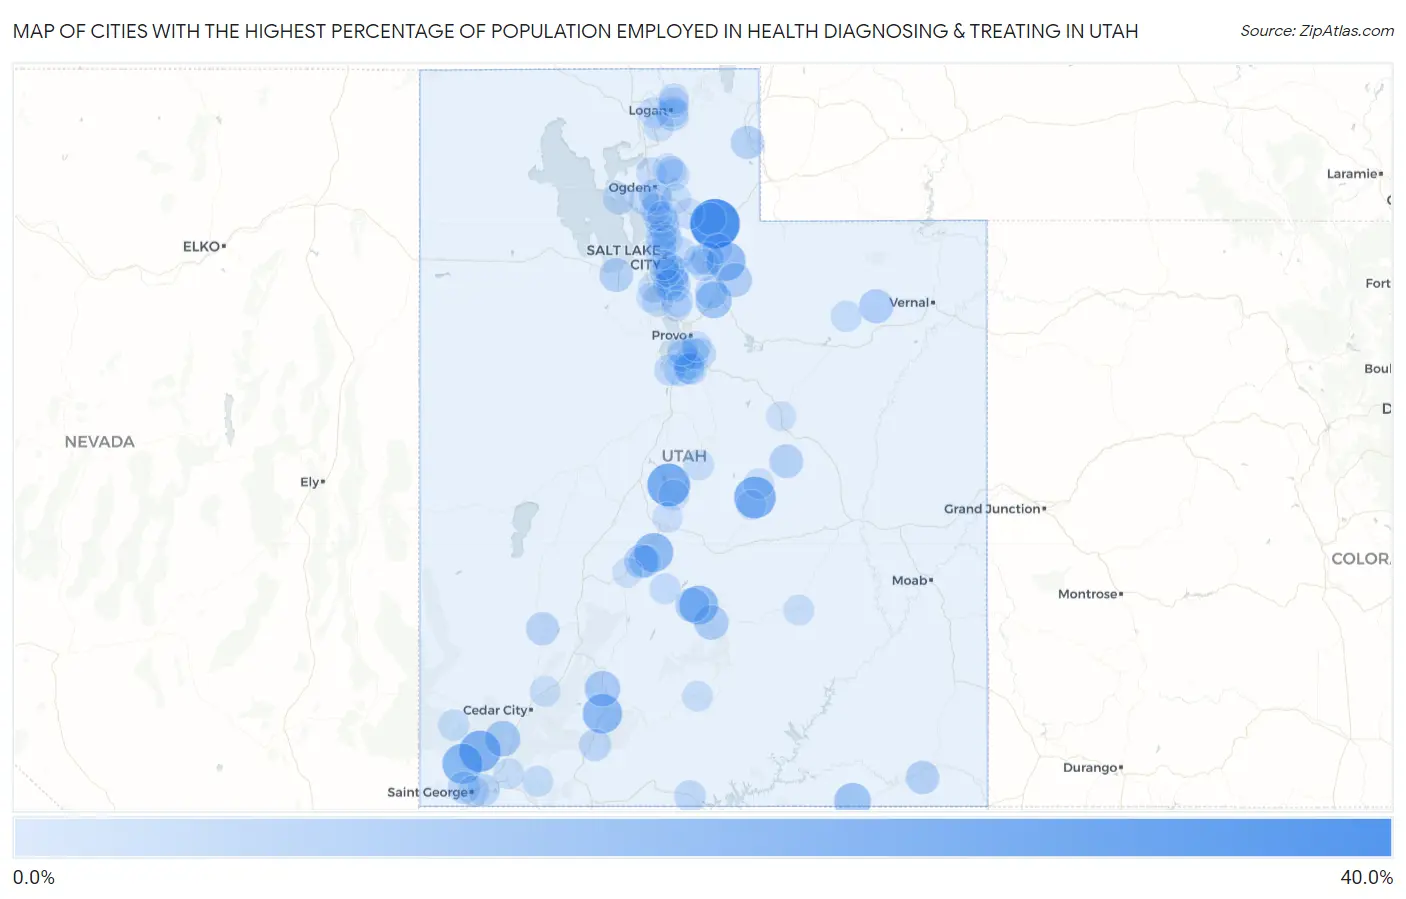
Map of Cities with the Highest Percentage of Population Employed in Health Diagnosing & Treating in Utah
0.0%
40.0%
Cities with the Highest Percentage of Population Employed in Health Diagnosing & Treating in Utah
| City | % Employed | vs State | vs National | |
| 1. | Echo | 35.9% | 5.1%(+30.8)#1 | 6.2%(+29.7)#186 |
| 2. | Fayette | 25.0% | 5.1%(+19.9)#2 | 6.2%(+18.8)#436 |
| 3. | Clawson | 23.1% | 5.1%(+18.0)#3 | 6.2%(+16.8)#543 |
| 4. | Pine Valley | 22.6% | 5.1%(+17.4)#4 | 6.2%(+16.3)#575 |
| 5. | Sundance | 21.4% | 5.1%(+16.3)#5 | 6.2%(+15.2)#636 |
| 6. | Dammeron Valley | 20.8% | 5.1%(+15.6)#6 | 6.2%(+14.5)#686 |
| 7. | Hatch | 19.4% | 5.1%(+14.3)#7 | 6.2%(+13.2)#798 |
| 8. | Glenwood | 19.2% | 5.1%(+14.0)#8 | 6.2%(+12.9)#824 |
| 9. | Lyman | 18.8% | 5.1%(+13.7)#9 | 6.2%(+12.6)#858 |
| 10. | Peoa | 18.6% | 5.1%(+13.4)#10 | 6.2%(+12.3)#888 |
| 11. | East Basin | 16.7% | 5.1%(+11.6)#11 | 6.2%(+10.5)#1,134 |
| 12. | Oljato Monument Valley | 15.4% | 5.1%(+10.2)#12 | 6.2%(+9.11)#1,430 |
| 13. | Charleston | 14.9% | 5.1%(+9.79)#13 | 6.2%(+8.67)#1,523 |
| 14. | New Harmony | 13.7% | 5.1%(+8.57)#14 | 6.2%(+7.45)#1,914 |
| 15. | Panguitch | 13.6% | 5.1%(+8.49)#15 | 6.2%(+7.37)#1,940 |
| 16. | Teasdale | 12.2% | 5.1%(+7.12)#16 | 6.2%(+6.00)#2,558 |
| 17. | Loa | 12.1% | 5.1%(+6.96)#17 | 6.2%(+5.84)#2,636 |
| 18. | Francis | 11.5% | 5.1%(+6.37)#18 | 6.2%(+5.25)#2,995 |
| 19. | Neola | 11.5% | 5.1%(+6.37)#19 | 6.2%(+5.25)#2,998 |
| 20. | Central Valley | 11.4% | 5.1%(+6.30)#20 | 6.2%(+5.18)#3,046 |
| 21. | Granite | 11.2% | 5.1%(+6.08)#21 | 6.2%(+4.96)#3,182 |
| 22. | Stansbury Park | 11.0% | 5.1%(+5.83)#22 | 6.2%(+4.71)#3,351 |
| 23. | Elmo | 10.8% | 5.1%(+5.67)#23 | 6.2%(+4.55)#3,476 |
| 24. | Tselakai Dezza | 10.5% | 5.1%(+5.40)#24 | 6.2%(+4.28)#3,722 |
| 25. | Holladay | 10.4% | 5.1%(+5.30)#25 | 6.2%(+4.18)#3,795 |
| 26. | Farmington | 10.3% | 5.1%(+5.16)#26 | 6.2%(+4.04)#3,933 |
| 27. | Woodruff | 10.2% | 5.1%(+5.10)#27 | 6.2%(+3.98)#3,988 |
| 28. | Minersville | 9.8% | 5.1%(+4.66)#28 | 6.2%(+3.54)#4,443 |
| 29. | Silver Summit | 9.4% | 5.1%(+4.29)#29 | 6.2%(+3.17)#4,869 |
| 30. | Washington Terrace | 9.0% | 5.1%(+3.91)#30 | 6.2%(+2.79)#5,370 |
| 31. | Annabella | 8.9% | 5.1%(+3.80)#31 | 6.2%(+2.68)#5,535 |
| 32. | Spring Lake | 8.9% | 5.1%(+3.78)#32 | 6.2%(+2.66)#5,556 |
| 33. | Midway | 8.9% | 5.1%(+3.73)#33 | 6.2%(+2.61)#5,628 |
| 34. | Santa Clara | 8.8% | 5.1%(+3.64)#34 | 6.2%(+2.52)#5,753 |
| 35. | Henefer | 8.7% | 5.1%(+3.61)#35 | 6.2%(+2.49)#5,805 |
| 36. | Providence | 8.6% | 5.1%(+3.51)#36 | 6.2%(+2.39)#5,945 |
| 37. | Cottonwood Heights | 8.6% | 5.1%(+3.51)#37 | 6.2%(+2.39)#5,948 |
| 38. | Washington | 8.5% | 5.1%(+3.41)#38 | 6.2%(+2.29)#6,106 |
| 39. | Alton | 8.5% | 5.1%(+3.33)#39 | 6.2%(+2.21)#6,241 |
| 40. | Woodland Hills | 8.1% | 5.1%(+2.93)#40 | 6.2%(+1.81)#6,901 |
| 41. | Snyderville | 8.0% | 5.1%(+2.91)#41 | 6.2%(+1.79)#6,932 |
| 42. | Big Water | 8.0% | 5.1%(+2.91)#42 | 6.2%(+1.79)#6,940 |
| 43. | Hooper | 8.0% | 5.1%(+2.84)#43 | 6.2%(+1.72)#7,064 |
| 44. | Mapleton | 7.9% | 5.1%(+2.75)#44 | 6.2%(+1.63)#7,224 |
| 45. | Eden | 7.7% | 5.1%(+2.60)#45 | 6.2%(+1.48)#7,513 |
| 46. | Alpine | 7.7% | 5.1%(+2.56)#46 | 6.2%(+1.44)#7,606 |
| 47. | Salem | 7.7% | 5.1%(+2.55)#47 | 6.2%(+1.43)#7,610 |
| 48. | River Heights | 7.7% | 5.1%(+2.55)#48 | 6.2%(+1.43)#7,632 |
| 49. | Genola | 7.7% | 5.1%(+2.55)#49 | 6.2%(+1.43)#7,635 |
| 50. | Emigration Canyon | 7.6% | 5.1%(+2.50)#50 | 6.2%(+1.38)#7,726 |
| 51. | Centerville | 7.6% | 5.1%(+2.45)#51 | 6.2%(+1.33)#7,858 |
| 52. | Benjamin | 7.5% | 5.1%(+2.40)#52 | 6.2%(+1.28)#7,959 |
| 53. | Millcreek | 7.5% | 5.1%(+2.35)#53 | 6.2%(+1.23)#8,058 |
| 54. | St George | 7.3% | 5.1%(+2.21)#54 | 6.2%(+1.09)#8,401 |
| 55. | Enterprise | 7.2% | 5.1%(+2.04)#55 | 6.2%(+0.925)#8,761 |
| 56. | Salt Lake City | 7.1% | 5.1%(+1.96)#56 | 6.2%(+0.843)#8,949 |
| 57. | West Bountiful | 7.0% | 5.1%(+1.90)#57 | 6.2%(+0.778)#9,106 |
| 58. | Altamont | 7.0% | 5.1%(+1.88)#58 | 6.2%(+0.762)#9,147 |
| 59. | Mendon | 7.0% | 5.1%(+1.88)#59 | 6.2%(+0.758)#9,154 |
| 60. | Spanish Fork | 7.0% | 5.1%(+1.83)#60 | 6.2%(+0.712)#9,285 |
| 61. | Springdale | 6.8% | 5.1%(+1.69)#61 | 6.2%(+0.573)#9,628 |
| 62. | Elk Ridge | 6.8% | 5.1%(+1.64)#62 | 6.2%(+0.517)#9,774 |
| 63. | Koosharem | 6.8% | 5.1%(+1.63)#63 | 6.2%(+0.512)#9,790 |
| 64. | Summit | 6.7% | 5.1%(+1.54)#64 | 6.2%(+0.422)#10,012 |
| 65. | Bluffdale | 6.6% | 5.1%(+1.51)#65 | 6.2%(+0.393)#10,091 |
| 66. | Lake Shore | 6.6% | 5.1%(+1.49)#66 | 6.2%(+0.367)#10,156 |
| 67. | La Verkin | 6.5% | 5.1%(+1.38)#67 | 6.2%(+0.256)#10,433 |
| 68. | Summit Park | 6.5% | 5.1%(+1.33)#68 | 6.2%(+0.211)#10,564 |
| 69. | Sandy | 6.5% | 5.1%(+1.33)#69 | 6.2%(+0.206)#10,598 |
| 70. | Gunnison | 6.4% | 5.1%(+1.32)#70 | 6.2%(+0.203)#10,606 |
| 71. | North Salt Lake | 6.4% | 5.1%(+1.26)#71 | 6.2%(+0.136)#10,768 |
| 72. | Ephraim | 6.4% | 5.1%(+1.24)#72 | 6.2%(+0.124)#10,797 |
| 73. | South Jordan | 6.3% | 5.1%(+1.20)#73 | 6.2%(+0.075)#10,916 |
| 74. | Hanksville | 6.3% | 5.1%(+1.19)#74 | 6.2%(+0.071)#10,928 |
| 75. | Escalante | 6.3% | 5.1%(+1.17)#75 | 6.2%(+0.051)#10,985 |
| 76. | Hyde Park | 6.3% | 5.1%(+1.14)#76 | 6.2%(+0.025)#11,038 |
| 77. | Wellsville | 6.2% | 5.1%(+1.11)#77 | 6.2%(-0.014)#11,148 |
| 78. | Morgan | 6.2% | 5.1%(+1.10)#78 | 6.2%(-0.015)#11,149 |
| 79. | Bountiful | 6.2% | 5.1%(+1.08)#79 | 6.2%(-0.041)#11,212 |
| 80. | Orangeville | 6.2% | 5.1%(+1.07)#80 | 6.2%(-0.046)#11,228 |
| 81. | Pleasant View | 6.1% | 5.1%(+1.02)#81 | 6.2%(-0.097)#11,359 |
| 82. | Redmond | 6.1% | 5.1%(+0.998)#82 | 6.2%(-0.122)#11,415 |
| 83. | Liberty | 6.1% | 5.1%(+0.987)#83 | 6.2%(-0.133)#11,450 |
| 84. | Kaysville | 6.0% | 5.1%(+0.910)#84 | 6.2%(-0.210)#11,653 |
| 85. | North Logan | 6.0% | 5.1%(+0.891)#85 | 6.2%(-0.229)#11,699 |
| 86. | Springville | 6.0% | 5.1%(+0.845)#86 | 6.2%(-0.275)#11,828 |
| 87. | South Weber | 6.0% | 5.1%(+0.841)#87 | 6.2%(-0.279)#11,835 |
| 88. | Layton | 5.9% | 5.1%(+0.813)#88 | 6.2%(-0.307)#11,906 |
| 89. | Wolf Creek | 5.8% | 5.1%(+0.722)#89 | 6.2%(-0.398)#12,126 |
| 90. | Mountain Green | 5.8% | 5.1%(+0.720)#90 | 6.2%(-0.400)#12,133 |
| 91. | Clinton | 5.8% | 5.1%(+0.697)#91 | 6.2%(-0.423)#12,197 |
| 92. | Murray | 5.7% | 5.1%(+0.613)#92 | 6.2%(-0.507)#12,441 |
| 93. | Wanship | 5.7% | 5.1%(+0.604)#93 | 6.2%(-0.516)#12,457 |
| 94. | Fruit Heights | 5.7% | 5.1%(+0.591)#94 | 6.2%(-0.529)#12,492 |
| 95. | Herriman | 5.7% | 5.1%(+0.586)#95 | 6.2%(-0.534)#12,522 |
| 96. | Highland | 5.6% | 5.1%(+0.505)#96 | 6.2%(-0.615)#12,750 |
| 97. | Joseph | 5.6% | 5.1%(+0.493)#97 | 6.2%(-0.627)#12,789 |
| 98. | Helper | 5.6% | 5.1%(+0.455)#98 | 6.2%(-0.665)#12,902 |
| 99. | Ferron | 5.6% | 5.1%(+0.454)#99 | 6.2%(-0.666)#12,907 |
| 100. | South Salt Lake | 5.5% | 5.1%(+0.358)#100 | 6.2%(-0.762)#13,155 |
Common Questions
What are the Top 10 Cities with the Highest Percentage of Population Employed in Health Diagnosing & Treating in Utah?
Top 10 Cities with the Highest Percentage of Population Employed in Health Diagnosing & Treating in Utah are:
#1
35.9%
#2
25.0%
#3
23.1%
#4
22.6%
#5
20.8%
#6
19.4%
#7
19.2%
#8
18.8%
#9
18.6%
#10
15.4%
What city has the Highest Percentage of Population Employed in Health Diagnosing & Treating in Utah?
Echo has the Highest Percentage of Population Employed in Health Diagnosing & Treating in Utah with 35.9%.
What is the Percentage of Population Employed in Health Diagnosing & Treating in the State of Utah?
Percentage of Population Employed in Health Diagnosing & Treating in Utah is 5.1%.
What is the Percentage of Population Employed in Health Diagnosing & Treating in the United States?
Percentage of Population Employed in Health Diagnosing & Treating in the United States is 6.2%.