Cities with the Highest Percentage of Population Employed in Health Diagnosing & Treating in Indiana
RELATED REPORTS & OPTIONS
Health Diagnosing & Treating
Indiana
Compare Cities
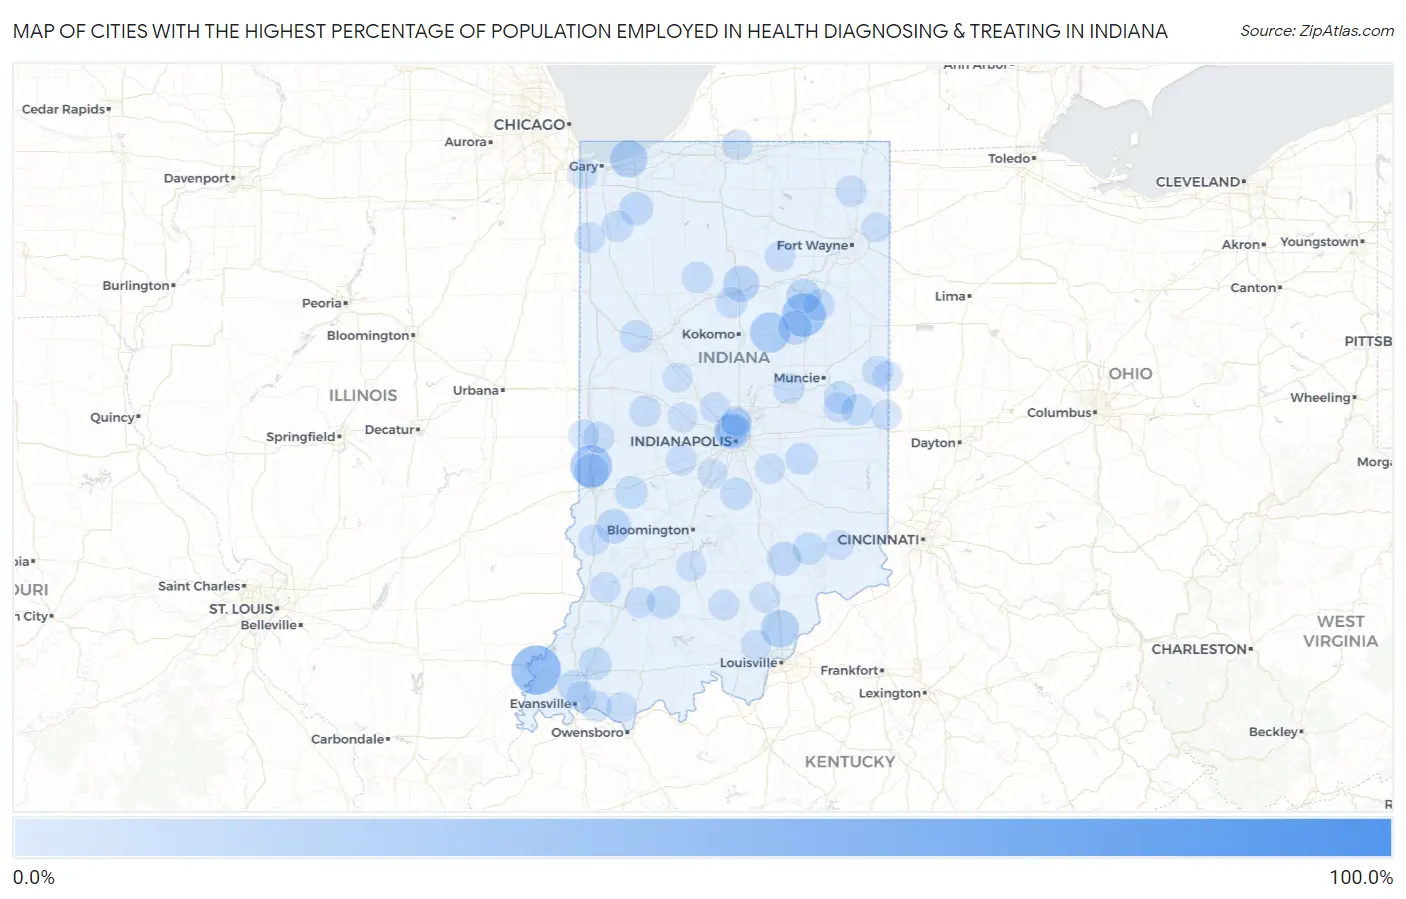
Map of Cities with the Highest Percentage of Population Employed in Health Diagnosing & Treating in Indiana
0.0%
100.0%
Cities with the Highest Percentage of Population Employed in Health Diagnosing & Treating in Indiana
| City | % Employed | vs State | vs National | |
| 1. | Rainsville | 100.0% | 6.6%(+93.4)#1 | 6.2%(+93.8)#15 |
| 2. | Tocsin | 58.4% | 6.6%(+51.8)#2 | 6.2%(+52.1)#46 |
| 3. | Canton | 52.2% | 6.6%(+45.6)#3 | 6.2%(+45.9)#70 |
| 4. | Griffin | 50.0% | 6.6%(+43.4)#4 | 6.2%(+43.8)#79 |
| 5. | Paris Crossing | 46.7% | 6.6%(+40.1)#5 | 6.2%(+40.4)#94 |
| 6. | Mariah Hill | 46.0% | 6.6%(+39.5)#6 | 6.2%(+39.8)#99 |
| 7. | Burnett | 38.7% | 6.6%(+32.2)#7 | 6.2%(+32.5)#155 |
| 8. | Landess | 37.9% | 6.6%(+31.3)#8 | 6.2%(+31.6)#161 |
| 9. | Letts | 37.1% | 6.6%(+30.6)#9 | 6.2%(+30.9)#171 |
| 10. | Maxwell | 35.5% | 6.6%(+29.0)#10 | 6.2%(+29.3)#194 |
| 11. | Shepardsville | 34.8% | 6.6%(+28.2)#11 | 6.2%(+28.5)#205 |
| 12. | Nyona Lake | 33.3% | 6.6%(+26.8)#12 | 6.2%(+27.1)#224 |
| 13. | Pierceville | 33.3% | 6.6%(+26.8)#13 | 6.2%(+27.1)#227 |
| 14. | Grayford | 33.3% | 6.6%(+26.8)#14 | 6.2%(+27.1)#228 |
| 15. | Newbern | 31.9% | 6.6%(+25.4)#15 | 6.2%(+25.7)#268 |
| 16. | St. Anthony | 31.6% | 6.6%(+25.1)#16 | 6.2%(+25.4)#278 |
| 17. | Sims | 31.0% | 6.6%(+24.5)#17 | 6.2%(+24.8)#290 |
| 18. | Memphis | 26.3% | 6.6%(+19.7)#18 | 6.2%(+20.0)#398 |
| 19. | Dune Acres | 25.6% | 6.6%(+19.1)#19 | 6.2%(+19.4)#418 |
| 20. | Spring Hill | 23.3% | 6.6%(+16.8)#20 | 6.2%(+17.1)#529 |
| 21. | Mexico | 23.3% | 6.6%(+16.8)#21 | 6.2%(+17.1)#530 |
| 22. | Tecumseh | 20.5% | 6.6%(+14.0)#22 | 6.2%(+14.3)#703 |
| 23. | Mount Etna | 20.5% | 6.6%(+13.9)#23 | 6.2%(+14.2)#705 |
| 24. | Bretzville | 20.5% | 6.6%(+13.9)#24 | 6.2%(+14.2)#706 |
| 25. | Coalmont | 20.1% | 6.6%(+13.6)#25 | 6.2%(+13.9)#727 |
| 26. | Talma | 20.0% | 6.6%(+13.4)#26 | 6.2%(+13.8)#745 |
| 27. | Lucerne | 19.7% | 6.6%(+13.2)#27 | 6.2%(+13.5)#778 |
| 28. | Marion | 19.3% | 6.6%(+12.7)#28 | 6.2%(+13.0)#815 |
| 29. | Hayden | 18.9% | 6.6%(+12.3)#29 | 6.2%(+12.6)#854 |
| 30. | Kouts | 18.3% | 6.6%(+11.8)#30 | 6.2%(+12.1)#912 |
| 31. | Spencerville | 18.2% | 6.6%(+11.7)#31 | 6.2%(+12.0)#924 |
| 32. | Kramer | 17.9% | 6.6%(+11.4)#32 | 6.2%(+11.7)#963 |
| 33. | Stanford | 17.6% | 6.6%(+11.1)#33 | 6.2%(+11.4)#991 |
| 34. | Mackey | 17.3% | 6.6%(+10.8)#34 | 6.2%(+11.1)#1,033 |
| 35. | Shoals | 17.0% | 6.6%(+10.5)#35 | 6.2%(+10.8)#1,080 |
| 36. | Oakville | 16.7% | 6.6%(+10.1)#36 | 6.2%(+10.4)#1,148 |
| 37. | Wynnedale | 16.5% | 6.6%(+9.97)#37 | 6.2%(+10.3)#1,174 |
| 38. | Eminence | 16.3% | 6.6%(+9.78)#38 | 6.2%(+10.1)#1,213 |
| 39. | Center Point | 16.2% | 6.6%(+9.63)#39 | 6.2%(+9.94)#1,245 |
| 40. | Montmorenci | 16.1% | 6.6%(+9.58)#40 | 6.2%(+9.88)#1,255 |
| 41. | Butlerville | 16.0% | 6.6%(+9.50)#41 | 6.2%(+9.80)#1,278 |
| 42. | Darmstadt | 15.8% | 6.6%(+9.28)#42 | 6.2%(+9.58)#1,318 |
| 43. | Bowling Green | 15.7% | 6.6%(+9.18)#43 | 6.2%(+9.49)#1,347 |
| 44. | Lakewood | 15.7% | 6.6%(+9.11)#44 | 6.2%(+9.41)#1,359 |
| 45. | Blountsville | 15.6% | 6.6%(+9.07)#45 | 6.2%(+9.38)#1,367 |
| 46. | Lake Eliza | 15.6% | 6.6%(+9.03)#46 | 6.2%(+9.33)#1,377 |
| 47. | Center | 15.6% | 6.6%(+9.00)#47 | 6.2%(+9.31)#1,383 |
| 48. | Nineveh | 15.4% | 6.6%(+8.87)#48 | 6.2%(+9.17)#1,409 |
| 49. | Trafalgar | 15.4% | 6.6%(+8.86)#49 | 6.2%(+9.17)#1,410 |
| 50. | Economy | 15.2% | 6.6%(+8.60)#50 | 6.2%(+8.91)#1,474 |
| 51. | Arlington | 14.8% | 6.6%(+8.28)#51 | 6.2%(+8.59)#1,543 |
| 52. | Warren | 14.8% | 6.6%(+8.20)#52 | 6.2%(+8.51)#1,562 |
| 53. | Bippus | 14.5% | 6.6%(+7.99)#53 | 6.2%(+8.30)#1,636 |
| 54. | Lake Holiday | 14.3% | 6.6%(+7.79)#54 | 6.2%(+8.10)#1,689 |
| 55. | Royal Center | 14.3% | 6.6%(+7.73)#55 | 6.2%(+8.04)#1,699 |
| 56. | Grammer | 14.2% | 6.6%(+7.65)#56 | 6.2%(+7.96)#1,745 |
| 57. | Johnson | 14.1% | 6.6%(+7.51)#57 | 6.2%(+7.82)#1,788 |
| 58. | De Motte | 14.0% | 6.6%(+7.50)#58 | 6.2%(+7.80)#1,793 |
| 59. | Newburgh | 13.9% | 6.6%(+7.37)#59 | 6.2%(+7.67)#1,823 |
| 60. | Onward | 13.7% | 6.6%(+7.15)#60 | 6.2%(+7.45)#1,915 |
| 61. | Woodlawn Heights | 13.5% | 6.6%(+6.91)#61 | 6.2%(+7.22)#1,999 |
| 62. | Montezuma | 13.4% | 6.6%(+6.88)#62 | 6.2%(+7.19)#2,011 |
| 63. | Stilesville | 13.2% | 6.6%(+6.68)#63 | 6.2%(+6.99)#2,087 |
| 64. | Laud | 13.2% | 6.6%(+6.68)#64 | 6.2%(+6.99)#2,091 |
| 65. | Corunna | 13.2% | 6.6%(+6.64)#65 | 6.2%(+6.94)#2,109 |
| 66. | Dana | 13.1% | 6.6%(+6.50)#66 | 6.2%(+6.81)#2,155 |
| 67. | Saratoga | 13.0% | 6.6%(+6.49)#67 | 6.2%(+6.80)#2,159 |
| 68. | Bicknell | 13.0% | 6.6%(+6.46)#68 | 6.2%(+6.76)#2,186 |
| 69. | Sullivan | 12.9% | 6.6%(+6.38)#69 | 6.2%(+6.69)#2,226 |
| 70. | Meridian Hills | 12.9% | 6.6%(+6.38)#70 | 6.2%(+6.68)#2,229 |
| 71. | Campbellsburg | 12.7% | 6.6%(+6.18)#71 | 6.2%(+6.48)#2,317 |
| 72. | Cannelburg | 12.7% | 6.6%(+6.18)#72 | 6.2%(+6.48)#2,320 |
| 73. | Union City | 12.7% | 6.6%(+6.12)#73 | 6.2%(+6.43)#2,346 |
| 74. | Richland | 12.7% | 6.6%(+6.10)#74 | 6.2%(+6.41)#2,355 |
| 75. | West Middleton | 12.6% | 6.6%(+6.07)#75 | 6.2%(+6.38)#2,370 |
| 76. | Antioch | 12.5% | 6.6%(+5.95)#76 | 6.2%(+6.26)#2,430 |
| 77. | Lake Village | 12.4% | 6.6%(+5.87)#77 | 6.2%(+6.17)#2,470 |
| 78. | Benton | 12.3% | 6.6%(+5.79)#78 | 6.2%(+6.09)#2,512 |
| 79. | Zionsville | 12.2% | 6.6%(+5.60)#79 | 6.2%(+5.91)#2,603 |
| 80. | Putnamville | 12.0% | 6.6%(+5.49)#80 | 6.2%(+5.80)#2,655 |
| 81. | Greenville | 12.0% | 6.6%(+5.46)#81 | 6.2%(+5.77)#2,666 |
| 82. | Whitewater | 12.0% | 6.6%(+5.45)#82 | 6.2%(+5.76)#2,676 |
| 83. | Underwood | 12.0% | 6.6%(+5.44)#83 | 6.2%(+5.74)#2,679 |
| 84. | North Manchester | 12.0% | 6.6%(+5.43)#84 | 6.2%(+5.74)#2,683 |
| 85. | Mooreland | 11.9% | 6.6%(+5.34)#85 | 6.2%(+5.65)#2,729 |
| 86. | Granger | 11.9% | 6.6%(+5.34)#86 | 6.2%(+5.65)#2,730 |
| 87. | Waynesville | 11.8% | 6.6%(+5.29)#87 | 6.2%(+5.60)#2,752 |
| 88. | Avoca | 11.8% | 6.6%(+5.21)#88 | 6.2%(+5.52)#2,791 |
| 89. | Arcola | 11.6% | 6.6%(+5.09)#89 | 6.2%(+5.40)#2,876 |
| 90. | Melody Hill | 11.6% | 6.6%(+5.09)#90 | 6.2%(+5.40)#2,877 |
| 91. | Versailles | 11.6% | 6.6%(+5.08)#91 | 6.2%(+5.38)#2,882 |
| 92. | Little York | 11.6% | 6.6%(+5.08)#92 | 6.2%(+5.38)#2,883 |
| 93. | Fairland | 11.6% | 6.6%(+5.03)#93 | 6.2%(+5.33)#2,929 |
| 94. | Munster | 11.5% | 6.6%(+4.91)#94 | 6.2%(+5.21)#3,016 |
| 95. | Williams Creek | 11.4% | 6.6%(+4.89)#95 | 6.2%(+5.20)#3,034 |
| 96. | Jamestown | 11.4% | 6.6%(+4.86)#96 | 6.2%(+5.17)#3,054 |
| 97. | Harlan | 11.3% | 6.6%(+4.78)#97 | 6.2%(+5.09)#3,099 |
| 98. | Philadelphia | 11.3% | 6.6%(+4.76)#98 | 6.2%(+5.07)#3,114 |
| 99. | Colfax | 11.3% | 6.6%(+4.71)#99 | 6.2%(+5.02)#3,143 |
| 100. | Brooklyn | 11.1% | 6.6%(+4.52)#100 | 6.2%(+4.82)#3,290 |
Common Questions
What are the Top 10 Cities with the Highest Percentage of Population Employed in Health Diagnosing & Treating in Indiana?
Top 10 Cities with the Highest Percentage of Population Employed in Health Diagnosing & Treating in Indiana are:
#1
50.0%
#2
37.9%
#3
34.8%
#4
31.0%
#5
26.3%
#6
25.6%
#7
23.3%
#8
23.3%
#9
20.5%
#10
20.5%
What city has the Highest Percentage of Population Employed in Health Diagnosing & Treating in Indiana?
Griffin has the Highest Percentage of Population Employed in Health Diagnosing & Treating in Indiana with 50.0%.
What is the Percentage of Population Employed in Health Diagnosing & Treating in the State of Indiana?
Percentage of Population Employed in Health Diagnosing & Treating in Indiana is 6.6%.
What is the Percentage of Population Employed in Health Diagnosing & Treating in the United States?
Percentage of Population Employed in Health Diagnosing & Treating in the United States is 6.2%.