Cities with the Highest Percentage of Population Employed in Health Diagnosing & Treating in Georgia
RELATED REPORTS & OPTIONS
Health Diagnosing & Treating
Georgia
Compare Cities
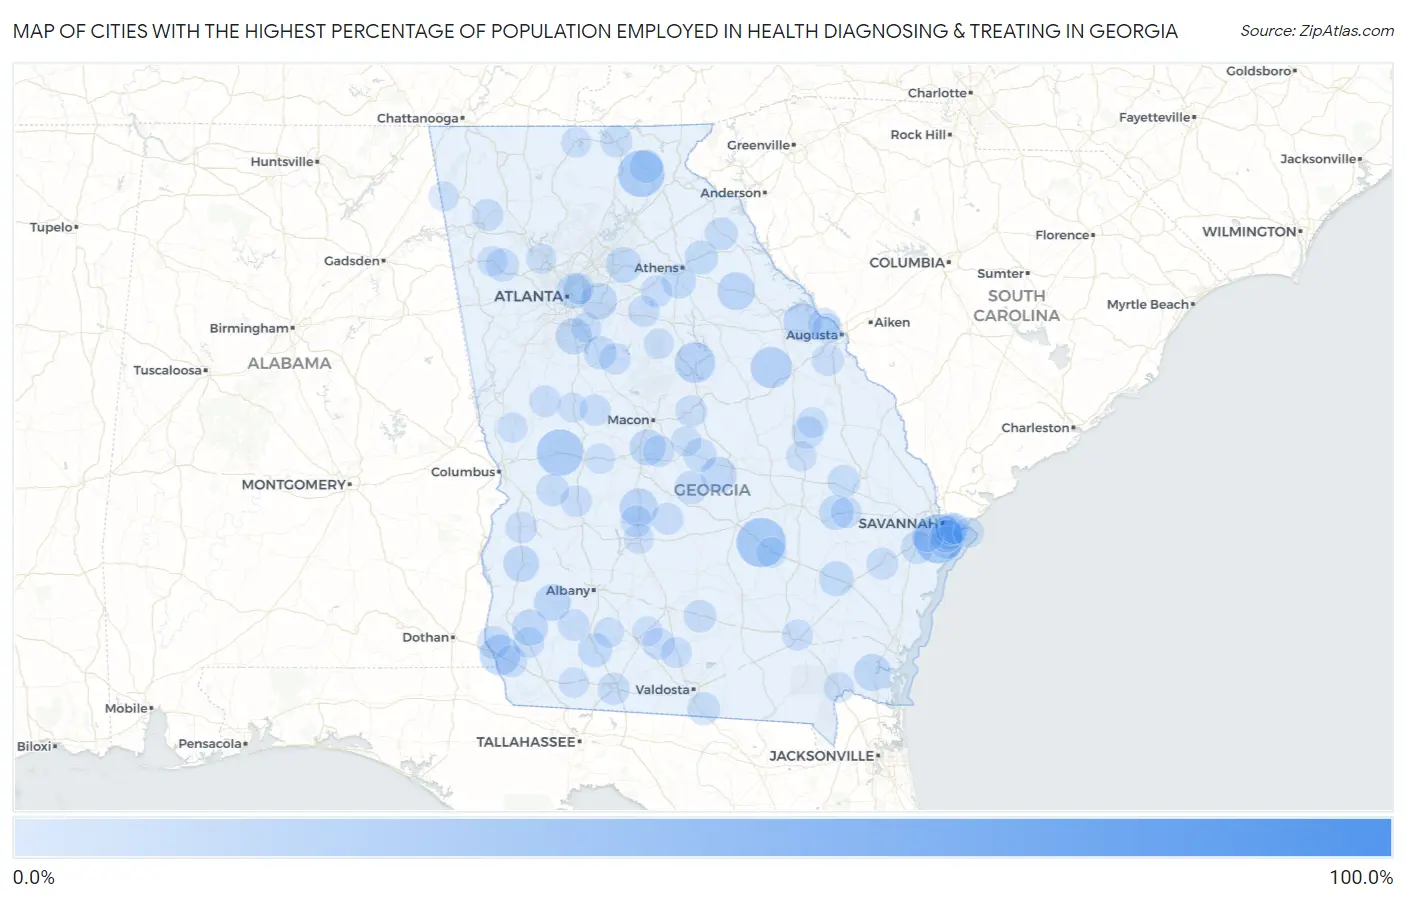
Map of Cities with the Highest Percentage of Population Employed in Health Diagnosing & Treating in Georgia
0.0%
100.0%
Cities with the Highest Percentage of Population Employed in Health Diagnosing & Treating in Georgia
| City | % Employed | vs State | vs National | |
| 1. | Hickox | 100.0% | 5.7%(+94.3)#1 | 6.2%(+93.8)#3 |
| 2. | Waynesville | 78.9% | 5.7%(+73.2)#2 | 6.2%(+72.6)#24 |
| 3. | Manor | 59.2% | 5.7%(+53.5)#3 | 6.2%(+52.9)#44 |
| 4. | Vernonburg | 31.9% | 5.7%(+26.2)#4 | 6.2%(+25.7)#269 |
| 5. | Lumber City | 31.8% | 5.7%(+26.1)#5 | 6.2%(+25.6)#273 |
| 6. | Yonah | 28.8% | 5.7%(+23.1)#6 | 6.2%(+22.6)#325 |
| 7. | Junction City | 28.6% | 5.7%(+22.9)#7 | 6.2%(+22.3)#330 |
| 8. | Gardi | 24.1% | 5.7%(+18.4)#8 | 6.2%(+17.9)#488 |
| 9. | Gibson | 22.1% | 5.7%(+16.4)#9 | 6.2%(+15.8)#599 |
| 10. | Crooked Creek | 21.5% | 5.7%(+15.8)#10 | 6.2%(+15.3)#630 |
| 11. | Jakin | 21.2% | 5.7%(+15.5)#11 | 6.2%(+15.0)#642 |
| 12. | Appling | 18.7% | 5.7%(+13.0)#12 | 6.2%(+12.5)#873 |
| 13. | Pinehurst | 18.6% | 5.7%(+12.9)#13 | 6.2%(+12.3)#890 |
| 14. | Rayle | 18.2% | 5.7%(+12.5)#14 | 6.2%(+11.9)#934 |
| 15. | Stockton | 17.2% | 5.7%(+11.5)#15 | 6.2%(+11.0)#1,050 |
| 16. | Woodbine | 17.1% | 5.7%(+11.4)#16 | 6.2%(+10.9)#1,071 |
| 17. | Leary | 16.9% | 5.7%(+11.2)#17 | 6.2%(+10.7)#1,103 |
| 18. | Lithonia | 16.7% | 5.7%(+11.0)#18 | 6.2%(+10.5)#1,139 |
| 19. | Bonanza | 16.4% | 5.7%(+10.7)#19 | 6.2%(+10.2)#1,195 |
| 20. | Dexter | 16.3% | 5.7%(+10.5)#20 | 6.2%(+10.0)#1,227 |
| 21. | Centerville | 16.2% | 5.7%(+10.5)#21 | 6.2%(+9.94)#1,244 |
| 22. | Cuthbert | 16.1% | 5.7%(+10.4)#22 | 6.2%(+9.87)#1,264 |
| 23. | Damascus | 16.1% | 5.7%(+10.4)#23 | 6.2%(+9.84)#1,270 |
| 24. | Dacula | 15.6% | 5.7%(+9.93)#24 | 6.2%(+9.39)#1,365 |
| 25. | Odum | 14.8% | 5.7%(+9.11)#25 | 6.2%(+8.57)#1,547 |
| 26. | Druid Hills | 14.7% | 5.7%(+9.03)#26 | 6.2%(+8.49)#1,565 |
| 27. | Manassas | 14.6% | 5.7%(+8.88)#27 | 6.2%(+8.34)#1,627 |
| 28. | Watkinsville | 14.4% | 5.7%(+8.66)#28 | 6.2%(+8.12)#1,686 |
| 29. | Rock Spring | 14.3% | 5.7%(+8.61)#29 | 6.2%(+8.08)#1,692 |
| 30. | Pelham | 14.1% | 5.7%(+8.41)#30 | 6.2%(+7.87)#1,772 |
| 31. | Dutch Island | 13.8% | 5.7%(+8.10)#31 | 6.2%(+7.56)#1,862 |
| 32. | Colbert | 13.5% | 5.7%(+7.79)#32 | 6.2%(+7.25)#1,984 |
| 33. | Fairfield Plantation | 13.4% | 5.7%(+7.70)#33 | 6.2%(+7.16)#2,025 |
| 34. | Sautee Nacoochee | 13.0% | 5.7%(+7.27)#34 | 6.2%(+6.73)#2,205 |
| 35. | Locust Grove | 12.9% | 5.7%(+7.24)#35 | 6.2%(+6.70)#2,219 |
| 36. | Allentown | 12.9% | 5.7%(+7.20)#36 | 6.2%(+6.66)#2,238 |
| 37. | Empire | 12.8% | 5.7%(+7.10)#37 | 6.2%(+6.56)#2,284 |
| 38. | Braswell | 12.8% | 5.7%(+7.10)#38 | 6.2%(+6.56)#2,285 |
| 39. | Richmond Hill | 12.7% | 5.7%(+6.98)#39 | 6.2%(+6.44)#2,341 |
| 40. | Lake Park | 12.6% | 5.7%(+6.94)#40 | 6.2%(+6.40)#2,357 |
| 41. | Skidaway Island | 12.6% | 5.7%(+6.84)#41 | 6.2%(+6.31)#2,400 |
| 42. | Cedar Springs | 12.5% | 5.7%(+6.79)#42 | 6.2%(+6.26)#2,450 |
| 43. | Bowman | 12.3% | 5.7%(+6.60)#43 | 6.2%(+6.06)#2,527 |
| 44. | Alapaha | 12.2% | 5.7%(+6.50)#44 | 6.2%(+5.96)#2,576 |
| 45. | Isle Of Hope | 12.1% | 5.7%(+6.37)#45 | 6.2%(+5.83)#2,646 |
| 46. | Whitemarsh Island | 12.0% | 5.7%(+6.31)#46 | 6.2%(+5.77)#2,665 |
| 47. | Pulaski | 12.0% | 5.7%(+6.25)#47 | 6.2%(+5.71)#2,698 |
| 48. | Buena Vista | 11.9% | 5.7%(+6.16)#48 | 6.2%(+5.62)#2,742 |
| 49. | Blairsville | 11.7% | 5.7%(+6.01)#49 | 6.2%(+5.47)#2,829 |
| 50. | Thomasville | 11.7% | 5.7%(+5.99)#50 | 6.2%(+5.45)#2,837 |
| 51. | Summertown | 11.6% | 5.7%(+5.89)#51 | 6.2%(+5.35)#2,913 |
| 52. | Shannon | 11.5% | 5.7%(+5.84)#52 | 6.2%(+5.30)#2,944 |
| 53. | Evans | 11.5% | 5.7%(+5.81)#53 | 6.2%(+5.27)#2,977 |
| 54. | Antioch | 11.4% | 5.7%(+5.71)#54 | 6.2%(+5.17)#3,047 |
| 55. | Pineview | 11.4% | 5.7%(+5.66)#55 | 6.2%(+5.12)#3,080 |
| 56. | Hephzibah | 11.3% | 5.7%(+5.60)#56 | 6.2%(+5.06)#3,116 |
| 57. | Ellenton | 11.2% | 5.7%(+5.49)#57 | 6.2%(+4.96)#3,188 |
| 58. | Good Hope | 11.2% | 5.7%(+5.47)#58 | 6.2%(+4.94)#3,202 |
| 59. | Robins Afb | 11.2% | 5.7%(+5.46)#59 | 6.2%(+4.93)#3,207 |
| 60. | Walthourville | 11.2% | 5.7%(+5.46)#60 | 6.2%(+4.92)#3,211 |
| 61. | Donalsonville | 11.2% | 5.7%(+5.45)#61 | 6.2%(+4.91)#3,221 |
| 62. | Lumpkin | 11.1% | 5.7%(+5.41)#62 | 6.2%(+4.87)#3,246 |
| 63. | Woodbury | 11.1% | 5.7%(+5.35)#63 | 6.2%(+4.81)#3,299 |
| 64. | Ivey | 11.0% | 5.7%(+5.34)#64 | 6.2%(+4.80)#3,302 |
| 65. | Newton | 11.0% | 5.7%(+5.28)#65 | 6.2%(+4.74)#3,335 |
| 66. | Georgetown | 10.9% | 5.7%(+5.17)#66 | 6.2%(+4.63)#3,403 |
| 67. | Jackson | 10.8% | 5.7%(+5.11)#67 | 6.2%(+4.58)#3,459 |
| 68. | Social Circle | 10.8% | 5.7%(+5.06)#68 | 6.2%(+4.52)#3,505 |
| 69. | Waverly | 10.7% | 5.7%(+5.04)#69 | 6.2%(+4.50)#3,527 |
| 70. | Vienna | 10.7% | 5.7%(+5.04)#70 | 6.2%(+4.50)#3,529 |
| 71. | Ellaville | 10.7% | 5.7%(+4.99)#71 | 6.2%(+4.45)#3,560 |
| 72. | Yatesville | 10.6% | 5.7%(+4.93)#72 | 6.2%(+4.39)#3,604 |
| 73. | Hagan | 10.4% | 5.7%(+4.66)#73 | 6.2%(+4.12)#3,851 |
| 74. | Colquitt | 10.3% | 5.7%(+4.63)#74 | 6.2%(+4.09)#3,874 |
| 75. | North Decatur | 10.3% | 5.7%(+4.62)#75 | 6.2%(+4.08)#3,885 |
| 76. | Deenwood | 10.3% | 5.7%(+4.60)#76 | 6.2%(+4.06)#3,912 |
| 77. | Adel | 10.2% | 5.7%(+4.50)#77 | 6.2%(+3.96)#4,004 |
| 78. | Bemiss | 9.9% | 5.7%(+4.21)#78 | 6.2%(+3.68)#4,288 |
| 79. | Midville | 9.9% | 5.7%(+4.18)#79 | 6.2%(+3.65)#4,326 |
| 80. | Rockmart | 9.8% | 5.7%(+4.12)#80 | 6.2%(+3.58)#4,401 |
| 81. | Martinez | 9.8% | 5.7%(+4.07)#81 | 6.2%(+3.53)#4,457 |
| 82. | Shady Dale | 9.8% | 5.7%(+4.07)#82 | 6.2%(+3.53)#4,458 |
| 83. | Swainsboro | 9.8% | 5.7%(+4.04)#83 | 6.2%(+3.51)#4,494 |
| 84. | Hazlehurst | 9.7% | 5.7%(+3.99)#84 | 6.2%(+3.45)#4,543 |
| 85. | Folkston | 9.7% | 5.7%(+3.98)#85 | 6.2%(+3.45)#4,546 |
| 86. | Talahi Island | 9.6% | 5.7%(+3.92)#86 | 6.2%(+3.38)#4,615 |
| 87. | Hamilton | 9.6% | 5.7%(+3.91)#87 | 6.2%(+3.37)#4,637 |
| 88. | Jeffersonville | 9.6% | 5.7%(+3.89)#88 | 6.2%(+3.35)#4,657 |
| 89. | Kennesaw | 9.6% | 5.7%(+3.89)#89 | 6.2%(+3.35)#4,658 |
| 90. | Blue Ridge | 9.6% | 5.7%(+3.88)#90 | 6.2%(+3.34)#4,662 |
| 91. | Tybee Island | 9.6% | 5.7%(+3.85)#91 | 6.2%(+3.31)#4,696 |
| 92. | Reynolds | 9.5% | 5.7%(+3.83)#92 | 6.2%(+3.29)#4,711 |
| 93. | Sale City | 9.5% | 5.7%(+3.79)#93 | 6.2%(+3.25)#4,774 |
| 94. | Cataula | 9.4% | 5.7%(+3.74)#94 | 6.2%(+3.20)#4,835 |
| 95. | Norman Park | 9.4% | 5.7%(+3.67)#95 | 6.2%(+3.13)#4,919 |
| 96. | Whigham | 9.4% | 5.7%(+3.66)#96 | 6.2%(+3.12)#4,939 |
| 97. | Menlo | 9.3% | 5.7%(+3.57)#97 | 6.2%(+3.03)#5,062 |
| 98. | Cordele | 9.3% | 5.7%(+3.55)#98 | 6.2%(+3.01)#5,078 |
| 99. | Stockbridge | 9.2% | 5.7%(+3.45)#99 | 6.2%(+2.92)#5,181 |
| 100. | Hannahs Mill | 9.1% | 5.7%(+3.43)#100 | 6.2%(+2.89)#5,215 |
Common Questions
What are the Top 10 Cities with the Highest Percentage of Population Employed in Health Diagnosing & Treating in Georgia?
Top 10 Cities with the Highest Percentage of Population Employed in Health Diagnosing & Treating in Georgia are:
#1
31.9%
#2
31.8%
#3
28.8%
#4
28.6%
#5
22.1%
#6
21.5%
#7
21.2%
#8
18.7%
#9
18.6%
#10
18.2%
What city has the Highest Percentage of Population Employed in Health Diagnosing & Treating in Georgia?
Vernonburg has the Highest Percentage of Population Employed in Health Diagnosing & Treating in Georgia with 31.9%.
What is the Percentage of Population Employed in Health Diagnosing & Treating in the State of Georgia?
Percentage of Population Employed in Health Diagnosing & Treating in Georgia is 5.7%.
What is the Percentage of Population Employed in Health Diagnosing & Treating in the United States?
Percentage of Population Employed in Health Diagnosing & Treating in the United States is 6.2%.