Westwood, CA Map & Demographics
Westwood Map
Westwood Overview
$19,472
PER CAPITA INCOME
$53,000
AVG FAMILY INCOME
$34,960
AVG HOUSEHOLD INCOME
0.39
INEQUALITY / GINI INDEX
1,116
TOTAL POPULATION
660
MALE POPULATION
456
FEMALE POPULATION
144.74
MALES / 100 FEMALES
69.09
FEMALES / 100 MALES
47.8
MEDIAN AGE
2.6
AVG FAMILY SIZE
2.3
AVG HOUSEHOLD SIZE
337
LABOR FORCE [ PEOPLE ]
35.1%
PERCENT IN LABOR FORCE
18.7%
UNEMPLOYMENT RATE
Westwood Zip Codes
Westwood Area Codes
Income in Westwood
Income Overview in Westwood
Per Capita Income in Westwood is $19,472, while median incomes of families and households are $53,000 and $34,960 respectively.
| Characteristic | Number | Measure |
| Per Capita Income | 1,116 | $19,472 |
| Median Family Income | 324 | $53,000 |
| Mean Family Income | 324 | $50,606 |
| Median Household Income | 483 | $34,960 |
| Mean Household Income | 483 | $46,504 |
| Income Deficit | 324 | $0 |
| Wage / Income Gap (%) | 1,116 | 0.00% |
| Wage / Income Gap ($) | 1,116 | 100.00¢ per $1 |
| Gini / Inequality Index | 1,116 | 0.39 |
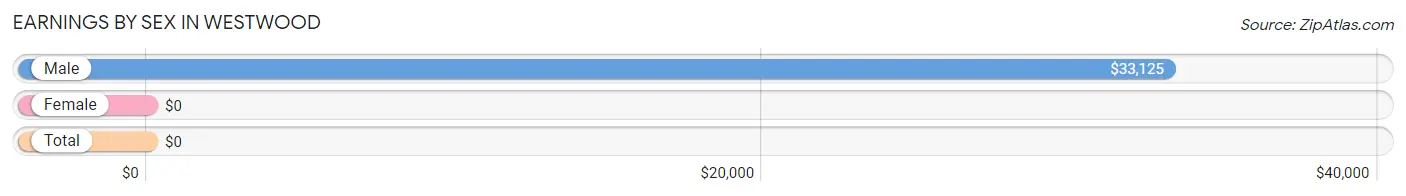
Earnings by Sex in Westwood
| Sex | Number | Average Earnings |
| Male | 141 (47.8%) | $33,125 |
| Female | 154 (52.2%) | $0 |
| Total | 295 (100.0%) | $0 |
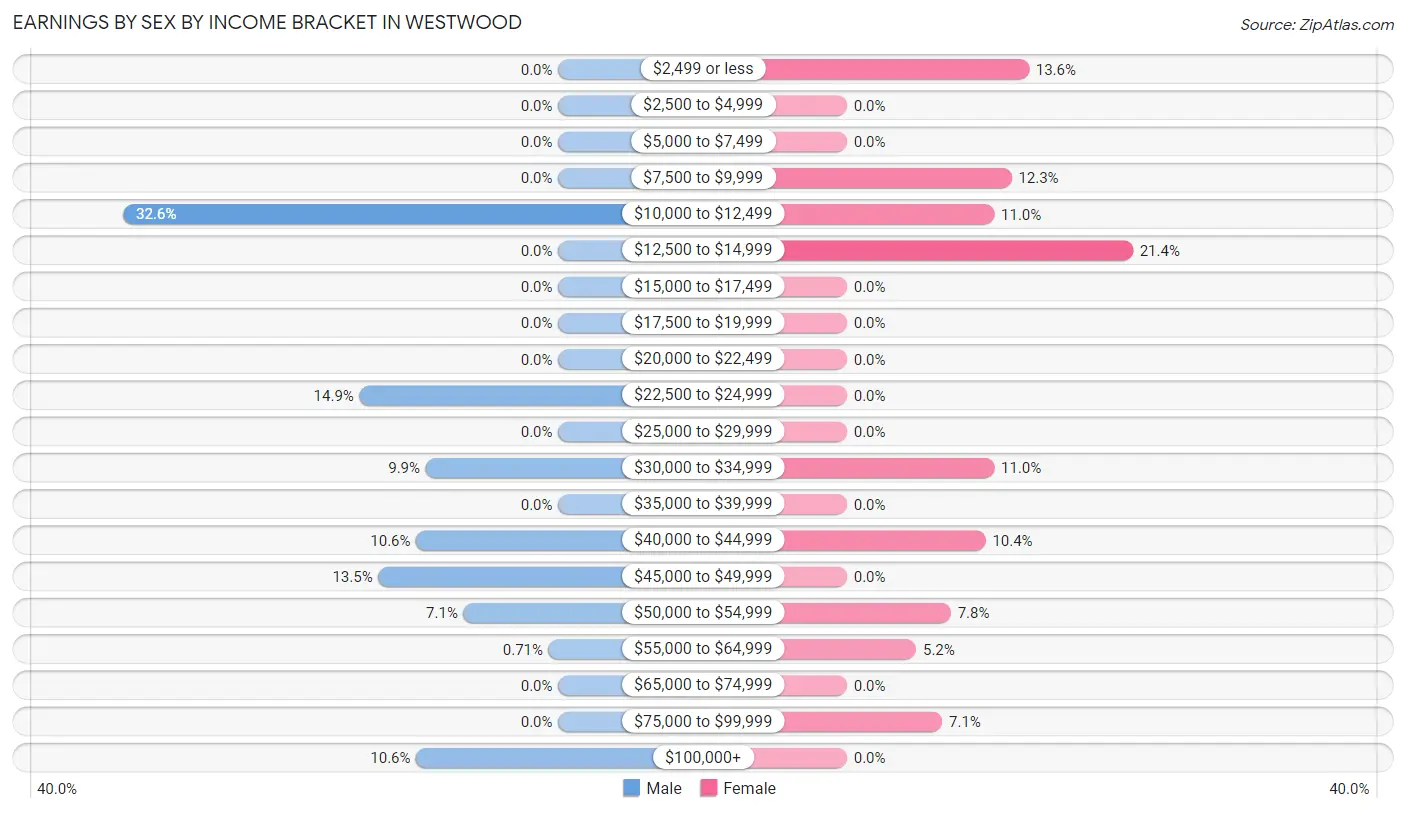
Earnings by Sex by Income Bracket in Westwood
The most common earnings brackets in Westwood are $10,000 to $12,499 for men (46 | 32.6%) and $12,500 to $14,999 for women (33 | 21.4%).
| Income | Male | Female |
| $2,499 or less | 0 (0.0%) | 21 (13.6%) |
| $2,500 to $4,999 | 0 (0.0%) | 0 (0.0%) |
| $5,000 to $7,499 | 0 (0.0%) | 0 (0.0%) |
| $7,500 to $9,999 | 0 (0.0%) | 19 (12.3%) |
| $10,000 to $12,499 | 46 (32.6%) | 17 (11.0%) |
| $12,500 to $14,999 | 0 (0.0%) | 33 (21.4%) |
| $15,000 to $17,499 | 0 (0.0%) | 0 (0.0%) |
| $17,500 to $19,999 | 0 (0.0%) | 0 (0.0%) |
| $20,000 to $22,499 | 0 (0.0%) | 0 (0.0%) |
| $22,500 to $24,999 | 21 (14.9%) | 0 (0.0%) |
| $25,000 to $29,999 | 0 (0.0%) | 0 (0.0%) |
| $30,000 to $34,999 | 14 (9.9%) | 17 (11.0%) |
| $35,000 to $39,999 | 0 (0.0%) | 0 (0.0%) |
| $40,000 to $44,999 | 15 (10.6%) | 16 (10.4%) |
| $45,000 to $49,999 | 19 (13.5%) | 0 (0.0%) |
| $50,000 to $54,999 | 10 (7.1%) | 12 (7.8%) |
| $55,000 to $64,999 | 1 (0.7%) | 8 (5.2%) |
| $65,000 to $74,999 | 0 (0.0%) | 0 (0.0%) |
| $75,000 to $99,999 | 0 (0.0%) | 11 (7.1%) |
| $100,000+ | 15 (10.6%) | 0 (0.0%) |
| Total | 141 (100.0%) | 154 (100.0%) |
Earnings by Sex by Educational Attainment in Westwood
| Educational Attainment | Male Income | Female Income |
| Less than High School | - | - |
| High School Diploma | - | - |
| College or Associate's Degree | - | - |
| Bachelor's Degree | - | - |
| Graduate Degree | - | - |
| Total | - | - |
Family Income in Westwood
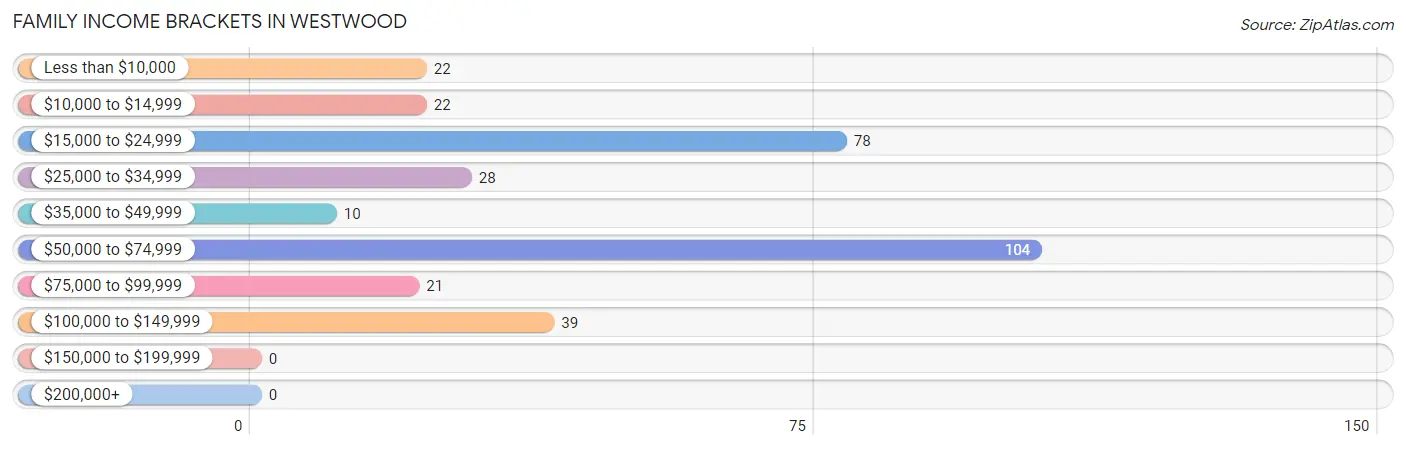
Family Income Brackets in Westwood
According to the Westwood family income data, there are 104 families falling into the $50,000 to $74,999 income range, which is the most common income bracket and makes up 32.1% of all families.
| Income Bracket | # Families | % Families |
| Less than $10,000 | 22 | 6.8% |
| $10,000 to $14,999 | 22 | 6.8% |
| $15,000 to $24,999 | 78 | 24.1% |
| $25,000 to $34,999 | 28 | 8.6% |
| $35,000 to $49,999 | 10 | 3.1% |
| $50,000 to $74,999 | 104 | 32.1% |
| $75,000 to $99,999 | 21 | 6.5% |
| $100,000 to $149,999 | 39 | 12.0% |
| $150,000 to $199,999 | 0 | 0.0% |
| $200,000+ | 0 | 0.0% |
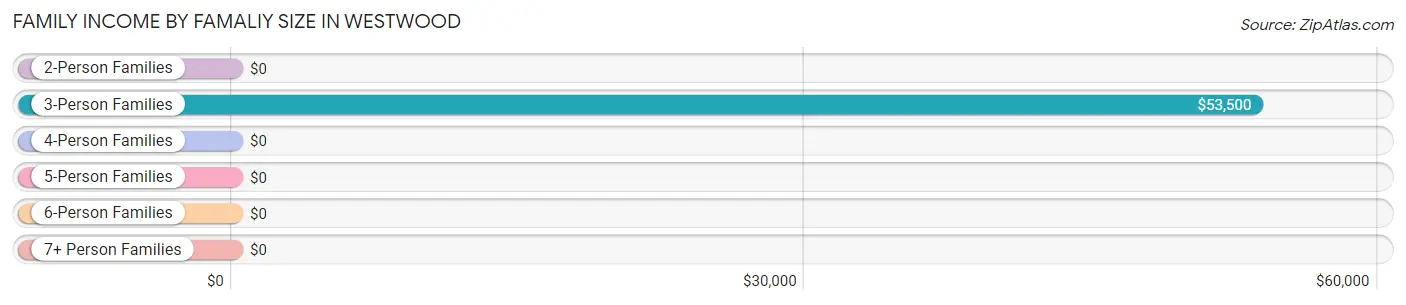
Family Income by Famaliy Size in Westwood
3-person families (36 | 11.1%) account for the highest median family income in Westwood with $53,500 per family, while 3-person families (36 | 11.1%) have the highest median income of $17,833 per family member.
| Income Bracket | # Families | Median Income |
| 2-Person Families | 269 (83.0%) | $0 |
| 3-Person Families | 36 (11.1%) | $53,500 |
| 4-Person Families | 19 (5.9%) | $0 |
| 5-Person Families | 0 (0.0%) | $0 |
| 6-Person Families | 0 (0.0%) | $0 |
| 7+ Person Families | 0 (0.0%) | $0 |
| Total | 324 (100.0%) | $53,000 |
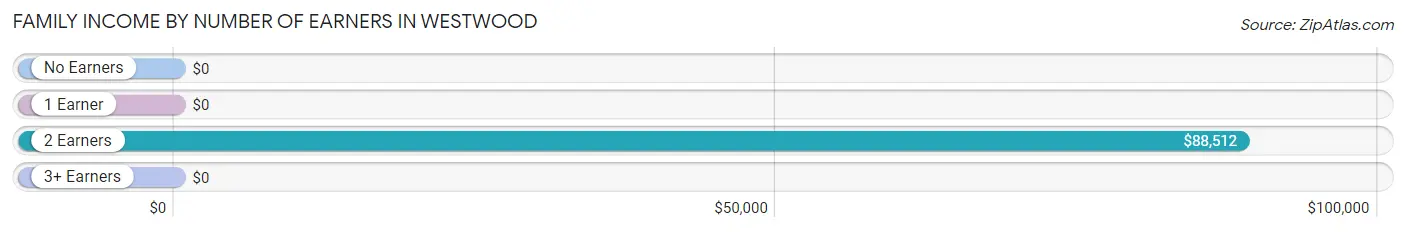
Family Income by Number of Earners in Westwood
| Number of Earners | # Families | Median Income |
| No Earners | 128 (39.5%) | $0 |
| 1 Earner | 141 (43.5%) | $0 |
| 2 Earners | 55 (17.0%) | $88,512 |
| 3+ Earners | 0 (0.0%) | $0 |
| Total | 324 (100.0%) | $53,000 |
Household Income in Westwood
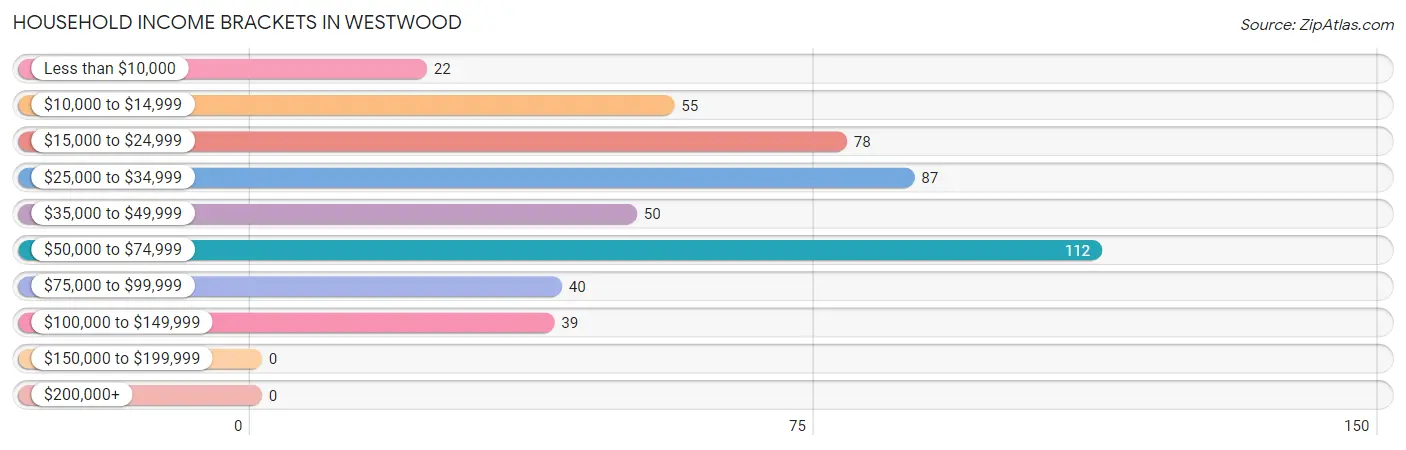
Household Income Brackets in Westwood
With 112 households falling in the category, the $50,000 to $74,999 income range is the most frequent in Westwood, accounting for 23.2% of all households.
| Income Bracket | # Households | % Households |
| Less than $10,000 | 22 | 4.6% |
| $10,000 to $14,999 | 55 | 11.4% |
| $15,000 to $24,999 | 78 | 16.1% |
| $25,000 to $34,999 | 87 | 18.0% |
| $35,000 to $49,999 | 50 | 10.4% |
| $50,000 to $74,999 | 112 | 23.2% |
| $75,000 to $99,999 | 40 | 8.3% |
| $100,000 to $149,999 | 39 | 8.1% |
| $150,000 to $199,999 | 0 | 0.0% |
| $200,000+ | 0 | 0.0% |
Household Income by Householder Age in Westwood
The median household income in Westwood is $34,960, with the highest median household income of $47,303 found in the 65+ years age bracket for the primary householder. A total of 223 households (46.2%) fall into this category. Meanwhile, the 15 to 24 years age bracket for the primary householder has the lowest median household income of $0, with 14 households (2.9%) in this group.
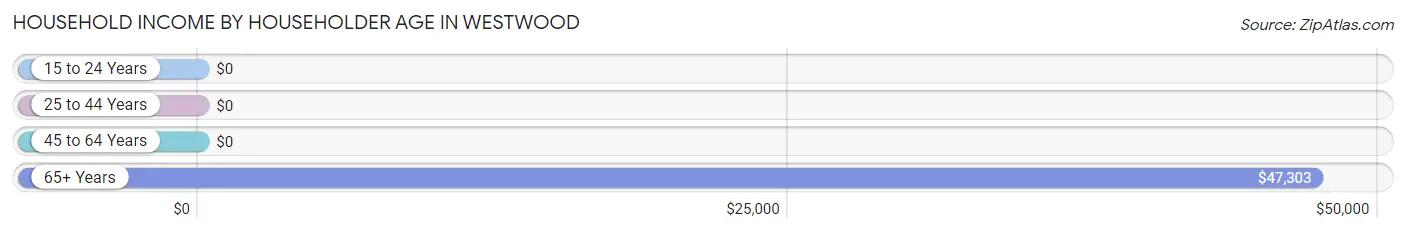
| Income Bracket | # Households | Median Income |
| 15 to 24 Years | 14 (2.9%) | $0 |
| 25 to 44 Years | 80 (16.6%) | $0 |
| 45 to 64 Years | 166 (34.4%) | $0 |
| 65+ Years | 223 (46.2%) | $47,303 |
| Total | 483 (100.0%) | $34,960 |
Poverty in Westwood
Income Below Poverty by Sex and Age in Westwood
With 42.4% poverty level for males and 22.6% for females among the residents of Westwood, 18 to 24 year old males and 12 to 14 year old females are the most vulnerable to poverty, with 61 males (81.3%) and 41 females (100.0%) in their respective age groups living below the poverty level.
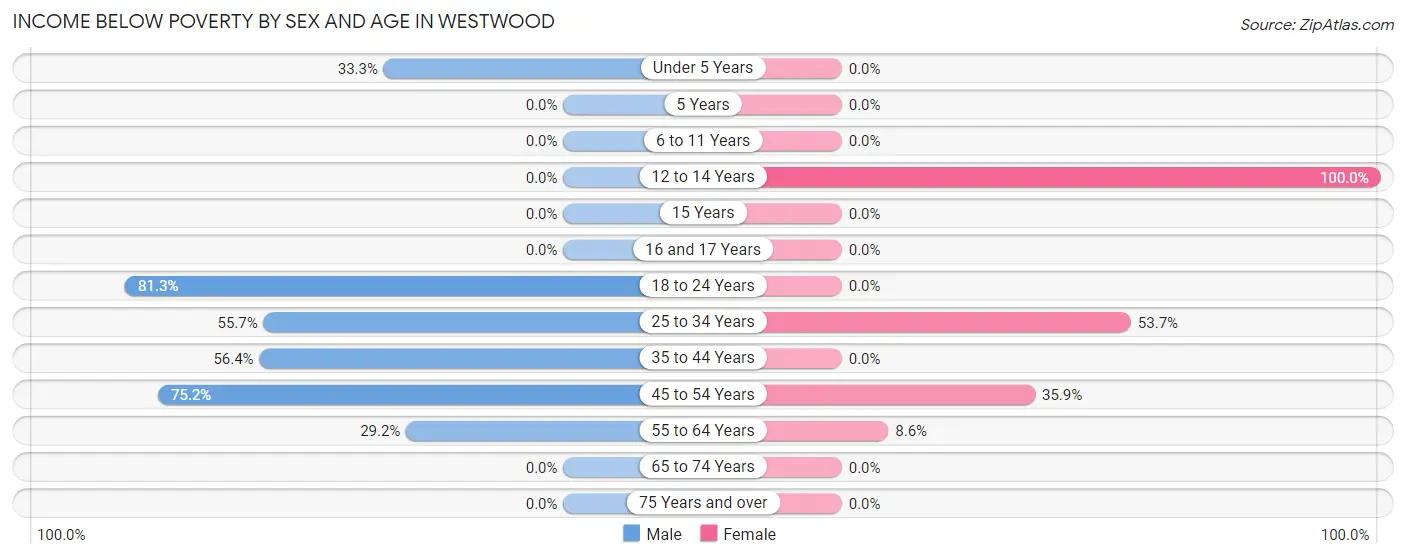
| Age Bracket | Male | Female |
| Under 5 Years | 33 (33.3%) | 0 (0.0%) |
| 5 Years | 0 (0.0%) | 0 (0.0%) |
| 6 to 11 Years | 0 (0.0%) | 0 (0.0%) |
| 12 to 14 Years | 0 (0.0%) | 41 (100.0%) |
| 15 Years | 0 (0.0%) | 0 (0.0%) |
| 16 and 17 Years | 0 (0.0%) | 0 (0.0%) |
| 18 to 24 Years | 61 (81.3%) | 0 (0.0%) |
| 25 to 34 Years | 64 (55.6%) | 22 (53.7%) |
| 35 to 44 Years | 22 (56.4%) | 0 (0.0%) |
| 45 to 54 Years | 79 (75.2%) | 33 (35.9%) |
| 55 to 64 Years | 21 (29.2%) | 7 (8.6%) |
| 65 to 74 Years | 0 (0.0%) | 0 (0.0%) |
| 75 Years and over | 0 (0.0%) | 0 (0.0%) |
| Total | 280 (42.4%) | 103 (22.6%) |
Income Above Poverty by Sex and Age in Westwood
According to the poverty statistics in Westwood, males aged 16 and 17 years and females aged under 5 years are the age groups that are most secure financially, with 100.0% of males and 100.0% of females in these age groups living above the poverty line.
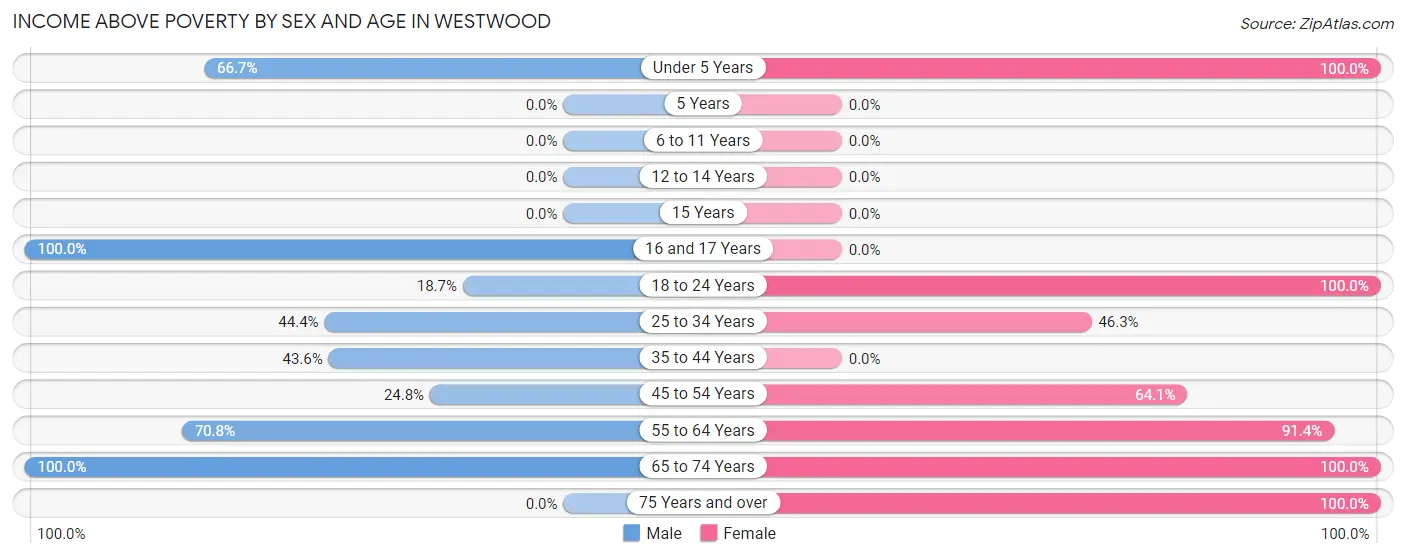
| Age Bracket | Male | Female |
| Under 5 Years | 66 (66.7%) | 16 (100.0%) |
| 5 Years | 0 (0.0%) | 0 (0.0%) |
| 6 to 11 Years | 0 (0.0%) | 0 (0.0%) |
| 12 to 14 Years | 0 (0.0%) | 0 (0.0%) |
| 15 Years | 0 (0.0%) | 0 (0.0%) |
| 16 and 17 Years | 13 (100.0%) | 0 (0.0%) |
| 18 to 24 Years | 14 (18.7%) | 44 (100.0%) |
| 25 to 34 Years | 51 (44.4%) | 19 (46.3%) |
| 35 to 44 Years | 17 (43.6%) | 0 (0.0%) |
| 45 to 54 Years | 26 (24.8%) | 59 (64.1%) |
| 55 to 64 Years | 51 (70.8%) | 74 (91.4%) |
| 65 to 74 Years | 142 (100.0%) | 99 (100.0%) |
| 75 Years and over | 0 (0.0%) | 42 (100.0%) |
| Total | 380 (57.6%) | 353 (77.4%) |
Income Below Poverty Among Married-Couple Families in Westwood
The poverty statistics for married-couple families in Westwood show that 3.3% or 7 of the total 214 families live below the poverty line. Families with no children have the highest poverty rate of 4.1%, comprising of 7 families. On the other hand, families with 1 or 2 children have the lowest poverty rate of 0.0%, which includes 0 families.
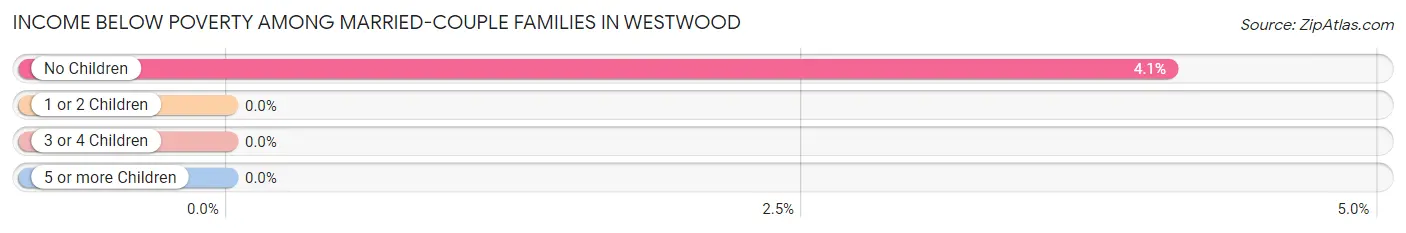
| Children | Above Poverty | Below Poverty |
| No Children | 164 (95.9%) | 7 (4.1%) |
| 1 or 2 Children | 43 (100.0%) | 0 (0.0%) |
| 3 or 4 Children | 0 (0.0%) | 0 (0.0%) |
| 5 or more Children | 0 (0.0%) | 0 (0.0%) |
| Total | 207 (96.7%) | 7 (3.3%) |
Income Below Poverty Among Single-Parent Households in Westwood
According to the poverty data in Westwood, 100.0% or 22 single-father households and 62.5% or 55 single-mother households are living below the poverty line. Among single-father households, those with 1 or 2 children have the highest poverty rate, with 22 households (100.0%) experiencing poverty. Likewise, among single-mother households, those with 1 or 2 children have the highest poverty rate, with 22 households (100.0%) falling below the poverty line.
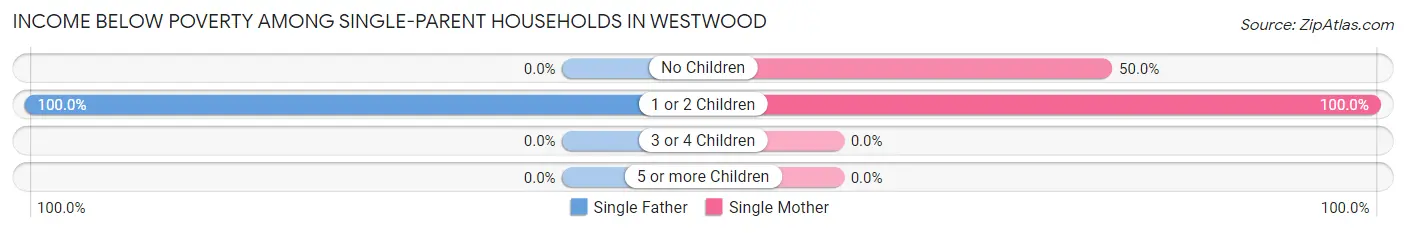
| Children | Single Father | Single Mother |
| No Children | 0 (0.0%) | 33 (50.0%) |
| 1 or 2 Children | 22 (100.0%) | 22 (100.0%) |
| 3 or 4 Children | 0 (0.0%) | 0 (0.0%) |
| 5 or more Children | 0 (0.0%) | 0 (0.0%) |
| Total | 22 (100.0%) | 55 (62.5%) |
Income Below Poverty Among Married-Couple vs Single-Parent Households in Westwood
The poverty data for Westwood shows that 7 of the married-couple family households (3.3%) and 77 of the single-parent households (70.0%) are living below the poverty level. Within the married-couple family households, those with no children have the highest poverty rate, with 7 households (4.1%) falling below the poverty line. Among the single-parent households, those with 1 or 2 children have the highest poverty rate, with 44 household (100.0%) living below poverty.
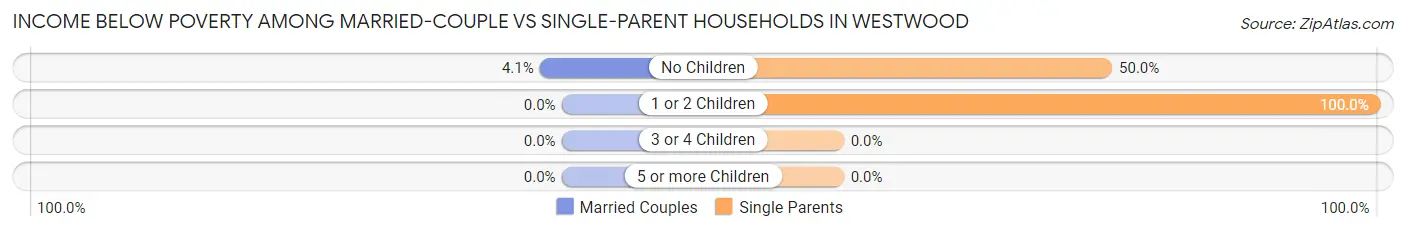
| Children | Married-Couple Families | Single-Parent Households |
| No Children | 7 (4.1%) | 33 (50.0%) |
| 1 or 2 Children | 0 (0.0%) | 44 (100.0%) |
| 3 or 4 Children | 0 (0.0%) | 0 (0.0%) |
| 5 or more Children | 0 (0.0%) | 0 (0.0%) |
| Total | 7 (3.3%) | 77 (70.0%) |
Race in Westwood
The most populous races in Westwood are White / Caucasian (1,004 | 90.0%), Two or more Races (99 | 8.9%), and Native / Alaskan (13 | 1.2%).
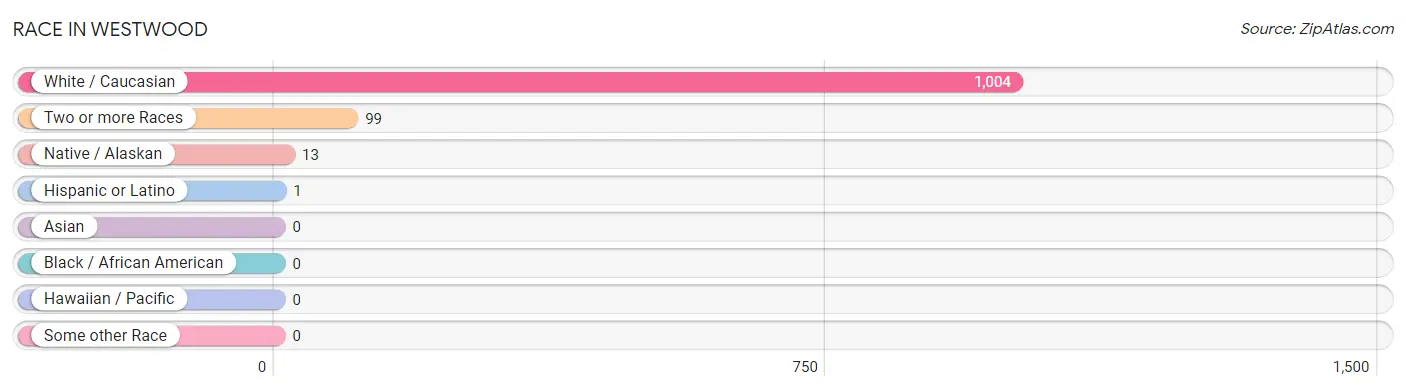
| Race | # Population | % Population |
| Asian | 0 | 0.0% |
| Black / African American | 0 | 0.0% |
| Hawaiian / Pacific | 0 | 0.0% |
| Hispanic or Latino | 1 | 0.1% |
| Native / Alaskan | 13 | 1.2% |
| White / Caucasian | 1,004 | 90.0% |
| Two or more Races | 99 | 8.9% |
| Some other Race | 0 | 0.0% |
| Total | 1,116 | 100.0% |
Ancestry in Westwood
The most populous ancestries reported in Westwood are German (147 | 13.2%), Irish (126 | 11.3%), English (89 | 8.0%), Scottish (65 | 5.8%), and Cherokee (63 | 5.7%), together accounting for 43.9% of all Westwood residents.
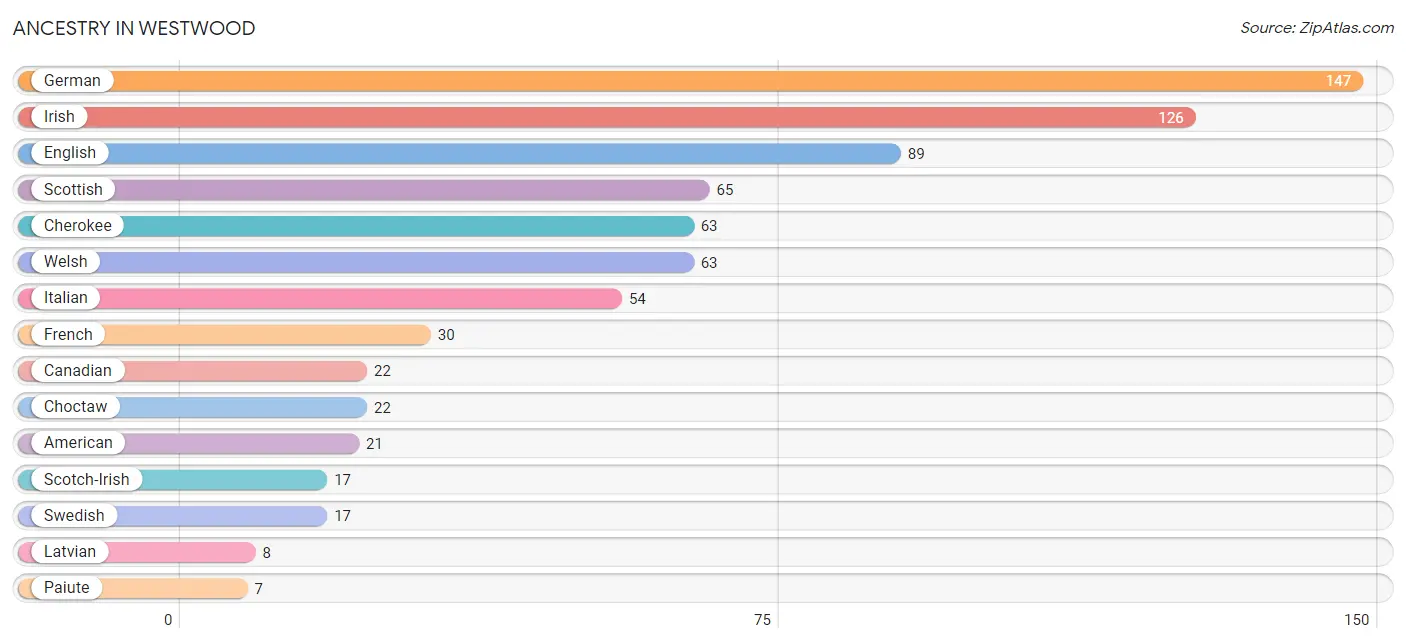
| Ancestry | # Population | % Population |
| American | 21 | 1.9% |
| Canadian | 22 | 2.0% |
| Cherokee | 63 | 5.7% |
| Choctaw | 22 | 2.0% |
| English | 89 | 8.0% |
| French | 30 | 2.7% |
| German | 147 | 13.2% |
| Irish | 126 | 11.3% |
| Italian | 54 | 4.8% |
| Latvian | 8 | 0.7% |
| Mexican | 1 | 0.1% |
| Paiute | 7 | 0.6% |
| Scotch-Irish | 17 | 1.5% |
| Scottish | 65 | 5.8% |
| Swedish | 17 | 1.5% |
| Welsh | 63 | 5.7% | View All 16 Rows |
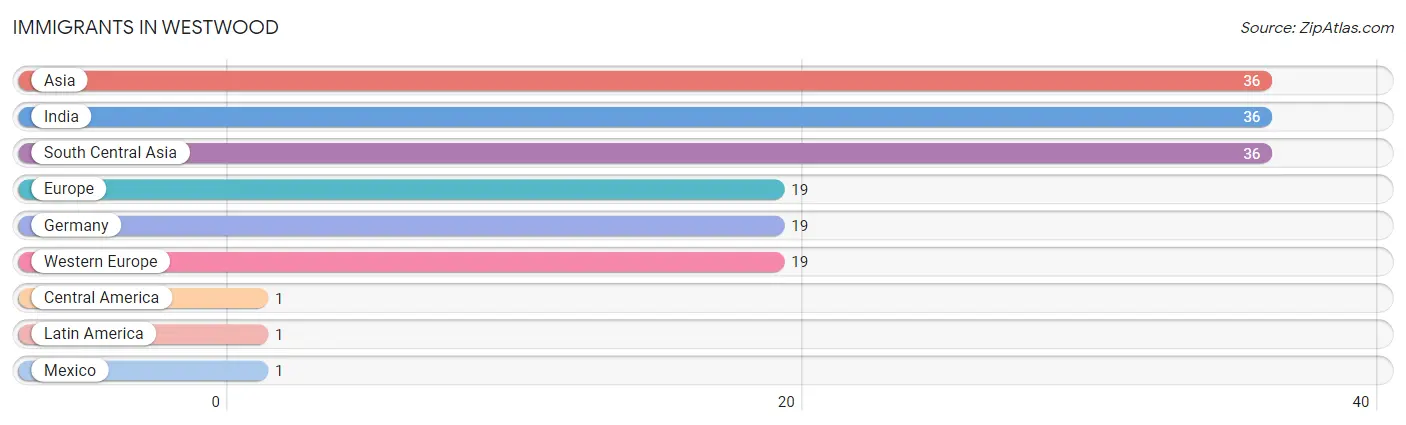
Immigrants in Westwood
The most numerous immigrant groups reported in Westwood came from Asia (36 | 3.2%), India (36 | 3.2%), South Central Asia (36 | 3.2%), Europe (19 | 1.7%), and Germany (19 | 1.7%), together accounting for 13.1% of all Westwood residents.
| Immigration Origin | # Population | % Population |
| Asia | 36 | 3.2% |
| Central America | 1 | 0.1% |
| Europe | 19 | 1.7% |
| Germany | 19 | 1.7% |
| India | 36 | 3.2% |
| Latin America | 1 | 0.1% |
| Mexico | 1 | 0.1% |
| South Central Asia | 36 | 3.2% |
| Western Europe | 19 | 1.7% | View All 9 Rows |
Sex and Age in Westwood
Sex and Age in Westwood
The most populous age groups in Westwood are 30 to 34 Years (115 | 17.4%) for men and 65 to 69 Years (64 | 14.0%) for women.
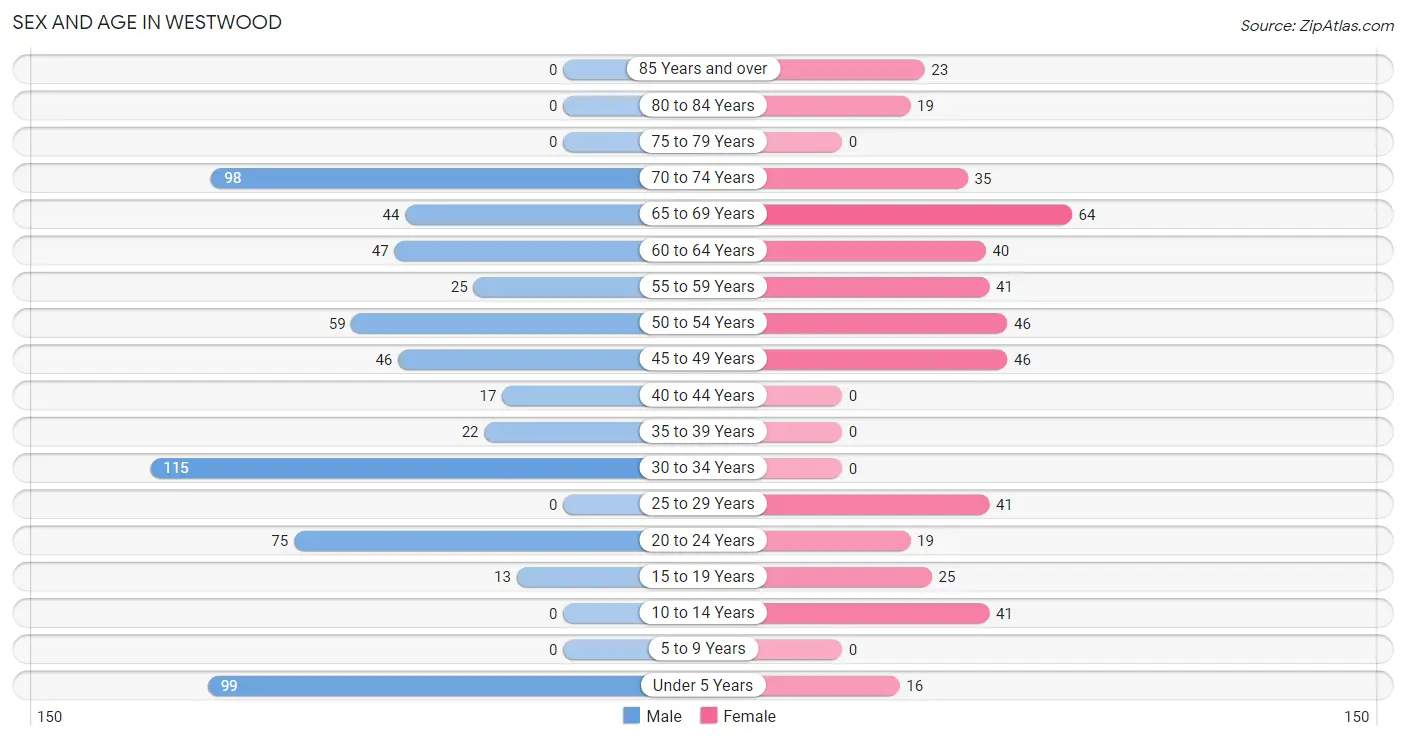
| Age Bracket | Male | Female |
| Under 5 Years | 99 (15.0%) | 16 (3.5%) |
| 5 to 9 Years | 0 (0.0%) | 0 (0.0%) |
| 10 to 14 Years | 0 (0.0%) | 41 (9.0%) |
| 15 to 19 Years | 13 (2.0%) | 25 (5.5%) |
| 20 to 24 Years | 75 (11.4%) | 19 (4.2%) |
| 25 to 29 Years | 0 (0.0%) | 41 (9.0%) |
| 30 to 34 Years | 115 (17.4%) | 0 (0.0%) |
| 35 to 39 Years | 22 (3.3%) | 0 (0.0%) |
| 40 to 44 Years | 17 (2.6%) | 0 (0.0%) |
| 45 to 49 Years | 46 (7.0%) | 46 (10.1%) |
| 50 to 54 Years | 59 (8.9%) | 46 (10.1%) |
| 55 to 59 Years | 25 (3.8%) | 41 (9.0%) |
| 60 to 64 Years | 47 (7.1%) | 40 (8.8%) |
| 65 to 69 Years | 44 (6.7%) | 64 (14.0%) |
| 70 to 74 Years | 98 (14.8%) | 35 (7.7%) |
| 75 to 79 Years | 0 (0.0%) | 0 (0.0%) |
| 80 to 84 Years | 0 (0.0%) | 19 (4.2%) |
| 85 Years and over | 0 (0.0%) | 23 (5.0%) |
| Total | 660 (100.0%) | 456 (100.0%) |
Families and Households in Westwood
Median Family Size in Westwood
The median family size in Westwood is 2.61 persons per family, with single female/mother families (88 | 27.2%) accounting for the largest median family size of 3.15 persons per family. On the other hand, married-couple families (214 | 66.0%) represent the smallest median family size with 2.36 persons per family.
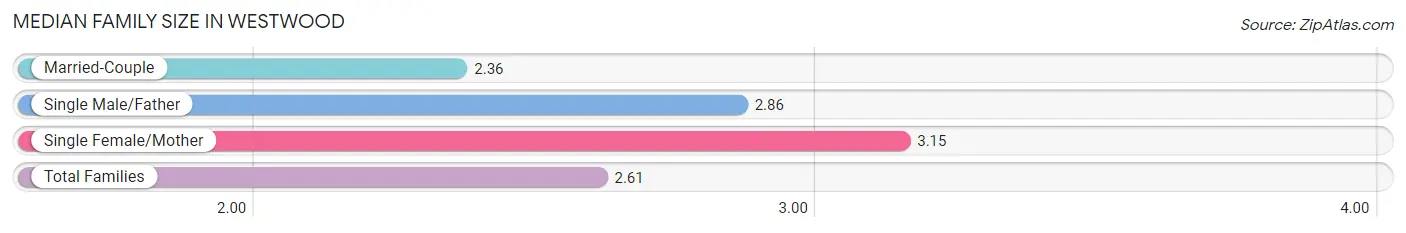
| Family Type | # Families | Family Size |
| Married-Couple | 214 (66.0%) | 2.36 |
| Single Male/Father | 22 (6.8%) | 2.86 |
| Single Female/Mother | 88 (27.2%) | 3.15 |
| Total Families | 324 (100.0%) | 2.61 |
Median Household Size in Westwood
The median household size in Westwood is 2.31 persons per household, with single female/mother households (88 | 18.2%) accounting for the largest median household size of 3.84 persons per household. non-family households (159 | 32.9%) represent the smallest median household size with 1.03 persons per household.
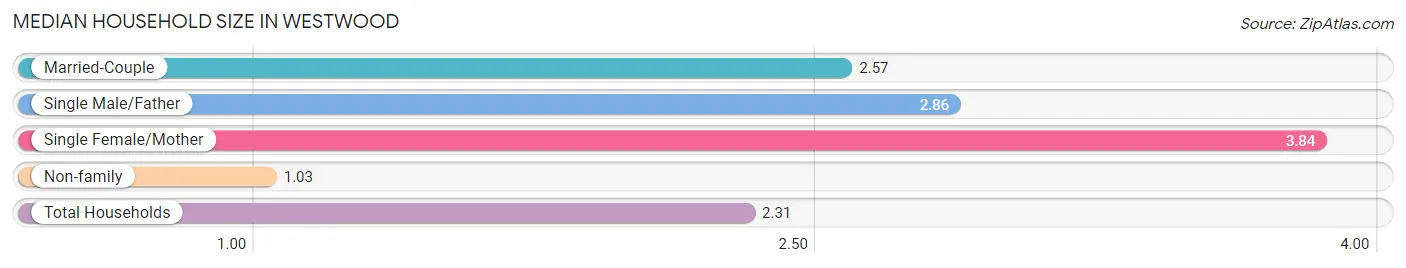
| Household Type | # Households | Household Size |
| Married-Couple | 214 (44.3%) | 2.57 |
| Single Male/Father | 22 (4.5%) | 2.86 |
| Single Female/Mother | 88 (18.2%) | 3.84 |
| Non-family | 159 (32.9%) | 1.03 |
| Total Households | 483 (100.0%) | 2.31 |
Household Size by Marriage Status in Westwood
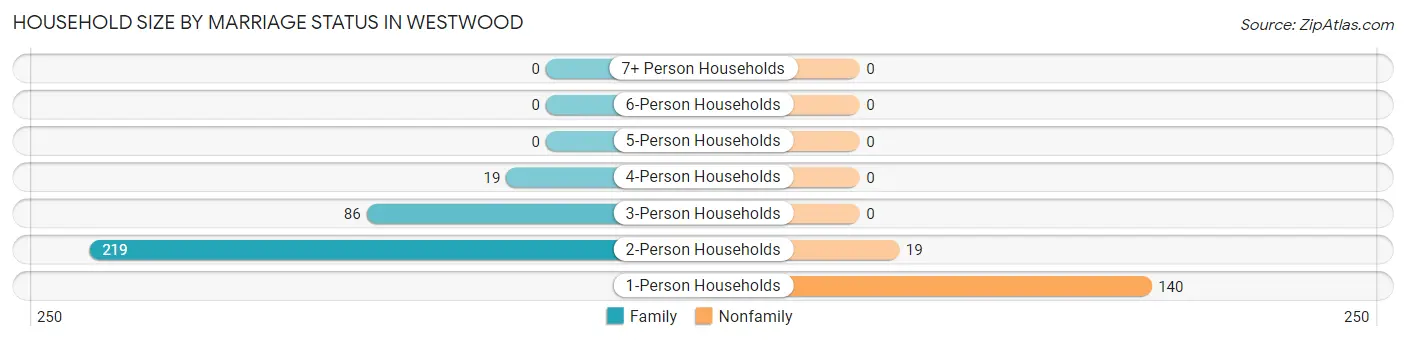
Out of a total of 483 households in Westwood, 324 (67.1%) are family households, while 159 (32.9%) are nonfamily households. The most numerous type of family households are 2-person households, comprising 219, and the most common type of nonfamily households are 1-person households, comprising 140.
| Household Size | Family Households | Nonfamily Households |
| 1-Person Households | - | 140 (29.0%) |
| 2-Person Households | 219 (45.3%) | 19 (3.9%) |
| 3-Person Households | 86 (17.8%) | 0 (0.0%) |
| 4-Person Households | 19 (3.9%) | 0 (0.0%) |
| 5-Person Households | 0 (0.0%) | 0 (0.0%) |
| 6-Person Households | 0 (0.0%) | 0 (0.0%) |
| 7+ Person Households | 0 (0.0%) | 0 (0.0%) |
| Total | 324 (67.1%) | 159 (32.9%) |
Female Fertility in Westwood
Fertility by Age in Westwood
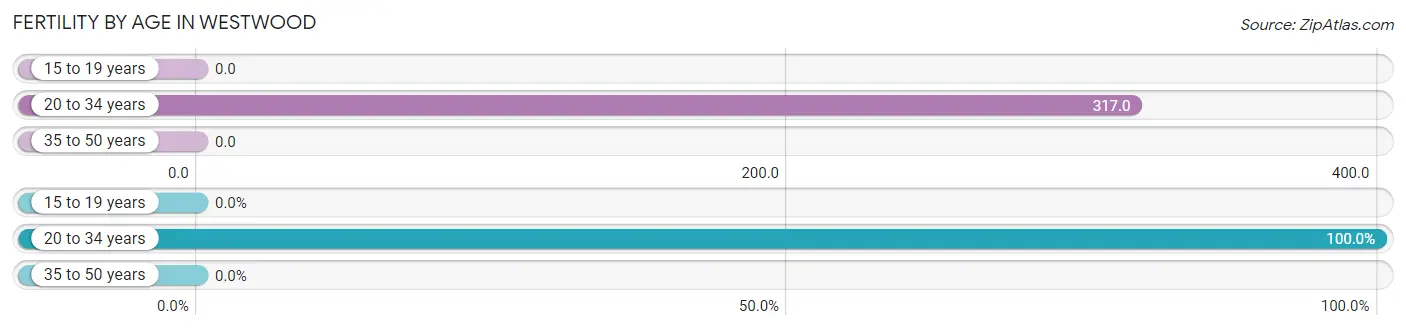
Average fertility rate in Westwood is 145.0 births per 1,000 women. Women in the age bracket of 20 to 34 years have the highest fertility rate with 317.0 births per 1,000 women. Women in the age bracket of 20 to 34 years acount for 100.0% of all women with births.
| Age Bracket | Women with Births | Births / 1,000 Women |
| 15 to 19 years | 0 (0.0%) | 0.0 |
| 20 to 34 years | 19 (100.0%) | 317.0 |
| 35 to 50 years | 0 (0.0%) | 0.0 |
| Total | 19 (100.0%) | 145.0 |
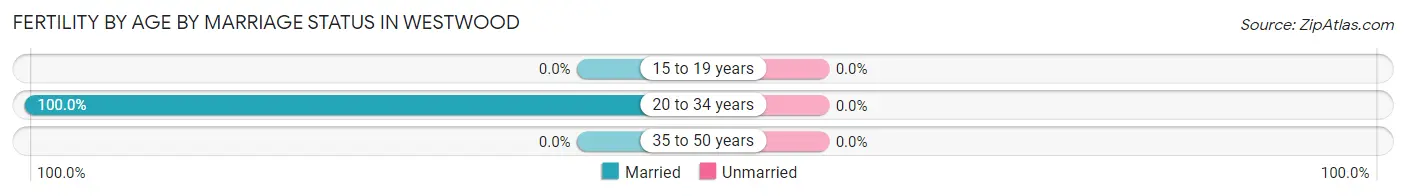
Fertility by Age by Marriage Status in Westwood
| Age Bracket | Married | Unmarried |
| 15 to 19 years | 0 (0.0%) | 0 (0.0%) |
| 20 to 34 years | 19 (100.0%) | 0 (0.0%) |
| 35 to 50 years | 0 (0.0%) | 0 (0.0%) |
| Total | 19 (100.0%) | 0 (0.0%) |
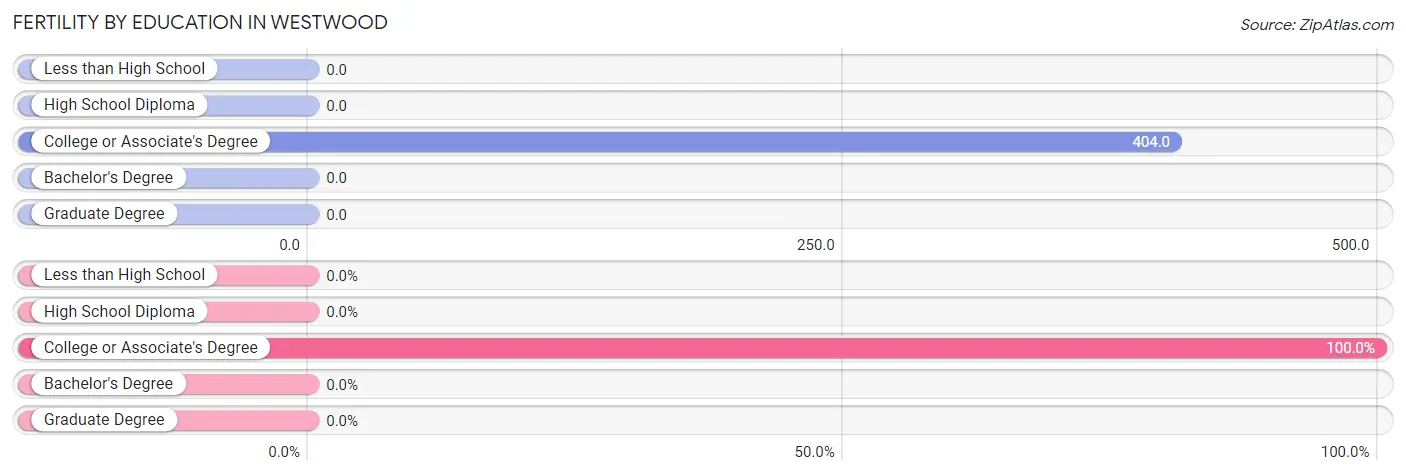
Fertility by Education in Westwood
| Educational Attainment | Women with Births | Births / 1,000 Women |
| Less than High School | 0 (0.0%) | 0.0 |
| High School Diploma | 0 (0.0%) | 0.0 |
| College or Associate's Degree | 19 (100.0%) | 404.0 |
| Bachelor's Degree | 0 (0.0%) | 0.0 |
| Graduate Degree | 0 (0.0%) | 0.0 |
| Total | 19 (100.0%) | 145.0 |
Fertility by Education by Marriage Status in Westwood
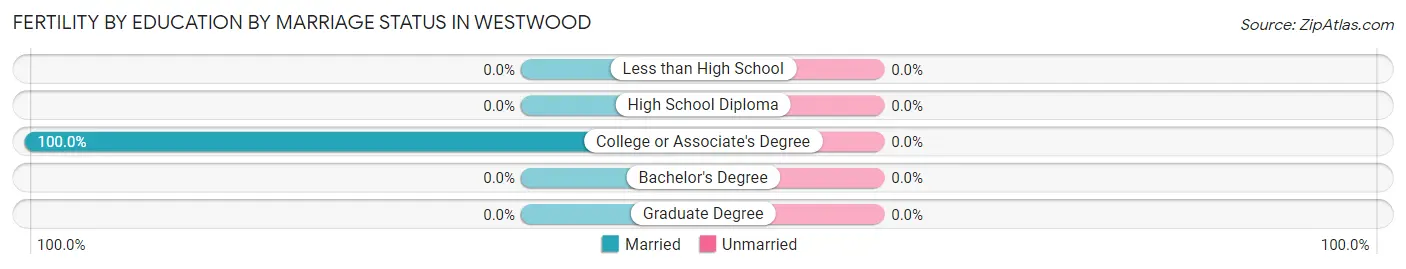
| Educational Attainment | Married | Unmarried |
| Less than High School | 0 (0.0%) | 0 (0.0%) |
| High School Diploma | 0 (0.0%) | 0 (0.0%) |
| College or Associate's Degree | 19 (100.0%) | 0 (0.0%) |
| Bachelor's Degree | 0 (0.0%) | 0 (0.0%) |
| Graduate Degree | 0 (0.0%) | 0 (0.0%) |
| Total | 19 (100.0%) | 0 (0.0%) |
Employment Characteristics in Westwood
Employment by Class of Employer in Westwood
Among the 228 employed individuals in Westwood, state government employees (84 | 36.8%), private company employees (62 | 27.2%), and self-employed (not incorporated) (40 | 17.5%) make up the most common classes of employment.
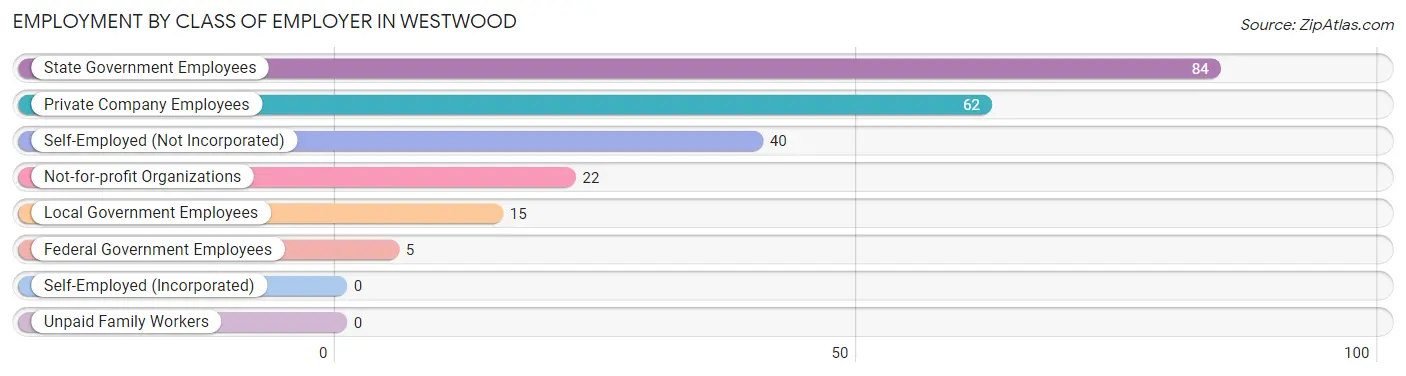
| Employer Class | # Employees | % Employees |
| Private Company Employees | 62 | 27.2% |
| Self-Employed (Incorporated) | 0 | 0.0% |
| Self-Employed (Not Incorporated) | 40 | 17.5% |
| Not-for-profit Organizations | 22 | 9.7% |
| Local Government Employees | 15 | 6.6% |
| State Government Employees | 84 | 36.8% |
| Federal Government Employees | 5 | 2.2% |
| Unpaid Family Workers | 0 | 0.0% |
| Total | 228 | 100.0% |
Employment Status by Age in Westwood
According to the labor force statistics for Westwood, out of the total population over 16 years of age (960), 35.1% or 337 individuals are in the labor force, with 18.7% or 63 of them unemployed. The age group with the highest labor force participation rate is 25 to 29 years, with 100.0% or 41 individuals in the labor force. Within the labor force, the 35 to 44 years age range has the highest percentage of unemployed individuals, with 100.0% or 22 of them being unemployed.
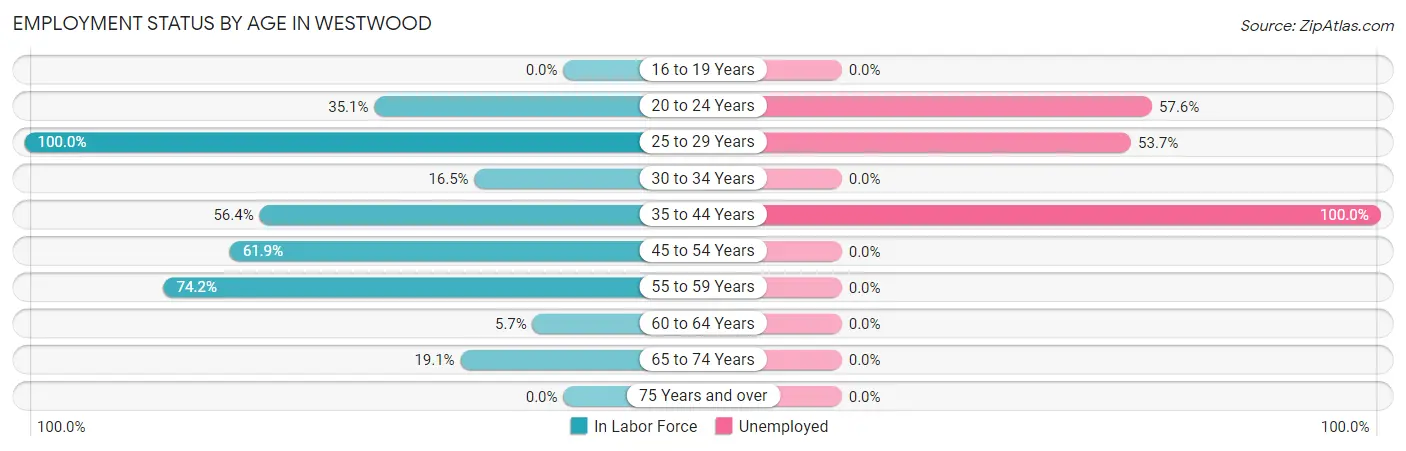
| Age Bracket | In Labor Force | Unemployed |
| 16 to 19 Years | 0 (0.0%) | 0 (0.0%) |
| 20 to 24 Years | 33 (35.1%) | 19 (57.6%) |
| 25 to 29 Years | 41 (100.0%) | 22 (53.7%) |
| 30 to 34 Years | 19 (16.5%) | 0 (0.0%) |
| 35 to 44 Years | 22 (56.4%) | 22 (100.0%) |
| 45 to 54 Years | 122 (61.9%) | 0 (0.0%) |
| 55 to 59 Years | 49 (74.2%) | 0 (0.0%) |
| 60 to 64 Years | 5 (5.7%) | 0 (0.0%) |
| 65 to 74 Years | 46 (19.1%) | 0 (0.0%) |
| 75 Years and over | 0 (0.0%) | 0 (0.0%) |
| Total | 337 (35.1%) | 63 (18.7%) |
Employment Status by Educational Attainment in Westwood
According to labor force statistics for Westwood, 47.3% of individuals (258) out of the total population between 25 and 64 years of age (545) are in the labor force, with 17.1% or 44 of them being unemployed. The group with the highest labor force participation rate are those with the educational attainment of bachelor's degree or higher, with 71.1% or 32 individuals in the labor force. Within the labor force, individuals with bachelor's degree or higher education have the highest percentage of unemployment, with 68.8% or 22 of them being unemployed.
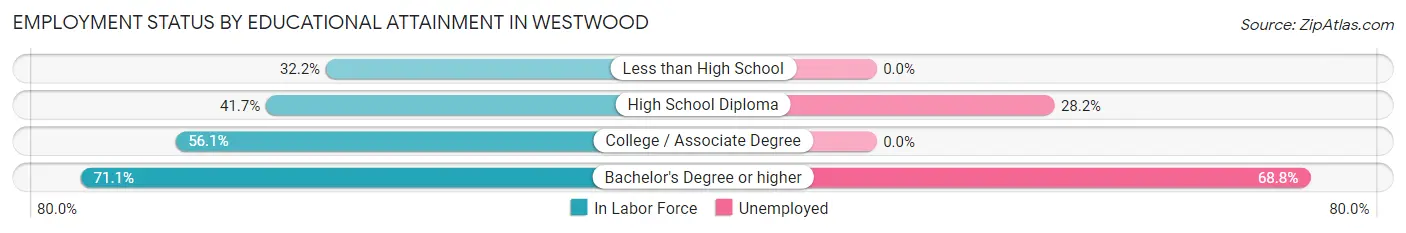
| Educational Attainment | In Labor Force | Unemployed |
| Less than High School | 37 (32.2%) | 0 (0.0%) |
| High School Diploma | 78 (41.7%) | 53 (28.2%) |
| College / Associate Degree | 111 (56.1%) | 0 (0.0%) |
| Bachelor's Degree or higher | 32 (71.1%) | 31 (68.8%) |
| Total | 258 (47.3%) | 93 (17.1%) |
Employment Occupations by Sex in Westwood
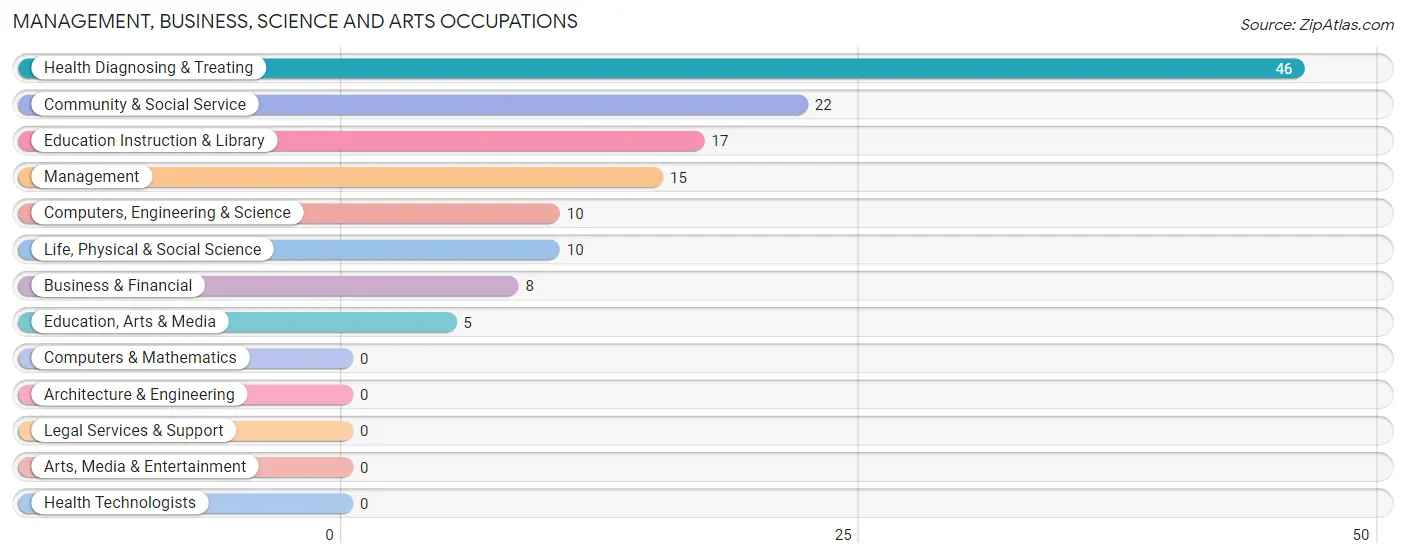
Management, Business, Science and Arts Occupations
The most common Management, Business, Science and Arts occupations in Westwood are Health Diagnosing & Treating (46 | 16.8%), Community & Social Service (22 | 8.0%), Education Instruction & Library (17 | 6.2%), Management (15 | 5.5%), and Computers, Engineering & Science (10 | 3.6%).
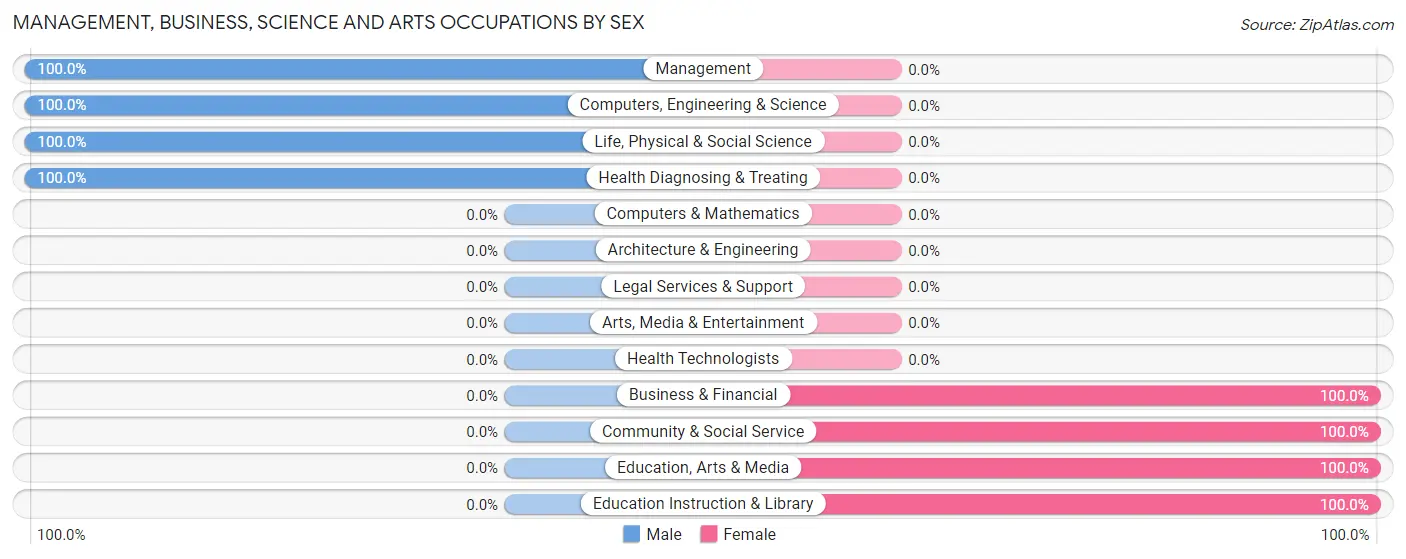
Management, Business, Science and Arts Occupations by Sex
Within the Management, Business, Science and Arts occupations in Westwood, the most male-oriented occupations are Management (100.0%), Computers, Engineering & Science (100.0%), and Life, Physical & Social Science (100.0%), while the most female-oriented occupations are Business & Financial (100.0%), Community & Social Service (100.0%), and Education, Arts & Media (100.0%).
| Occupation | Male | Female |
| Management | 15 (100.0%) | 0 (0.0%) |
| Business & Financial | 0 (0.0%) | 8 (100.0%) |
| Computers, Engineering & Science | 10 (100.0%) | 0 (0.0%) |
| Computers & Mathematics | 0 (0.0%) | 0 (0.0%) |
| Architecture & Engineering | 0 (0.0%) | 0 (0.0%) |
| Life, Physical & Social Science | 10 (100.0%) | 0 (0.0%) |
| Community & Social Service | 0 (0.0%) | 22 (100.0%) |
| Education, Arts & Media | 0 (0.0%) | 5 (100.0%) |
| Legal Services & Support | 0 (0.0%) | 0 (0.0%) |
| Education Instruction & Library | 0 (0.0%) | 17 (100.0%) |
| Arts, Media & Entertainment | 0 (0.0%) | 0 (0.0%) |
| Health Diagnosing & Treating | 46 (100.0%) | 0 (0.0%) |
| Health Technologists | 0 (0.0%) | 0 (0.0%) |
| Total (Category) | 71 (70.3%) | 30 (29.7%) |
| Total (Overall) | 141 (51.5%) | 133 (48.5%) |
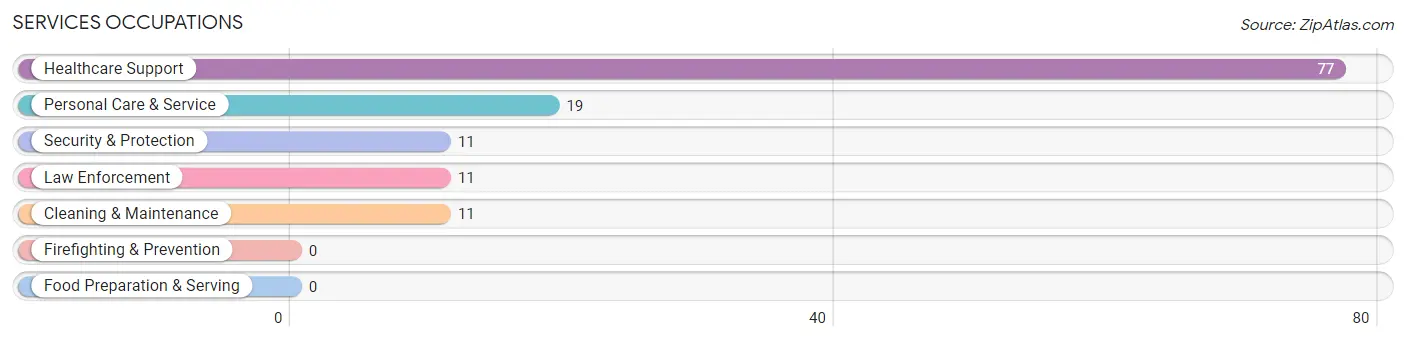
Services Occupations
The most common Services occupations in Westwood are Healthcare Support (77 | 28.1%), Personal Care & Service (19 | 6.9%), Security & Protection (11 | 4.0%), Law Enforcement (11 | 4.0%), and Cleaning & Maintenance (11 | 4.0%).
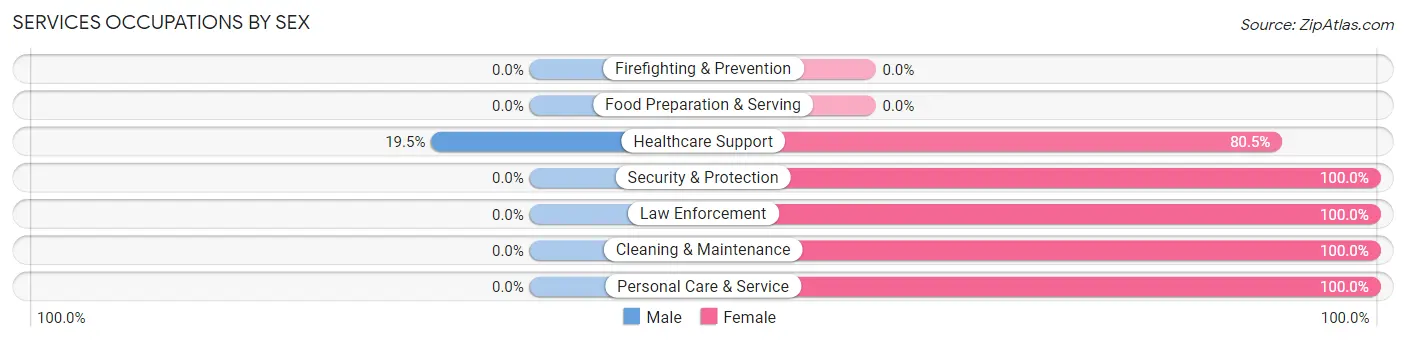
Services Occupations by Sex
| Occupation | Male | Female |
| Healthcare Support | 15 (19.5%) | 62 (80.5%) |
| Security & Protection | 0 (0.0%) | 11 (100.0%) |
| Firefighting & Prevention | 0 (0.0%) | 0 (0.0%) |
| Law Enforcement | 0 (0.0%) | 11 (100.0%) |
| Food Preparation & Serving | 0 (0.0%) | 0 (0.0%) |
| Cleaning & Maintenance | 0 (0.0%) | 11 (100.0%) |
| Personal Care & Service | 0 (0.0%) | 19 (100.0%) |
| Total (Category) | 15 (12.7%) | 103 (87.3%) |
| Total (Overall) | 141 (51.5%) | 133 (48.5%) |
Sales and Office Occupations
The most common Sales and Office occupations in Westwood are , and Sales & Related (21 | 7.7%).
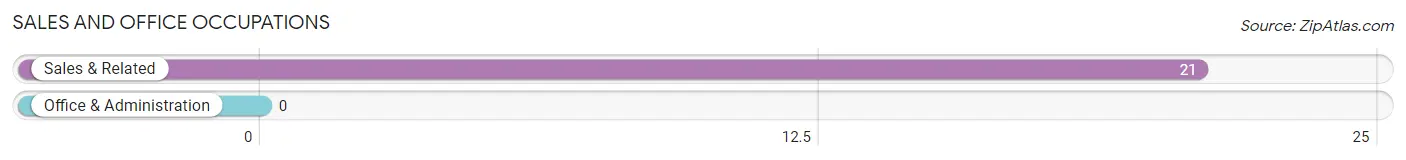
Sales and Office Occupations by Sex

| Occupation | Male | Female |
| Sales & Related | 21 (100.0%) | 0 (0.0%) |
| Office & Administration | 0 (0.0%) | 0 (0.0%) |
| Total (Category) | 21 (100.0%) | 0 (0.0%) |
| Total (Overall) | 141 (51.5%) | 133 (48.5%) |
Natural Resources, Construction and Maintenance Occupations
The most common Natural Resources, Construction and Maintenance occupations in Westwood are , and Installation, Maintenance & Repair (1 | 0.4%).
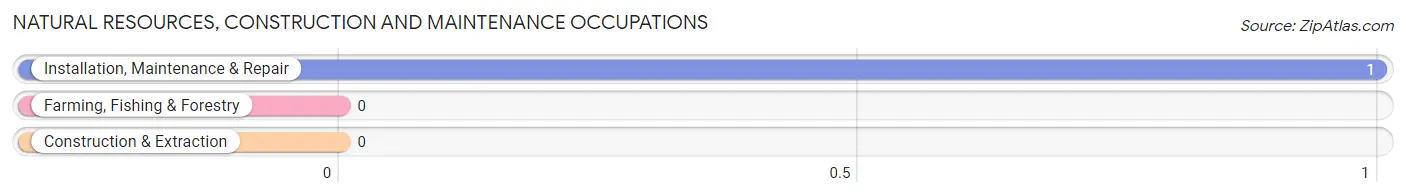
Natural Resources, Construction and Maintenance Occupations by Sex
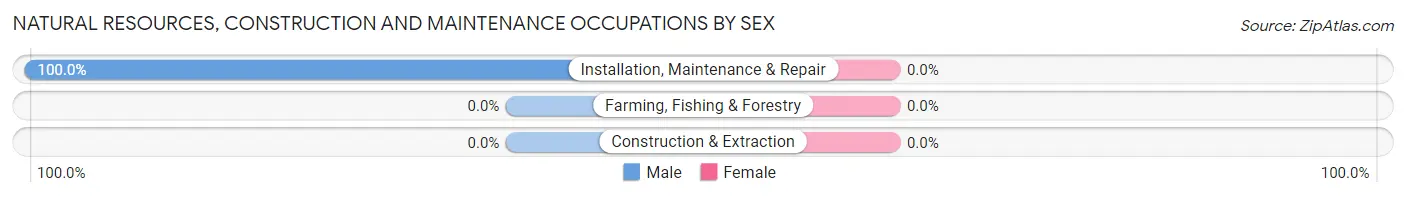
| Occupation | Male | Female |
| Farming, Fishing & Forestry | 0 (0.0%) | 0 (0.0%) |
| Construction & Extraction | 0 (0.0%) | 0 (0.0%) |
| Installation, Maintenance & Repair | 1 (100.0%) | 0 (0.0%) |
| Total (Category) | 1 (100.0%) | 0 (0.0%) |
| Total (Overall) | 141 (51.5%) | 133 (48.5%) |
Production, Transportation and Moving Occupations
The most common Production, Transportation and Moving occupations in Westwood are Production (19 | 6.9%), and Transportation (14 | 5.1%).
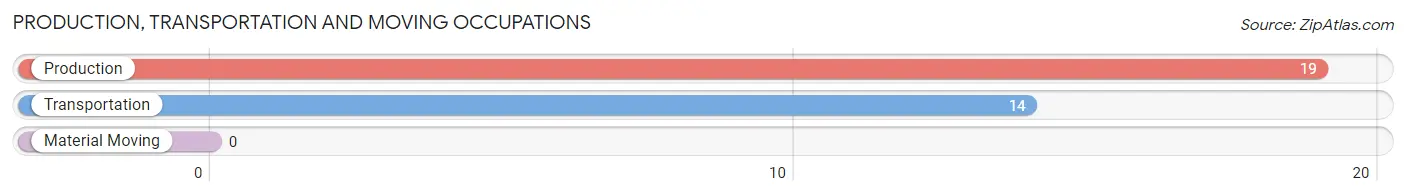
Production, Transportation and Moving Occupations by Sex
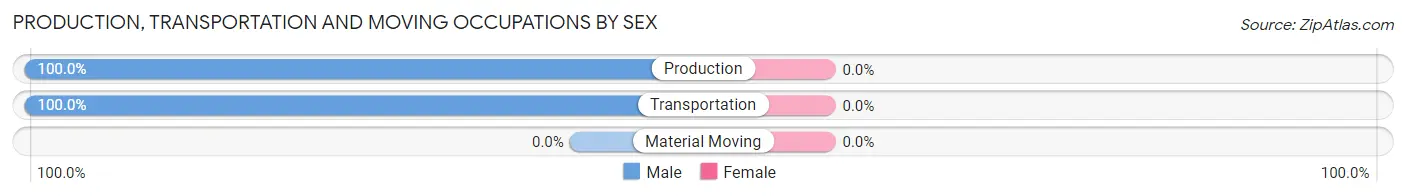
| Occupation | Male | Female |
| Production | 19 (100.0%) | 0 (0.0%) |
| Transportation | 14 (100.0%) | 0 (0.0%) |
| Material Moving | 0 (0.0%) | 0 (0.0%) |
| Total (Category) | 33 (100.0%) | 0 (0.0%) |
| Total (Overall) | 141 (51.5%) | 133 (48.5%) |
Employment Industries by Sex in Westwood
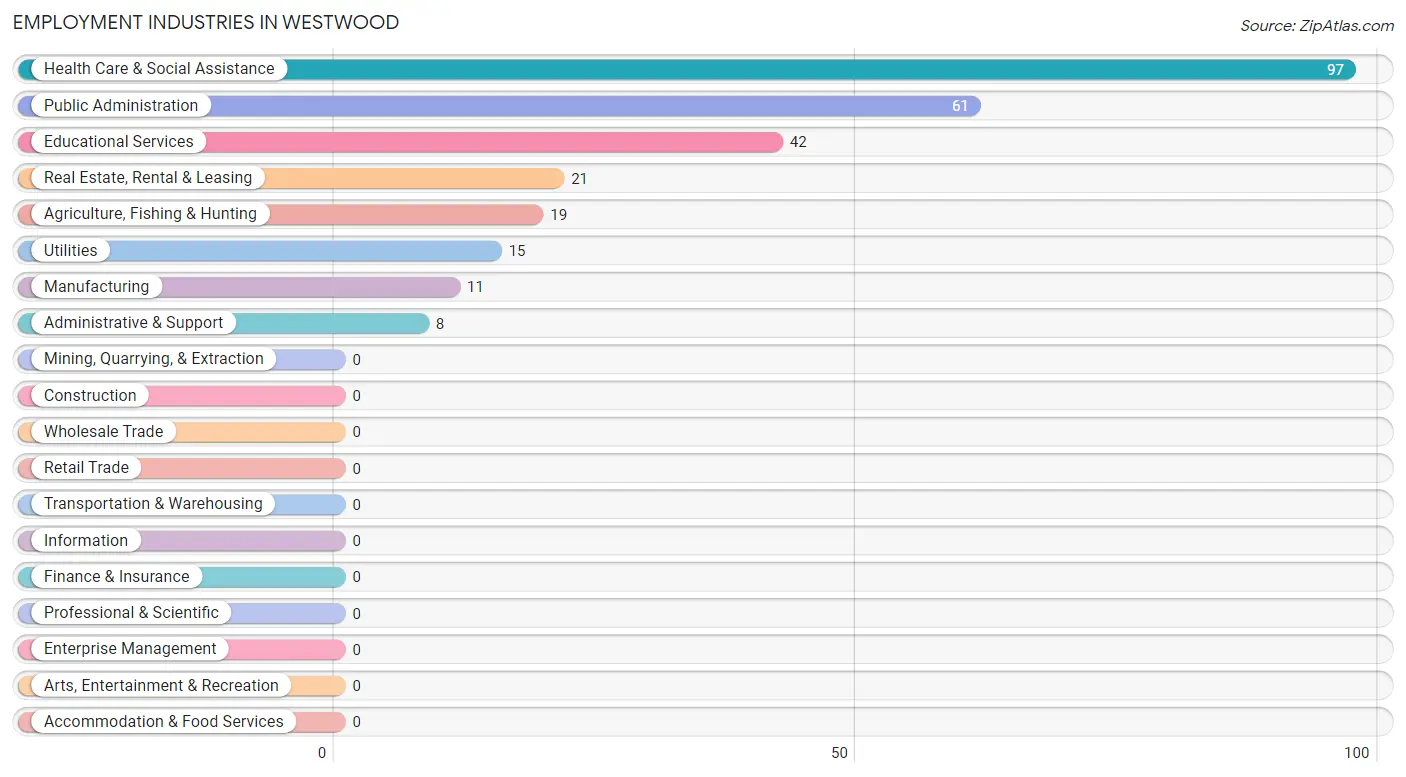
Employment Industries in Westwood
The major employment industries in Westwood include Health Care & Social Assistance (97 | 35.4%), Public Administration (61 | 22.3%), Educational Services (42 | 15.3%), Real Estate, Rental & Leasing (21 | 7.7%), and Agriculture, Fishing & Hunting (19 | 6.9%).
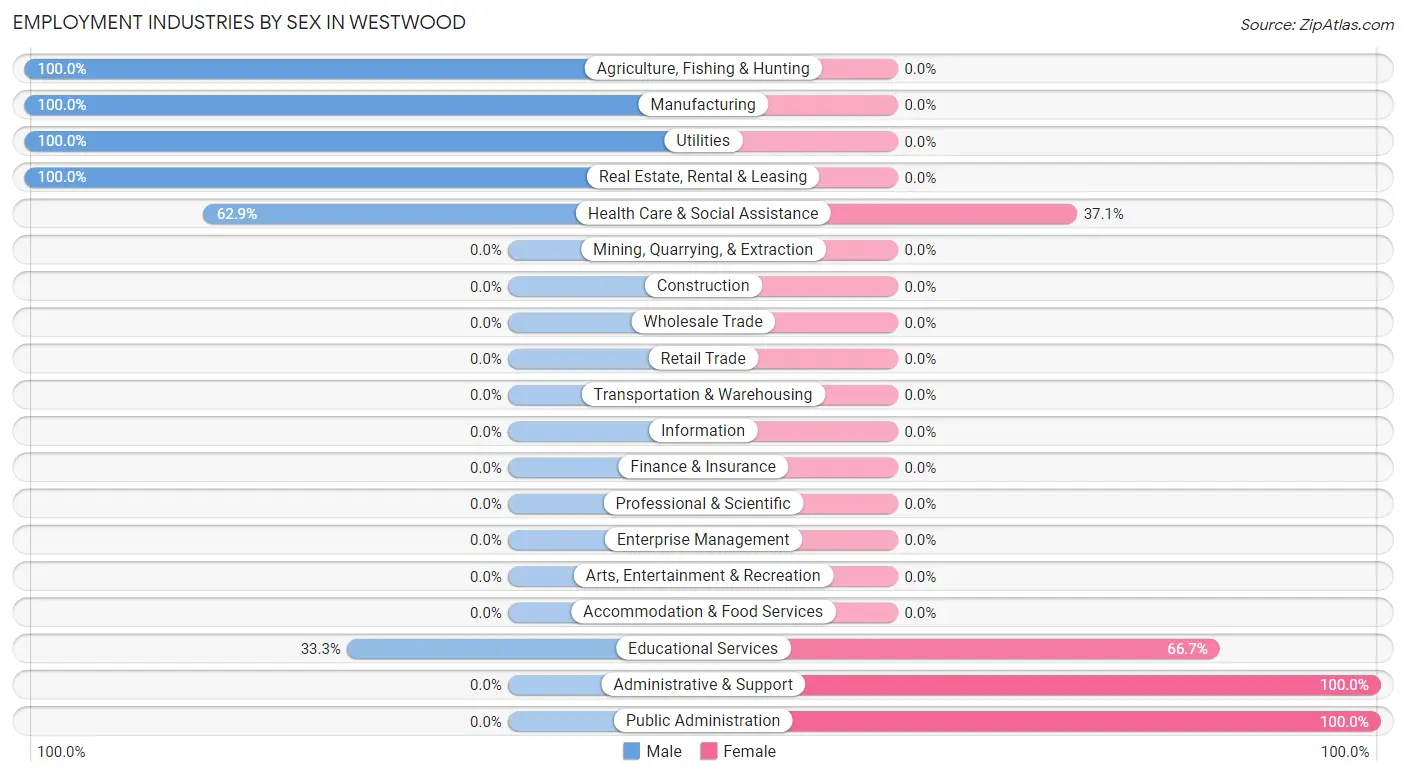
Employment Industries by Sex in Westwood
The Westwood industries that see more men than women are Agriculture, Fishing & Hunting (100.0%), Manufacturing (100.0%), and Utilities (100.0%), whereas the industries that tend to have a higher number of women are Administrative & Support (100.0%), Public Administration (100.0%), and Educational Services (66.7%).
| Industry | Male | Female |
| Agriculture, Fishing & Hunting | 19 (100.0%) | 0 (0.0%) |
| Mining, Quarrying, & Extraction | 0 (0.0%) | 0 (0.0%) |
| Construction | 0 (0.0%) | 0 (0.0%) |
| Manufacturing | 11 (100.0%) | 0 (0.0%) |
| Wholesale Trade | 0 (0.0%) | 0 (0.0%) |
| Retail Trade | 0 (0.0%) | 0 (0.0%) |
| Transportation & Warehousing | 0 (0.0%) | 0 (0.0%) |
| Utilities | 15 (100.0%) | 0 (0.0%) |
| Information | 0 (0.0%) | 0 (0.0%) |
| Finance & Insurance | 0 (0.0%) | 0 (0.0%) |
| Real Estate, Rental & Leasing | 21 (100.0%) | 0 (0.0%) |
| Professional & Scientific | 0 (0.0%) | 0 (0.0%) |
| Enterprise Management | 0 (0.0%) | 0 (0.0%) |
| Administrative & Support | 0 (0.0%) | 8 (100.0%) |
| Educational Services | 14 (33.3%) | 28 (66.7%) |
| Health Care & Social Assistance | 61 (62.9%) | 36 (37.1%) |
| Arts, Entertainment & Recreation | 0 (0.0%) | 0 (0.0%) |
| Accommodation & Food Services | 0 (0.0%) | 0 (0.0%) |
| Public Administration | 0 (0.0%) | 61 (100.0%) |
| Total | 141 (51.5%) | 133 (48.5%) |
Education in Westwood
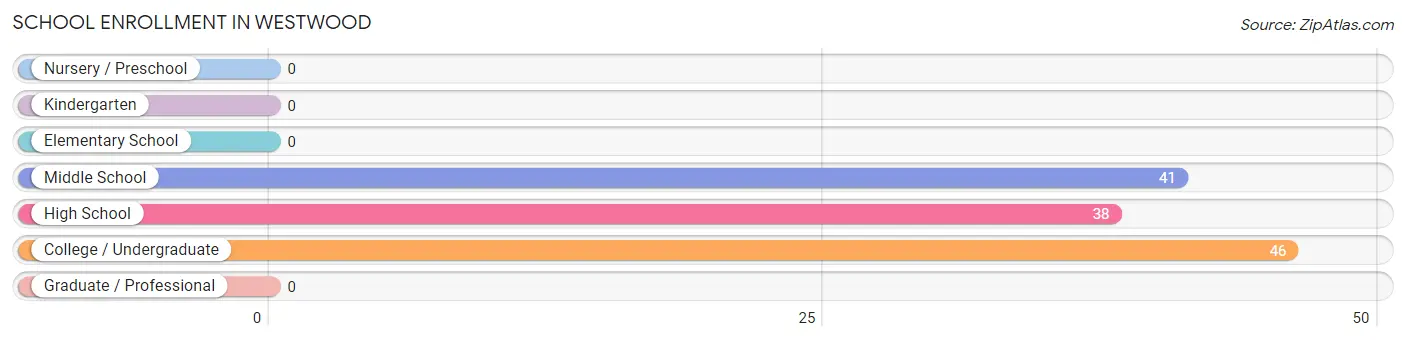
School Enrollment in Westwood
The most common levels of schooling among the 125 students in Westwood are college / undergraduate (46 | 36.8%), middle school (41 | 32.8%), and high school (38 | 30.4%).
| School Level | # Students | % Students |
| Nursery / Preschool | 0 | 0.0% |
| Kindergarten | 0 | 0.0% |
| Elementary School | 0 | 0.0% |
| Middle School | 41 | 32.8% |
| High School | 38 | 30.4% |
| College / Undergraduate | 46 | 36.8% |
| Graduate / Professional | 0 | 0.0% |
| Total | 125 | 100.0% |
School Enrollment by Age by Funding Source in Westwood
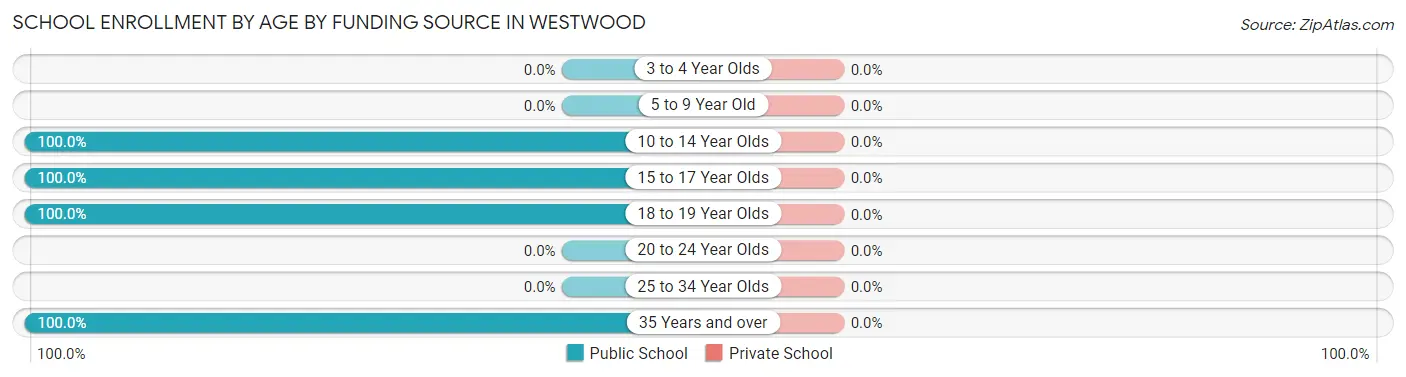
| Age Bracket | Public School | Private School |
| 3 to 4 Year Olds | 0 (0.0%) | 0 (0.0%) |
| 5 to 9 Year Old | 0 (0.0%) | 0 (0.0%) |
| 10 to 14 Year Olds | 41 (100.0%) | 0 (0.0%) |
| 15 to 17 Year Olds | 13 (100.0%) | 0 (0.0%) |
| 18 to 19 Year Olds | 25 (100.0%) | 0 (0.0%) |
| 20 to 24 Year Olds | 0 (0.0%) | 0 (0.0%) |
| 25 to 34 Year Olds | 0 (0.0%) | 0 (0.0%) |
| 35 Years and over | 46 (100.0%) | 0 (0.0%) |
| Total | 125 (100.0%) | 0 (0.0%) |
Educational Attainment by Field of Study in Westwood
Education (39 | 36.1%), physical & health sciences (29 | 26.9%), bio, nature & agricultural (19 | 17.6%), arts & humanities (13 | 12.0%), and business (8 | 7.4%) are the most common fields of study among 108 individuals in Westwood who have obtained a bachelor's degree or higher.
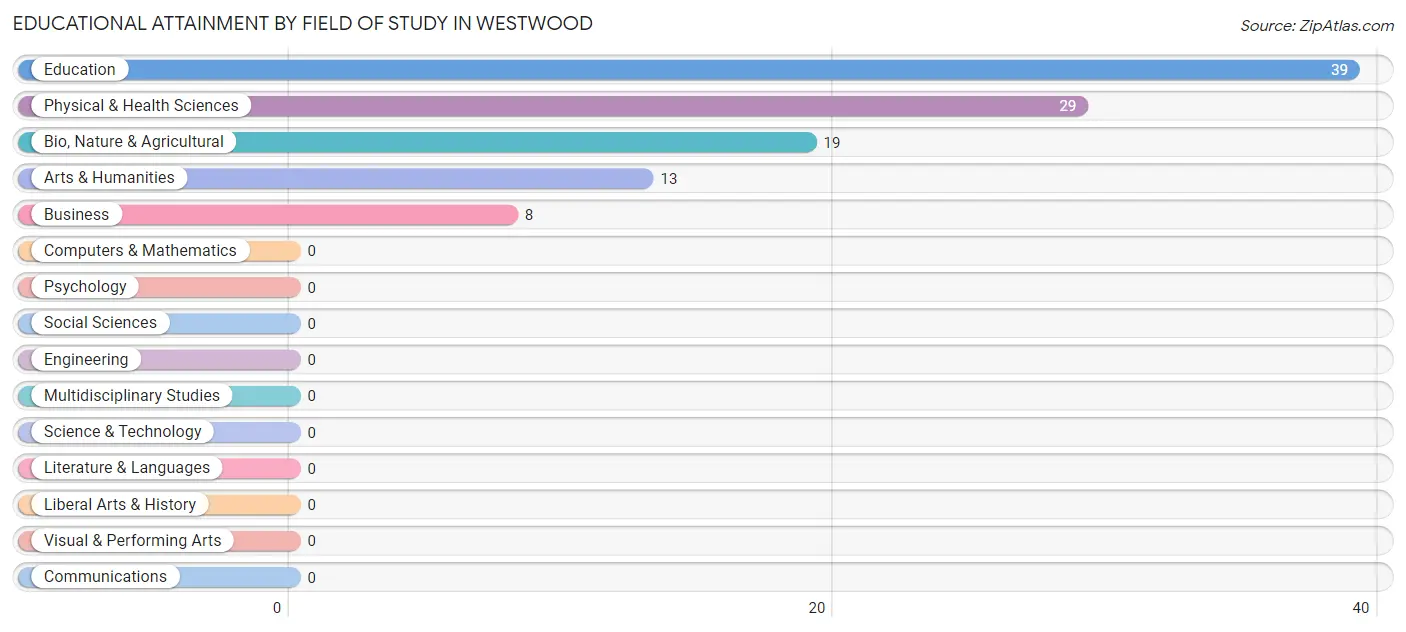
| Field of Study | # Graduates | % Graduates |
| Computers & Mathematics | 0 | 0.0% |
| Bio, Nature & Agricultural | 19 | 17.6% |
| Physical & Health Sciences | 29 | 26.9% |
| Psychology | 0 | 0.0% |
| Social Sciences | 0 | 0.0% |
| Engineering | 0 | 0.0% |
| Multidisciplinary Studies | 0 | 0.0% |
| Science & Technology | 0 | 0.0% |
| Business | 8 | 7.4% |
| Education | 39 | 36.1% |
| Literature & Languages | 0 | 0.0% |
| Liberal Arts & History | 0 | 0.0% |
| Visual & Performing Arts | 0 | 0.0% |
| Communications | 0 | 0.0% |
| Arts & Humanities | 13 | 12.0% |
| Total | 108 | 100.0% |
Transportation & Commute in Westwood
Vehicle Availability by Sex in Westwood
The most prevalent vehicle ownership categories in Westwood are males with 2 vehicles (33, accounting for 34.7%) and females with 2 vehicles (57, making up 24.8%).
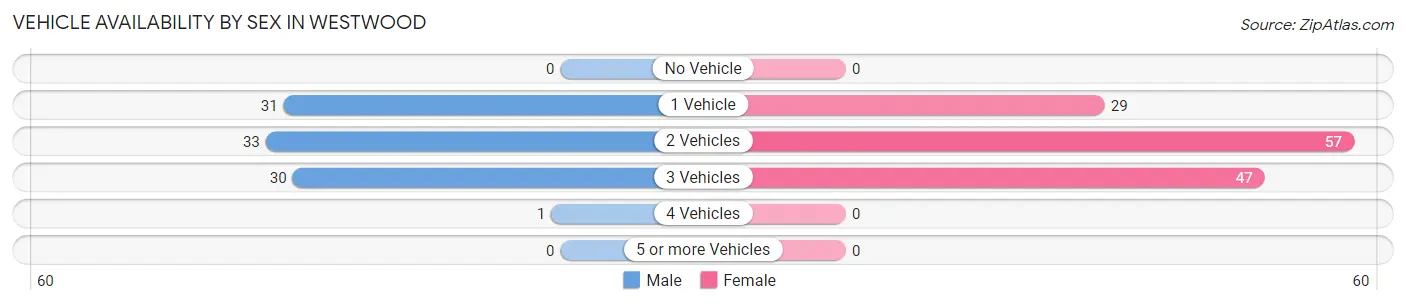
| Vehicles Available | Male | Female |
| No Vehicle | 0 (0.0%) | 0 (0.0%) |
| 1 Vehicle | 31 (32.6%) | 29 (21.8%) |
| 2 Vehicles | 33 (34.7%) | 57 (42.9%) |
| 3 Vehicles | 30 (31.6%) | 47 (35.3%) |
| 4 Vehicles | 1 (1.1%) | 0 (0.0%) |
| 5 or more Vehicles | 0 (0.0%) | 0 (0.0%) |
| Total | 95 (100.0%) | 133 (100.0%) |
Commute Time in Westwood
The most frequently occuring commute durations in Westwood are 40 to 44 minutes (74 commuters, 37.6%), 5 to 9 minutes (60 commuters, 30.5%), and 20 to 24 minutes (32 commuters, 16.2%).
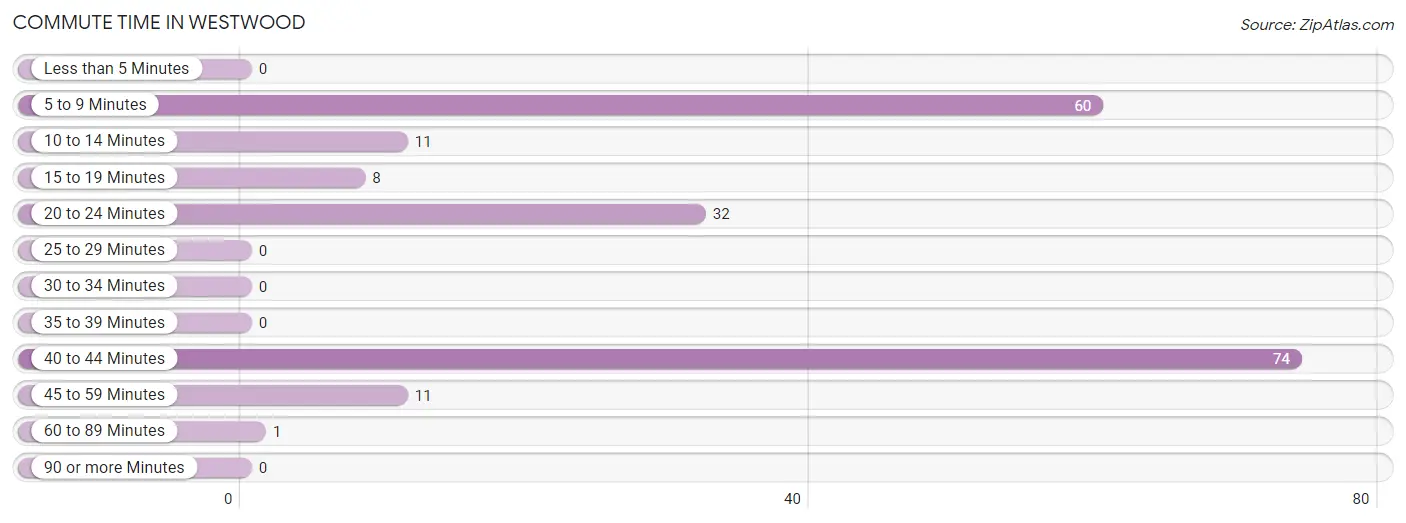
| Commute Time | # Commuters | % Commuters |
| Less than 5 Minutes | 0 | 0.0% |
| 5 to 9 Minutes | 60 | 30.5% |
| 10 to 14 Minutes | 11 | 5.6% |
| 15 to 19 Minutes | 8 | 4.1% |
| 20 to 24 Minutes | 32 | 16.2% |
| 25 to 29 Minutes | 0 | 0.0% |
| 30 to 34 Minutes | 0 | 0.0% |
| 35 to 39 Minutes | 0 | 0.0% |
| 40 to 44 Minutes | 74 | 37.6% |
| 45 to 59 Minutes | 11 | 5.6% |
| 60 to 89 Minutes | 1 | 0.5% |
| 90 or more Minutes | 0 | 0.0% |
Commute Time by Sex in Westwood
The most common commute times in Westwood are 5 to 9 minutes (60 commuters, 63.2%) for males and 40 to 44 minutes (55 commuters, 53.9%) for females.
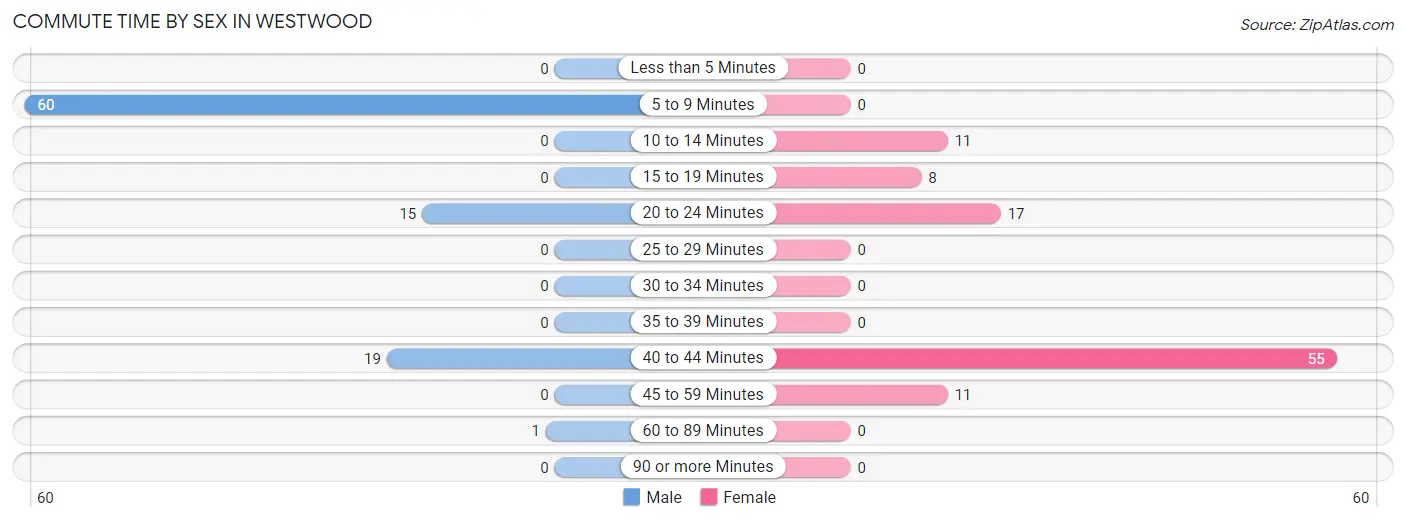
| Commute Time | Male | Female |
| Less than 5 Minutes | 0 (0.0%) | 0 (0.0%) |
| 5 to 9 Minutes | 60 (63.2%) | 0 (0.0%) |
| 10 to 14 Minutes | 0 (0.0%) | 11 (10.8%) |
| 15 to 19 Minutes | 0 (0.0%) | 8 (7.8%) |
| 20 to 24 Minutes | 15 (15.8%) | 17 (16.7%) |
| 25 to 29 Minutes | 0 (0.0%) | 0 (0.0%) |
| 30 to 34 Minutes | 0 (0.0%) | 0 (0.0%) |
| 35 to 39 Minutes | 0 (0.0%) | 0 (0.0%) |
| 40 to 44 Minutes | 19 (20.0%) | 55 (53.9%) |
| 45 to 59 Minutes | 0 (0.0%) | 11 (10.8%) |
| 60 to 89 Minutes | 1 (1.1%) | 0 (0.0%) |
| 90 or more Minutes | 0 (0.0%) | 0 (0.0%) |
Time of Departure to Work by Sex in Westwood
The most frequent times of departure to work in Westwood are 8:00 AM to 8:29 AM (21, 22.1%) for males and 7:00 AM to 7:29 AM (67, 65.7%) for females.
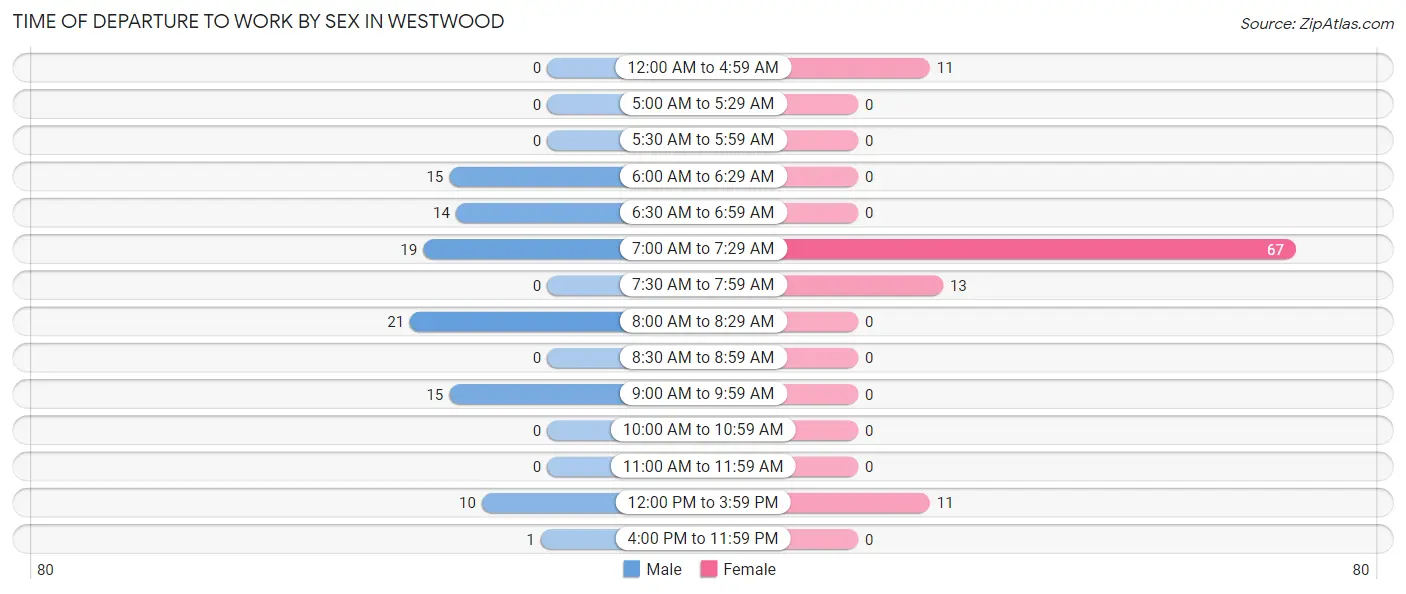
| Time of Departure | Male | Female |
| 12:00 AM to 4:59 AM | 0 (0.0%) | 11 (10.8%) |
| 5:00 AM to 5:29 AM | 0 (0.0%) | 0 (0.0%) |
| 5:30 AM to 5:59 AM | 0 (0.0%) | 0 (0.0%) |
| 6:00 AM to 6:29 AM | 15 (15.8%) | 0 (0.0%) |
| 6:30 AM to 6:59 AM | 14 (14.7%) | 0 (0.0%) |
| 7:00 AM to 7:29 AM | 19 (20.0%) | 67 (65.7%) |
| 7:30 AM to 7:59 AM | 0 (0.0%) | 13 (12.8%) |
| 8:00 AM to 8:29 AM | 21 (22.1%) | 0 (0.0%) |
| 8:30 AM to 8:59 AM | 0 (0.0%) | 0 (0.0%) |
| 9:00 AM to 9:59 AM | 15 (15.8%) | 0 (0.0%) |
| 10:00 AM to 10:59 AM | 0 (0.0%) | 0 (0.0%) |
| 11:00 AM to 11:59 AM | 0 (0.0%) | 0 (0.0%) |
| 12:00 PM to 3:59 PM | 10 (10.5%) | 11 (10.8%) |
| 4:00 PM to 11:59 PM | 1 (1.1%) | 0 (0.0%) |
| Total | 95 (100.0%) | 102 (100.0%) |
Housing Occupancy in Westwood
Occupancy by Ownership in Westwood
Of the total 483 dwellings in Westwood, owner-occupied units account for 303 (62.7%), while renter-occupied units make up 180 (37.3%).
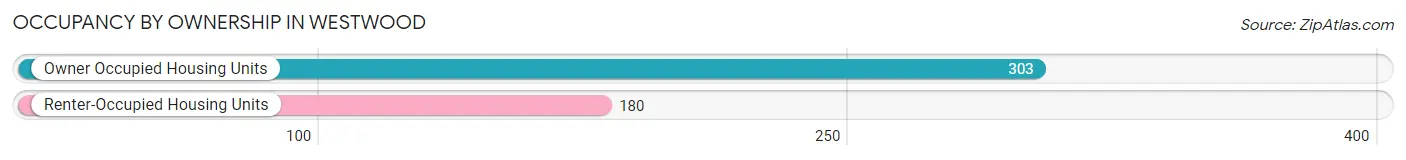
| Occupancy | # Housing Units | % Housing Units |
| Owner Occupied Housing Units | 303 | 62.7% |
| Renter-Occupied Housing Units | 180 | 37.3% |
| Total Occupied Housing Units | 483 | 100.0% |
Occupancy by Household Size in Westwood
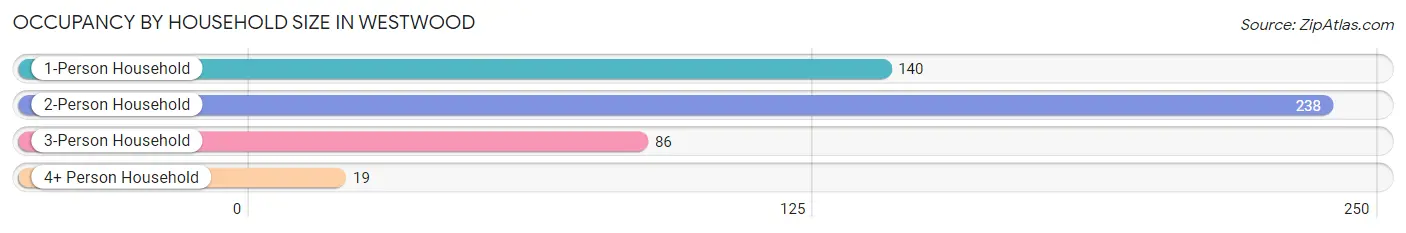
| Household Size | # Housing Units | % Housing Units |
| 1-Person Household | 140 | 29.0% |
| 2-Person Household | 238 | 49.3% |
| 3-Person Household | 86 | 17.8% |
| 4+ Person Household | 19 | 3.9% |
| Total Housing Units | 483 | 100.0% |
Occupancy by Ownership by Household Size in Westwood
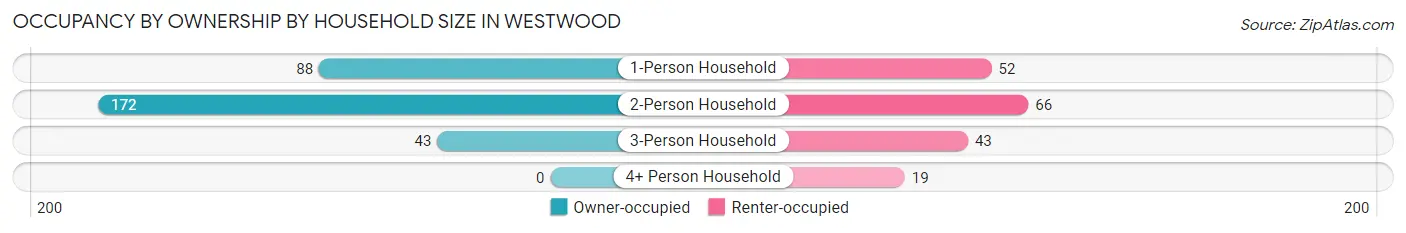
| Household Size | Owner-occupied | Renter-occupied |
| 1-Person Household | 88 (62.9%) | 52 (37.1%) |
| 2-Person Household | 172 (72.3%) | 66 (27.7%) |
| 3-Person Household | 43 (50.0%) | 43 (50.0%) |
| 4+ Person Household | 0 (0.0%) | 19 (100.0%) |
| Total Housing Units | 303 (62.7%) | 180 (37.3%) |
Occupancy by Educational Attainment in Westwood
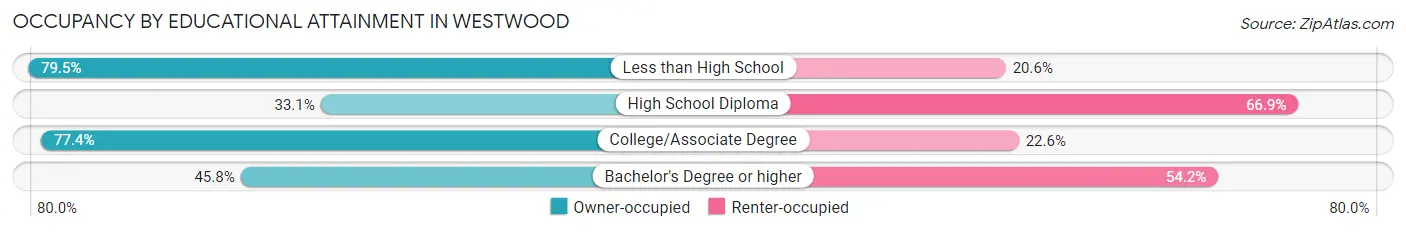
| Household Size | Owner-occupied | Renter-occupied |
| Less than High School | 58 (79.4%) | 15 (20.5%) |
| High School Diploma | 40 (33.1%) | 81 (66.9%) |
| College/Associate Degree | 178 (77.4%) | 52 (22.6%) |
| Bachelor's Degree or higher | 27 (45.8%) | 32 (54.2%) |
Occupancy by Age of Householder in Westwood
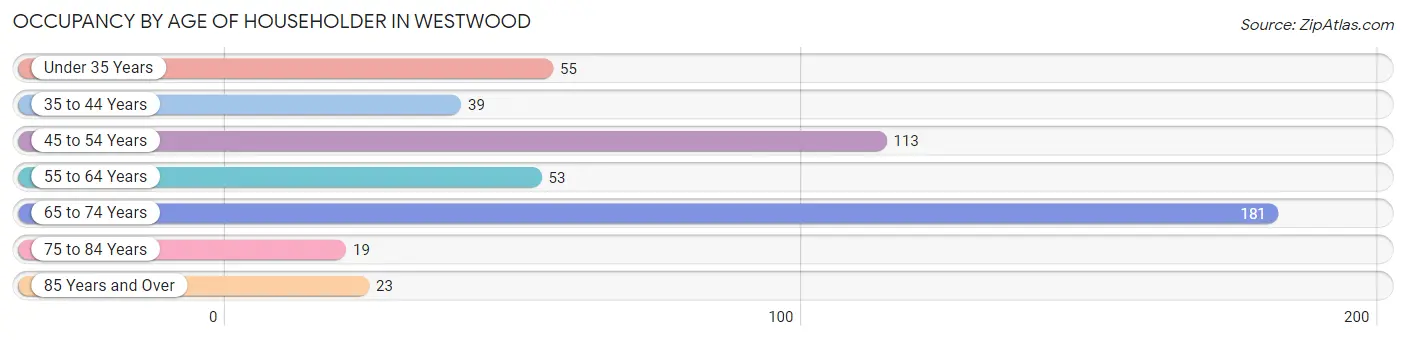
| Age Bracket | # Households | % Households |
| Under 35 Years | 55 | 11.4% |
| 35 to 44 Years | 39 | 8.1% |
| 45 to 54 Years | 113 | 23.4% |
| 55 to 64 Years | 53 | 11.0% |
| 65 to 74 Years | 181 | 37.5% |
| 75 to 84 Years | 19 | 3.9% |
| 85 Years and Over | 23 | 4.8% |
| Total | 483 | 100.0% |
Housing Finances in Westwood
Median Income by Occupancy in Westwood
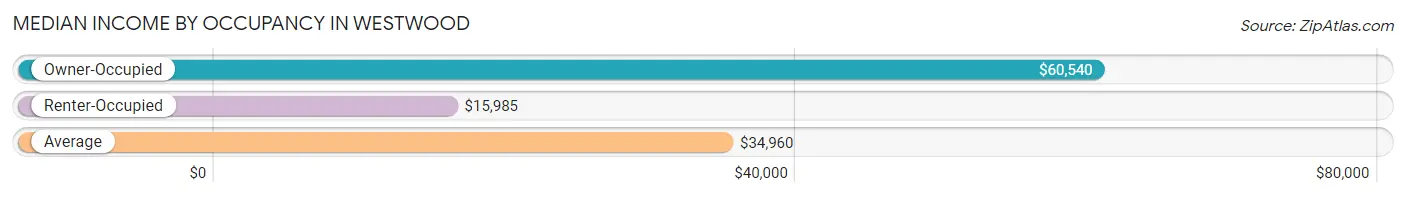
| Occupancy Type | # Households | Median Income |
| Owner-Occupied | 303 (62.7%) | $60,540 |
| Renter-Occupied | 180 (37.3%) | $15,985 |
| Average | 483 (100.0%) | $34,960 |
Occupancy by Householder Income Bracket in Westwood
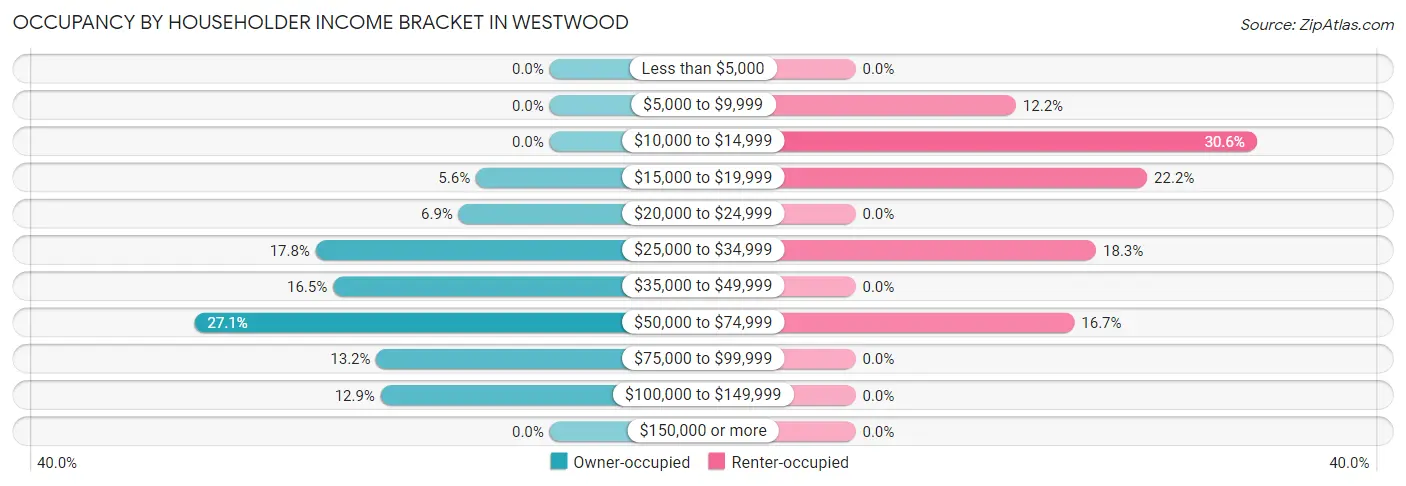
| Income Bracket | Owner-occupied | Renter-occupied |
| Less than $5,000 | 0 (0.0%) | 0 (0.0%) |
| $5,000 to $9,999 | 0 (0.0%) | 22 (12.2%) |
| $10,000 to $14,999 | 0 (0.0%) | 55 (30.6%) |
| $15,000 to $19,999 | 17 (5.6%) | 40 (22.2%) |
| $20,000 to $24,999 | 21 (6.9%) | 0 (0.0%) |
| $25,000 to $34,999 | 54 (17.8%) | 33 (18.3%) |
| $35,000 to $49,999 | 50 (16.5%) | 0 (0.0%) |
| $50,000 to $74,999 | 82 (27.1%) | 30 (16.7%) |
| $75,000 to $99,999 | 40 (13.2%) | 0 (0.0%) |
| $100,000 to $149,999 | 39 (12.9%) | 0 (0.0%) |
| $150,000 or more | 0 (0.0%) | 0 (0.0%) |
| Total | 303 (100.0%) | 180 (100.0%) |
Monthly Housing Cost Tiers in Westwood
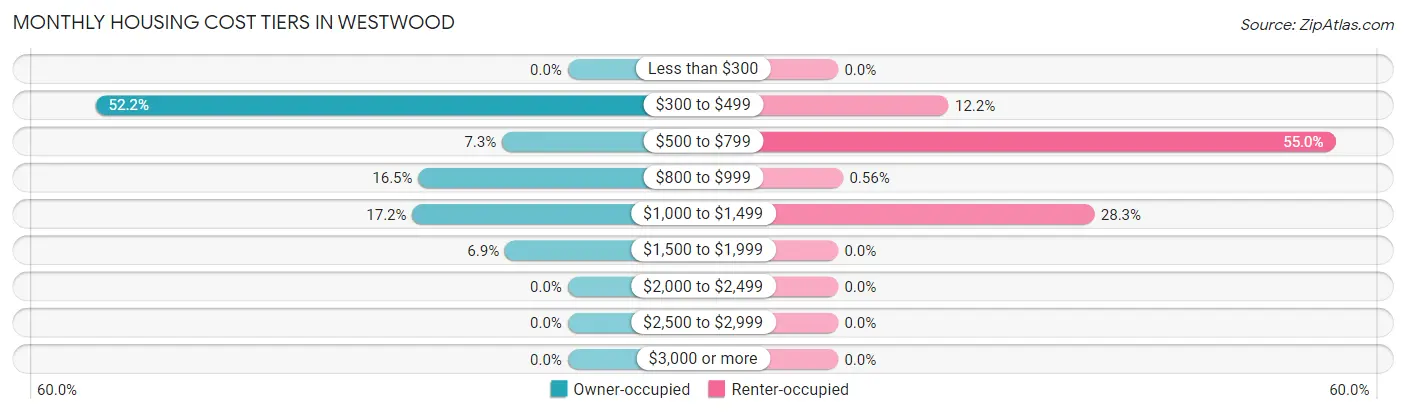
| Monthly Cost | Owner-occupied | Renter-occupied |
| Less than $300 | 0 (0.0%) | 0 (0.0%) |
| $300 to $499 | 158 (52.1%) | 22 (12.2%) |
| $500 to $799 | 22 (7.3%) | 99 (55.0%) |
| $800 to $999 | 50 (16.5%) | 1 (0.6%) |
| $1,000 to $1,499 | 52 (17.2%) | 51 (28.3%) |
| $1,500 to $1,999 | 21 (6.9%) | 0 (0.0%) |
| $2,000 to $2,499 | 0 (0.0%) | 0 (0.0%) |
| $2,500 to $2,999 | 0 (0.0%) | 0 (0.0%) |
| $3,000 or more | 0 (0.0%) | 0 (0.0%) |
| Total | 303 (100.0%) | 180 (100.0%) |
Physical Housing Characteristics in Westwood
Housing Structures in Westwood
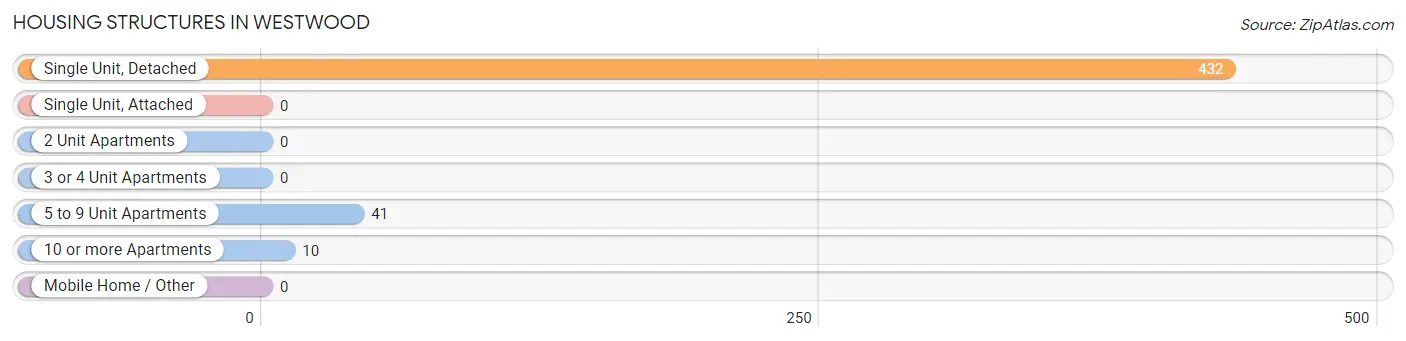
| Structure Type | # Housing Units | % Housing Units |
| Single Unit, Detached | 432 | 89.4% |
| Single Unit, Attached | 0 | 0.0% |
| 2 Unit Apartments | 0 | 0.0% |
| 3 or 4 Unit Apartments | 0 | 0.0% |
| 5 to 9 Unit Apartments | 41 | 8.5% |
| 10 or more Apartments | 10 | 2.1% |
| Mobile Home / Other | 0 | 0.0% |
| Total | 483 | 100.0% |
Housing Structures by Occupancy in Westwood
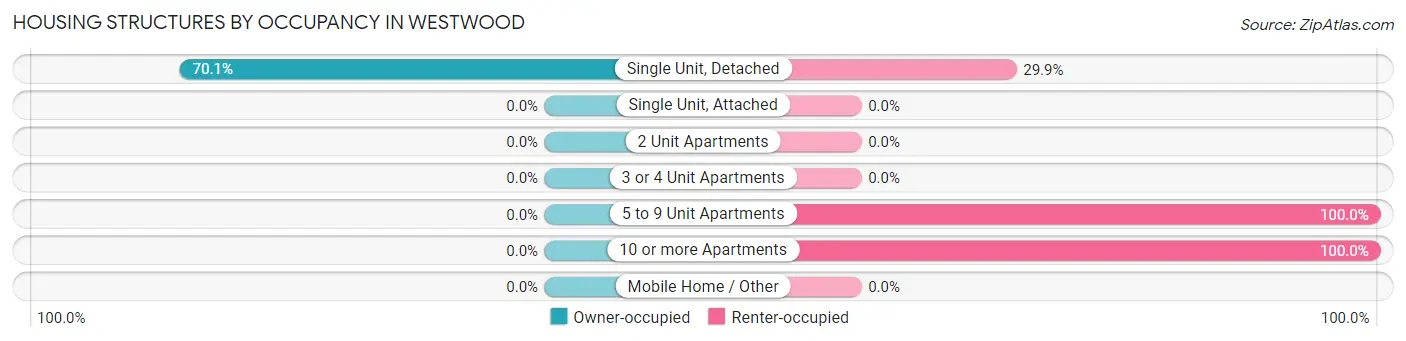
| Structure Type | Owner-occupied | Renter-occupied |
| Single Unit, Detached | 303 (70.1%) | 129 (29.9%) |
| Single Unit, Attached | 0 (0.0%) | 0 (0.0%) |
| 2 Unit Apartments | 0 (0.0%) | 0 (0.0%) |
| 3 or 4 Unit Apartments | 0 (0.0%) | 0 (0.0%) |
| 5 to 9 Unit Apartments | 0 (0.0%) | 41 (100.0%) |
| 10 or more Apartments | 0 (0.0%) | 10 (100.0%) |
| Mobile Home / Other | 0 (0.0%) | 0 (0.0%) |
| Total | 303 (62.7%) | 180 (37.3%) |
Housing Structures by Number of Rooms in Westwood
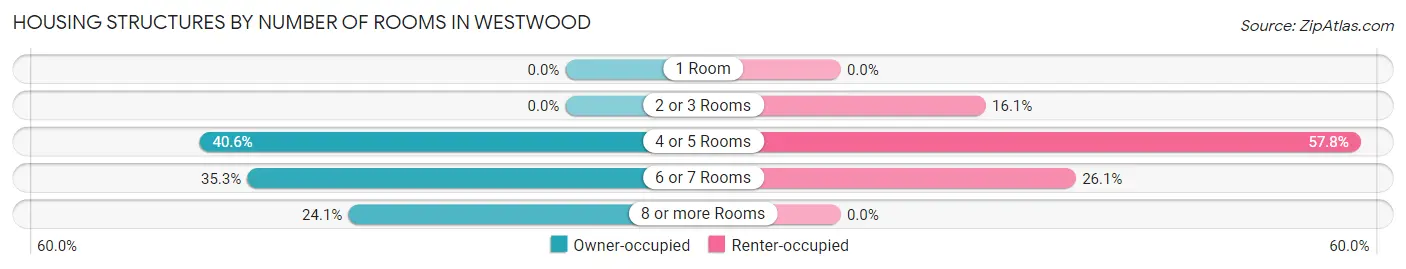
| Number of Rooms | Owner-occupied | Renter-occupied |
| 1 Room | 0 (0.0%) | 0 (0.0%) |
| 2 or 3 Rooms | 0 (0.0%) | 29 (16.1%) |
| 4 or 5 Rooms | 123 (40.6%) | 104 (57.8%) |
| 6 or 7 Rooms | 107 (35.3%) | 47 (26.1%) |
| 8 or more Rooms | 73 (24.1%) | 0 (0.0%) |
| Total | 303 (100.0%) | 180 (100.0%) |
Housing Structure by Heating Type in Westwood
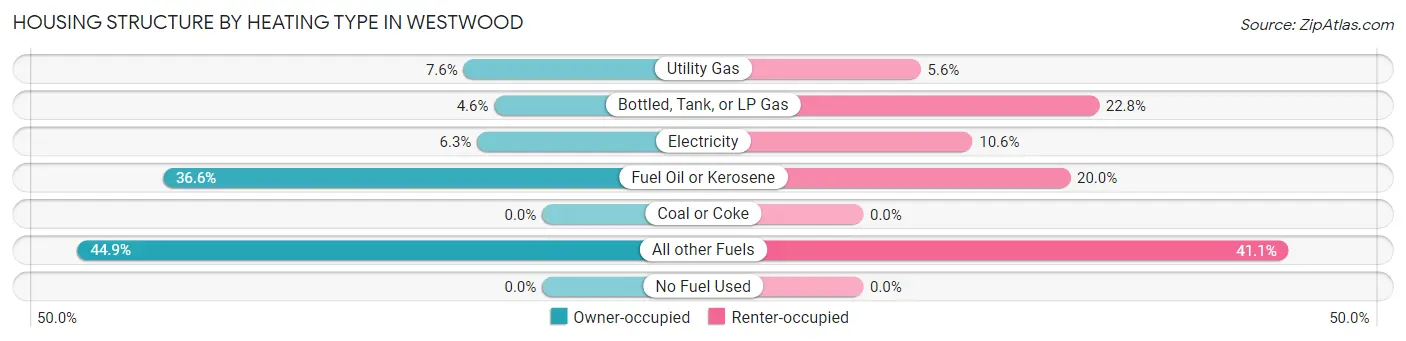
| Heating Type | Owner-occupied | Renter-occupied |
| Utility Gas | 23 (7.6%) | 10 (5.6%) |
| Bottled, Tank, or LP Gas | 14 (4.6%) | 41 (22.8%) |
| Electricity | 19 (6.3%) | 19 (10.6%) |
| Fuel Oil or Kerosene | 111 (36.6%) | 36 (20.0%) |
| Coal or Coke | 0 (0.0%) | 0 (0.0%) |
| All other Fuels | 136 (44.9%) | 74 (41.1%) |
| No Fuel Used | 0 (0.0%) | 0 (0.0%) |
| Total | 303 (100.0%) | 180 (100.0%) |
Household Vehicle Usage in Westwood
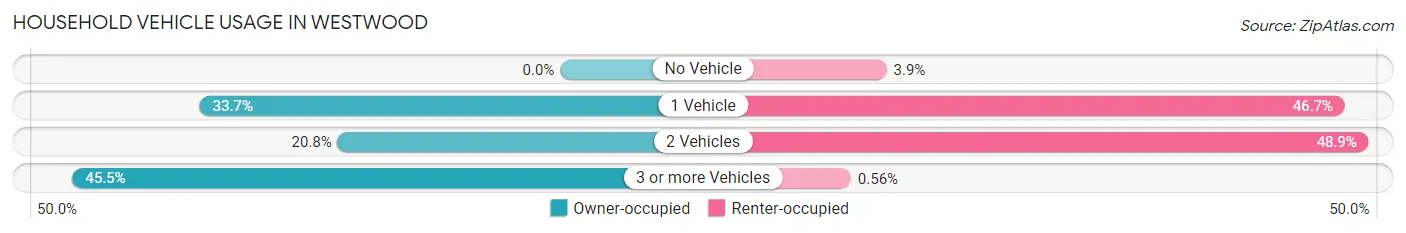
| Vehicles per Household | Owner-occupied | Renter-occupied |
| No Vehicle | 0 (0.0%) | 7 (3.9%) |
| 1 Vehicle | 102 (33.7%) | 84 (46.7%) |
| 2 Vehicles | 63 (20.8%) | 88 (48.9%) |
| 3 or more Vehicles | 138 (45.5%) | 1 (0.6%) |
| Total | 303 (100.0%) | 180 (100.0%) |
Real Estate & Mortgages in Westwood
Real Estate and Mortgage Overview in Westwood
| Characteristic | Without Mortgage | With Mortgage |
| Housing Units | 187 | 116 |
| Median Property Value | $157,000 | $146,100 |
| Median Household Income | $47,039 | $0 |
| Monthly Housing Costs | $358 | $0 |
| Real Estate Taxes | $568 | $0 |
Property Value by Mortgage Status in Westwood
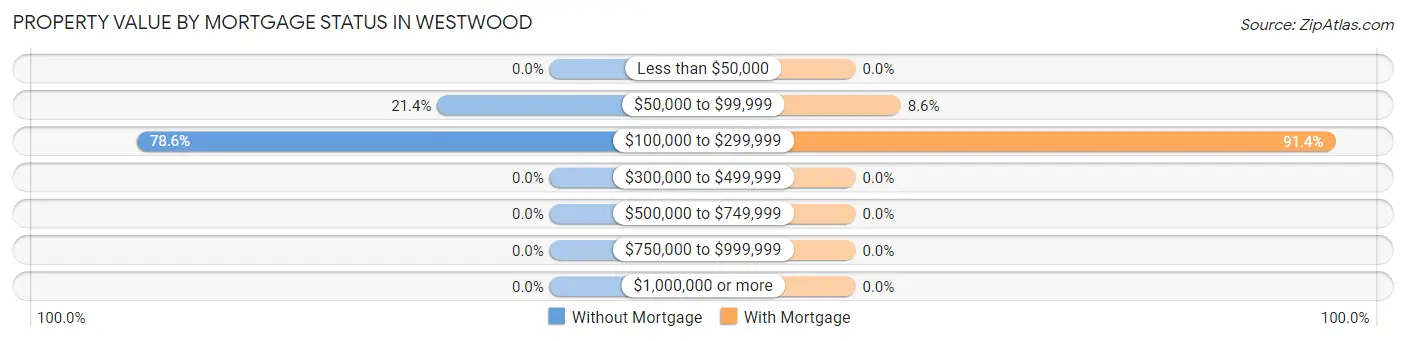
| Property Value | Without Mortgage | With Mortgage |
| Less than $50,000 | 0 (0.0%) | 0 (0.0%) |
| $50,000 to $99,999 | 40 (21.4%) | 10 (8.6%) |
| $100,000 to $299,999 | 147 (78.6%) | 106 (91.4%) |
| $300,000 to $499,999 | 0 (0.0%) | 0 (0.0%) |
| $500,000 to $749,999 | 0 (0.0%) | 0 (0.0%) |
| $750,000 to $999,999 | 0 (0.0%) | 0 (0.0%) |
| $1,000,000 or more | 0 (0.0%) | 0 (0.0%) |
| Total | 187 (100.0%) | 116 (100.0%) |
Household Income by Mortgage Status in Westwood
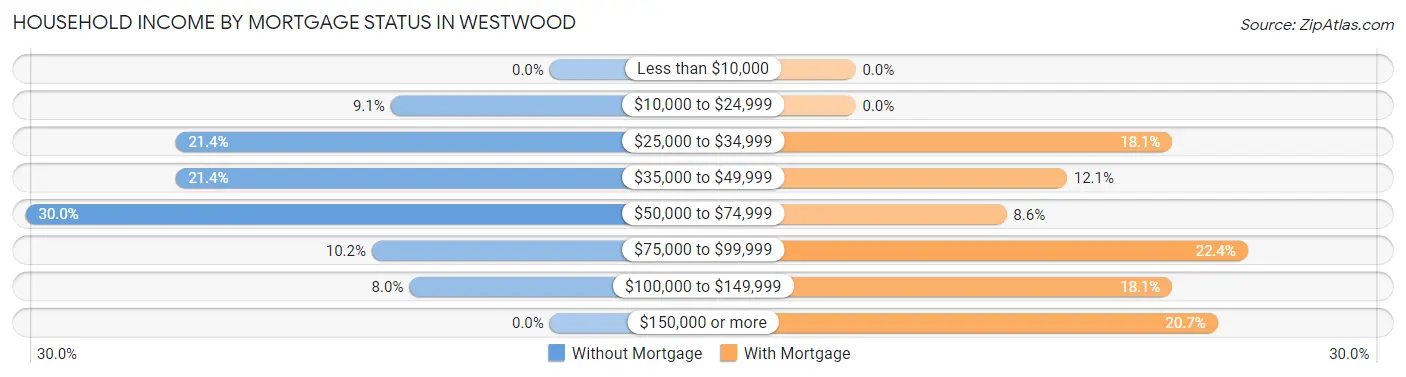
| Household Income | Without Mortgage | With Mortgage |
| Less than $10,000 | 0 (0.0%) | 0 (0.0%) |
| $10,000 to $24,999 | 17 (9.1%) | 0 (0.0%) |
| $25,000 to $34,999 | 40 (21.4%) | 21 (18.1%) |
| $35,000 to $49,999 | 40 (21.4%) | 14 (12.1%) |
| $50,000 to $74,999 | 56 (29.9%) | 10 (8.6%) |
| $75,000 to $99,999 | 19 (10.2%) | 26 (22.4%) |
| $100,000 to $149,999 | 15 (8.0%) | 21 (18.1%) |
| $150,000 or more | 0 (0.0%) | 24 (20.7%) |
| Total | 187 (100.0%) | 116 (100.0%) |
Property Value to Household Income Ratio in Westwood
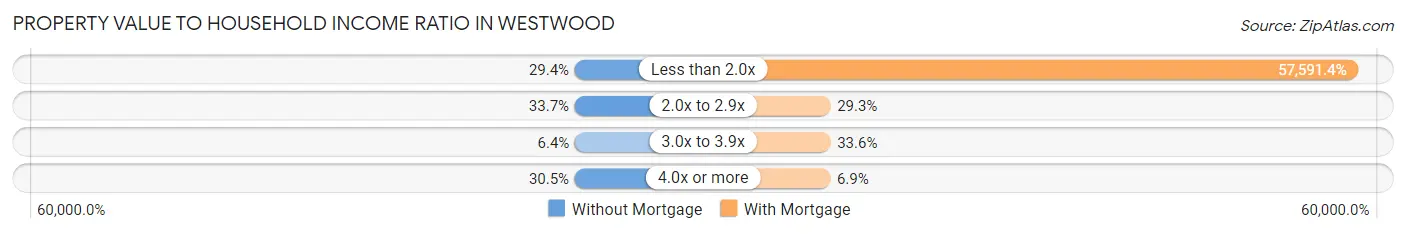
| Value-to-Income Ratio | Without Mortgage | With Mortgage |
| Less than 2.0x | 55 (29.4%) | 66,806 (57,591.4%) |
| 2.0x to 2.9x | 63 (33.7%) | 34 (29.3%) |
| 3.0x to 3.9x | 12 (6.4%) | 39 (33.6%) |
| 4.0x or more | 57 (30.5%) | 8 (6.9%) |
| Total | 187 (100.0%) | 116 (100.0%) |
Real Estate Taxes by Mortgage Status in Westwood
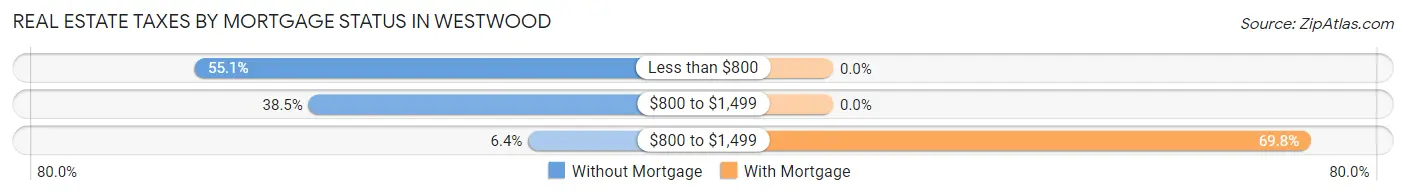
| Property Taxes | Without Mortgage | With Mortgage |
| Less than $800 | 103 (55.1%) | 0 (0.0%) |
| $800 to $1,499 | 72 (38.5%) | 0 (0.0%) |
| $800 to $1,499 | 12 (6.4%) | 81 (69.8%) |
| Total | 187 (100.0%) | 116 (100.0%) |
Health & Disability in Westwood
Health Insurance Coverage by Age in Westwood
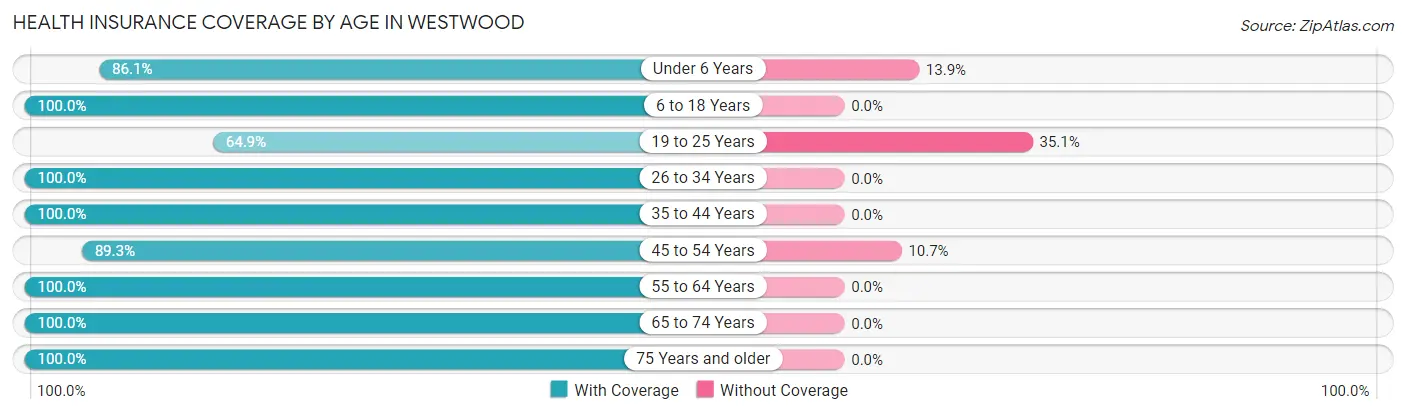
| Age Bracket | With Coverage | Without Coverage |
| Under 6 Years | 99 (86.1%) | 16 (13.9%) |
| 6 to 18 Years | 79 (100.0%) | 0 (0.0%) |
| 19 to 25 Years | 61 (64.9%) | 33 (35.1%) |
| 26 to 34 Years | 156 (100.0%) | 0 (0.0%) |
| 35 to 44 Years | 39 (100.0%) | 0 (0.0%) |
| 45 to 54 Years | 176 (89.3%) | 21 (10.7%) |
| 55 to 64 Years | 153 (100.0%) | 0 (0.0%) |
| 65 to 74 Years | 241 (100.0%) | 0 (0.0%) |
| 75 Years and older | 42 (100.0%) | 0 (0.0%) |
| Total | 1,046 (93.7%) | 70 (6.3%) |
Health Insurance Coverage by Citizenship Status in Westwood
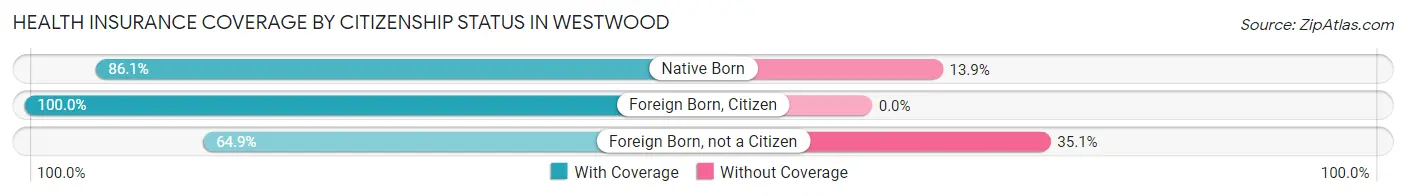
| Citizenship Status | With Coverage | Without Coverage |
| Native Born | 99 (86.1%) | 16 (13.9%) |
| Foreign Born, Citizen | 79 (100.0%) | 0 (0.0%) |
| Foreign Born, not a Citizen | 61 (64.9%) | 33 (35.1%) |
Health Insurance Coverage by Household Income in Westwood
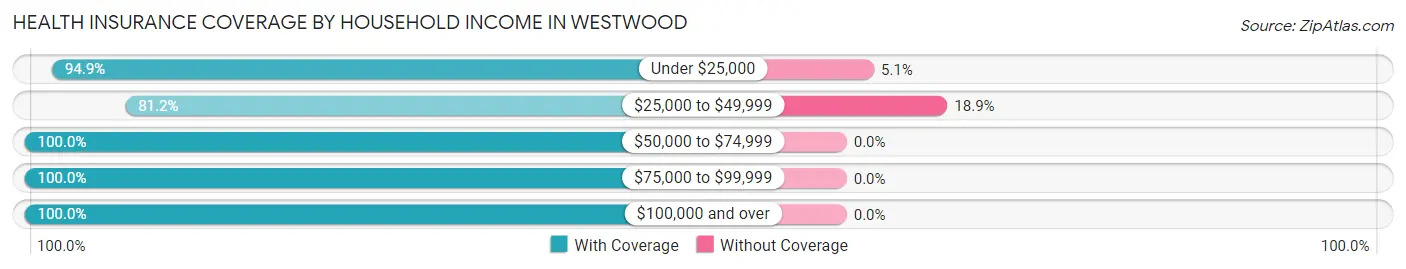
| Household Income | With Coverage | Without Coverage |
| Under $25,000 | 389 (94.9%) | 21 (5.1%) |
| $25,000 to $49,999 | 211 (81.1%) | 49 (18.9%) |
| $50,000 to $74,999 | 321 (100.0%) | 0 (0.0%) |
| $75,000 to $99,999 | 62 (100.0%) | 0 (0.0%) |
| $100,000 and over | 63 (100.0%) | 0 (0.0%) |
Public vs Private Health Insurance Coverage by Age in Westwood
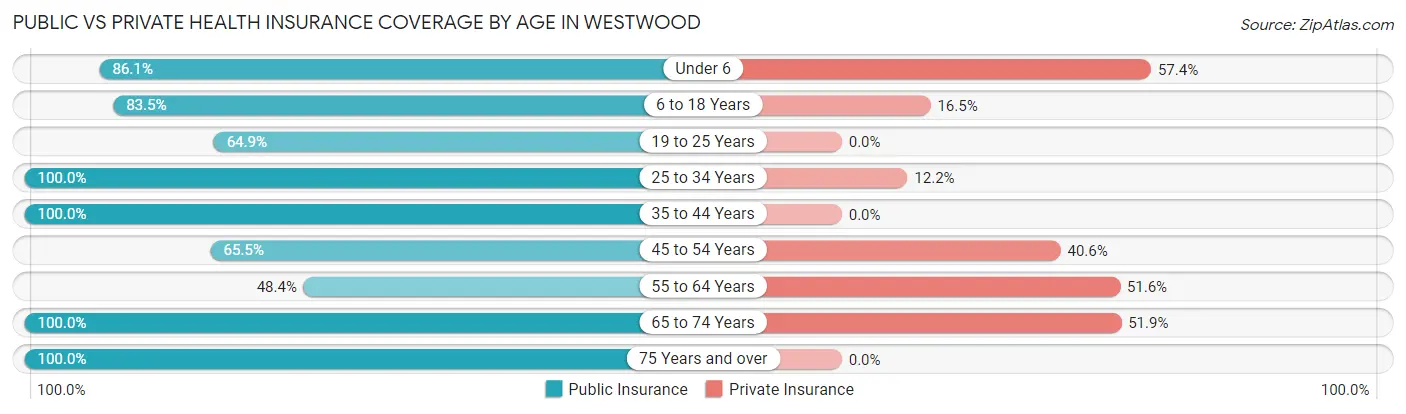
| Age Bracket | Public Insurance | Private Insurance |
| Under 6 | 99 (86.1%) | 66 (57.4%) |
| 6 to 18 Years | 66 (83.5%) | 13 (16.5%) |
| 19 to 25 Years | 61 (64.9%) | 0 (0.0%) |
| 25 to 34 Years | 156 (100.0%) | 19 (12.2%) |
| 35 to 44 Years | 39 (100.0%) | 0 (0.0%) |
| 45 to 54 Years | 129 (65.5%) | 80 (40.6%) |
| 55 to 64 Years | 74 (48.4%) | 79 (51.6%) |
| 65 to 74 Years | 241 (100.0%) | 125 (51.9%) |
| 75 Years and over | 42 (100.0%) | 0 (0.0%) |
| Total | 907 (81.3%) | 382 (34.2%) |
Disability Status by Sex by Age in Westwood
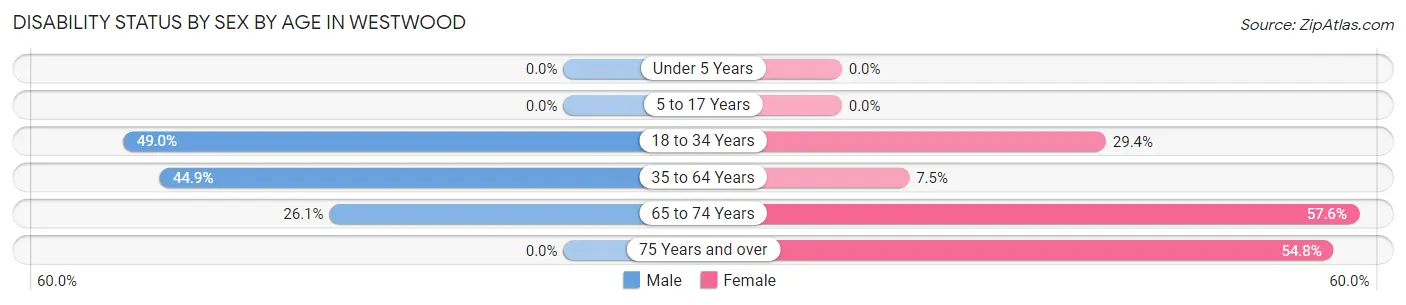
| Age Bracket | Male | Female |
| Under 5 Years | 0 (0.0%) | 0 (0.0%) |
| 5 to 17 Years | 0 (0.0%) | 0 (0.0%) |
| 18 to 34 Years | 93 (48.9%) | 25 (29.4%) |
| 35 to 64 Years | 97 (44.9%) | 13 (7.5%) |
| 65 to 74 Years | 37 (26.1%) | 57 (57.6%) |
| 75 Years and over | 0 (0.0%) | 23 (54.8%) |
Disability Class by Sex by Age in Westwood
Disability Class: Hearing Difficulty
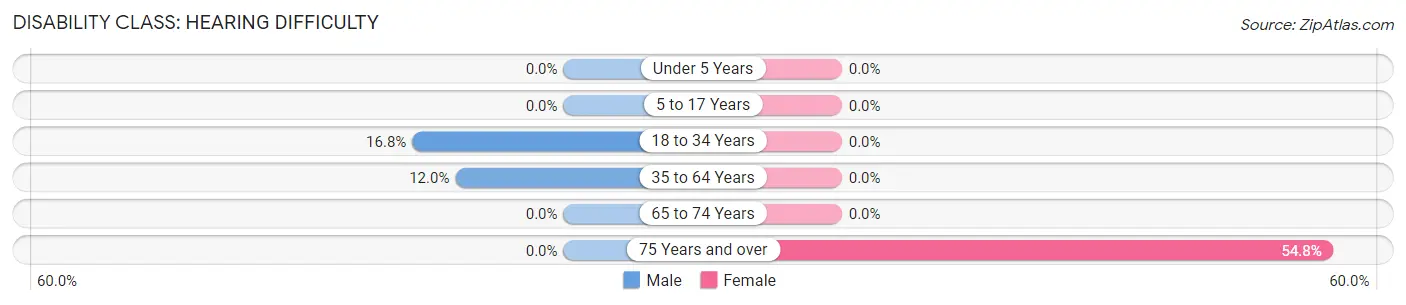
| Age Bracket | Male | Female |
| Under 5 Years | 0 (0.0%) | 0 (0.0%) |
| 5 to 17 Years | 0 (0.0%) | 0 (0.0%) |
| 18 to 34 Years | 32 (16.8%) | 0 (0.0%) |
| 35 to 64 Years | 26 (12.0%) | 0 (0.0%) |
| 65 to 74 Years | 0 (0.0%) | 0 (0.0%) |
| 75 Years and over | 0 (0.0%) | 23 (54.8%) |
Disability Class: Vision Difficulty
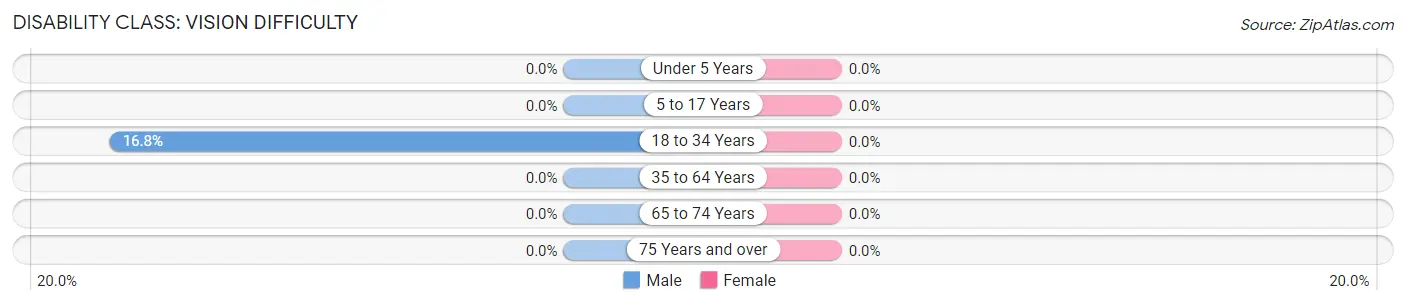
| Age Bracket | Male | Female |
| Under 5 Years | 0 (0.0%) | 0 (0.0%) |
| 5 to 17 Years | 0 (0.0%) | 0 (0.0%) |
| 18 to 34 Years | 32 (16.8%) | 0 (0.0%) |
| 35 to 64 Years | 0 (0.0%) | 0 (0.0%) |
| 65 to 74 Years | 0 (0.0%) | 0 (0.0%) |
| 75 Years and over | 0 (0.0%) | 0 (0.0%) |
Disability Class: Cognitive Difficulty
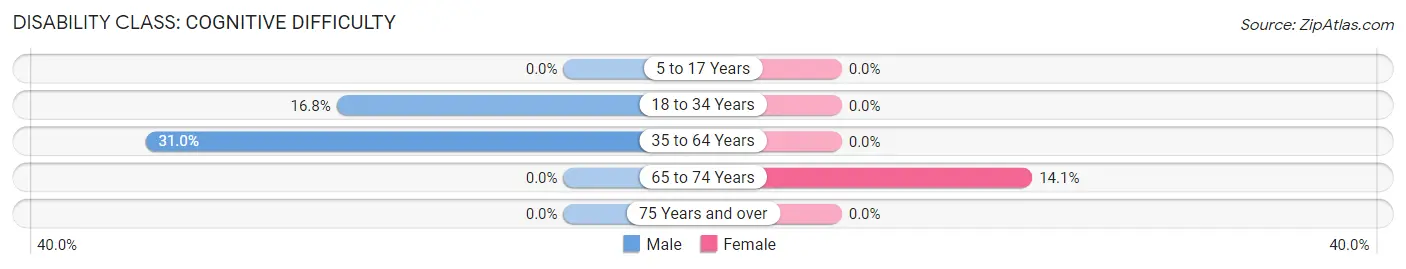
| Age Bracket | Male | Female |
| 5 to 17 Years | 0 (0.0%) | 0 (0.0%) |
| 18 to 34 Years | 32 (16.8%) | 0 (0.0%) |
| 35 to 64 Years | 67 (31.0%) | 0 (0.0%) |
| 65 to 74 Years | 0 (0.0%) | 14 (14.1%) |
| 75 Years and over | 0 (0.0%) | 0 (0.0%) |
Disability Class: Ambulatory Difficulty
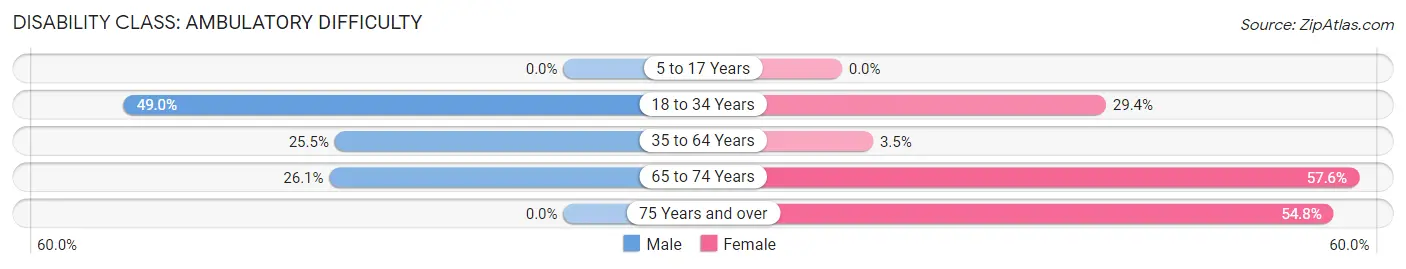
| Age Bracket | Male | Female |
| 5 to 17 Years | 0 (0.0%) | 0 (0.0%) |
| 18 to 34 Years | 93 (48.9%) | 25 (29.4%) |
| 35 to 64 Years | 55 (25.5%) | 6 (3.5%) |
| 65 to 74 Years | 37 (26.1%) | 57 (57.6%) |
| 75 Years and over | 0 (0.0%) | 23 (54.8%) |
Disability Class: Self-Care Difficulty
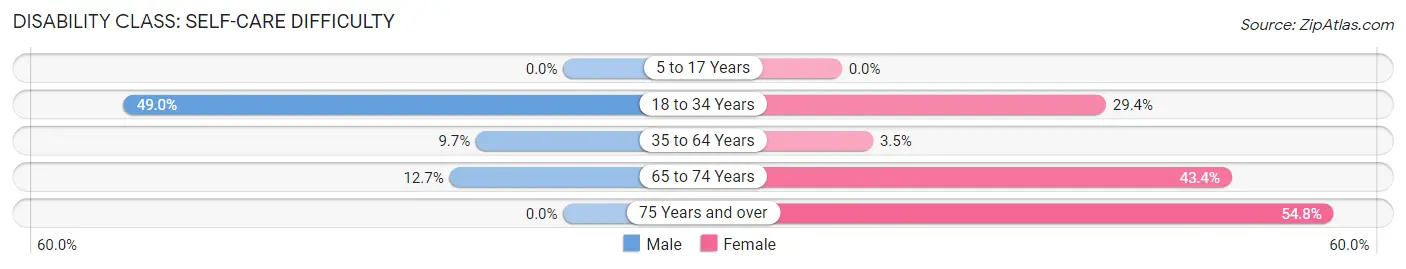
| Age Bracket | Male | Female |
| 5 to 17 Years | 0 (0.0%) | 0 (0.0%) |
| 18 to 34 Years | 93 (48.9%) | 25 (29.4%) |
| 35 to 64 Years | 21 (9.7%) | 6 (3.5%) |
| 65 to 74 Years | 18 (12.7%) | 43 (43.4%) |
| 75 Years and over | 0 (0.0%) | 23 (54.8%) |
Technology Access in Westwood
Computing Device Access in Westwood
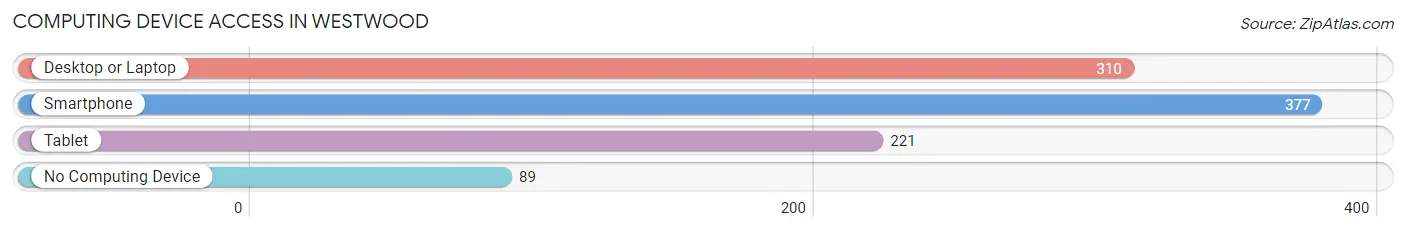
| Device Type | # Households | % Households |
| Desktop or Laptop | 310 | 64.2% |
| Smartphone | 377 | 78.0% |
| Tablet | 221 | 45.8% |
| No Computing Device | 89 | 18.4% |
| Total | 483 | 100.0% |
Internet Access in Westwood
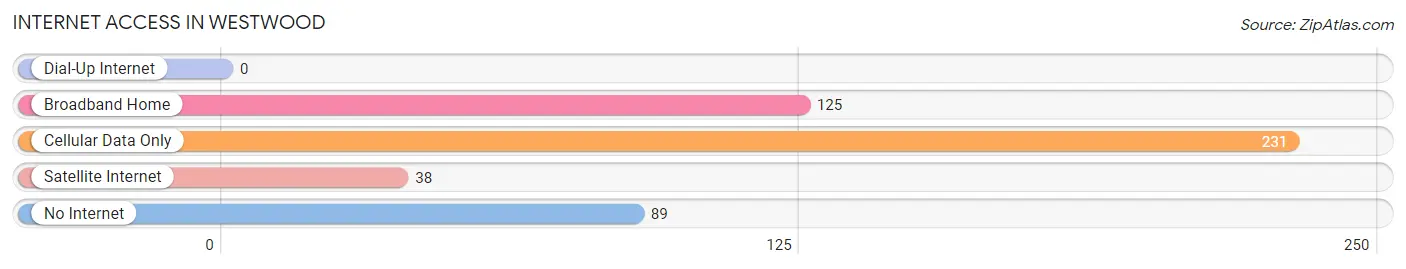
| Internet Type | # Households | % Households |
| Dial-Up Internet | 0 | 0.0% |
| Broadband Home | 125 | 25.9% |
| Cellular Data Only | 231 | 47.8% |
| Satellite Internet | 38 | 7.9% |
| No Internet | 89 | 18.4% |
| Total | 483 | 100.0% |
Westwood Summary
Westwood is a small, unincorporated community located in Los Angeles County, California. It is situated in the foothills of the Santa Monica Mountains, just north of the city of Los Angeles. Westwood is bordered by the cities of Beverly Hills, Bel Air, and Brentwood. The population of Westwood was estimated to be around 12,000 in 2020.
History
Westwood was originally part of the Rancho San Vicente y Santa Monica, a Spanish land grant given to Francisco Sepulveda in 1839. The area was later developed by the Janss Investment Company, which purchased the land in 1910. The Janss Investment Company developed the area into a residential community, and in 1927, the Westwood Village shopping center was opened.
The area experienced a period of rapid growth in the 1950s and 1960s, when many celebrities and wealthy individuals moved to the area. This period of growth was followed by a period of decline in the 1970s and 1980s, when many of the area’s residents moved away.
Geography
Westwood is located in the foothills of the Santa Monica Mountains, just north of the city of Los Angeles. It is bordered by the cities of Beverly Hills, Bel Air, and Brentwood. The area is characterized by its hilly terrain and its proximity to the Pacific Ocean.
Economy
Westwood is primarily a residential community, and the majority of its residents are employed in the nearby cities of Los Angeles and Beverly Hills. The area is also home to several businesses, including restaurants, retail stores, and professional services.
Demographics
Westwood is a diverse community, with a population that is estimated to be around 12,000 in 2020. The population is primarily white (60%), followed by Asian (20%), Hispanic (15%), and African American (5%). The median household income in Westwood is $90,000, and the median home value is $1.2 million. The area is also home to a large number of college students, as it is located near several universities, including UCLA and USC.
Common Questions
What is Per Capita Income in Westwood?
Per Capita income in Westwood is $19,472.
What is the Median Family Income in Westwood?
Median Family Income in Westwood is $53,000.
What is the Median Household income in Westwood?
Median Household Income in Westwood is $34,960.
What is Inequality or Gini Index in Westwood?
Inequality or Gini Index in Westwood is 0.39.
What is the Total Population of Westwood?
Total Population of Westwood is 1,116.
What is the Total Male Population of Westwood?
Total Male Population of Westwood is 660.
What is the Total Female Population of Westwood?
Total Female Population of Westwood is 456.
What is the Ratio of Males per 100 Females in Westwood?
There are 144.74 Males per 100 Females in Westwood.
What is the Ratio of Females per 100 Males in Westwood?
There are 69.09 Females per 100 Males in Westwood.
What is the Median Population Age in Westwood?
Median Population Age in Westwood is 47.8 Years.
What is the Average Family Size in Westwood
Average Family Size in Westwood is 2.6 People.
What is the Average Household Size in Westwood
Average Household Size in Westwood is 2.3 People.
How Large is the Labor Force in Westwood?
There are 337 People in the Labor Forcein in Westwood.
What is the Percentage of People in the Labor Force in Westwood?
35.1% of People are in the Labor Force in Westwood.
What is the Unemployment Rate in Westwood?
Unemployment Rate in Westwood is 18.7%.