Montgomery Creek, CA Map & Demographics
Montgomery Creek Map
Montgomery Creek Overview
$44,600
PER CAPITA INCOME
0.51
INEQUALITY / GINI INDEX
214
TOTAL POPULATION
98
MALE POPULATION
116
FEMALE POPULATION
84.48
MALES / 100 FEMALES
118.37
FEMALES / 100 MALES
62.2
MEDIAN AGE
2.9
AVG FAMILY SIZE
2.4
AVG HOUSEHOLD SIZE
121
LABOR FORCE [ PEOPLE ]
57.6%
PERCENT IN LABOR FORCE
27.3%
UNEMPLOYMENT RATE
Montgomery Creek Zip Codes
Montgomery Creek Area Codes
Income in Montgomery Creek
Income Overview in Montgomery Creek
| Characteristic | Number | Measure |
| Per Capita Income | 214 | $44,600 |
| Median Family Income | 51 | $0 |
| Mean Family Income | 51 | $156,759 |
| Median Household Income | 88 | $0 |
| Mean Household Income | 88 | $109,381 |
| Income Deficit | 51 | $0 |
| Wage / Income Gap (%) | 214 | 0.00% |
| Wage / Income Gap ($) | 214 | 100.00¢ per $1 |
| Gini / Inequality Index | 214 | 0.51 |
Earnings by Sex in Montgomery Creek
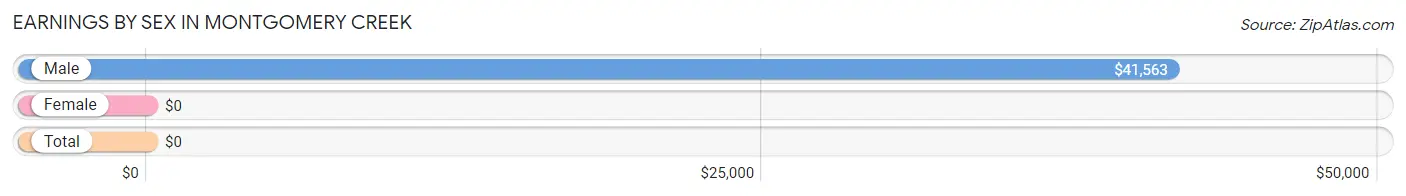
| Sex | Number | Average Earnings |
| Male | 57 (54.3%) | $41,563 |
| Female | 48 (45.7%) | $0 |
| Total | 105 (100.0%) | $0 |
Earnings by Sex by Income Bracket in Montgomery Creek
The most common earnings brackets in Montgomery Creek are $40,000 to $44,999 for men (20 | 35.1%) and $75,000 to $99,999 for women (25 | 52.1%).
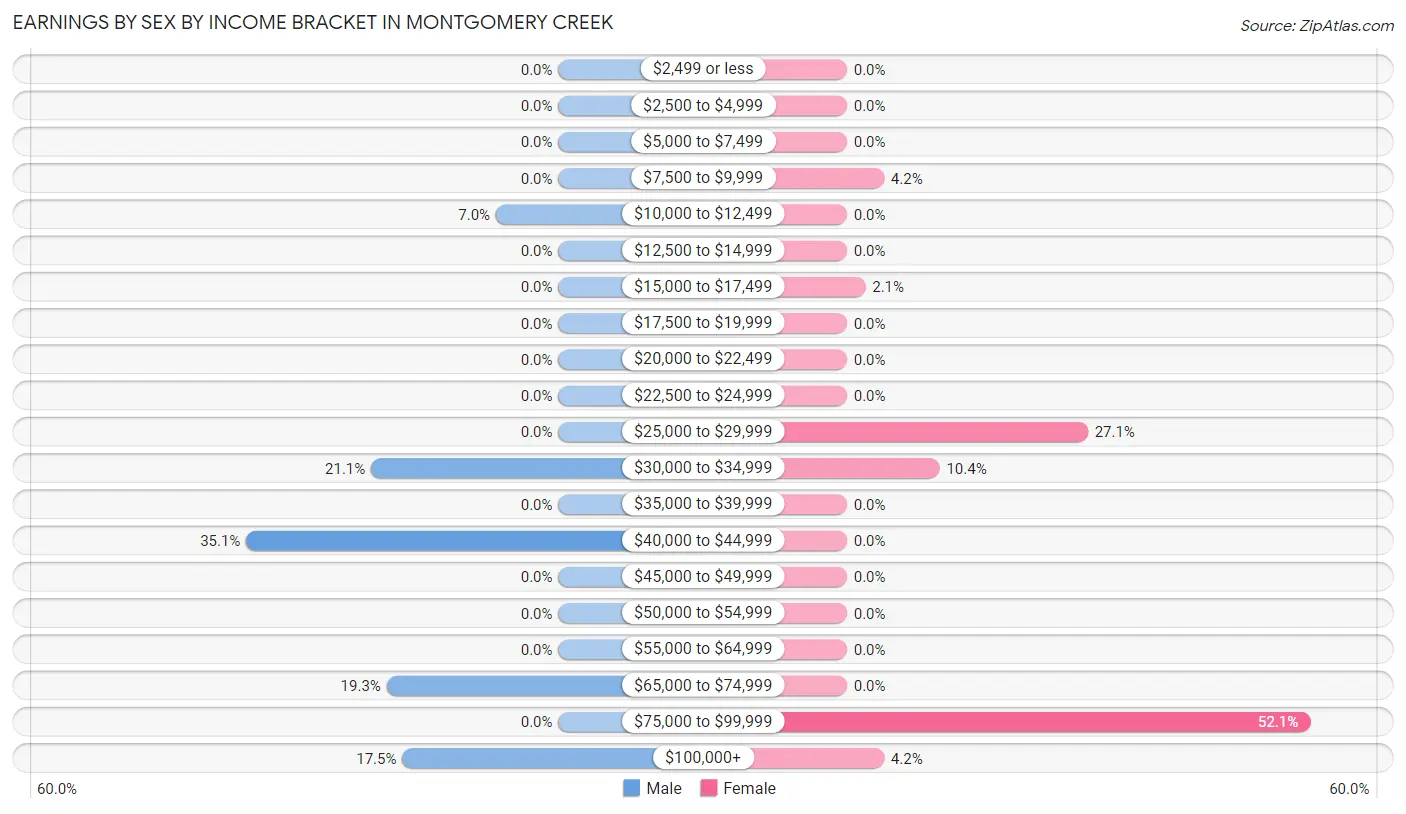
| Income | Male | Female |
| $2,499 or less | 0 (0.0%) | 0 (0.0%) |
| $2,500 to $4,999 | 0 (0.0%) | 0 (0.0%) |
| $5,000 to $7,499 | 0 (0.0%) | 0 (0.0%) |
| $7,500 to $9,999 | 0 (0.0%) | 2 (4.2%) |
| $10,000 to $12,499 | 4 (7.0%) | 0 (0.0%) |
| $12,500 to $14,999 | 0 (0.0%) | 0 (0.0%) |
| $15,000 to $17,499 | 0 (0.0%) | 1 (2.1%) |
| $17,500 to $19,999 | 0 (0.0%) | 0 (0.0%) |
| $20,000 to $22,499 | 0 (0.0%) | 0 (0.0%) |
| $22,500 to $24,999 | 0 (0.0%) | 0 (0.0%) |
| $25,000 to $29,999 | 0 (0.0%) | 13 (27.1%) |
| $30,000 to $34,999 | 12 (21.0%) | 5 (10.4%) |
| $35,000 to $39,999 | 0 (0.0%) | 0 (0.0%) |
| $40,000 to $44,999 | 20 (35.1%) | 0 (0.0%) |
| $45,000 to $49,999 | 0 (0.0%) | 0 (0.0%) |
| $50,000 to $54,999 | 0 (0.0%) | 0 (0.0%) |
| $55,000 to $64,999 | 0 (0.0%) | 0 (0.0%) |
| $65,000 to $74,999 | 11 (19.3%) | 0 (0.0%) |
| $75,000 to $99,999 | 0 (0.0%) | 25 (52.1%) |
| $100,000+ | 10 (17.5%) | 2 (4.2%) |
| Total | 57 (100.0%) | 48 (100.0%) |
Earnings by Sex by Educational Attainment in Montgomery Creek
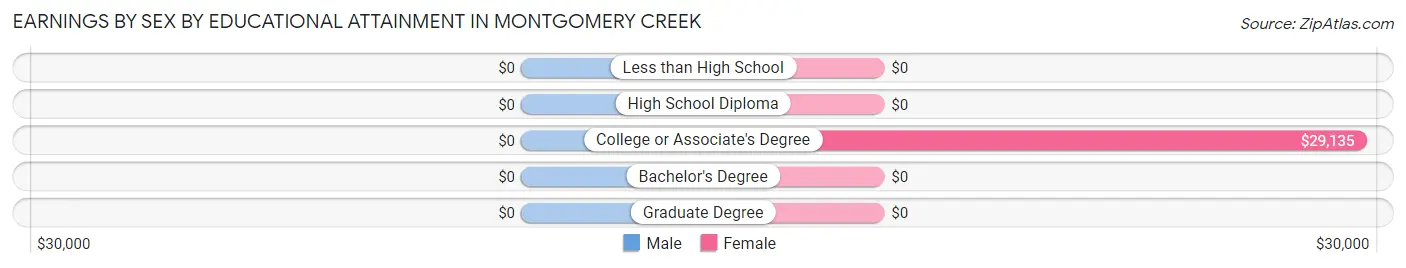
| Educational Attainment | Male Income | Female Income |
| Less than High School | - | - |
| High School Diploma | - | - |
| College or Associate's Degree | - | - |
| Bachelor's Degree | - | - |
| Graduate Degree | - | - |
| Total | $41,563 | $0 |
Family Income in Montgomery Creek
Family Income Brackets in Montgomery Creek
According to the Montgomery Creek family income data, there are 24 families falling into the $200,000+ income range, which is the most common income bracket and makes up 47.1% of all families.
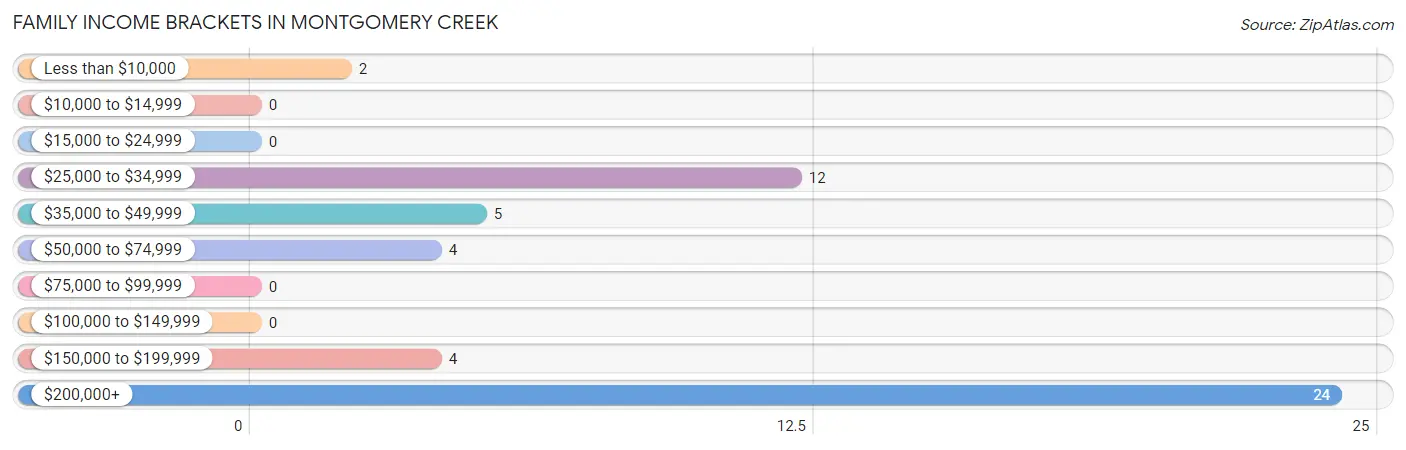
| Income Bracket | # Families | % Families |
| Less than $10,000 | 2 | 3.9% |
| $10,000 to $14,999 | 0 | 0.0% |
| $15,000 to $24,999 | 0 | 0.0% |
| $25,000 to $34,999 | 12 | 23.5% |
| $35,000 to $49,999 | 5 | 9.8% |
| $50,000 to $74,999 | 4 | 7.8% |
| $75,000 to $99,999 | 0 | 0.0% |
| $100,000 to $149,999 | 0 | 0.0% |
| $150,000 to $199,999 | 4 | 7.8% |
| $200,000+ | 24 | 47.1% |
Family Income by Famaliy Size in Montgomery Creek
2-person families (23 | 45.1%) account for the highest median family income in Montgomery Creek with $34,432 per family, while 2-person families (23 | 45.1%) have the highest median income of $17,216 per family member.
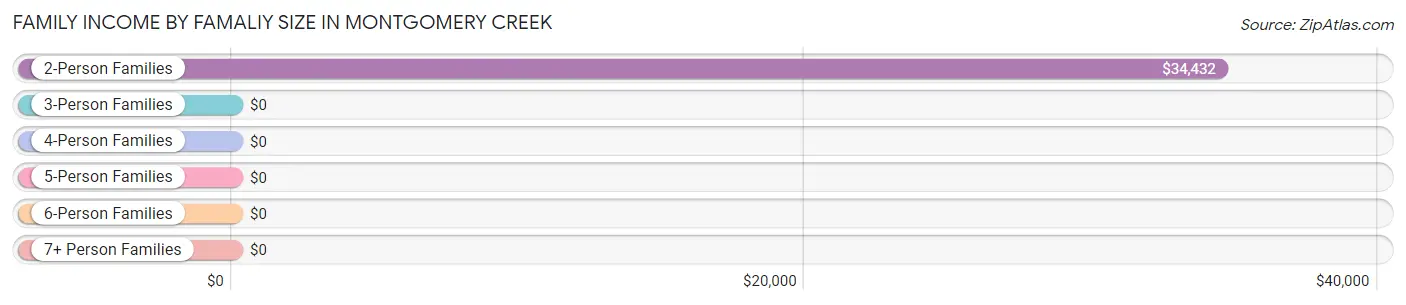
| Income Bracket | # Families | Median Income |
| 2-Person Families | 23 (45.1%) | $34,432 |
| 3-Person Families | 17 (33.3%) | $0 |
| 4-Person Families | 11 (21.6%) | $0 |
| 5-Person Families | 0 (0.0%) | $0 |
| 6-Person Families | 0 (0.0%) | $0 |
| 7+ Person Families | 0 (0.0%) | $0 |
| Total | 51 (100.0%) | $0 |
Family Income by Number of Earners in Montgomery Creek
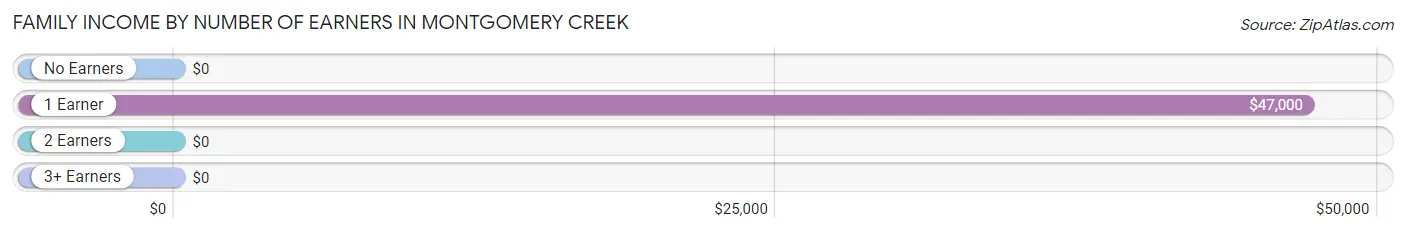
| Number of Earners | # Families | Median Income |
| No Earners | 17 (33.3%) | $0 |
| 1 Earner | 10 (19.6%) | $47,000 |
| 2 Earners | 13 (25.5%) | $0 |
| 3+ Earners | 11 (21.6%) | $0 |
| Total | 51 (100.0%) | $0 |
Household Income in Montgomery Creek
Household Income Brackets in Montgomery Creek
With 41 households falling in the category, the $25,000 to $34,999 income range is the most frequent in Montgomery Creek, accounting for 46.6% of all households.
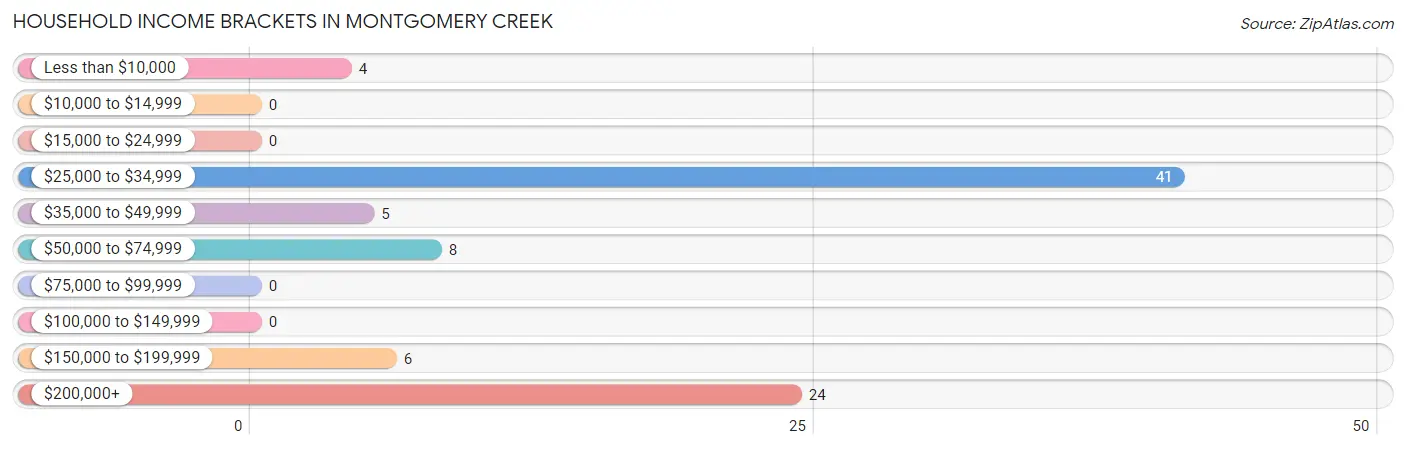
| Income Bracket | # Households | % Households |
| Less than $10,000 | 4 | 4.5% |
| $10,000 to $14,999 | 0 | 0.0% |
| $15,000 to $24,999 | 0 | 0.0% |
| $25,000 to $34,999 | 41 | 46.6% |
| $35,000 to $49,999 | 5 | 5.7% |
| $50,000 to $74,999 | 8 | 9.1% |
| $75,000 to $99,999 | 0 | 0.0% |
| $100,000 to $149,999 | 0 | 0.0% |
| $150,000 to $199,999 | 6 | 6.8% |
| $200,000+ | 24 | 27.3% |
Household Income by Householder Age in Montgomery Creek
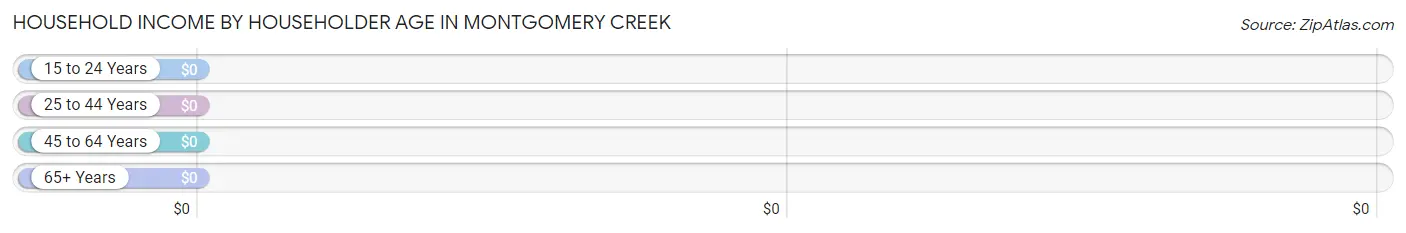
| Income Bracket | # Households | Median Income |
| 15 to 24 Years | 0 (0.0%) | $0 |
| 25 to 44 Years | 2 (2.3%) | $0 |
| 45 to 64 Years | 45 (51.1%) | $0 |
| 65+ Years | 41 (46.6%) | $0 |
| Total | 88 (100.0%) | $0 |
Poverty in Montgomery Creek
Income Below Poverty by Sex and Age in Montgomery Creek
With 2.1% poverty level for males and 14.7% for females among the residents of Montgomery Creek, 25 to 34 year old males and 55 to 64 year old females are the most vulnerable to poverty, with 2 males (50.0%) and 16 females (45.7%) in their respective age groups living below the poverty level.
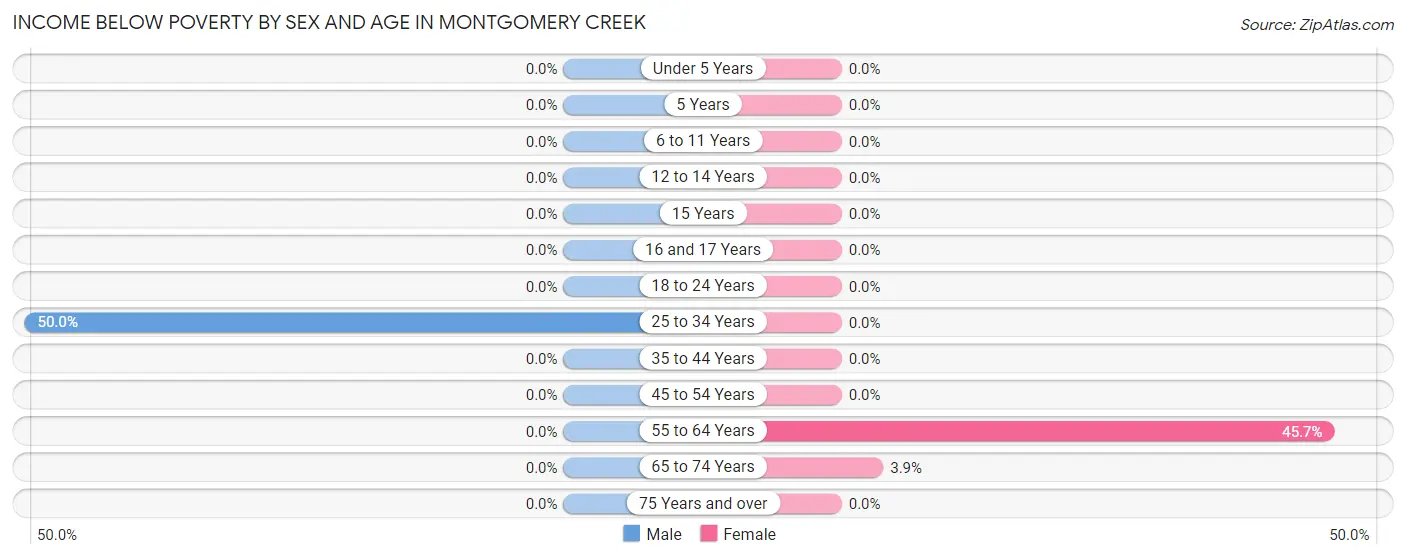
| Age Bracket | Male | Female |
| Under 5 Years | 0 (0.0%) | 0 (0.0%) |
| 5 Years | 0 (0.0%) | 0 (0.0%) |
| 6 to 11 Years | 0 (0.0%) | 0 (0.0%) |
| 12 to 14 Years | 0 (0.0%) | 0 (0.0%) |
| 15 Years | 0 (0.0%) | 0 (0.0%) |
| 16 and 17 Years | 0 (0.0%) | 0 (0.0%) |
| 18 to 24 Years | 0 (0.0%) | 0 (0.0%) |
| 25 to 34 Years | 2 (50.0%) | 0 (0.0%) |
| 35 to 44 Years | 0 (0.0%) | 0 (0.0%) |
| 45 to 54 Years | 0 (0.0%) | 0 (0.0%) |
| 55 to 64 Years | 0 (0.0%) | 16 (45.7%) |
| 65 to 74 Years | 0 (0.0%) | 1 (3.8%) |
| 75 Years and over | 0 (0.0%) | 0 (0.0%) |
| Total | 2 (2.1%) | 17 (14.7%) |
Income Above Poverty by Sex and Age in Montgomery Creek
According to the poverty statistics in Montgomery Creek, males aged 16 and 17 years and females aged 12 to 14 years are the age groups that are most secure financially, with 100.0% of males and 100.0% of females in these age groups living above the poverty line.
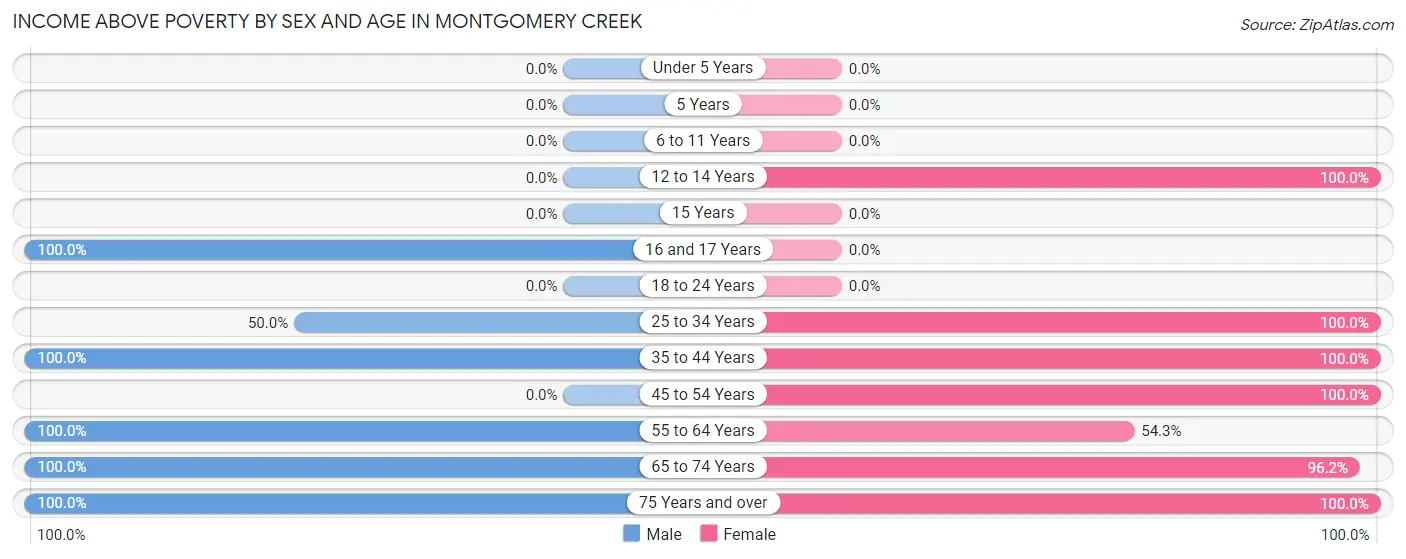
| Age Bracket | Male | Female |
| Under 5 Years | 0 (0.0%) | 0 (0.0%) |
| 5 Years | 0 (0.0%) | 0 (0.0%) |
| 6 to 11 Years | 0 (0.0%) | 0 (0.0%) |
| 12 to 14 Years | 0 (0.0%) | 3 (100.0%) |
| 15 Years | 0 (0.0%) | 0 (0.0%) |
| 16 and 17 Years | 5 (100.0%) | 0 (0.0%) |
| 18 to 24 Years | 0 (0.0%) | 0 (0.0%) |
| 25 to 34 Years | 2 (50.0%) | 14 (100.0%) |
| 35 to 44 Years | 20 (100.0%) | 12 (100.0%) |
| 45 to 54 Years | 0 (0.0%) | 13 (100.0%) |
| 55 to 64 Years | 27 (100.0%) | 19 (54.3%) |
| 65 to 74 Years | 8 (100.0%) | 25 (96.2%) |
| 75 Years and over | 33 (100.0%) | 13 (100.0%) |
| Total | 95 (97.9%) | 99 (85.3%) |
Income Below Poverty Among Married-Couple Families in Montgomery Creek
| Children | Above Poverty | Below Poverty |
| No Children | 28 (100.0%) | 0 (0.0%) |
| 1 or 2 Children | 4 (100.0%) | 0 (0.0%) |
| 3 or 4 Children | 0 (0.0%) | 0 (0.0%) |
| 5 or more Children | 0 (0.0%) | 0 (0.0%) |
| Total | 32 (100.0%) | 0 (0.0%) |
Income Below Poverty Among Single-Parent Households in Montgomery Creek
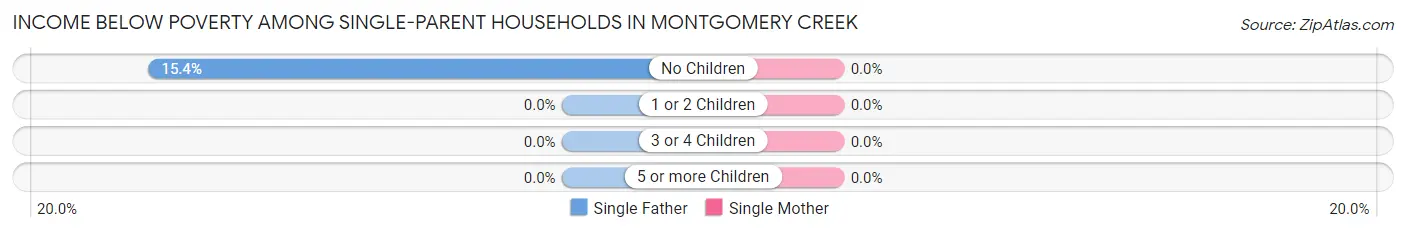
| Children | Single Father | Single Mother |
| No Children | 2 (15.4%) | 0 (0.0%) |
| 1 or 2 Children | 0 (0.0%) | 0 (0.0%) |
| 3 or 4 Children | 0 (0.0%) | 0 (0.0%) |
| 5 or more Children | 0 (0.0%) | 0 (0.0%) |
| Total | 2 (15.4%) | 0 (0.0%) |
Income Below Poverty Among Married-Couple vs Single-Parent Households in Montgomery Creek
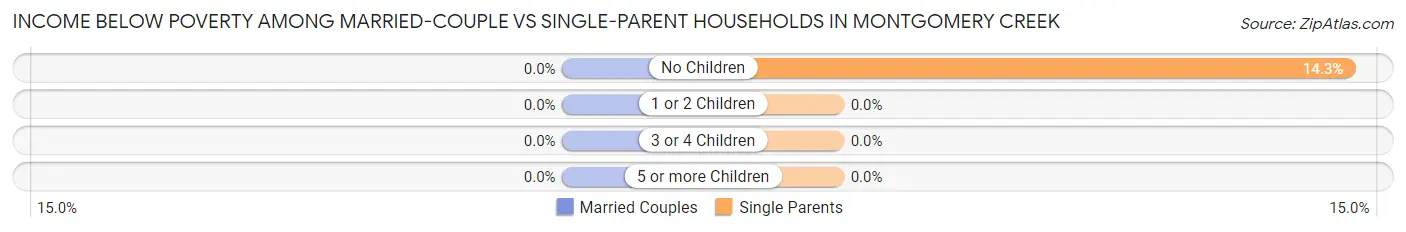
| Children | Married-Couple Families | Single-Parent Households |
| No Children | 0 (0.0%) | 2 (14.3%) |
| 1 or 2 Children | 0 (0.0%) | 0 (0.0%) |
| 3 or 4 Children | 0 (0.0%) | 0 (0.0%) |
| 5 or more Children | 0 (0.0%) | 0 (0.0%) |
| Total | 0 (0.0%) | 2 (10.5%) |
Race in Montgomery Creek
The most populous races in Montgomery Creek are White / Caucasian (131 | 61.2%), Hispanic or Latino (70 | 32.7%), and Two or more Races (70 | 32.7%).
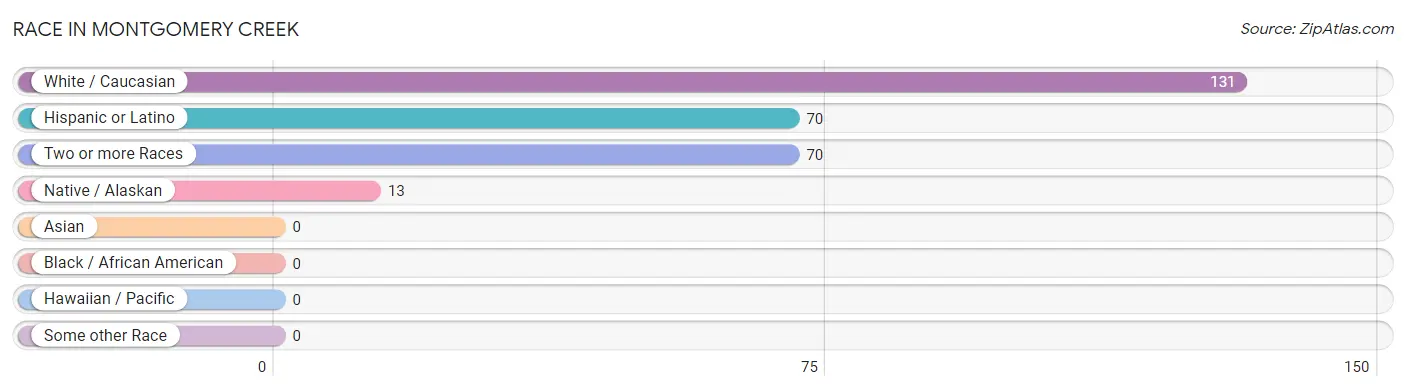
| Race | # Population | % Population |
| Asian | 0 | 0.0% |
| Black / African American | 0 | 0.0% |
| Hawaiian / Pacific | 0 | 0.0% |
| Hispanic or Latino | 70 | 32.7% |
| Native / Alaskan | 13 | 6.1% |
| White / Caucasian | 131 | 61.2% |
| Two or more Races | 70 | 32.7% |
| Some other Race | 0 | 0.0% |
| Total | 214 | 100.0% |
Ancestry in Montgomery Creek
The most populous ancestries reported in Montgomery Creek are Mexican (70 | 32.7%), Swiss (27 | 12.6%), American (24 | 11.2%), English (20 | 9.3%), and German (13 | 6.1%), together accounting for 72.0% of all Montgomery Creek residents.
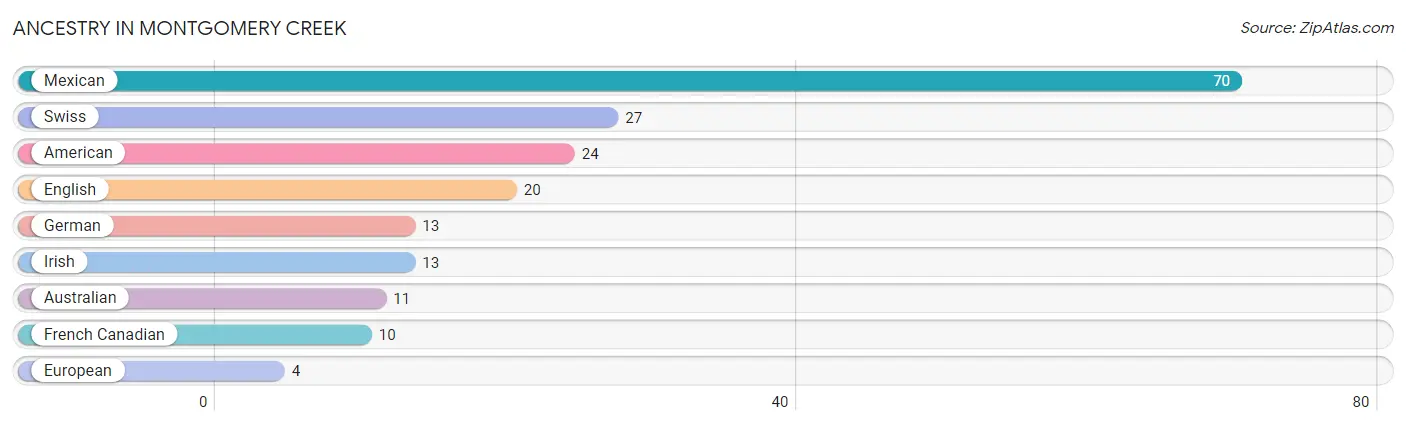
| Ancestry | # Population | % Population |
| American | 24 | 11.2% |
| Australian | 11 | 5.1% |
| English | 20 | 9.3% |
| European | 4 | 1.9% |
| French Canadian | 10 | 4.7% |
| German | 13 | 6.1% |
| Irish | 13 | 6.1% |
| Mexican | 70 | 32.7% |
| Swiss | 27 | 12.6% | View All 9 Rows |
Immigrants in Montgomery Creek
The most numerous immigrant groups reported in Montgomery Creek came from Central America (55 | 25.7%), Latin America (55 | 25.7%), Mexico (35 | 16.4%), and Nicaragua (20 | 9.3%), together accounting for 77.1% of all Montgomery Creek residents.
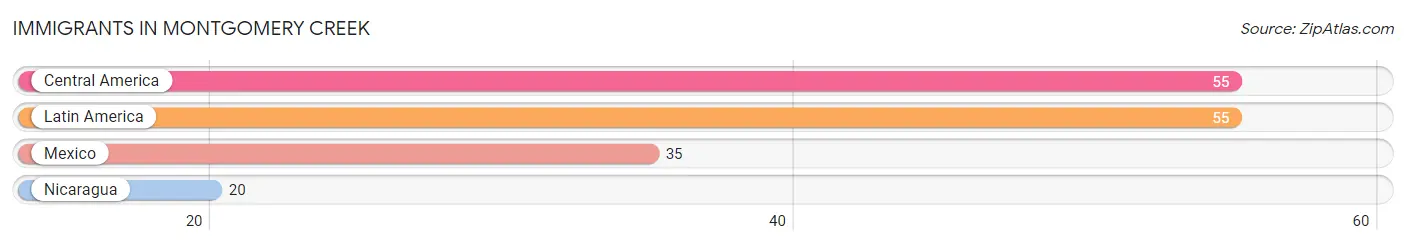
| Immigration Origin | # Population | % Population |
| Central America | 55 | 25.7% |
| Latin America | 55 | 25.7% |
| Mexico | 35 | 16.4% |
| Nicaragua | 20 | 9.3% | View All 4 Rows |
Sex and Age in Montgomery Creek
Sex and Age in Montgomery Creek
The most populous age groups in Montgomery Creek are 75 to 79 Years (30 | 30.6%) for men and 55 to 59 Years (18 | 15.5%) for women.
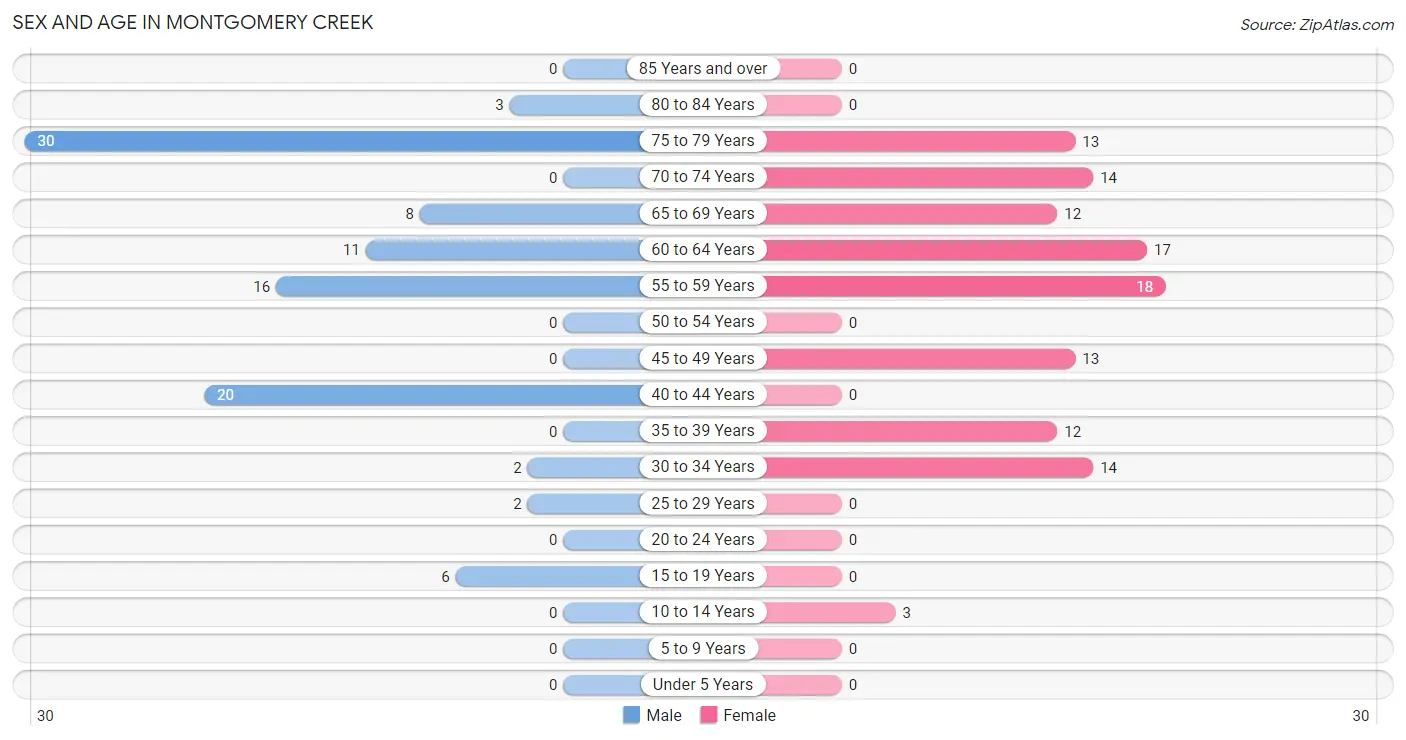
| Age Bracket | Male | Female |
| Under 5 Years | 0 (0.0%) | 0 (0.0%) |
| 5 to 9 Years | 0 (0.0%) | 0 (0.0%) |
| 10 to 14 Years | 0 (0.0%) | 3 (2.6%) |
| 15 to 19 Years | 6 (6.1%) | 0 (0.0%) |
| 20 to 24 Years | 0 (0.0%) | 0 (0.0%) |
| 25 to 29 Years | 2 (2.0%) | 0 (0.0%) |
| 30 to 34 Years | 2 (2.0%) | 14 (12.1%) |
| 35 to 39 Years | 0 (0.0%) | 12 (10.3%) |
| 40 to 44 Years | 20 (20.4%) | 0 (0.0%) |
| 45 to 49 Years | 0 (0.0%) | 13 (11.2%) |
| 50 to 54 Years | 0 (0.0%) | 0 (0.0%) |
| 55 to 59 Years | 16 (16.3%) | 18 (15.5%) |
| 60 to 64 Years | 11 (11.2%) | 17 (14.7%) |
| 65 to 69 Years | 8 (8.2%) | 12 (10.3%) |
| 70 to 74 Years | 0 (0.0%) | 14 (12.1%) |
| 75 to 79 Years | 30 (30.6%) | 13 (11.2%) |
| 80 to 84 Years | 3 (3.1%) | 0 (0.0%) |
| 85 Years and over | 0 (0.0%) | 0 (0.0%) |
| Total | 98 (100.0%) | 116 (100.0%) |
Families and Households in Montgomery Creek
Median Family Size in Montgomery Creek
The median family size in Montgomery Creek is 2.88 persons per family, with single male/father families (13 | 25.5%) accounting for the largest median family size of 4.46 persons per family. On the other hand, single female/mother families (6 | 11.8%) represent the smallest median family size with 1.83 persons per family.
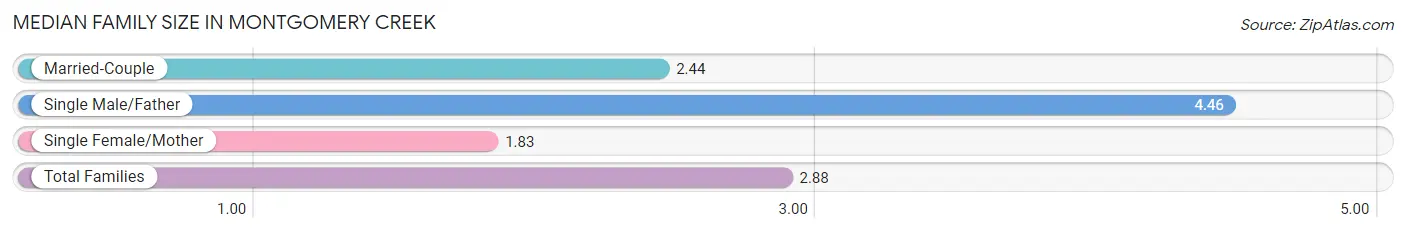
| Family Type | # Families | Family Size |
| Married-Couple | 32 (62.7%) | 2.44 |
| Single Male/Father | 13 (25.5%) | 4.46 |
| Single Female/Mother | 6 (11.8%) | 1.83 |
| Total Families | 51 (100.0%) | 2.88 |
Median Household Size in Montgomery Creek
The median household size in Montgomery Creek is 2.42 persons per household, with single male/father households (13 | 14.8%) accounting for the largest median household size of 4.46 persons per household. non-family households (37 | 42.0%) represent the smallest median household size with 1.41 persons per household.
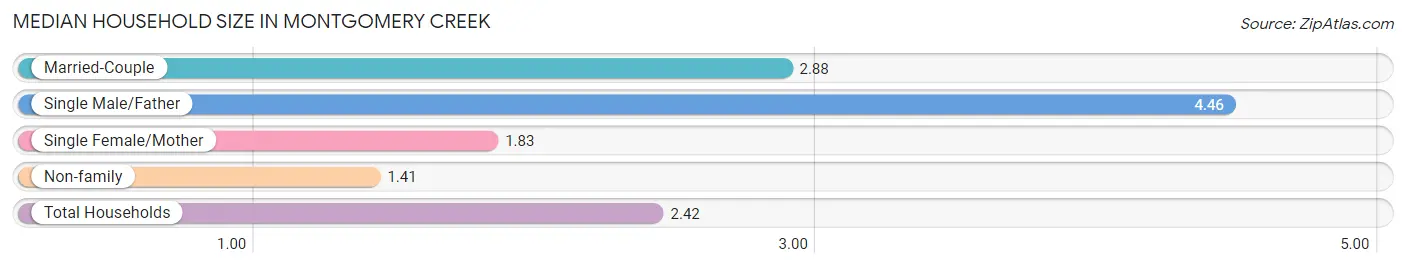
| Household Type | # Households | Household Size |
| Married-Couple | 32 (36.4%) | 2.88 |
| Single Male/Father | 13 (14.8%) | 4.46 |
| Single Female/Mother | 6 (6.8%) | 1.83 |
| Non-family | 37 (42.0%) | 1.41 |
| Total Households | 88 (100.0%) | 2.42 |
Household Size by Marriage Status in Montgomery Creek
Out of a total of 88 households in Montgomery Creek, 51 (58.0%) are family households, while 37 (42.0%) are nonfamily households. The most numerous type of family households are 4-person households, comprising 24, and the most common type of nonfamily households are 1-person households, comprising 20.
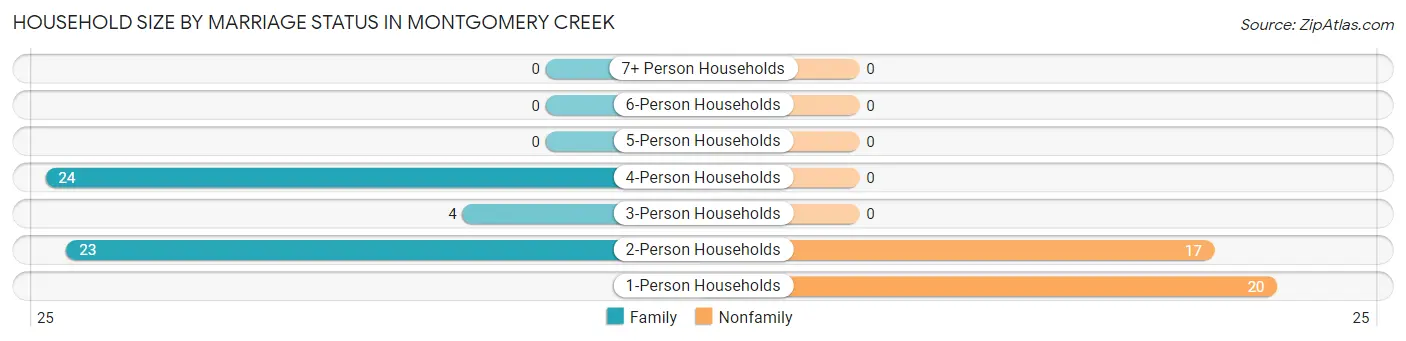
| Household Size | Family Households | Nonfamily Households |
| 1-Person Households | - | 20 (22.7%) |
| 2-Person Households | 23 (26.1%) | 17 (19.3%) |
| 3-Person Households | 4 (4.5%) | 0 (0.0%) |
| 4-Person Households | 24 (27.3%) | 0 (0.0%) |
| 5-Person Households | 0 (0.0%) | 0 (0.0%) |
| 6-Person Households | 0 (0.0%) | 0 (0.0%) |
| 7+ Person Households | 0 (0.0%) | 0 (0.0%) |
| Total | 51 (58.0%) | 37 (42.0%) |
Female Fertility in Montgomery Creek
Fertility by Age in Montgomery Creek
| Age Bracket | Women with Births | Births / 1,000 Women |
| 15 to 19 years | 0 (0.0%) | 0.0 |
| 20 to 34 years | 0 (0.0%) | 0.0 |
| 35 to 50 years | 0 (0.0%) | 0.0 |
| Total | 0 (0.0%) | 0.0 |
Fertility by Age by Marriage Status in Montgomery Creek
| Age Bracket | Married | Unmarried |
| 15 to 19 years | 0 (0.0%) | 0 (0.0%) |
| 20 to 34 years | 0 (0.0%) | 0 (0.0%) |
| 35 to 50 years | 0 (0.0%) | 0 (0.0%) |
| Total | 0 (0.0%) | 0 (0.0%) |
Fertility by Education in Montgomery Creek
| Educational Attainment | Women with Births | Births / 1,000 Women |
| Less than High School | 0 (0.0%) | 0.0 |
| High School Diploma | 0 (0.0%) | 0.0 |
| College or Associate's Degree | 0 (0.0%) | 0.0 |
| Bachelor's Degree | 0 (0.0%) | 0.0 |
| Graduate Degree | 0 (0.0%) | 0.0 |
| Total | 0 (0.0%) | 0.0 |
Fertility by Education by Marriage Status in Montgomery Creek
| Educational Attainment | Married | Unmarried |
| Less than High School | 0 (0.0%) | 0 (0.0%) |
| High School Diploma | 0 (0.0%) | 0 (0.0%) |
| College or Associate's Degree | 0 (0.0%) | 0 (0.0%) |
| Bachelor's Degree | 0 (0.0%) | 0 (0.0%) |
| Graduate Degree | 0 (0.0%) | 0 (0.0%) |
| Total | 0 (0.0%) | 0 (0.0%) |
Employment Characteristics in Montgomery Creek
Employment by Class of Employer in Montgomery Creek
Among the 88 employed individuals in Montgomery Creek, private company employees (53 | 60.2%), state government employees (25 | 28.4%), and local government employees (9 | 10.2%) make up the most common classes of employment.
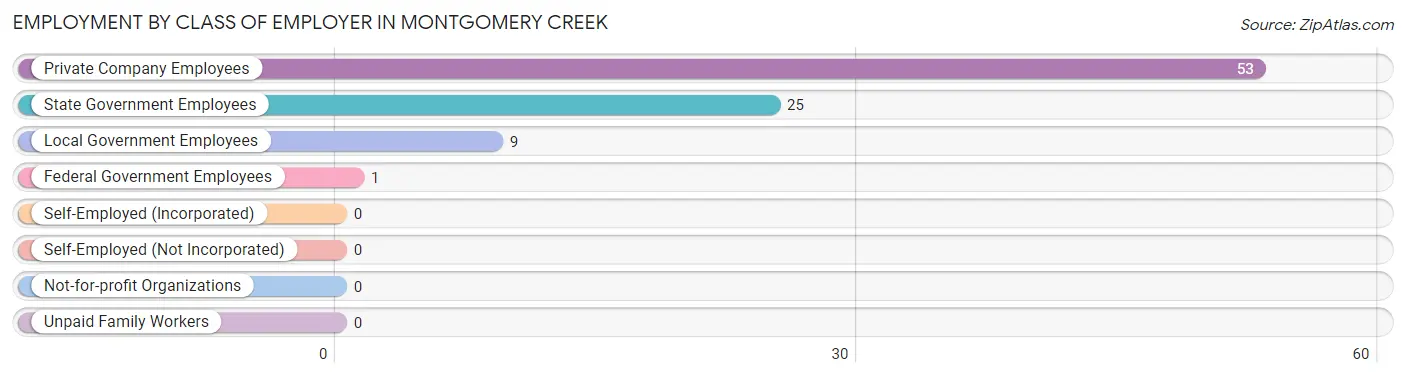
| Employer Class | # Employees | % Employees |
| Private Company Employees | 53 | 60.2% |
| Self-Employed (Incorporated) | 0 | 0.0% |
| Self-Employed (Not Incorporated) | 0 | 0.0% |
| Not-for-profit Organizations | 0 | 0.0% |
| Local Government Employees | 9 | 10.2% |
| State Government Employees | 25 | 28.4% |
| Federal Government Employees | 1 | 1.1% |
| Unpaid Family Workers | 0 | 0.0% |
| Total | 88 | 100.0% |
Employment Status by Age in Montgomery Creek
According to the labor force statistics for Montgomery Creek, out of the total population over 16 years of age (210), 57.6% or 121 individuals are in the labor force, with 27.3% or 33 of them unemployed. The age group with the highest labor force participation rate is 25 to 29 years, with 100.0% or 2 individuals in the labor force. Within the labor force, the 25 to 29 years age range has the highest percentage of unemployed individuals, with 100.0% or 2 of them being unemployed.
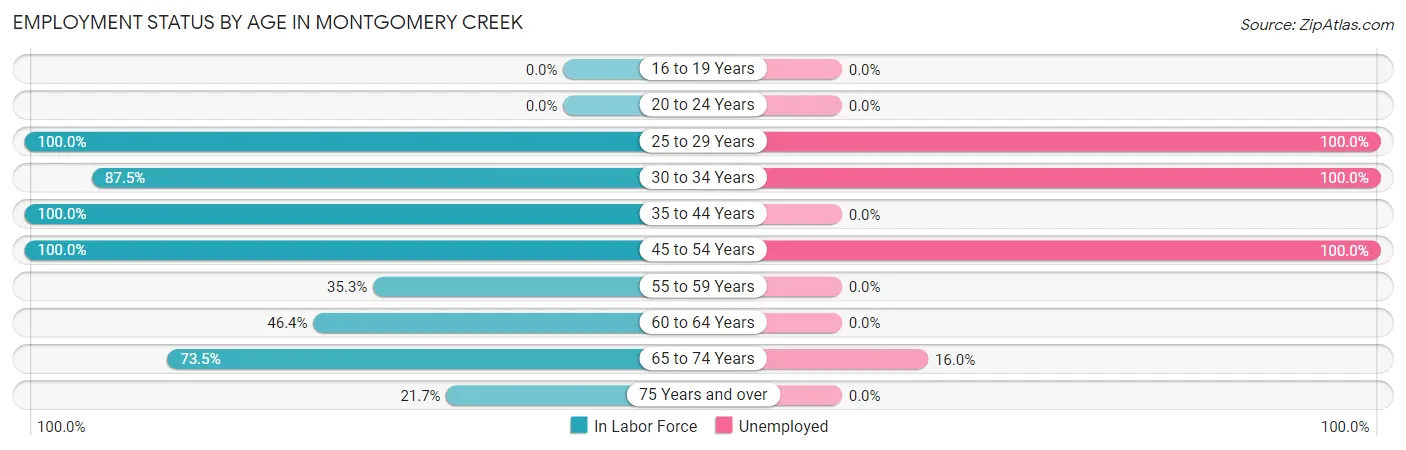
| Age Bracket | In Labor Force | Unemployed |
| 16 to 19 Years | 0 (0.0%) | 0 (0.0%) |
| 20 to 24 Years | 0 (0.0%) | 0 (0.0%) |
| 25 to 29 Years | 2 (100.0%) | 2 (100.0%) |
| 30 to 34 Years | 14 (87.5%) | 14 (100.0%) |
| 35 to 44 Years | 32 (100.0%) | 0 (0.0%) |
| 45 to 54 Years | 13 (100.0%) | 13 (100.0%) |
| 55 to 59 Years | 12 (35.3%) | 0 (0.0%) |
| 60 to 64 Years | 13 (46.4%) | 0 (0.0%) |
| 65 to 74 Years | 25 (73.5%) | 4 (16.0%) |
| 75 Years and over | 10 (21.7%) | 0 (0.0%) |
| Total | 121 (57.6%) | 33 (27.3%) |
Employment Status by Educational Attainment in Montgomery Creek
According to labor force statistics for Montgomery Creek, 68.8% of individuals (86) out of the total population between 25 and 64 years of age (125) are in the labor force, with 33.7% or 29 of them being unemployed. The group with the highest labor force participation rate are those with the educational attainment of college / associate degree, with 100.0% or 31 individuals in the labor force. Within the labor force, individuals with college / associate degree education have the highest percentage of unemployment, with 93.5% or 29 of them being unemployed.
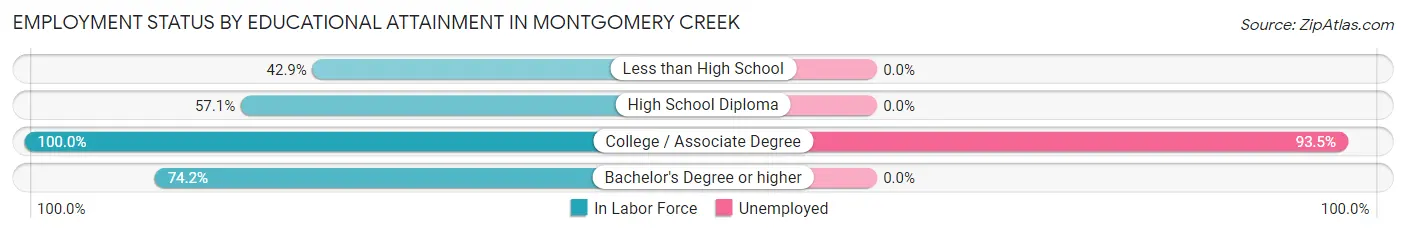
| Educational Attainment | In Labor Force | Unemployed |
| Less than High School | 12 (42.9%) | 0 (0.0%) |
| High School Diploma | 20 (57.1%) | 0 (0.0%) |
| College / Associate Degree | 31 (100.0%) | 29 (93.5%) |
| Bachelor's Degree or higher | 23 (74.2%) | 0 (0.0%) |
| Total | 86 (68.8%) | 42 (33.7%) |
Employment Occupations by Sex in Montgomery Creek
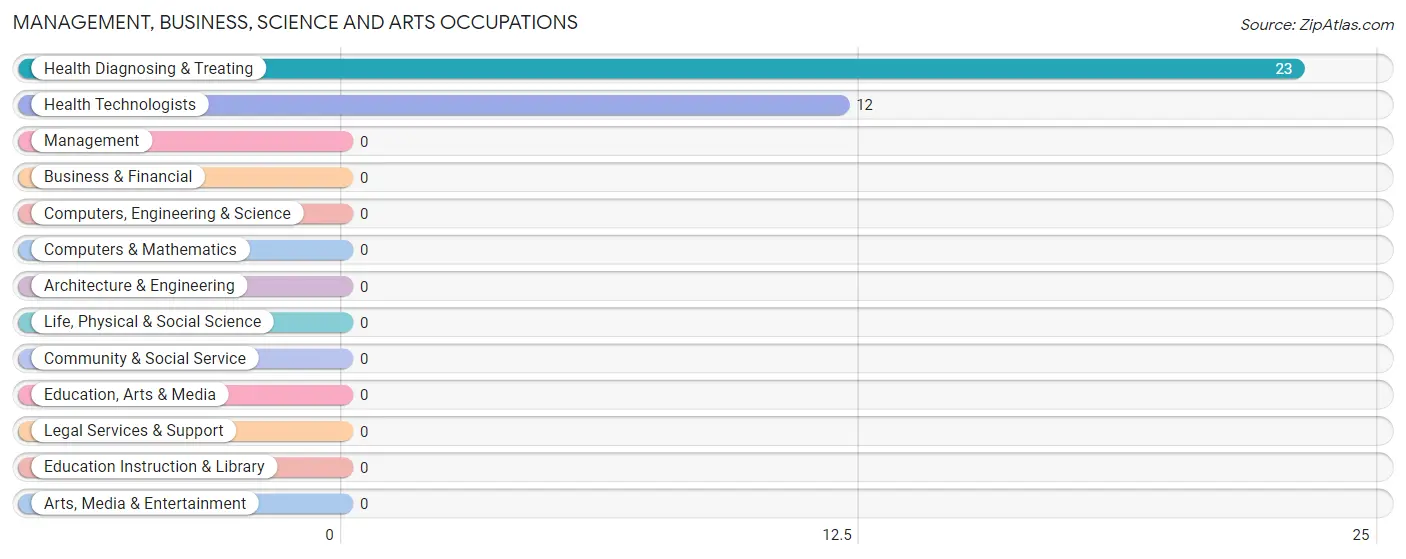
Management, Business, Science and Arts Occupations
The most common Management, Business, Science and Arts occupations in Montgomery Creek are Health Diagnosing & Treating (23 | 26.1%), and Health Technologists (12 | 13.6%).
Management, Business, Science and Arts Occupations by Sex
Within the Management, Business, Science and Arts occupations in Montgomery Creek, the most male-oriented occupations are Health Diagnosing & Treating (91.3%), and Health Technologists (83.3%), while the most female-oriented occupations are Health Technologists (16.7%), and Health Diagnosing & Treating (8.7%).
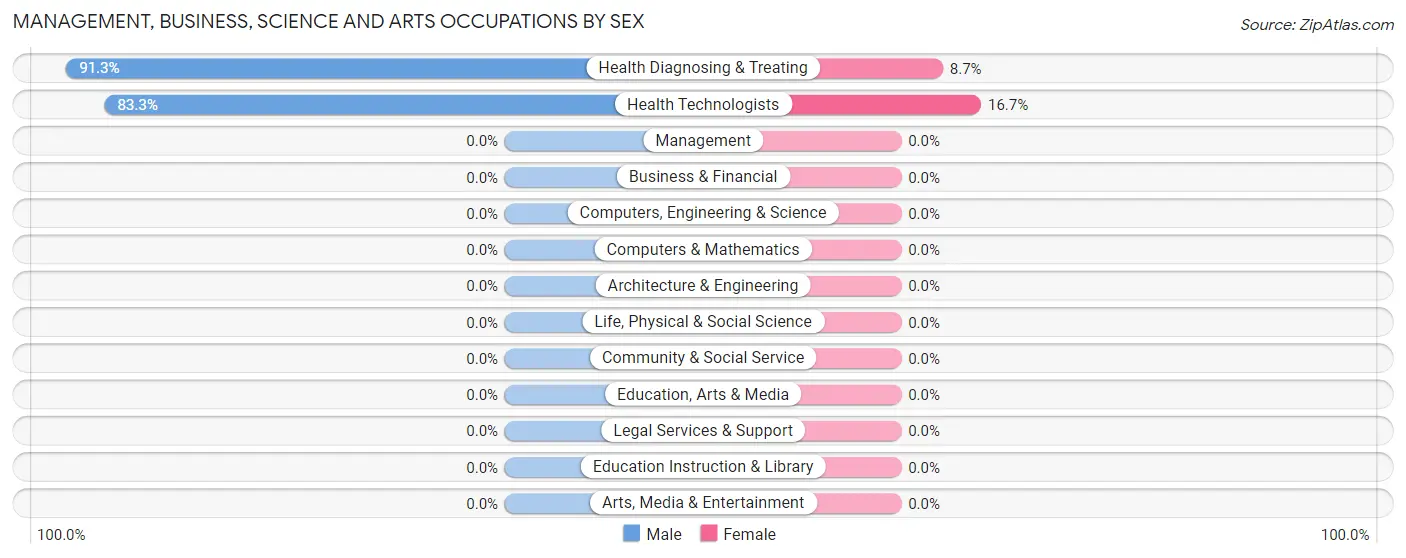
| Occupation | Male | Female |
| Management | 0 (0.0%) | 0 (0.0%) |
| Business & Financial | 0 (0.0%) | 0 (0.0%) |
| Computers, Engineering & Science | 0 (0.0%) | 0 (0.0%) |
| Computers & Mathematics | 0 (0.0%) | 0 (0.0%) |
| Architecture & Engineering | 0 (0.0%) | 0 (0.0%) |
| Life, Physical & Social Science | 0 (0.0%) | 0 (0.0%) |
| Community & Social Service | 0 (0.0%) | 0 (0.0%) |
| Education, Arts & Media | 0 (0.0%) | 0 (0.0%) |
| Legal Services & Support | 0 (0.0%) | 0 (0.0%) |
| Education Instruction & Library | 0 (0.0%) | 0 (0.0%) |
| Arts, Media & Entertainment | 0 (0.0%) | 0 (0.0%) |
| Health Diagnosing & Treating | 21 (91.3%) | 2 (8.7%) |
| Health Technologists | 10 (83.3%) | 2 (16.7%) |
| Total (Category) | 21 (91.3%) | 2 (8.7%) |
| Total (Overall) | 53 (60.2%) | 35 (39.8%) |
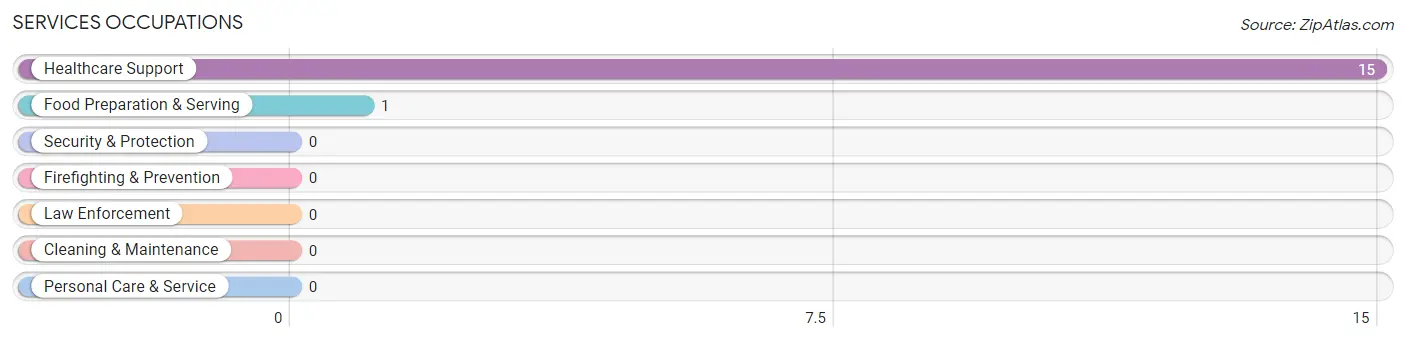
Services Occupations
The most common Services occupations in Montgomery Creek are Healthcare Support (15 | 17.1%), and Food Preparation & Serving (1 | 1.1%).
Services Occupations by Sex
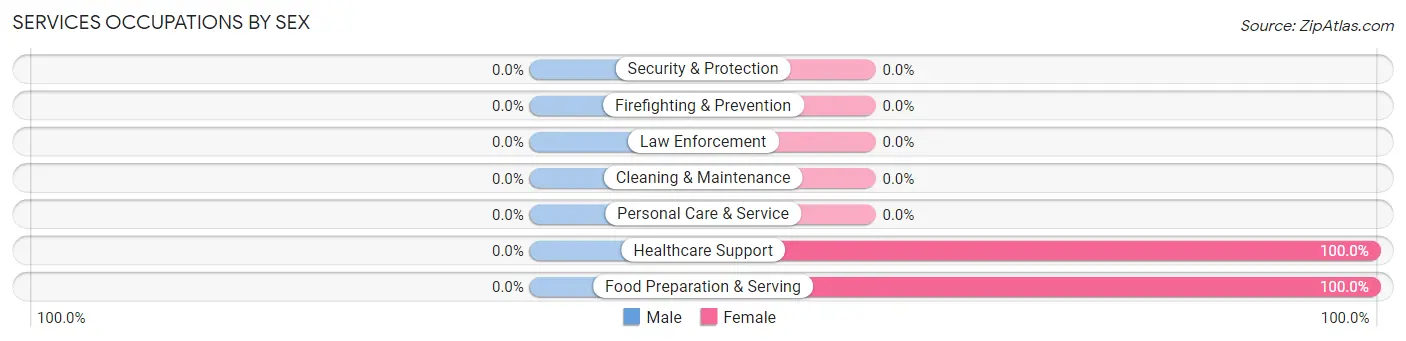
| Occupation | Male | Female |
| Healthcare Support | 0 (0.0%) | 15 (100.0%) |
| Security & Protection | 0 (0.0%) | 0 (0.0%) |
| Firefighting & Prevention | 0 (0.0%) | 0 (0.0%) |
| Law Enforcement | 0 (0.0%) | 0 (0.0%) |
| Food Preparation & Serving | 0 (0.0%) | 1 (100.0%) |
| Cleaning & Maintenance | 0 (0.0%) | 0 (0.0%) |
| Personal Care & Service | 0 (0.0%) | 0 (0.0%) |
| Total (Category) | 0 (0.0%) | 16 (100.0%) |
| Total (Overall) | 53 (60.2%) | 35 (39.8%) |
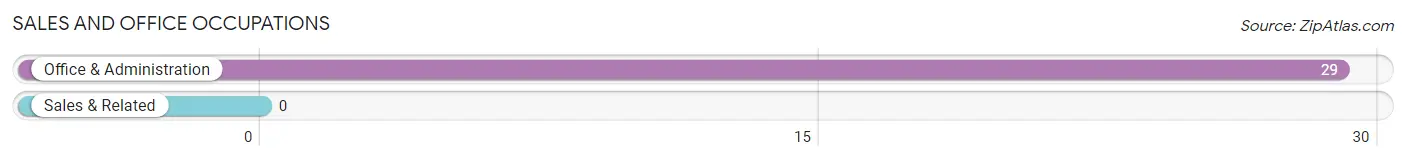
Sales and Office Occupations
The most common Sales and Office occupations in Montgomery Creek are , and Office & Administration (29 | 33.0%).
Sales and Office Occupations by Sex
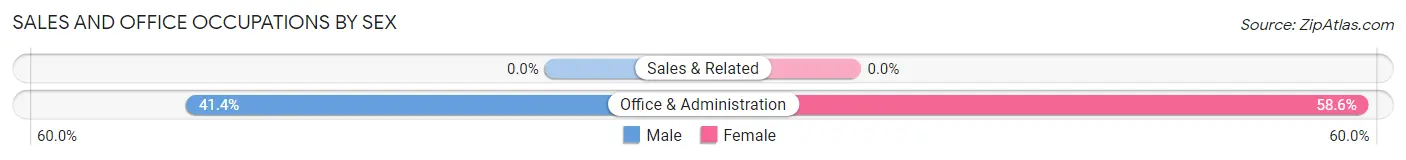
| Occupation | Male | Female |
| Sales & Related | 0 (0.0%) | 0 (0.0%) |
| Office & Administration | 12 (41.4%) | 17 (58.6%) |
| Total (Category) | 12 (41.4%) | 17 (58.6%) |
| Total (Overall) | 53 (60.2%) | 35 (39.8%) |
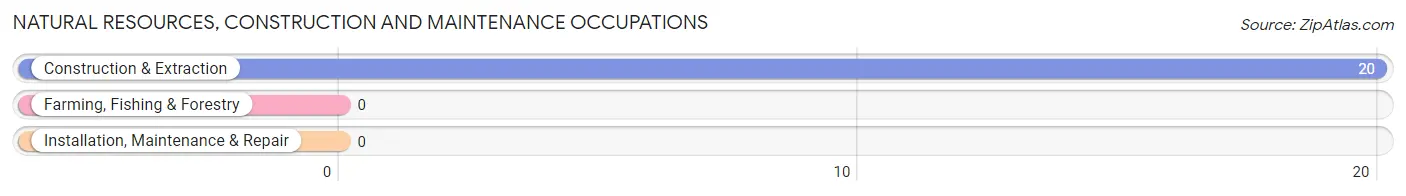
Natural Resources, Construction and Maintenance Occupations
The most common Natural Resources, Construction and Maintenance occupations in Montgomery Creek are , and Construction & Extraction (20 | 22.7%).
Natural Resources, Construction and Maintenance Occupations by Sex
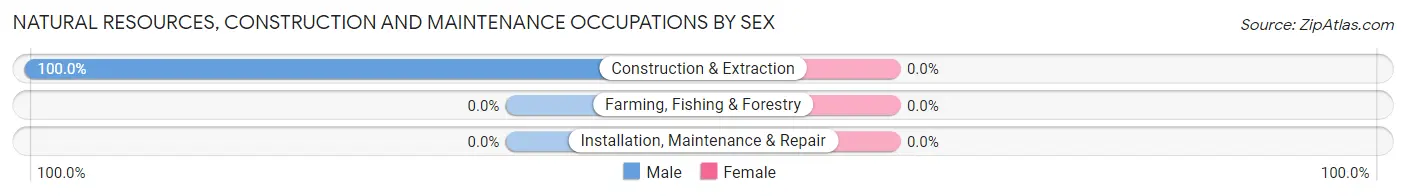
| Occupation | Male | Female |
| Farming, Fishing & Forestry | 0 (0.0%) | 0 (0.0%) |
| Construction & Extraction | 20 (100.0%) | 0 (0.0%) |
| Installation, Maintenance & Repair | 0 (0.0%) | 0 (0.0%) |
| Total (Category) | 20 (100.0%) | 0 (0.0%) |
| Total (Overall) | 53 (60.2%) | 35 (39.8%) |
Production, Transportation and Moving Occupations
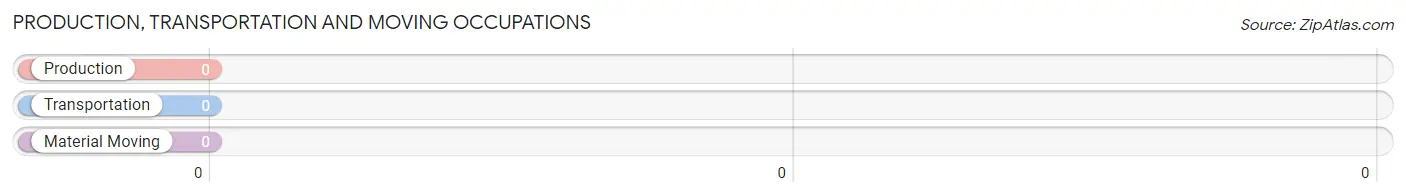
Production, Transportation and Moving Occupations by Sex
| Occupation | Male | Female |
| Production | 0 (0.0%) | 0 (0.0%) |
| Transportation | 0 (0.0%) | 0 (0.0%) |
| Material Moving | 0 (0.0%) | 0 (0.0%) |
| Total (Category) | 0 (0.0%) | 0 (0.0%) |
| Total (Overall) | 53 (60.2%) | 35 (39.8%) |
Employment Industries by Sex in Montgomery Creek
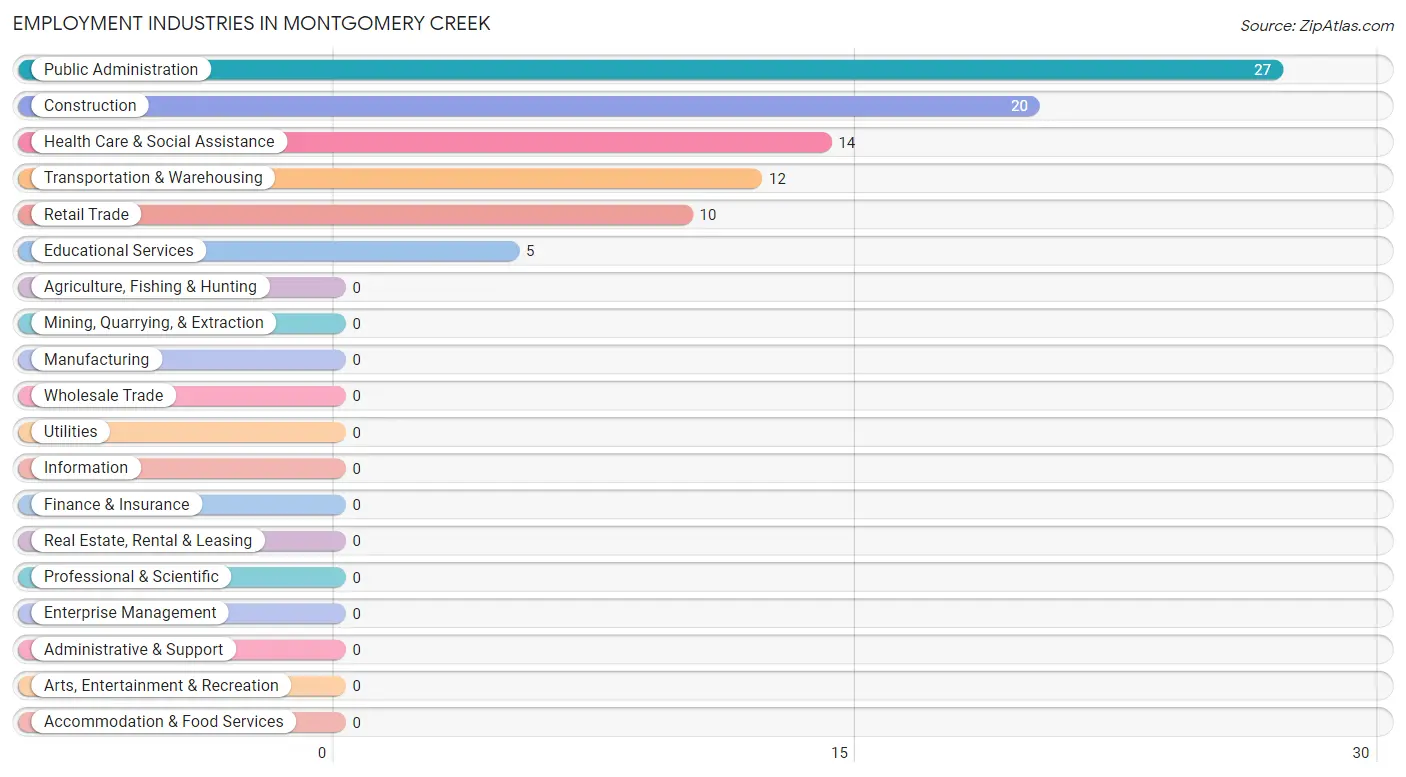
Employment Industries in Montgomery Creek
The major employment industries in Montgomery Creek include Public Administration (27 | 30.7%), Construction (20 | 22.7%), Health Care & Social Assistance (14 | 15.9%), Transportation & Warehousing (12 | 13.6%), and Retail Trade (10 | 11.4%).
Employment Industries by Sex in Montgomery Creek
The Montgomery Creek industries that see more men than women are Construction (100.0%), Retail Trade (100.0%), and Transportation & Warehousing (100.0%), whereas the industries that tend to have a higher number of women are Educational Services (100.0%), Public Administration (100.0%), and Health Care & Social Assistance (21.4%).
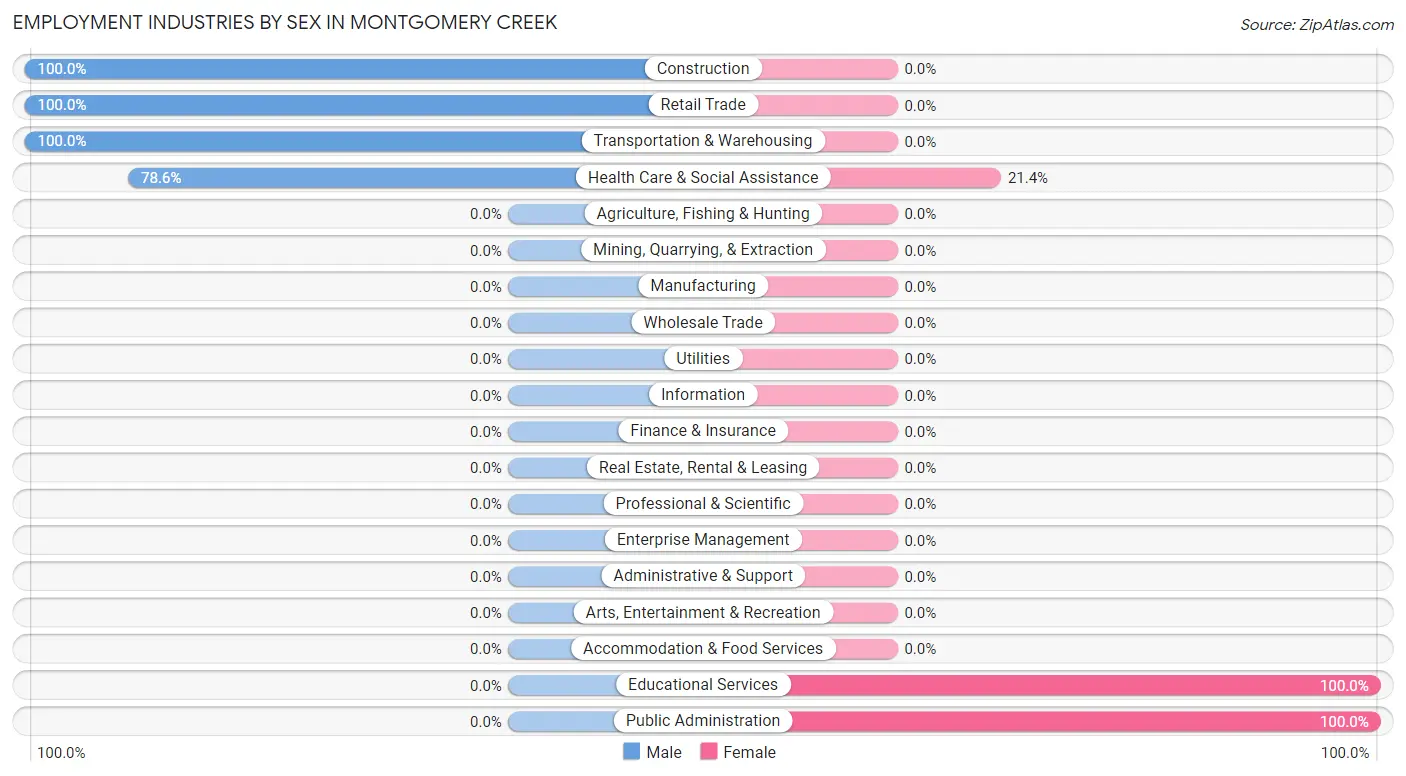
| Industry | Male | Female |
| Agriculture, Fishing & Hunting | 0 (0.0%) | 0 (0.0%) |
| Mining, Quarrying, & Extraction | 0 (0.0%) | 0 (0.0%) |
| Construction | 20 (100.0%) | 0 (0.0%) |
| Manufacturing | 0 (0.0%) | 0 (0.0%) |
| Wholesale Trade | 0 (0.0%) | 0 (0.0%) |
| Retail Trade | 10 (100.0%) | 0 (0.0%) |
| Transportation & Warehousing | 12 (100.0%) | 0 (0.0%) |
| Utilities | 0 (0.0%) | 0 (0.0%) |
| Information | 0 (0.0%) | 0 (0.0%) |
| Finance & Insurance | 0 (0.0%) | 0 (0.0%) |
| Real Estate, Rental & Leasing | 0 (0.0%) | 0 (0.0%) |
| Professional & Scientific | 0 (0.0%) | 0 (0.0%) |
| Enterprise Management | 0 (0.0%) | 0 (0.0%) |
| Administrative & Support | 0 (0.0%) | 0 (0.0%) |
| Educational Services | 0 (0.0%) | 5 (100.0%) |
| Health Care & Social Assistance | 11 (78.6%) | 3 (21.4%) |
| Arts, Entertainment & Recreation | 0 (0.0%) | 0 (0.0%) |
| Accommodation & Food Services | 0 (0.0%) | 0 (0.0%) |
| Public Administration | 0 (0.0%) | 27 (100.0%) |
| Total | 53 (60.2%) | 35 (39.8%) |
Education in Montgomery Creek
School Enrollment in Montgomery Creek
The most common levels of schooling among the 23 students in Montgomery Creek are college / undergraduate (14 | 60.9%), high school (6 | 26.1%), and middle school (3 | 13.0%).
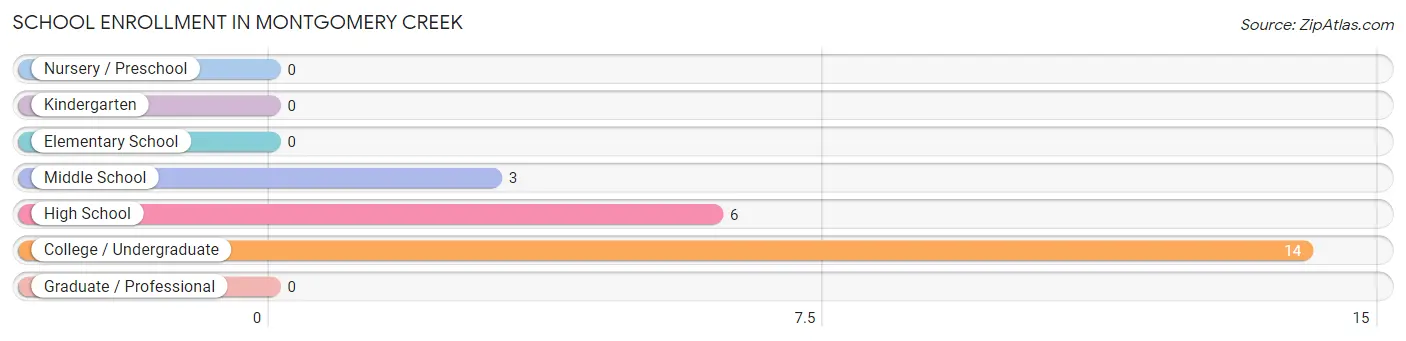
| School Level | # Students | % Students |
| Nursery / Preschool | 0 | 0.0% |
| Kindergarten | 0 | 0.0% |
| Elementary School | 0 | 0.0% |
| Middle School | 3 | 13.0% |
| High School | 6 | 26.1% |
| College / Undergraduate | 14 | 60.9% |
| Graduate / Professional | 0 | 0.0% |
| Total | 23 | 100.0% |
School Enrollment by Age by Funding Source in Montgomery Creek
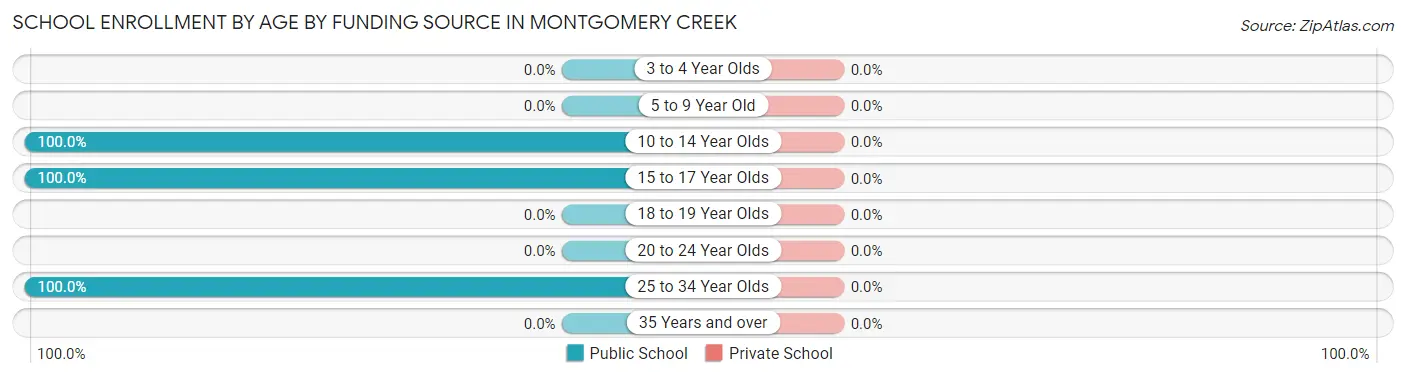
| Age Bracket | Public School | Private School |
| 3 to 4 Year Olds | 0 (0.0%) | 0 (0.0%) |
| 5 to 9 Year Old | 0 (0.0%) | 0 (0.0%) |
| 10 to 14 Year Olds | 3 (100.0%) | 0 (0.0%) |
| 15 to 17 Year Olds | 6 (100.0%) | 0 (0.0%) |
| 18 to 19 Year Olds | 0 (0.0%) | 0 (0.0%) |
| 20 to 24 Year Olds | 0 (0.0%) | 0 (0.0%) |
| 25 to 34 Year Olds | 14 (100.0%) | 0 (0.0%) |
| 35 Years and over | 0 (0.0%) | 0 (0.0%) |
| Total | 23 (100.0%) | 0 (0.0%) |
Educational Attainment by Field of Study in Montgomery Creek
Engineering (23 | 34.3%), bio, nature & agricultural (14 | 20.9%), education (13 | 19.4%), physical & health sciences (10 | 14.9%), and computers & mathematics (4 | 6.0%) are the most common fields of study among 67 individuals in Montgomery Creek who have obtained a bachelor's degree or higher.
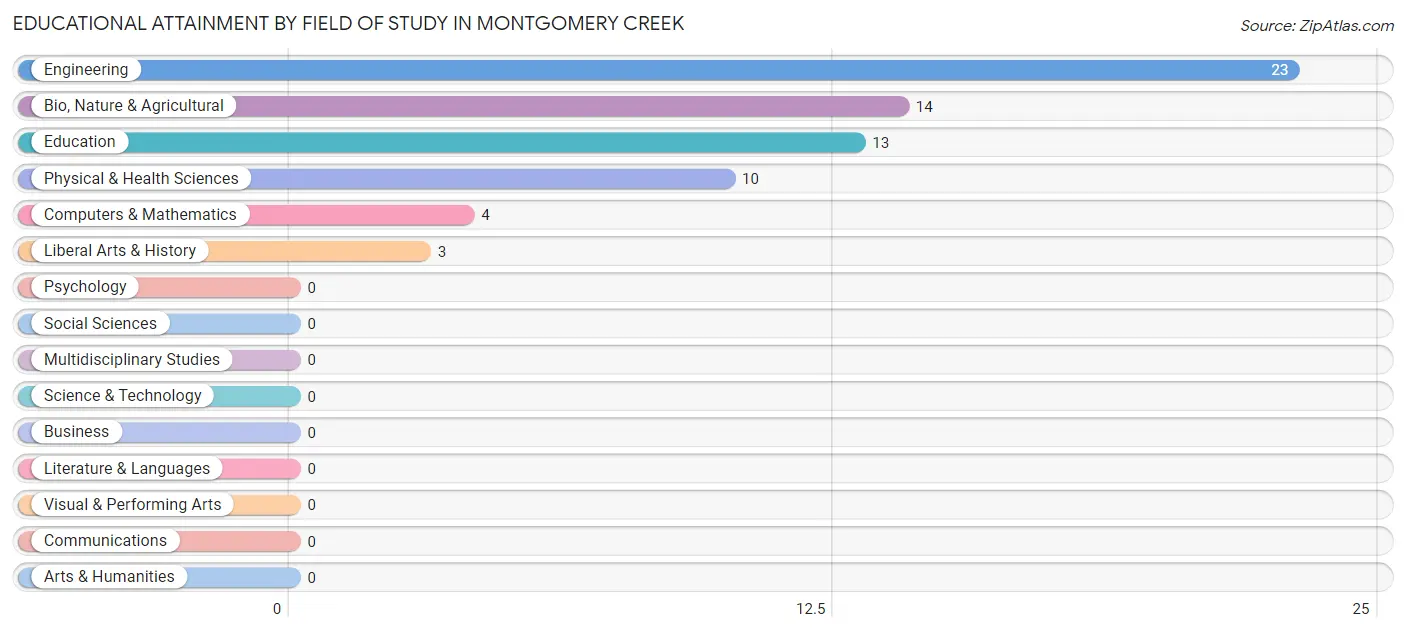
| Field of Study | # Graduates | % Graduates |
| Computers & Mathematics | 4 | 6.0% |
| Bio, Nature & Agricultural | 14 | 20.9% |
| Physical & Health Sciences | 10 | 14.9% |
| Psychology | 0 | 0.0% |
| Social Sciences | 0 | 0.0% |
| Engineering | 23 | 34.3% |
| Multidisciplinary Studies | 0 | 0.0% |
| Science & Technology | 0 | 0.0% |
| Business | 0 | 0.0% |
| Education | 13 | 19.4% |
| Literature & Languages | 0 | 0.0% |
| Liberal Arts & History | 3 | 4.5% |
| Visual & Performing Arts | 0 | 0.0% |
| Communications | 0 | 0.0% |
| Arts & Humanities | 0 | 0.0% |
| Total | 67 | 100.0% |
Transportation & Commute in Montgomery Creek
Vehicle Availability by Sex in Montgomery Creek
The most prevalent vehicle ownership categories in Montgomery Creek are males with 5 or more vehicles (43, accounting for 81.1%) and females with 5 or more vehicles (12, making up 122.9%).
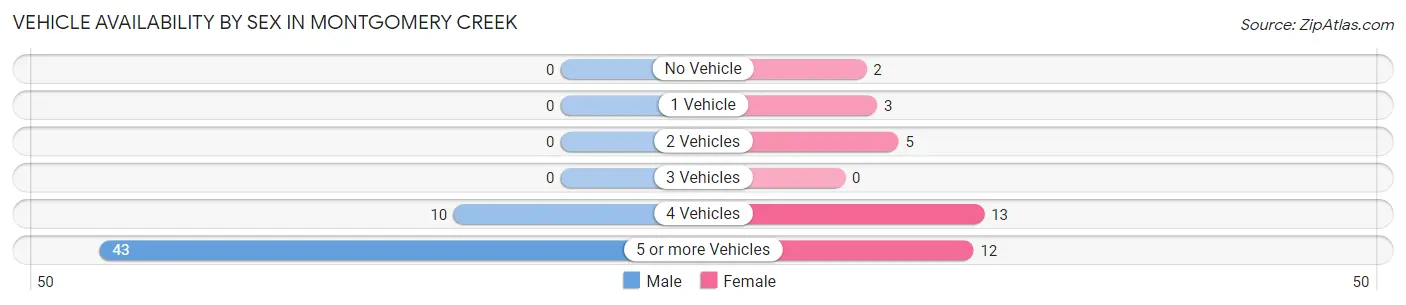
| Vehicles Available | Male | Female |
| No Vehicle | 0 (0.0%) | 2 (5.7%) |
| 1 Vehicle | 0 (0.0%) | 3 (8.6%) |
| 2 Vehicles | 0 (0.0%) | 5 (14.3%) |
| 3 Vehicles | 0 (0.0%) | 0 (0.0%) |
| 4 Vehicles | 10 (18.9%) | 13 (37.1%) |
| 5 or more Vehicles | 43 (81.1%) | 12 (34.3%) |
| Total | 53 (100.0%) | 35 (100.0%) |
Commute Time in Montgomery Creek
The most frequently occuring commute durations in Montgomery Creek are 45 to 59 minutes (30 commuters, 40.0%), 15 to 19 minutes (23 commuters, 30.7%), and 30 to 34 minutes (14 commuters, 18.7%).
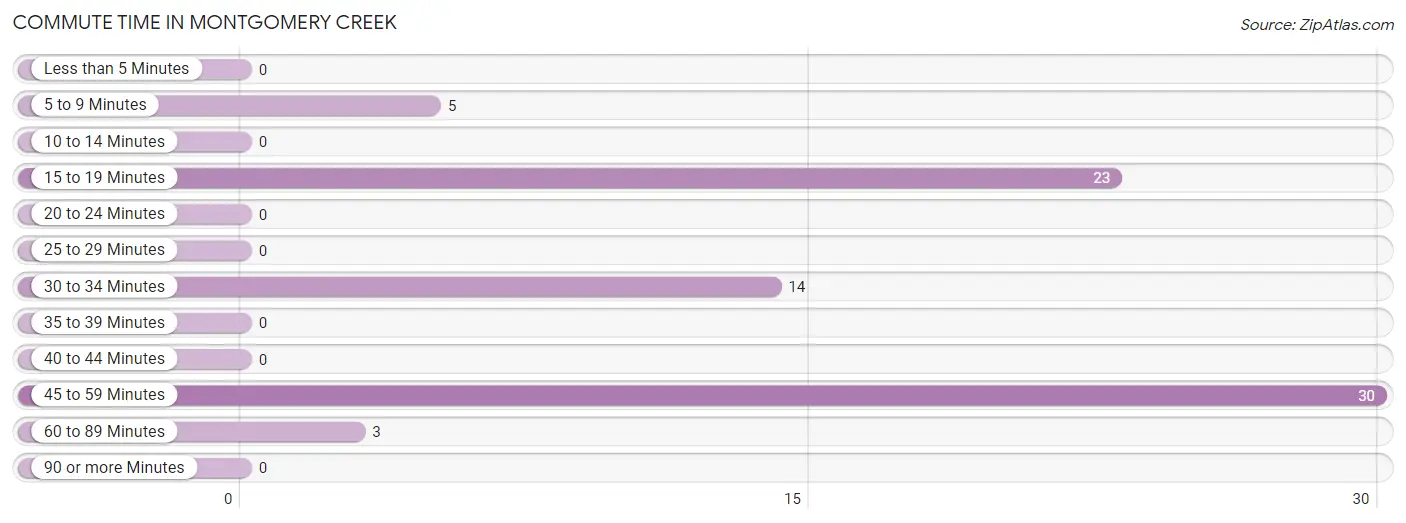
| Commute Time | # Commuters | % Commuters |
| Less than 5 Minutes | 0 | 0.0% |
| 5 to 9 Minutes | 5 | 6.7% |
| 10 to 14 Minutes | 0 | 0.0% |
| 15 to 19 Minutes | 23 | 30.7% |
| 20 to 24 Minutes | 0 | 0.0% |
| 25 to 29 Minutes | 0 | 0.0% |
| 30 to 34 Minutes | 14 | 18.7% |
| 35 to 39 Minutes | 0 | 0.0% |
| 40 to 44 Minutes | 0 | 0.0% |
| 45 to 59 Minutes | 30 | 40.0% |
| 60 to 89 Minutes | 3 | 4.0% |
| 90 or more Minutes | 0 | 0.0% |
Commute Time by Sex in Montgomery Creek
The most common commute times in Montgomery Creek are 45 to 59 minutes (30 commuters, 56.6%) for males and 30 to 34 minutes (14 commuters, 63.6%) for females.
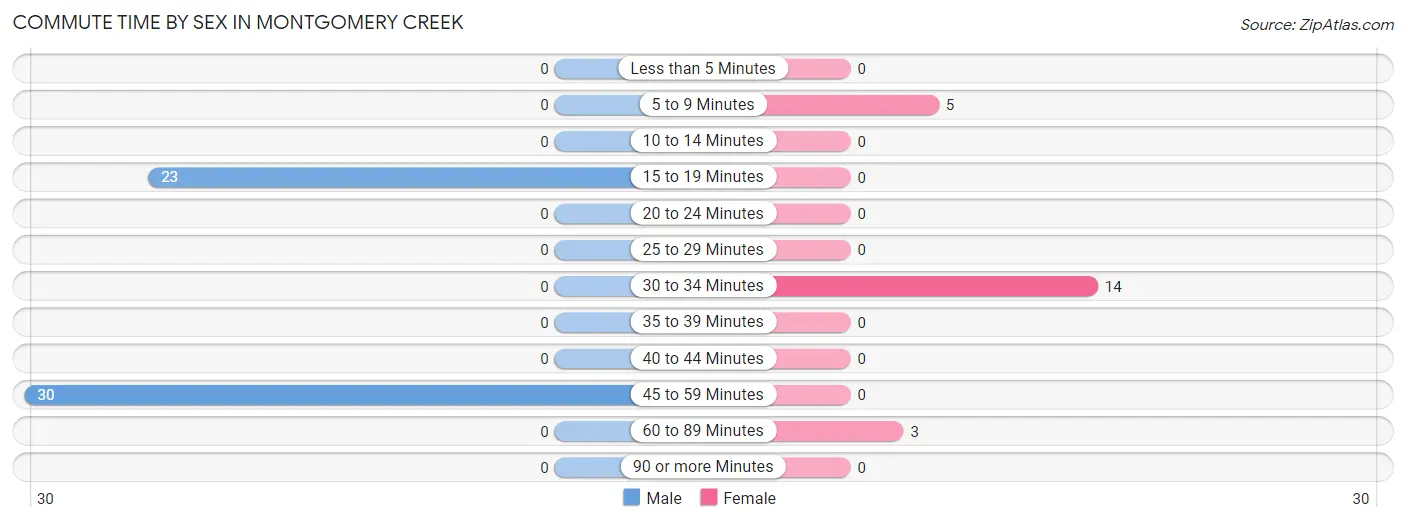
| Commute Time | Male | Female |
| Less than 5 Minutes | 0 (0.0%) | 0 (0.0%) |
| 5 to 9 Minutes | 0 (0.0%) | 5 (22.7%) |
| 10 to 14 Minutes | 0 (0.0%) | 0 (0.0%) |
| 15 to 19 Minutes | 23 (43.4%) | 0 (0.0%) |
| 20 to 24 Minutes | 0 (0.0%) | 0 (0.0%) |
| 25 to 29 Minutes | 0 (0.0%) | 0 (0.0%) |
| 30 to 34 Minutes | 0 (0.0%) | 14 (63.6%) |
| 35 to 39 Minutes | 0 (0.0%) | 0 (0.0%) |
| 40 to 44 Minutes | 0 (0.0%) | 0 (0.0%) |
| 45 to 59 Minutes | 30 (56.6%) | 0 (0.0%) |
| 60 to 89 Minutes | 0 (0.0%) | 3 (13.6%) |
| 90 or more Minutes | 0 (0.0%) | 0 (0.0%) |
Time of Departure to Work by Sex in Montgomery Creek
The most frequent times of departure to work in Montgomery Creek are 6:00 AM to 6:29 AM (20, 37.7%) for males and 5:30 AM to 5:59 AM (12, 54.5%) for females.
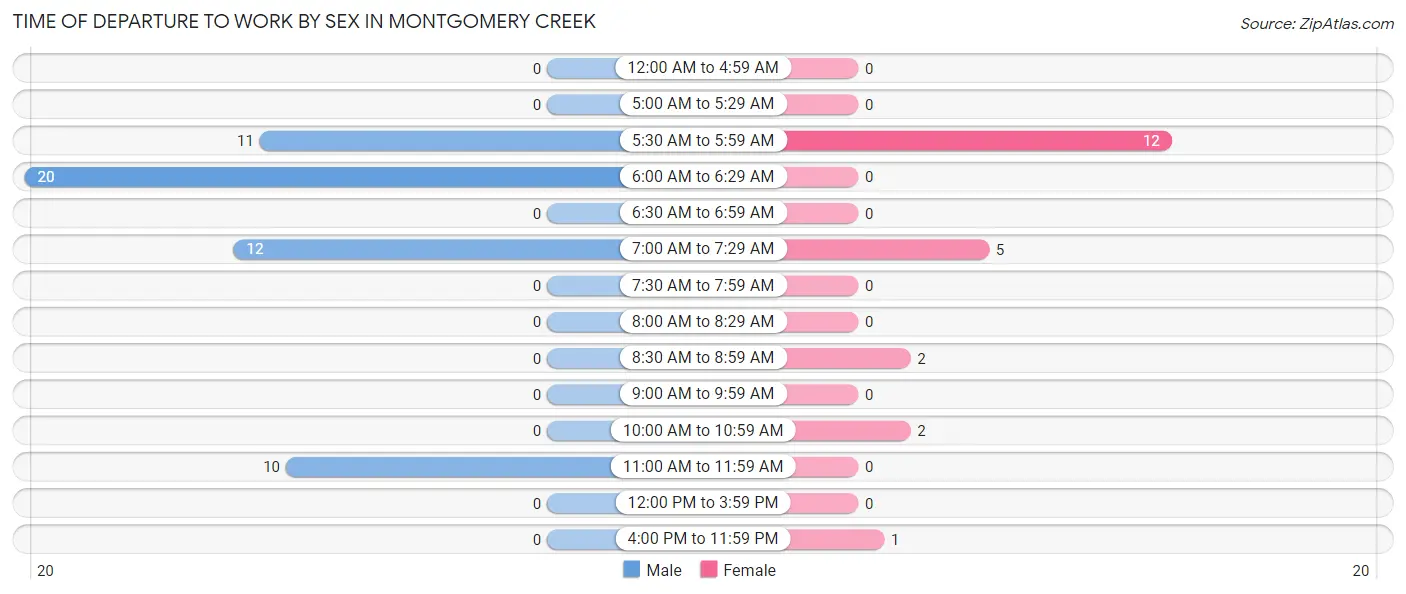
| Time of Departure | Male | Female |
| 12:00 AM to 4:59 AM | 0 (0.0%) | 0 (0.0%) |
| 5:00 AM to 5:29 AM | 0 (0.0%) | 0 (0.0%) |
| 5:30 AM to 5:59 AM | 11 (20.7%) | 12 (54.5%) |
| 6:00 AM to 6:29 AM | 20 (37.7%) | 0 (0.0%) |
| 6:30 AM to 6:59 AM | 0 (0.0%) | 0 (0.0%) |
| 7:00 AM to 7:29 AM | 12 (22.6%) | 5 (22.7%) |
| 7:30 AM to 7:59 AM | 0 (0.0%) | 0 (0.0%) |
| 8:00 AM to 8:29 AM | 0 (0.0%) | 0 (0.0%) |
| 8:30 AM to 8:59 AM | 0 (0.0%) | 2 (9.1%) |
| 9:00 AM to 9:59 AM | 0 (0.0%) | 0 (0.0%) |
| 10:00 AM to 10:59 AM | 0 (0.0%) | 2 (9.1%) |
| 11:00 AM to 11:59 AM | 10 (18.9%) | 0 (0.0%) |
| 12:00 PM to 3:59 PM | 0 (0.0%) | 0 (0.0%) |
| 4:00 PM to 11:59 PM | 0 (0.0%) | 1 (4.5%) |
| Total | 53 (100.0%) | 22 (100.0%) |
Housing Occupancy in Montgomery Creek
Occupancy by Ownership in Montgomery Creek
Of the total 88 dwellings in Montgomery Creek, owner-occupied units account for 59 (67.0%), while renter-occupied units make up 29 (33.0%).
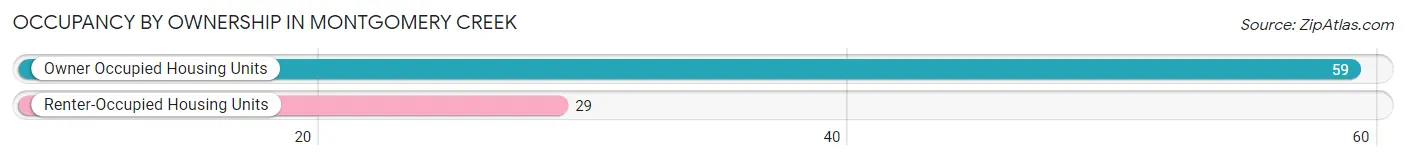
| Occupancy | # Housing Units | % Housing Units |
| Owner Occupied Housing Units | 59 | 67.0% |
| Renter-Occupied Housing Units | 29 | 33.0% |
| Total Occupied Housing Units | 88 | 100.0% |
Occupancy by Household Size in Montgomery Creek
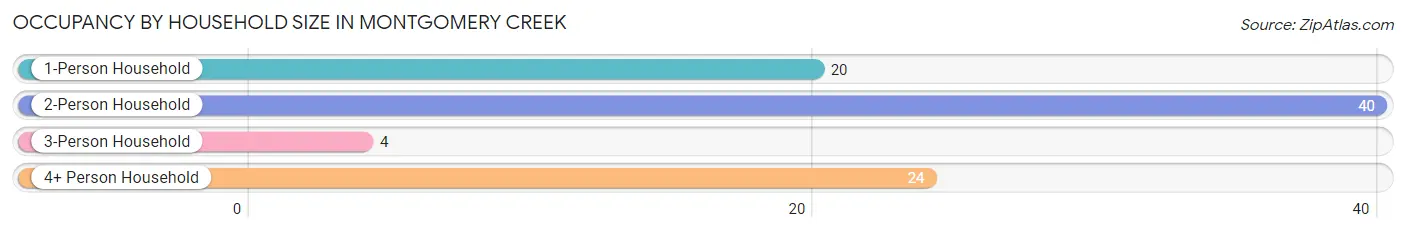
| Household Size | # Housing Units | % Housing Units |
| 1-Person Household | 20 | 22.7% |
| 2-Person Household | 40 | 45.5% |
| 3-Person Household | 4 | 4.5% |
| 4+ Person Household | 24 | 27.3% |
| Total Housing Units | 88 | 100.0% |
Occupancy by Ownership by Household Size in Montgomery Creek
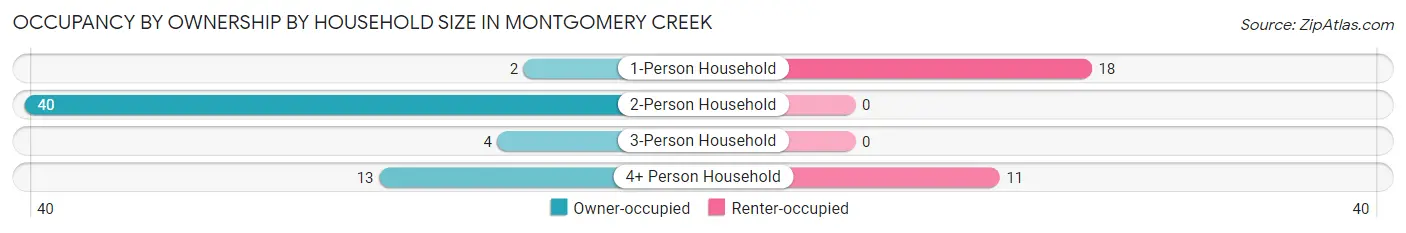
| Household Size | Owner-occupied | Renter-occupied |
| 1-Person Household | 2 (10.0%) | 18 (90.0%) |
| 2-Person Household | 40 (100.0%) | 0 (0.0%) |
| 3-Person Household | 4 (100.0%) | 0 (0.0%) |
| 4+ Person Household | 13 (54.2%) | 11 (45.8%) |
| Total Housing Units | 59 (67.0%) | 29 (33.0%) |
Occupancy by Educational Attainment in Montgomery Creek
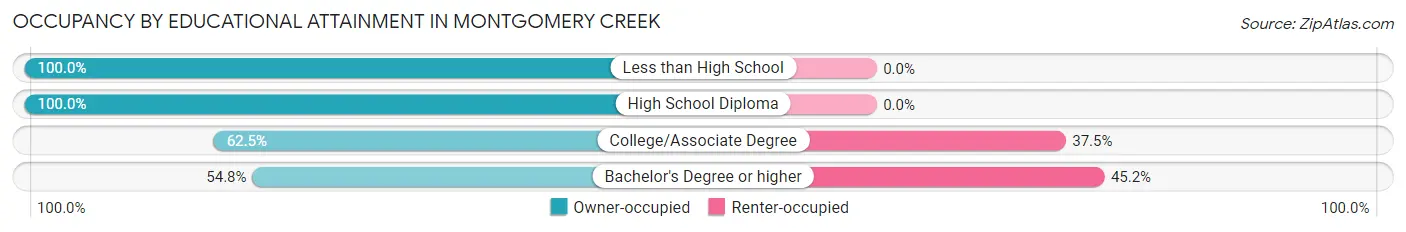
| Household Size | Owner-occupied | Renter-occupied |
| Less than High School | 2 (100.0%) | 0 (0.0%) |
| High School Diploma | 15 (100.0%) | 0 (0.0%) |
| College/Associate Degree | 25 (62.5%) | 15 (37.5%) |
| Bachelor's Degree or higher | 17 (54.8%) | 14 (45.2%) |
Occupancy by Age of Householder in Montgomery Creek
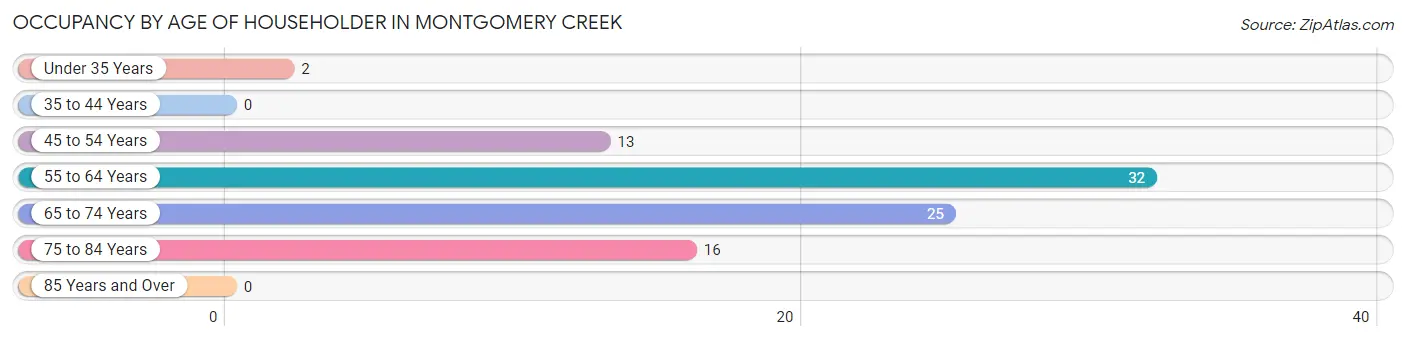
| Age Bracket | # Households | % Households |
| Under 35 Years | 2 | 2.3% |
| 35 to 44 Years | 0 | 0.0% |
| 45 to 54 Years | 13 | 14.8% |
| 55 to 64 Years | 32 | 36.4% |
| 65 to 74 Years | 25 | 28.4% |
| 75 to 84 Years | 16 | 18.2% |
| 85 Years and Over | 0 | 0.0% |
| Total | 88 | 100.0% |
Housing Finances in Montgomery Creek
Median Income by Occupancy in Montgomery Creek
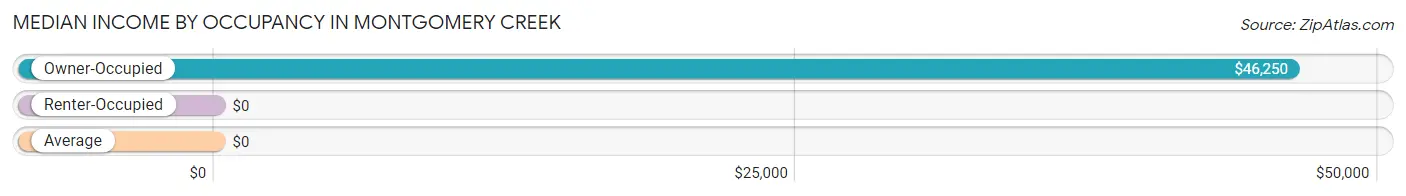
| Occupancy Type | # Households | Median Income |
| Owner-Occupied | 59 (67.0%) | $46,250 |
| Renter-Occupied | 29 (33.0%) | $0 |
| Average | 88 (100.0%) | $0 |
Occupancy by Householder Income Bracket in Montgomery Creek
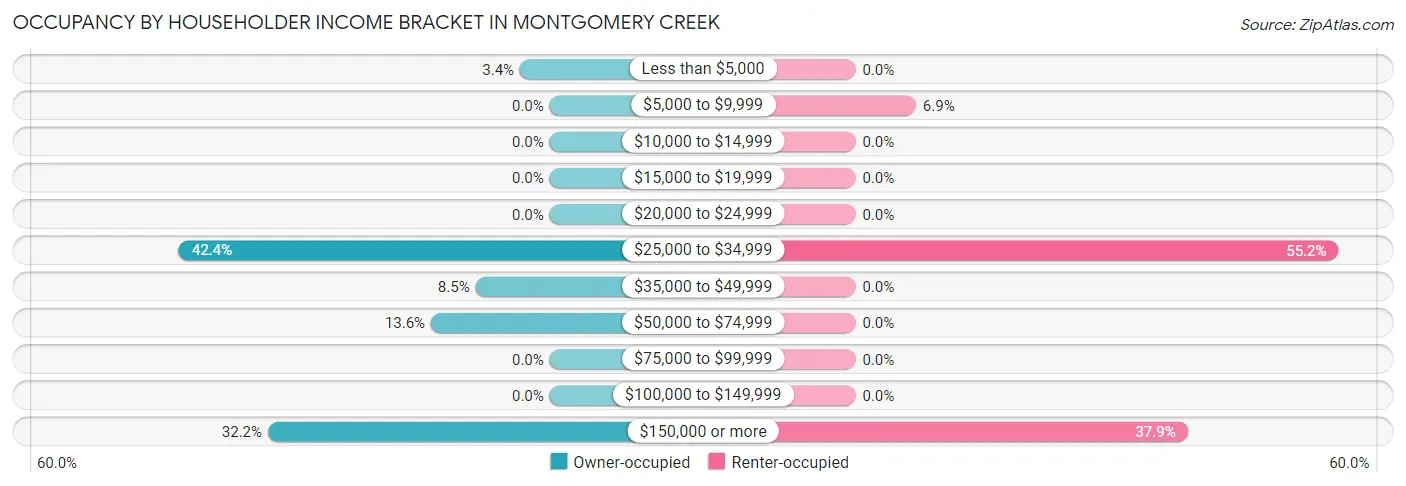
| Income Bracket | Owner-occupied | Renter-occupied |
| Less than $5,000 | 2 (3.4%) | 0 (0.0%) |
| $5,000 to $9,999 | 0 (0.0%) | 2 (6.9%) |
| $10,000 to $14,999 | 0 (0.0%) | 0 (0.0%) |
| $15,000 to $19,999 | 0 (0.0%) | 0 (0.0%) |
| $20,000 to $24,999 | 0 (0.0%) | 0 (0.0%) |
| $25,000 to $34,999 | 25 (42.4%) | 16 (55.2%) |
| $35,000 to $49,999 | 5 (8.5%) | 0 (0.0%) |
| $50,000 to $74,999 | 8 (13.6%) | 0 (0.0%) |
| $75,000 to $99,999 | 0 (0.0%) | 0 (0.0%) |
| $100,000 to $149,999 | 0 (0.0%) | 0 (0.0%) |
| $150,000 or more | 19 (32.2%) | 11 (37.9%) |
| Total | 59 (100.0%) | 29 (100.0%) |
Monthly Housing Cost Tiers in Montgomery Creek
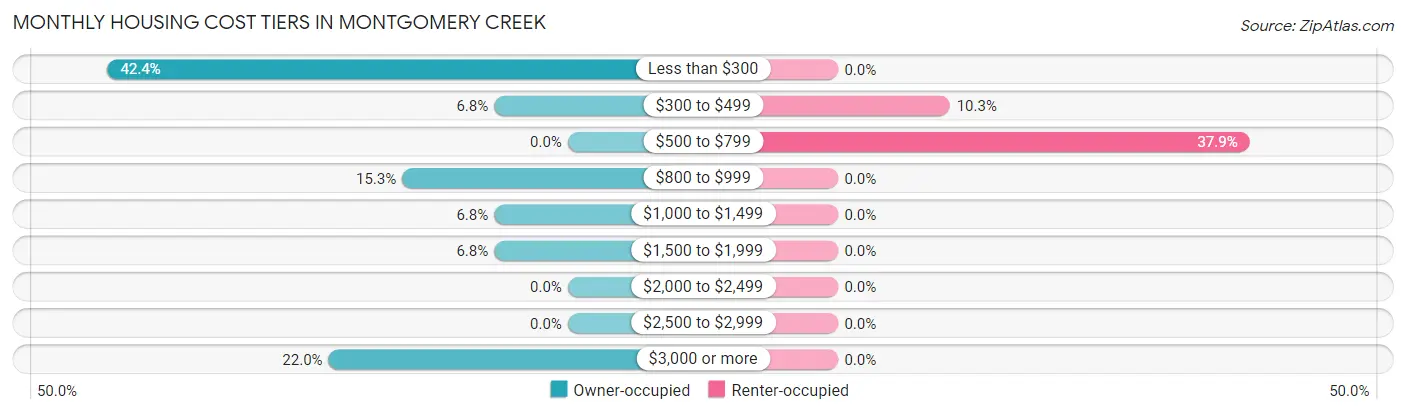
| Monthly Cost | Owner-occupied | Renter-occupied |
| Less than $300 | 25 (42.4%) | 0 (0.0%) |
| $300 to $499 | 4 (6.8%) | 3 (10.3%) |
| $500 to $799 | 0 (0.0%) | 11 (37.9%) |
| $800 to $999 | 9 (15.2%) | 0 (0.0%) |
| $1,000 to $1,499 | 4 (6.8%) | 0 (0.0%) |
| $1,500 to $1,999 | 4 (6.8%) | 0 (0.0%) |
| $2,000 to $2,499 | 0 (0.0%) | 0 (0.0%) |
| $2,500 to $2,999 | 0 (0.0%) | 0 (0.0%) |
| $3,000 or more | 13 (22.0%) | 0 (0.0%) |
| Total | 59 (100.0%) | 29 (100.0%) |
Physical Housing Characteristics in Montgomery Creek
Housing Structures in Montgomery Creek
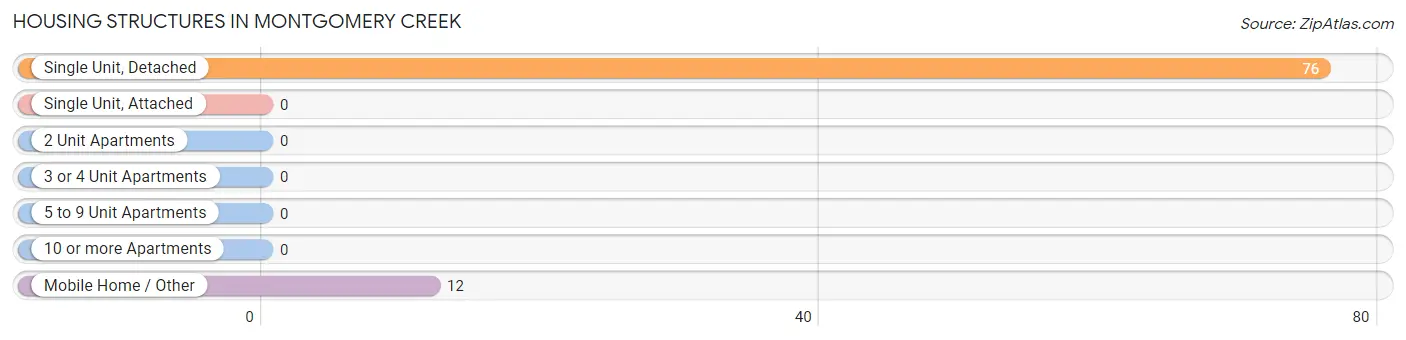
| Structure Type | # Housing Units | % Housing Units |
| Single Unit, Detached | 76 | 86.4% |
| Single Unit, Attached | 0 | 0.0% |
| 2 Unit Apartments | 0 | 0.0% |
| 3 or 4 Unit Apartments | 0 | 0.0% |
| 5 to 9 Unit Apartments | 0 | 0.0% |
| 10 or more Apartments | 0 | 0.0% |
| Mobile Home / Other | 12 | 13.6% |
| Total | 88 | 100.0% |
Housing Structures by Occupancy in Montgomery Creek
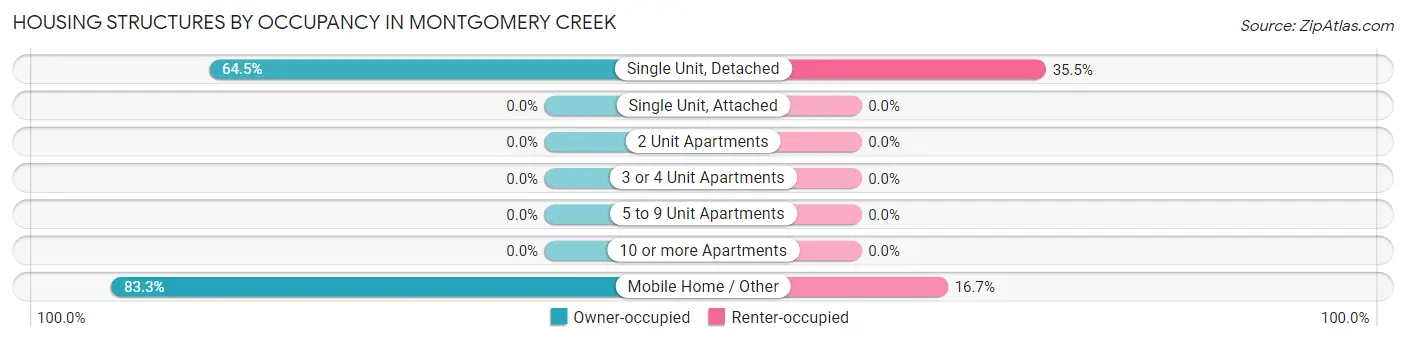
| Structure Type | Owner-occupied | Renter-occupied |
| Single Unit, Detached | 49 (64.5%) | 27 (35.5%) |
| Single Unit, Attached | 0 (0.0%) | 0 (0.0%) |
| 2 Unit Apartments | 0 (0.0%) | 0 (0.0%) |
| 3 or 4 Unit Apartments | 0 (0.0%) | 0 (0.0%) |
| 5 to 9 Unit Apartments | 0 (0.0%) | 0 (0.0%) |
| 10 or more Apartments | 0 (0.0%) | 0 (0.0%) |
| Mobile Home / Other | 10 (83.3%) | 2 (16.7%) |
| Total | 59 (67.0%) | 29 (33.0%) |
Housing Structures by Number of Rooms in Montgomery Creek
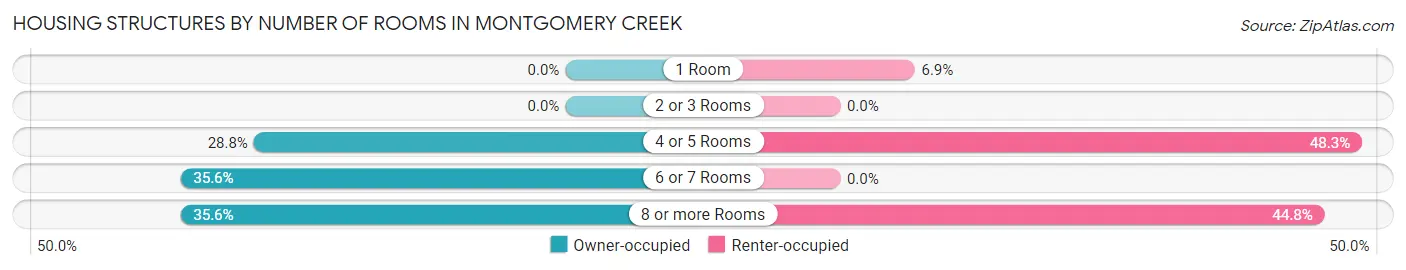
| Number of Rooms | Owner-occupied | Renter-occupied |
| 1 Room | 0 (0.0%) | 2 (6.9%) |
| 2 or 3 Rooms | 0 (0.0%) | 0 (0.0%) |
| 4 or 5 Rooms | 17 (28.8%) | 14 (48.3%) |
| 6 or 7 Rooms | 21 (35.6%) | 0 (0.0%) |
| 8 or more Rooms | 21 (35.6%) | 13 (44.8%) |
| Total | 59 (100.0%) | 29 (100.0%) |
Housing Structure by Heating Type in Montgomery Creek
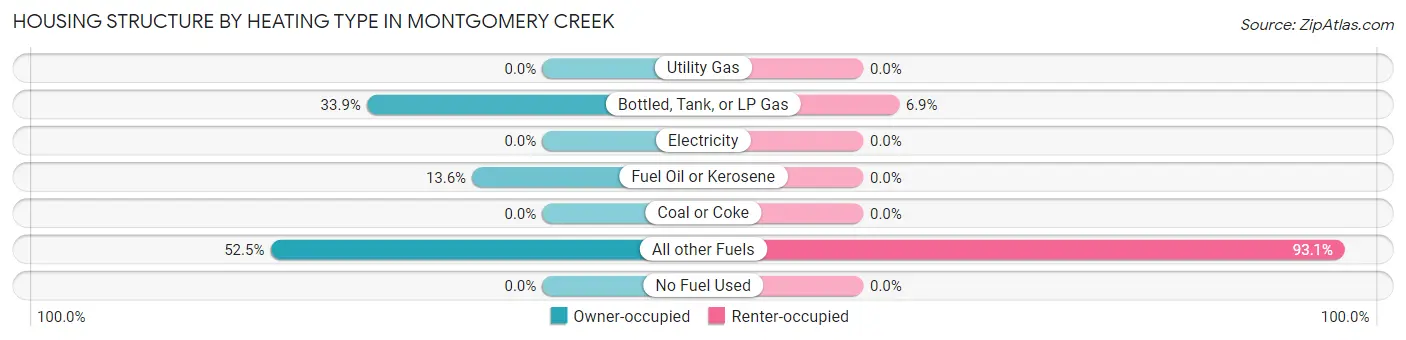
| Heating Type | Owner-occupied | Renter-occupied |
| Utility Gas | 0 (0.0%) | 0 (0.0%) |
| Bottled, Tank, or LP Gas | 20 (33.9%) | 2 (6.9%) |
| Electricity | 0 (0.0%) | 0 (0.0%) |
| Fuel Oil or Kerosene | 8 (13.6%) | 0 (0.0%) |
| Coal or Coke | 0 (0.0%) | 0 (0.0%) |
| All other Fuels | 31 (52.5%) | 27 (93.1%) |
| No Fuel Used | 0 (0.0%) | 0 (0.0%) |
| Total | 59 (100.0%) | 29 (100.0%) |
Household Vehicle Usage in Montgomery Creek
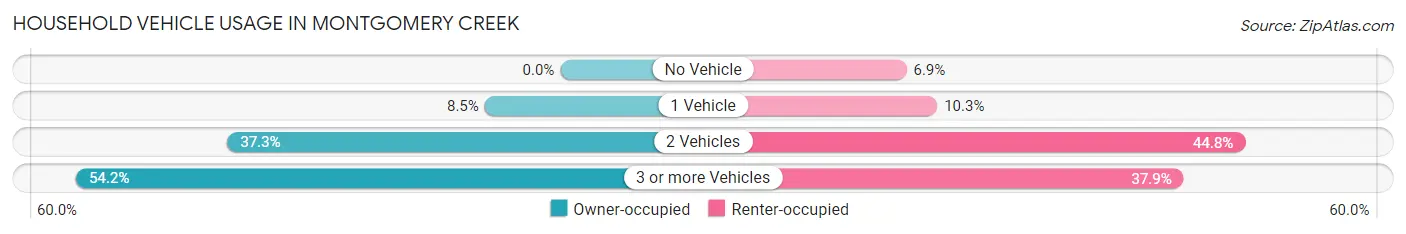
| Vehicles per Household | Owner-occupied | Renter-occupied |
| No Vehicle | 0 (0.0%) | 2 (6.9%) |
| 1 Vehicle | 5 (8.5%) | 3 (10.3%) |
| 2 Vehicles | 22 (37.3%) | 13 (44.8%) |
| 3 or more Vehicles | 32 (54.2%) | 11 (37.9%) |
| Total | 59 (100.0%) | 29 (100.0%) |
Real Estate & Mortgages in Montgomery Creek
Real Estate and Mortgage Overview in Montgomery Creek
| Characteristic | Without Mortgage | With Mortgage |
| Housing Units | 34 | 25 |
| Median Property Value | $138,500 | $566,200 |
| Median Household Income | $33,958 | $17 |
| Monthly Housing Costs | $269 | $13 |
| Real Estate Taxes | - | - |
Property Value by Mortgage Status in Montgomery Creek
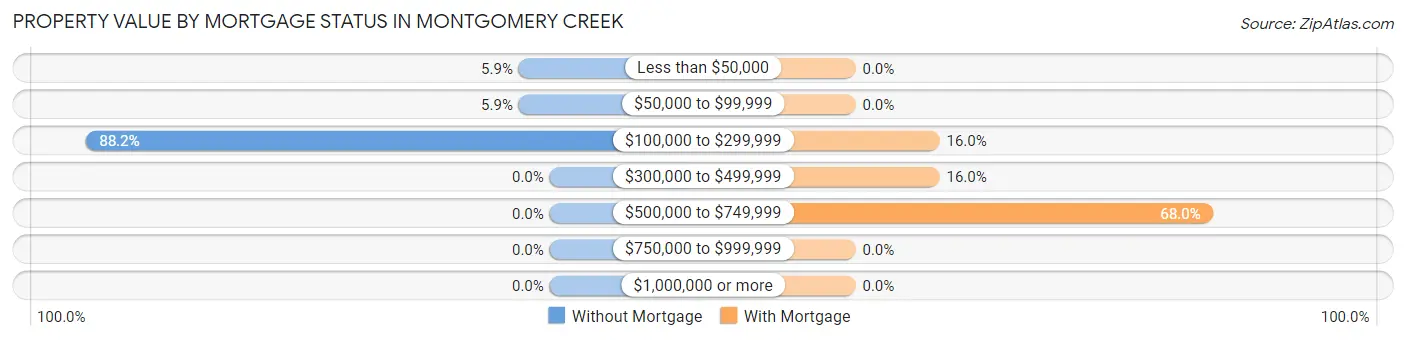
| Property Value | Without Mortgage | With Mortgage |
| Less than $50,000 | 2 (5.9%) | 0 (0.0%) |
| $50,000 to $99,999 | 2 (5.9%) | 0 (0.0%) |
| $100,000 to $299,999 | 30 (88.2%) | 4 (16.0%) |
| $300,000 to $499,999 | 0 (0.0%) | 4 (16.0%) |
| $500,000 to $749,999 | 0 (0.0%) | 17 (68.0%) |
| $750,000 to $999,999 | 0 (0.0%) | 0 (0.0%) |
| $1,000,000 or more | 0 (0.0%) | 0 (0.0%) |
| Total | 34 (100.0%) | 25 (100.0%) |
Household Income by Mortgage Status in Montgomery Creek
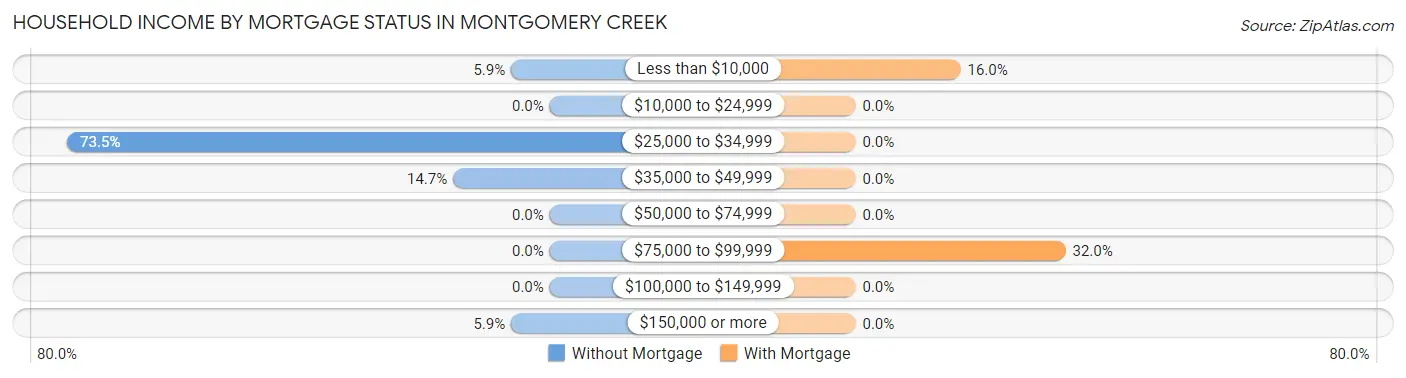
| Household Income | Without Mortgage | With Mortgage |
| Less than $10,000 | 2 (5.9%) | 4 (16.0%) |
| $10,000 to $24,999 | 0 (0.0%) | 0 (0.0%) |
| $25,000 to $34,999 | 25 (73.5%) | 0 (0.0%) |
| $35,000 to $49,999 | 5 (14.7%) | 0 (0.0%) |
| $50,000 to $74,999 | 0 (0.0%) | 0 (0.0%) |
| $75,000 to $99,999 | 0 (0.0%) | 8 (32.0%) |
| $100,000 to $149,999 | 0 (0.0%) | 0 (0.0%) |
| $150,000 or more | 2 (5.9%) | 0 (0.0%) |
| Total | 34 (100.0%) | 25 (100.0%) |
Property Value to Household Income Ratio in Montgomery Creek
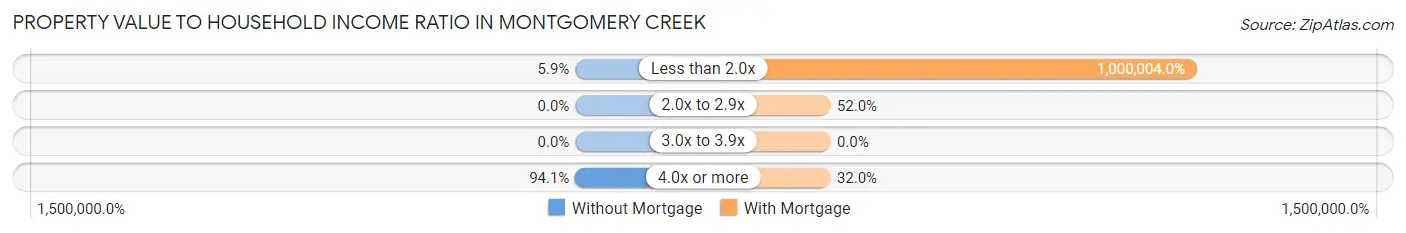
| Value-to-Income Ratio | Without Mortgage | With Mortgage |
| Less than 2.0x | 2 (5.9%) | 250,001 (1,000,004.0%) |
| 2.0x to 2.9x | 0 (0.0%) | 13 (52.0%) |
| 3.0x to 3.9x | 0 (0.0%) | 0 (0.0%) |
| 4.0x or more | 32 (94.1%) | 8 (32.0%) |
| Total | 34 (100.0%) | 25 (100.0%) |
Real Estate Taxes by Mortgage Status in Montgomery Creek
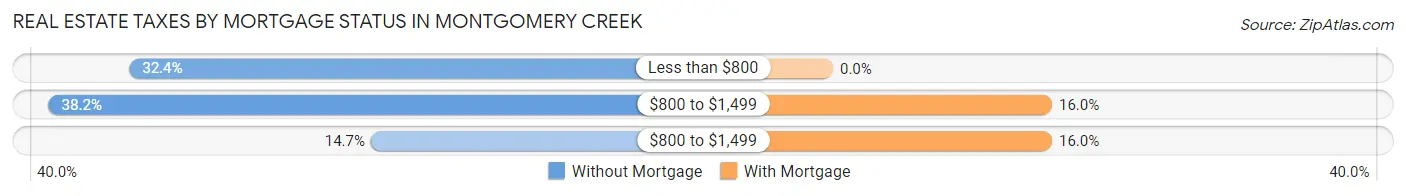
| Property Taxes | Without Mortgage | With Mortgage |
| Less than $800 | 11 (32.4%) | 0 (0.0%) |
| $800 to $1,499 | 13 (38.2%) | 4 (16.0%) |
| $800 to $1,499 | 5 (14.7%) | 4 (16.0%) |
| Total | 34 (100.0%) | 25 (100.0%) |
Health & Disability in Montgomery Creek
Health Insurance Coverage by Age in Montgomery Creek
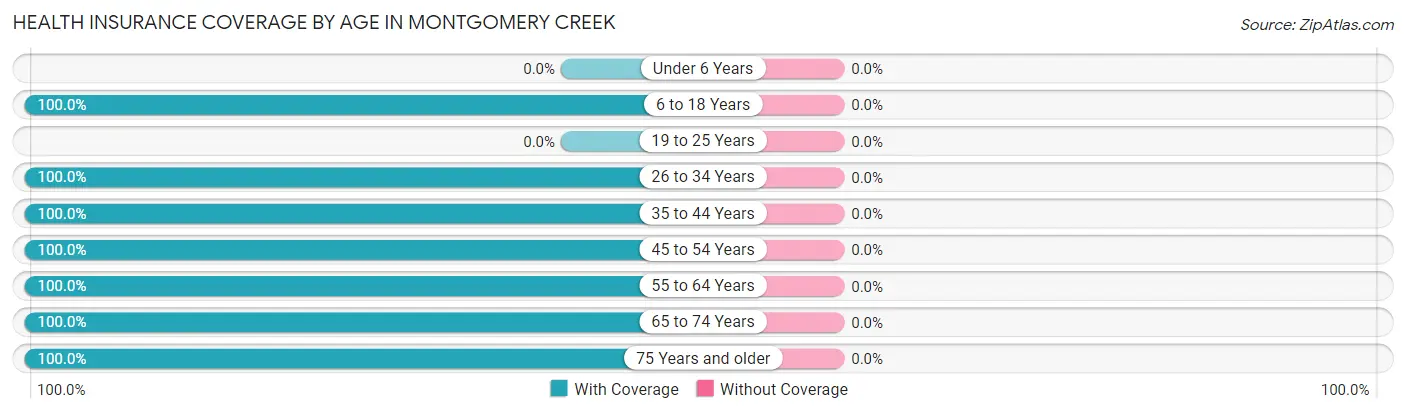
| Age Bracket | With Coverage | Without Coverage |
| Under 6 Years | 0 (0.0%) | 0 (0.0%) |
| 6 to 18 Years | 8 (100.0%) | 0 (0.0%) |
| 19 to 25 Years | 0 (0.0%) | 0 (0.0%) |
| 26 to 34 Years | 18 (100.0%) | 0 (0.0%) |
| 35 to 44 Years | 32 (100.0%) | 0 (0.0%) |
| 45 to 54 Years | 13 (100.0%) | 0 (0.0%) |
| 55 to 64 Years | 62 (100.0%) | 0 (0.0%) |
| 65 to 74 Years | 34 (100.0%) | 0 (0.0%) |
| 75 Years and older | 46 (100.0%) | 0 (0.0%) |
| Total | 213 (100.0%) | 0 (0.0%) |
Health Insurance Coverage by Citizenship Status in Montgomery Creek
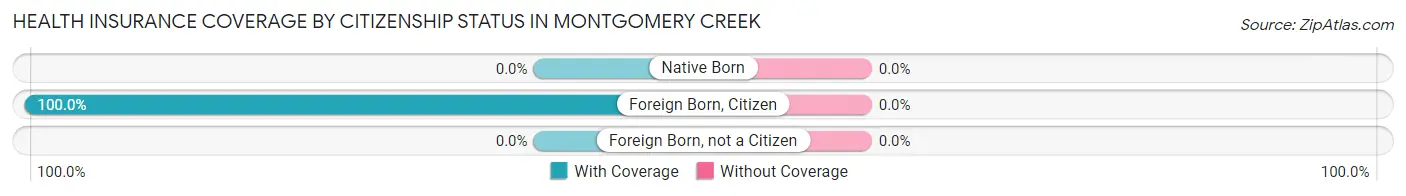
| Citizenship Status | With Coverage | Without Coverage |
| Native Born | 0 (0.0%) | 0 (0.0%) |
| Foreign Born, Citizen | 8 (100.0%) | 0 (0.0%) |
| Foreign Born, not a Citizen | 0 (0.0%) | 0 (0.0%) |
Health Insurance Coverage by Household Income in Montgomery Creek
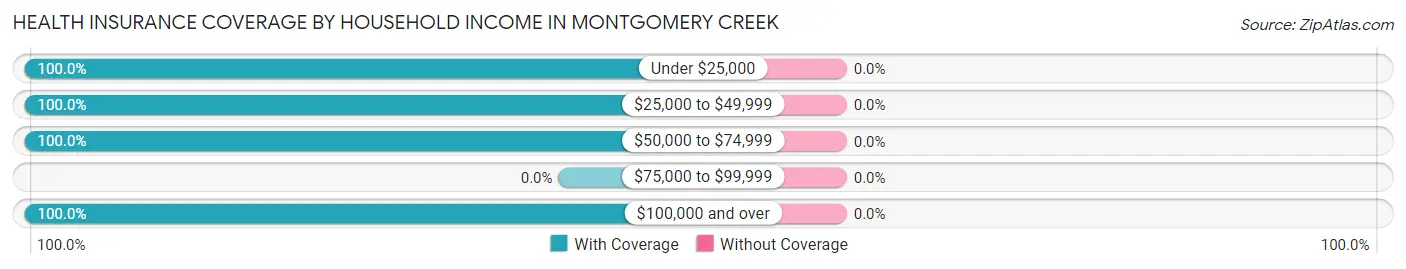
| Household Income | With Coverage | Without Coverage |
| Under $25,000 | 5 (100.0%) | 0 (0.0%) |
| $25,000 to $49,999 | 71 (100.0%) | 0 (0.0%) |
| $50,000 to $74,999 | 16 (100.0%) | 0 (0.0%) |
| $75,000 to $99,999 | 0 (0.0%) | 0 (0.0%) |
| $100,000 and over | 121 (100.0%) | 0 (0.0%) |
Public vs Private Health Insurance Coverage by Age in Montgomery Creek
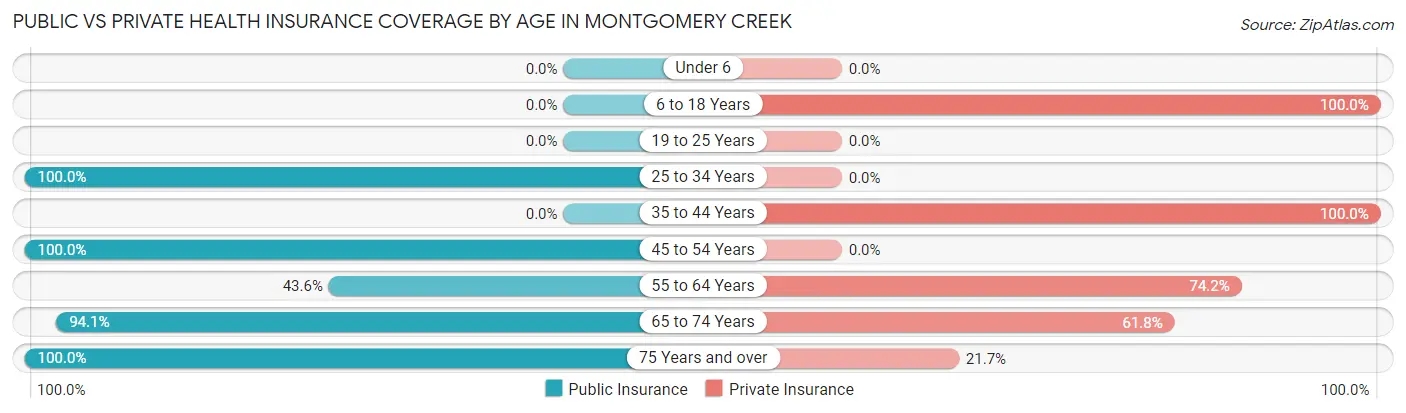
| Age Bracket | Public Insurance | Private Insurance |
| Under 6 | 0 (0.0%) | 0 (0.0%) |
| 6 to 18 Years | 0 (0.0%) | 8 (100.0%) |
| 19 to 25 Years | 0 (0.0%) | 0 (0.0%) |
| 25 to 34 Years | 18 (100.0%) | 0 (0.0%) |
| 35 to 44 Years | 0 (0.0%) | 32 (100.0%) |
| 45 to 54 Years | 13 (100.0%) | 0 (0.0%) |
| 55 to 64 Years | 27 (43.5%) | 46 (74.2%) |
| 65 to 74 Years | 32 (94.1%) | 21 (61.8%) |
| 75 Years and over | 46 (100.0%) | 10 (21.7%) |
| Total | 136 (63.8%) | 117 (54.9%) |
Disability Status by Sex by Age in Montgomery Creek
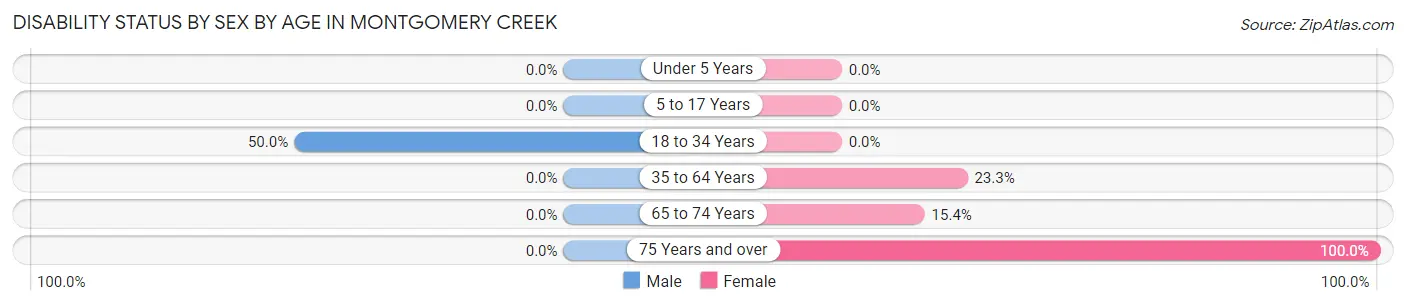
| Age Bracket | Male | Female |
| Under 5 Years | 0 (0.0%) | 0 (0.0%) |
| 5 to 17 Years | 0 (0.0%) | 0 (0.0%) |
| 18 to 34 Years | 2 (50.0%) | 0 (0.0%) |
| 35 to 64 Years | 0 (0.0%) | 14 (23.3%) |
| 65 to 74 Years | 0 (0.0%) | 4 (15.4%) |
| 75 Years and over | 0 (0.0%) | 13 (100.0%) |
Disability Class by Sex by Age in Montgomery Creek
Disability Class: Hearing Difficulty
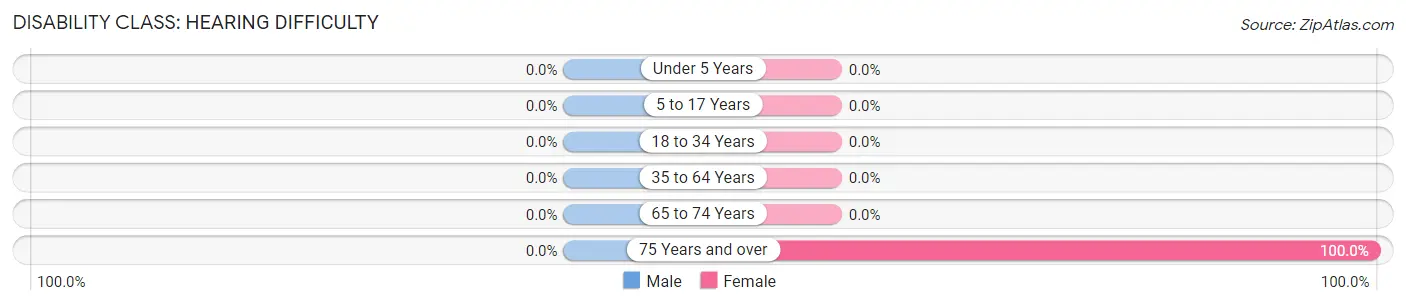
| Age Bracket | Male | Female |
| Under 5 Years | 0 (0.0%) | 0 (0.0%) |
| 5 to 17 Years | 0 (0.0%) | 0 (0.0%) |
| 18 to 34 Years | 0 (0.0%) | 0 (0.0%) |
| 35 to 64 Years | 0 (0.0%) | 0 (0.0%) |
| 65 to 74 Years | 0 (0.0%) | 0 (0.0%) |
| 75 Years and over | 0 (0.0%) | 13 (100.0%) |
Disability Class: Vision Difficulty
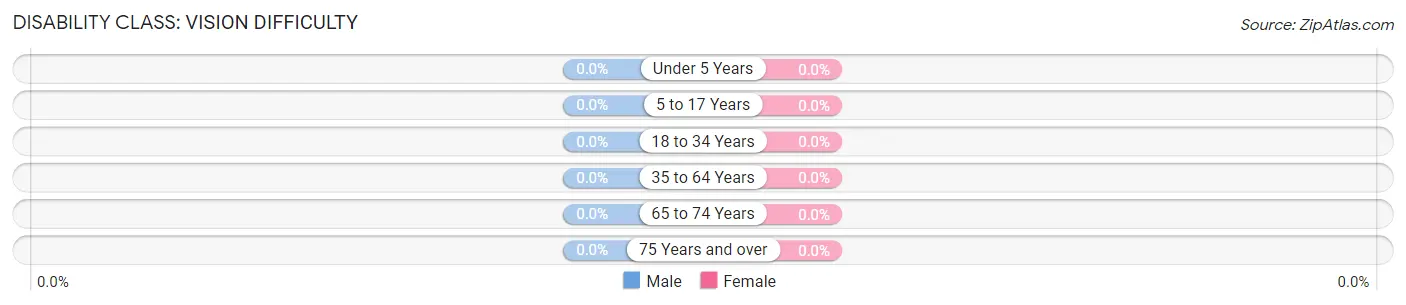
| Age Bracket | Male | Female |
| Under 5 Years | 0 (0.0%) | 0 (0.0%) |
| 5 to 17 Years | 0 (0.0%) | 0 (0.0%) |
| 18 to 34 Years | 0 (0.0%) | 0 (0.0%) |
| 35 to 64 Years | 0 (0.0%) | 0 (0.0%) |
| 65 to 74 Years | 0 (0.0%) | 0 (0.0%) |
| 75 Years and over | 0 (0.0%) | 0 (0.0%) |
Disability Class: Cognitive Difficulty
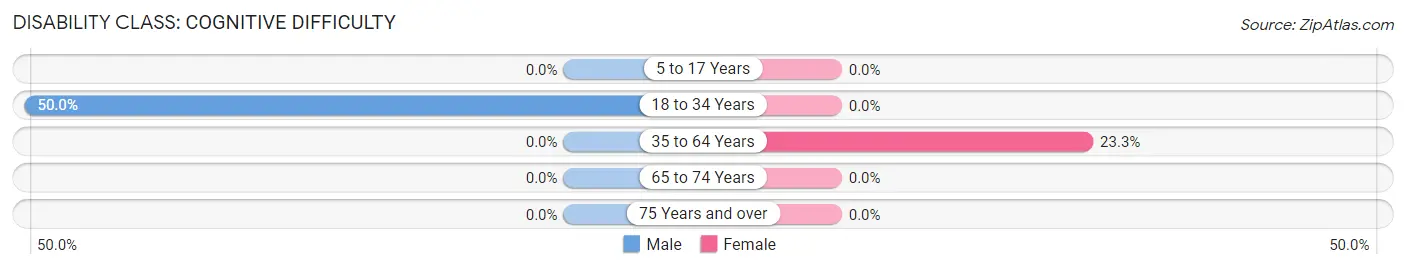
| Age Bracket | Male | Female |
| 5 to 17 Years | 0 (0.0%) | 0 (0.0%) |
| 18 to 34 Years | 2 (50.0%) | 0 (0.0%) |
| 35 to 64 Years | 0 (0.0%) | 14 (23.3%) |
| 65 to 74 Years | 0 (0.0%) | 0 (0.0%) |
| 75 Years and over | 0 (0.0%) | 0 (0.0%) |
Disability Class: Ambulatory Difficulty
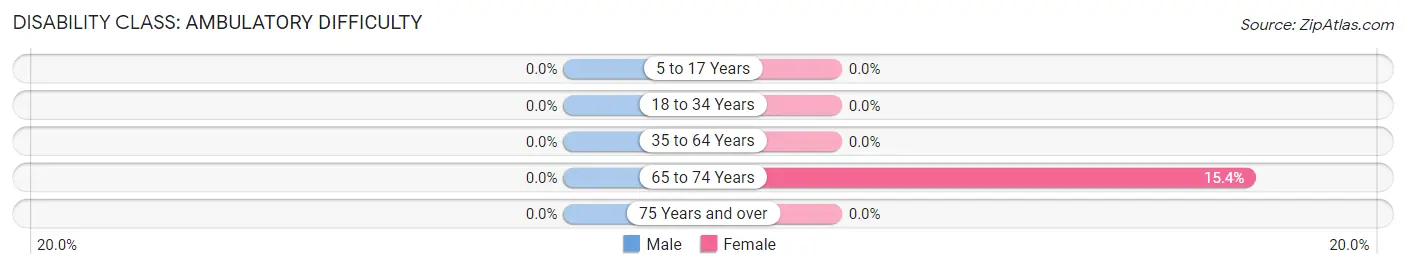
| Age Bracket | Male | Female |
| 5 to 17 Years | 0 (0.0%) | 0 (0.0%) |
| 18 to 34 Years | 0 (0.0%) | 0 (0.0%) |
| 35 to 64 Years | 0 (0.0%) | 0 (0.0%) |
| 65 to 74 Years | 0 (0.0%) | 4 (15.4%) |
| 75 Years and over | 0 (0.0%) | 0 (0.0%) |
Disability Class: Self-Care Difficulty
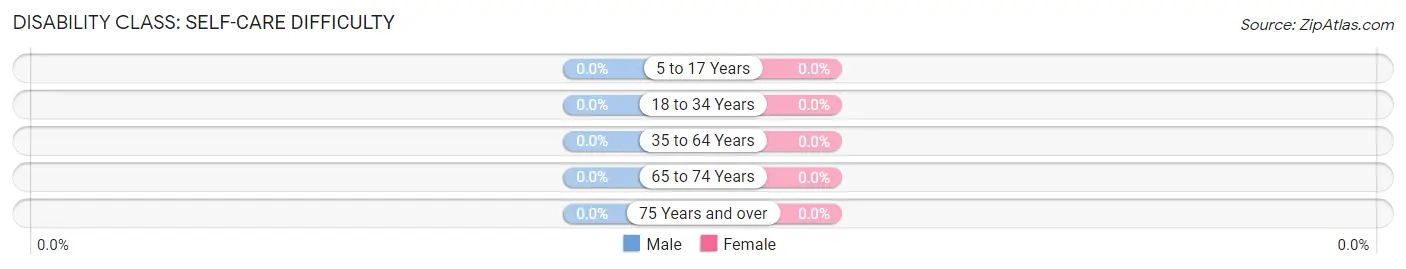
| Age Bracket | Male | Female |
| 5 to 17 Years | 0 (0.0%) | 0 (0.0%) |
| 18 to 34 Years | 0 (0.0%) | 0 (0.0%) |
| 35 to 64 Years | 0 (0.0%) | 0 (0.0%) |
| 65 to 74 Years | 0 (0.0%) | 0 (0.0%) |
| 75 Years and over | 0 (0.0%) | 0 (0.0%) |
Technology Access in Montgomery Creek
Computing Device Access in Montgomery Creek
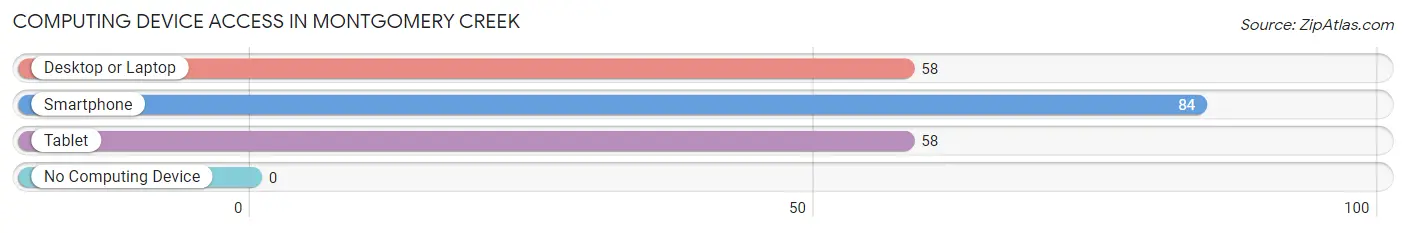
| Device Type | # Households | % Households |
| Desktop or Laptop | 58 | 65.9% |
| Smartphone | 84 | 95.5% |
| Tablet | 58 | 65.9% |
| No Computing Device | 0 | 0.0% |
| Total | 88 | 100.0% |
Internet Access in Montgomery Creek
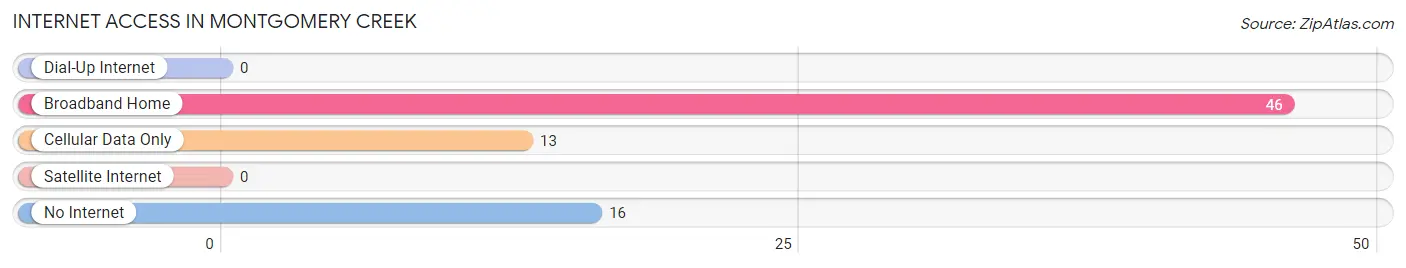
| Internet Type | # Households | % Households |
| Dial-Up Internet | 0 | 0.0% |
| Broadband Home | 46 | 52.3% |
| Cellular Data Only | 13 | 14.8% |
| Satellite Internet | 0 | 0.0% |
| No Internet | 16 | 18.2% |
| Total | 88 | 100.0% |
Montgomery Creek Summary
Montgomery Creek is a small unincorporated community located in Shasta County, California. It is situated in the northern part of the state, about 20 miles east of Redding. The population of Montgomery Creek was estimated to be around 1,000 people in 2020.
History
Montgomery Creek was first settled in the late 1800s by a group of miners who were looking for gold. The miners named the area after a nearby creek, which was named after a local rancher, William Montgomery. The miners were unsuccessful in their search for gold, but the area was eventually settled by ranchers and farmers.
The first post office in Montgomery Creek was established in 1891. The town was incorporated in 1909 and the first mayor was elected in 1910. The town grew slowly over the years, but it was not until the 1950s that the population began to increase significantly.
Geography
Montgomery Creek is located in the northern part of Shasta County, about 20 miles east of Redding. The town is situated in the foothills of the Cascade Range, at an elevation of 1,890 feet. The area is characterized by rolling hills and open grasslands. The climate is mild and dry, with hot summers and cold winters.
Economy
The economy of Montgomery Creek is largely based on agriculture and ranching. The area is known for its cattle and sheep ranches, as well as its orchards and vineyards. The town also has a few small businesses, including a grocery store, a hardware store, and a few restaurants.
Demographics
As of the 2020 census, the population of Montgomery Creek was estimated to be around 1,000 people. The racial makeup of the town was 94.3% White, 0.7% African American, 0.3% Native American, 0.3% Asian, 0.1% Pacific Islander, and 4.3% from other races. The median household income was $45,000, and the median home value was $220,000.
Conclusion
Montgomery Creek is a small unincorporated community located in Shasta County, California. It is situated in the northern part of the state, about 20 miles east of Redding. The population of Montgomery Creek was estimated to be around 1,000 people in 2020. The economy of Montgomery Creek is largely based on agriculture and ranching, and the town is known for its cattle and sheep ranches, as well as its orchards and vineyards. The racial makeup of the town was 94.3% White, 0.7% African American, 0.3% Native American, 0.3% Asian, 0.1% Pacific Islander, and 4.3% from other races. The median household income was $45,000, and the median home value was $220,000.
Common Questions
What is Per Capita Income in Montgomery Creek?
Per Capita income in Montgomery Creek is $44,600.
What is Inequality or Gini Index in Montgomery Creek?
Inequality or Gini Index in Montgomery Creek is 0.51.
What is the Total Population of Montgomery Creek?
Total Population of Montgomery Creek is 214.
What is the Total Male Population of Montgomery Creek?
Total Male Population of Montgomery Creek is 98.
What is the Total Female Population of Montgomery Creek?
Total Female Population of Montgomery Creek is 116.
What is the Ratio of Males per 100 Females in Montgomery Creek?
There are 84.48 Males per 100 Females in Montgomery Creek.
What is the Ratio of Females per 100 Males in Montgomery Creek?
There are 118.37 Females per 100 Males in Montgomery Creek.
What is the Median Population Age in Montgomery Creek?
Median Population Age in Montgomery Creek is 62.2 Years.
What is the Average Family Size in Montgomery Creek
Average Family Size in Montgomery Creek is 2.9 People.
What is the Average Household Size in Montgomery Creek
Average Household Size in Montgomery Creek is 2.4 People.
How Large is the Labor Force in Montgomery Creek?
There are 121 People in the Labor Forcein in Montgomery Creek.
What is the Percentage of People in the Labor Force in Montgomery Creek?
57.6% of People are in the Labor Force in Montgomery Creek.
What is the Unemployment Rate in Montgomery Creek?
Unemployment Rate in Montgomery Creek is 27.3%.