Cities with the Highest Percentage of Population Employed in Health Diagnosing & Treating in New Mexico
RELATED REPORTS & OPTIONS
Health Diagnosing & Treating
New Mexico
Compare Cities
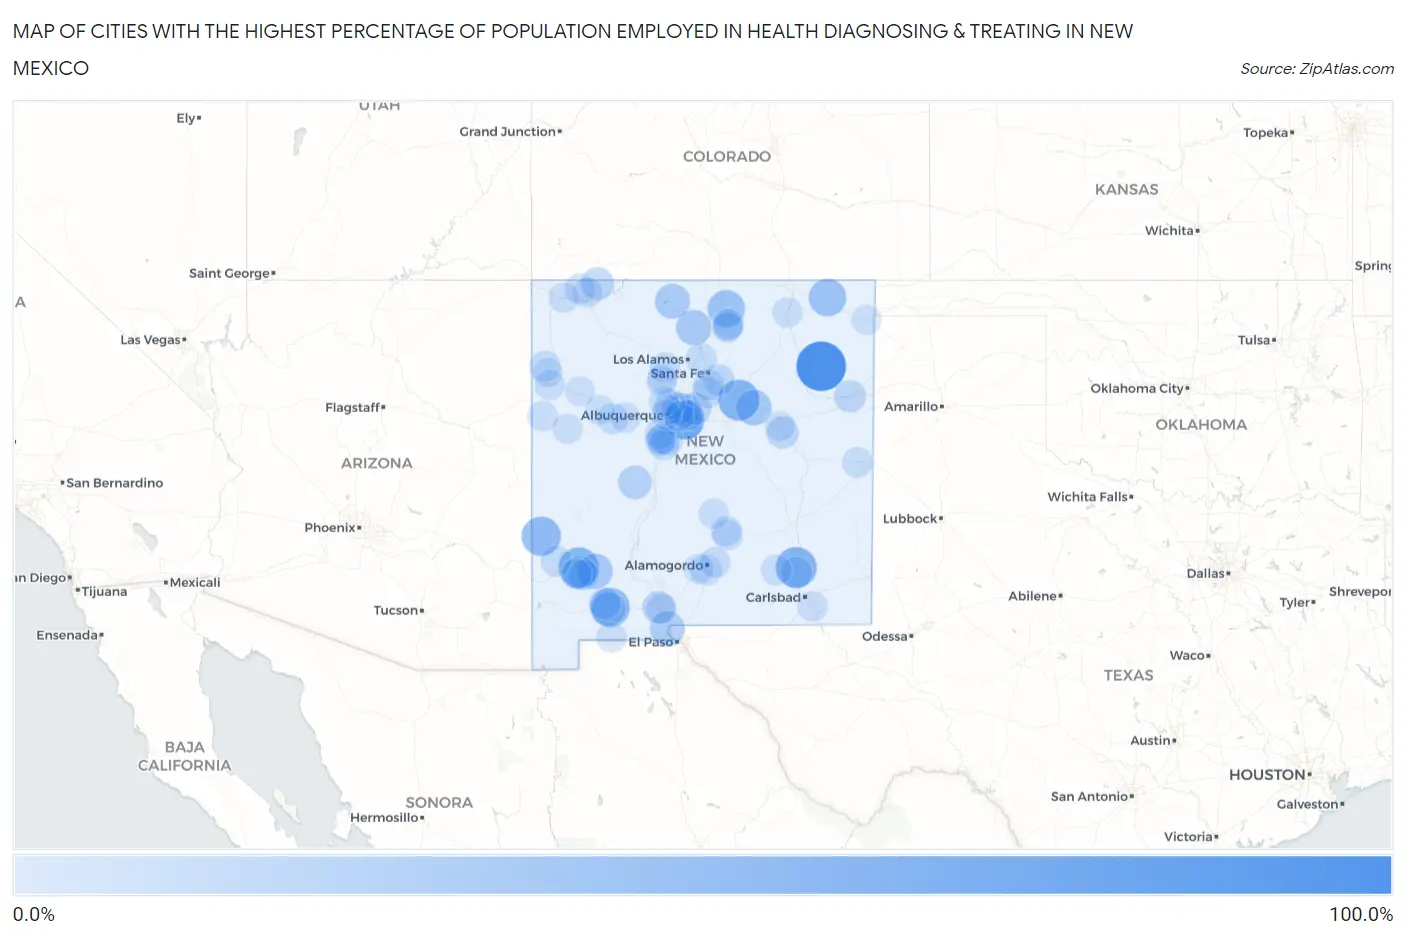
Map of Cities with the Highest Percentage of Population Employed in Health Diagnosing & Treating in New Mexico
0.0%
100.0%
Cities with the Highest Percentage of Population Employed in Health Diagnosing & Treating in New Mexico
| City | % Employed | vs State | vs National | |
| 1. | Medanales | 100.0% | 5.9%(+94.1)#1 | 6.2%(+93.8)#4 |
| 2. | Encantado | 100.0% | 5.9%(+94.1)#2 | 6.2%(+93.8)#8 |
| 3. | Mosquero | 100.0% | 5.9%(+94.1)#3 | 6.2%(+93.8)#16 |
| 4. | Sena | 58.0% | 5.9%(+52.0)#4 | 6.2%(+51.7)#47 |
| 5. | Morningside | 57.9% | 5.9%(+52.0)#5 | 6.2%(+51.7)#48 |
| 6. | Pinos Altos | 55.6% | 5.9%(+49.6)#6 | 6.2%(+49.3)#53 |
| 7. | Sagar | 54.8% | 5.9%(+48.9)#7 | 6.2%(+48.6)#57 |
| 8. | Pecan Park | 50.9% | 5.9%(+45.0)#8 | 6.2%(+44.7)#76 |
| 9. | Glenwood | 50.0% | 5.9%(+44.1)#9 | 6.2%(+43.8)#81 |
| 10. | Cedro | 49.4% | 5.9%(+43.4)#10 | 6.2%(+43.1)#86 |
| 11. | Des Moines | 41.7% | 5.9%(+35.7)#11 | 6.2%(+35.4)#132 |
| 12. | San Cristobal | 40.5% | 5.9%(+34.5)#12 | 6.2%(+34.2)#140 |
| 13. | Sunlit Hills | 38.3% | 5.9%(+32.4)#13 | 6.2%(+32.1)#158 |
| 14. | Anton Chico | 33.3% | 5.9%(+27.4)#14 | 6.2%(+27.1)#225 |
| 15. | San Lorenzo | 32.5% | 5.9%(+26.6)#15 | 6.2%(+26.3)#251 |
| 16. | Crestview | 31.7% | 5.9%(+25.8)#16 | 6.2%(+25.5)#275 |
| 17. | El Rito | 31.3% | 5.9%(+25.4)#17 | 6.2%(+25.1)#285 |
| 18. | Tierra Amarilla | 29.9% | 5.9%(+24.0)#18 | 6.2%(+23.7)#307 |
| 19. | La Union | 28.6% | 5.9%(+22.7)#19 | 6.2%(+22.4)#328 |
| 20. | Little Walnut | 28.4% | 5.9%(+22.4)#20 | 6.2%(+22.1)#345 |
| 21. | Williams Acres | 26.7% | 5.9%(+20.7)#21 | 6.2%(+20.4)#382 |
| 22. | Ventura | 25.2% | 5.9%(+19.2)#22 | 6.2%(+18.9)#432 |
| 23. | Sandia Park | 24.2% | 5.9%(+18.3)#23 | 6.2%(+18.0)#479 |
| 24. | Ponderosa Pine | 24.0% | 5.9%(+18.1)#24 | 6.2%(+17.8)#494 |
| 25. | Santa Fe Foothills | 23.1% | 5.9%(+17.2)#25 | 6.2%(+16.9)#539 |
| 26. | Arenas Valley | 23.1% | 5.9%(+17.1)#26 | 6.2%(+16.8)#544 |
| 27. | Magdalena | 23.0% | 5.9%(+17.1)#27 | 6.2%(+16.8)#546 |
| 28. | Cedar Hill | 19.7% | 5.9%(+13.8)#28 | 6.2%(+13.5)#775 |
| 29. | Mesilla | 19.0% | 5.9%(+13.1)#29 | 6.2%(+12.8)#837 |
| 30. | Cedar Grove | 19.0% | 5.9%(+13.1)#30 | 6.2%(+12.8)#841 |
| 31. | Barton | 18.2% | 5.9%(+12.3)#31 | 6.2%(+12.0)#926 |
| 32. | Puerto De Luna | 17.0% | 5.9%(+11.0)#32 | 6.2%(+10.7)#1,090 |
| 33. | Sandia Heights | 16.9% | 5.9%(+11.0)#33 | 6.2%(+10.7)#1,101 |
| 34. | Logan | 16.2% | 5.9%(+10.3)#34 | 6.2%(+9.95)#1,242 |
| 35. | Haystack | 15.0% | 5.9%(+9.06)#35 | 6.2%(+8.76)#1,510 |
| 36. | Lindrith | 15.0% | 5.9%(+9.01)#36 | 6.2%(+8.71)#1,519 |
| 37. | Keeler Farm | 14.4% | 5.9%(+8.45)#37 | 6.2%(+8.15)#1,680 |
| 38. | Glorieta | 14.3% | 5.9%(+8.35)#38 | 6.2%(+8.04)#1,702 |
| 39. | Atoka | 14.1% | 5.9%(+8.12)#39 | 6.2%(+7.81)#1,789 |
| 40. | Galisteo | 13.8% | 5.9%(+7.91)#40 | 6.2%(+7.60)#1,852 |
| 41. | Eldorado At Santa Fe | 12.4% | 5.9%(+6.41)#41 | 6.2%(+6.11)#2,506 |
| 42. | Ranchos De Taos | 12.3% | 5.9%(+6.31)#42 | 6.2%(+6.01)#2,554 |
| 43. | Boles Acres | 12.1% | 5.9%(+6.18)#43 | 6.2%(+5.88)#2,614 |
| 44. | Picacho Hills | 11.8% | 5.9%(+5.89)#44 | 6.2%(+5.59)#2,756 |
| 45. | Nakaibito | 11.8% | 5.9%(+5.82)#45 | 6.2%(+5.52)#2,798 |
| 46. | Cliff | 11.5% | 5.9%(+5.60)#46 | 6.2%(+5.29)#2,955 |
| 47. | Placitas Cdp Sandoval County | 11.4% | 5.9%(+5.44)#47 | 6.2%(+5.14)#3,069 |
| 48. | Jaconita | 11.4% | 5.9%(+5.43)#48 | 6.2%(+5.13)#3,073 |
| 49. | Skyline Ganipa | 11.3% | 5.9%(+5.39)#49 | 6.2%(+5.09)#3,100 |
| 50. | Tome | 11.0% | 5.9%(+5.11)#50 | 6.2%(+4.80)#3,304 |
| 51. | La Plata | 10.8% | 5.9%(+4.87)#51 | 6.2%(+4.57)#3,465 |
| 52. | Tano Road | 10.8% | 5.9%(+4.81)#52 | 6.2%(+4.51)#3,514 |
| 53. | Hope | 10.7% | 5.9%(+4.77)#53 | 6.2%(+4.47)#3,549 |
| 54. | Bayard | 10.6% | 5.9%(+4.67)#54 | 6.2%(+4.37)#3,628 |
| 55. | Las Maravillas | 10.5% | 5.9%(+4.54)#55 | 6.2%(+4.23)#3,754 |
| 56. | Ruidoso Downs | 10.4% | 5.9%(+4.48)#56 | 6.2%(+4.17)#3,801 |
| 57. | High Rolls | 10.1% | 5.9%(+4.13)#57 | 6.2%(+3.82)#4,136 |
| 58. | Taos | 10.0% | 5.9%(+4.04)#58 | 6.2%(+3.74)#4,238 |
| 59. | Talpa | 9.9% | 5.9%(+3.97)#59 | 6.2%(+3.66)#4,305 |
| 60. | Rio Communities | 9.8% | 5.9%(+3.89)#60 | 6.2%(+3.59)#4,393 |
| 61. | Cannon Afb | 9.8% | 5.9%(+3.88)#61 | 6.2%(+3.58)#4,407 |
| 62. | Silver City | 9.8% | 5.9%(+3.87)#62 | 6.2%(+3.56)#4,423 |
| 63. | Los Lunas | 9.6% | 5.9%(+3.68)#63 | 6.2%(+3.37)#4,625 |
| 64. | San Pablo | 9.6% | 5.9%(+3.65)#64 | 6.2%(+3.34)#4,664 |
| 65. | Fruitland | 9.5% | 5.9%(+3.58)#65 | 6.2%(+3.28)#4,734 |
| 66. | Jemez Springs | 9.4% | 5.9%(+3.47)#66 | 6.2%(+3.17)#4,873 |
| 67. | Rio Rancho Estates | 9.4% | 5.9%(+3.45)#67 | 6.2%(+3.14)#4,900 |
| 68. | Maxwell | 9.2% | 5.9%(+3.30)#68 | 6.2%(+3.00)#5,085 |
| 69. | Zuni Pueblo | 9.2% | 5.9%(+3.26)#69 | 6.2%(+2.96)#5,126 |
| 70. | Sedillo | 9.2% | 5.9%(+3.26)#70 | 6.2%(+2.95)#5,132 |
| 71. | Edith Enclave | 9.1% | 5.9%(+3.15)#71 | 6.2%(+2.85)#5,291 |
| 72. | Ruidoso | 9.0% | 5.9%(+3.10)#72 | 6.2%(+2.80)#5,355 |
| 73. | Corrales | 9.0% | 5.9%(+3.08)#73 | 6.2%(+2.77)#5,394 |
| 74. | Loving | 9.0% | 5.9%(+3.07)#74 | 6.2%(+2.77)#5,401 |
| 75. | Laguna | 8.7% | 5.9%(+2.80)#75 | 6.2%(+2.50)#5,790 |
| 76. | Los Chaves | 8.7% | 5.9%(+2.78)#76 | 6.2%(+2.48)#5,814 |
| 77. | Gallup | 8.7% | 5.9%(+2.75)#77 | 6.2%(+2.45)#5,871 |
| 78. | Tres Arroyos | 8.7% | 5.9%(+2.74)#78 | 6.2%(+2.43)#5,888 |
| 79. | Spencerville | 8.7% | 5.9%(+2.74)#79 | 6.2%(+2.43)#5,889 |
| 80. | Los Ranchos De Albuquerque | 8.7% | 5.9%(+2.73)#80 | 6.2%(+2.43)#5,897 |
| 81. | Fort Wingate | 8.4% | 5.9%(+2.50)#81 | 6.2%(+2.20)#6,256 |
| 82. | Carrizozo | 8.3% | 5.9%(+2.39)#82 | 6.2%(+2.09)#6,409 |
| 83. | Paa-Ko | 8.3% | 5.9%(+2.39)#83 | 6.2%(+2.09)#6,417 |
| 84. | Waterflow | 8.2% | 5.9%(+2.30)#84 | 6.2%(+1.99)#6,580 |
| 85. | Pinehill | 8.1% | 5.9%(+2.19)#85 | 6.2%(+1.89)#6,761 |
| 86. | Las Campanas | 8.1% | 5.9%(+2.14)#86 | 6.2%(+1.84)#6,843 |
| 87. | Holloman Afb | 8.1% | 5.9%(+2.14)#87 | 6.2%(+1.83)#6,857 |
| 88. | Grants | 7.8% | 5.9%(+1.82)#88 | 6.2%(+1.51)#7,458 |
| 89. | San Ysidro | 7.7% | 5.9%(+1.75)#89 | 6.2%(+1.45)#7,574 |
| 90. | Columbus | 7.6% | 5.9%(+1.64)#90 | 6.2%(+1.33)#7,837 |
| 91. | Thoreau | 7.5% | 5.9%(+1.56)#91 | 6.2%(+1.26)#8,004 |
| 92. | Jemez Pueblo | 7.5% | 5.9%(+1.55)#92 | 6.2%(+1.24)#8,035 |
| 93. | Clayton | 7.5% | 5.9%(+1.53)#93 | 6.2%(+1.23)#8,069 |
| 94. | Carnuel | 7.4% | 5.9%(+1.48)#94 | 6.2%(+1.18)#8,168 |
| 95. | Rio Rancho | 7.4% | 5.9%(+1.44)#95 | 6.2%(+1.13)#8,282 |
| 96. | Kirtland Afb | 7.4% | 5.9%(+1.43)#96 | 6.2%(+1.13)#8,292 |
| 97. | Albuquerque | 7.4% | 5.9%(+1.42)#97 | 6.2%(+1.11)#8,348 |
| 98. | Belen | 7.3% | 5.9%(+1.32)#98 | 6.2%(+1.02)#8,561 |
| 99. | Twin Lakes | 7.0% | 5.9%(+1.06)#99 | 6.2%(+0.755)#9,160 |
| 100. | Santa Rosa | 7.0% | 5.9%(+1.04)#100 | 6.2%(+0.740)#9,200 |
Common Questions
What are the Top 10 Cities with the Highest Percentage of Population Employed in Health Diagnosing & Treating in New Mexico?
Top 10 Cities with the Highest Percentage of Population Employed in Health Diagnosing & Treating in New Mexico are:
#1
100.0%
#2
58.0%
#3
57.9%
#4
55.6%
#5
50.9%
#6
50.0%
#7
49.4%
#8
41.7%
#9
40.5%
#10
33.3%
What city has the Highest Percentage of Population Employed in Health Diagnosing & Treating in New Mexico?
Mosquero has the Highest Percentage of Population Employed in Health Diagnosing & Treating in New Mexico with 100.0%.
What is the Percentage of Population Employed in Health Diagnosing & Treating in the State of New Mexico?
Percentage of Population Employed in Health Diagnosing & Treating in New Mexico is 5.9%.
What is the Percentage of Population Employed in Health Diagnosing & Treating in the United States?
Percentage of Population Employed in Health Diagnosing & Treating in the United States is 6.2%.