Port Costa, CA Map & Demographics
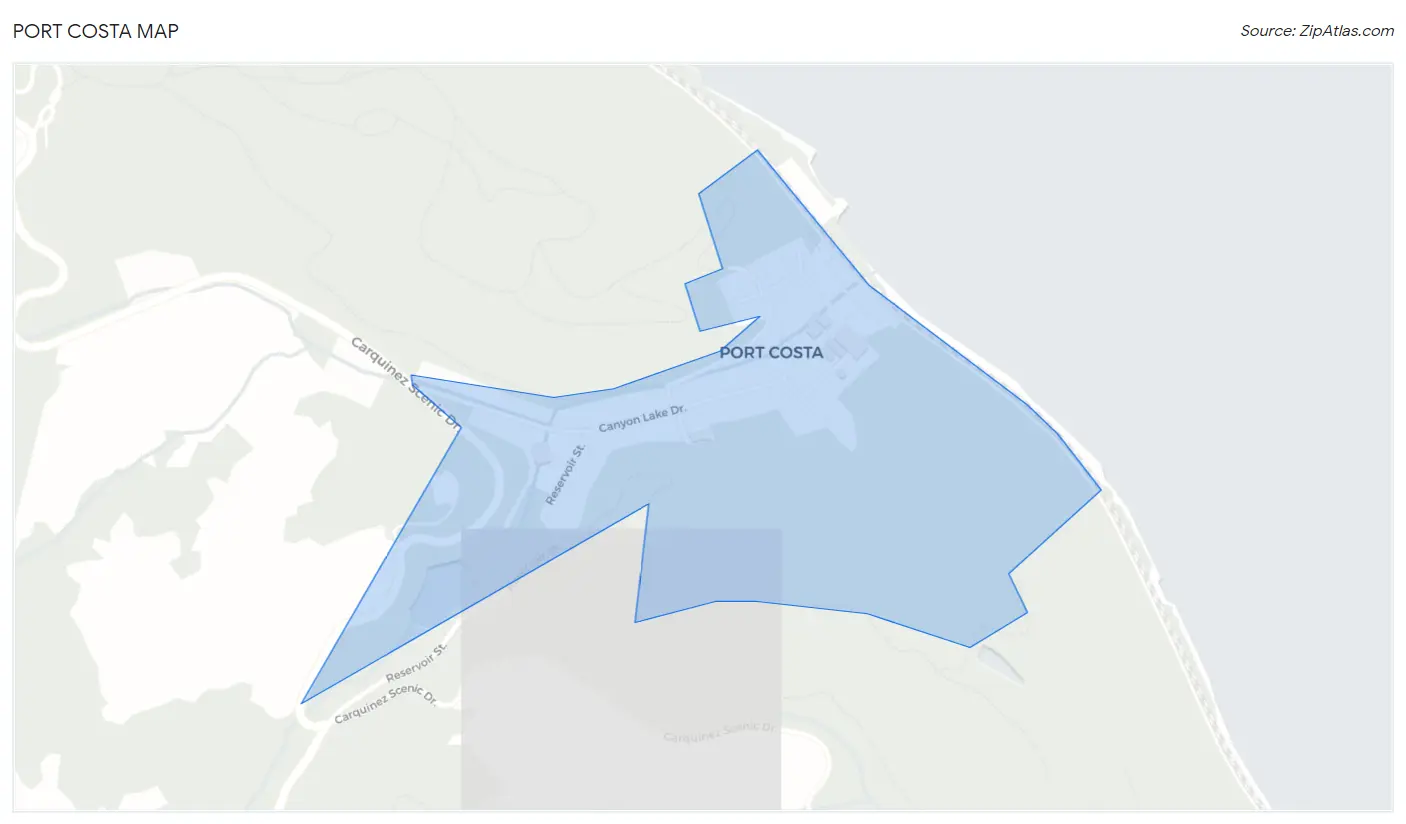
Port Costa Map
Port Costa Overview
$53,593
PER CAPITA INCOME
0.44
INEQUALITY / GINI INDEX
251
TOTAL POPULATION
175
MALE POPULATION
76
FEMALE POPULATION
230.26
MALES / 100 FEMALES
43.43
FEMALES / 100 MALES
66.8
MEDIAN AGE
1.9
AVG FAMILY SIZE
1.5
AVG HOUSEHOLD SIZE
149
LABOR FORCE [ PEOPLE ]
59.4%
PERCENT IN LABOR FORCE
7.4%
UNEMPLOYMENT RATE
Port Costa Zip Codes
Income in Port Costa
Income Overview in Port Costa
| Characteristic | Number | Measure |
| Per Capita Income | 251 | $53,593 |
| Median Family Income | 39 | $0 |
| Mean Family Income | 39 | $0 |
| Median Household Income | 171 | $0 |
| Mean Household Income | 171 | $77,217 |
| Income Deficit | 39 | $0 |
| Wage / Income Gap (%) | 251 | 0.00% |
| Wage / Income Gap ($) | 251 | 100.00¢ per $1 |
| Gini / Inequality Index | 251 | 0.44 |
Earnings by Sex in Port Costa
| Sex | Number | Average Earnings |
| Male | 100 (67.1%) | $0 |
| Female | 49 (32.9%) | $0 |
| Total | 149 (100.0%) | $0 |
Earnings by Sex by Income Bracket in Port Costa
The most common earnings brackets in Port Costa are $65,000 to $74,999 for men (50 | 50.0%) and $100,000+ for women (28 | 57.1%).
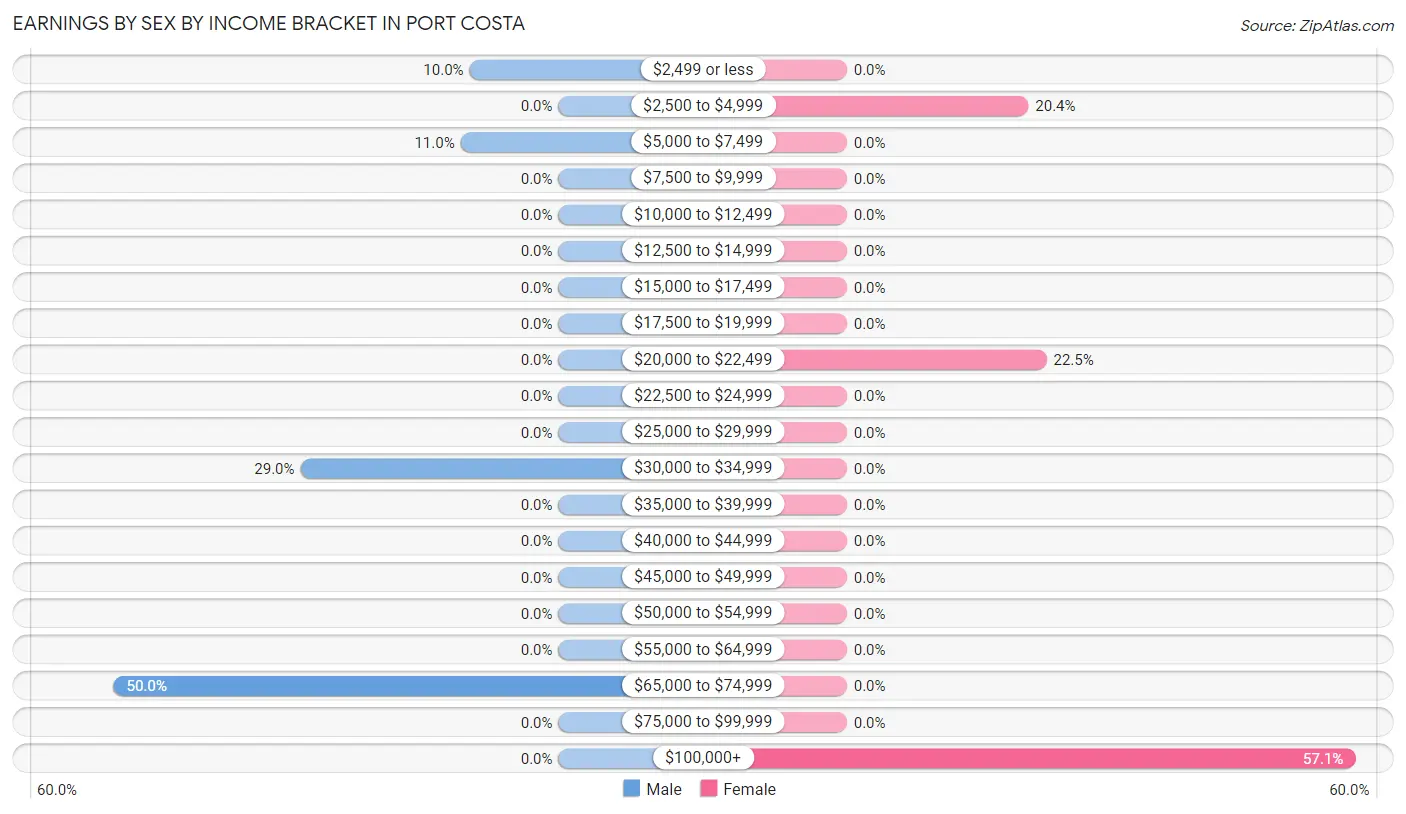
| Income | Male | Female |
| $2,499 or less | 10 (10.0%) | 0 (0.0%) |
| $2,500 to $4,999 | 0 (0.0%) | 10 (20.4%) |
| $5,000 to $7,499 | 11 (11.0%) | 0 (0.0%) |
| $7,500 to $9,999 | 0 (0.0%) | 0 (0.0%) |
| $10,000 to $12,499 | 0 (0.0%) | 0 (0.0%) |
| $12,500 to $14,999 | 0 (0.0%) | 0 (0.0%) |
| $15,000 to $17,499 | 0 (0.0%) | 0 (0.0%) |
| $17,500 to $19,999 | 0 (0.0%) | 0 (0.0%) |
| $20,000 to $22,499 | 0 (0.0%) | 11 (22.5%) |
| $22,500 to $24,999 | 0 (0.0%) | 0 (0.0%) |
| $25,000 to $29,999 | 0 (0.0%) | 0 (0.0%) |
| $30,000 to $34,999 | 29 (29.0%) | 0 (0.0%) |
| $35,000 to $39,999 | 0 (0.0%) | 0 (0.0%) |
| $40,000 to $44,999 | 0 (0.0%) | 0 (0.0%) |
| $45,000 to $49,999 | 0 (0.0%) | 0 (0.0%) |
| $50,000 to $54,999 | 0 (0.0%) | 0 (0.0%) |
| $55,000 to $64,999 | 0 (0.0%) | 0 (0.0%) |
| $65,000 to $74,999 | 50 (50.0%) | 0 (0.0%) |
| $75,000 to $99,999 | 0 (0.0%) | 0 (0.0%) |
| $100,000+ | 0 (0.0%) | 28 (57.1%) |
| Total | 100 (100.0%) | 49 (100.0%) |
Earnings by Sex by Educational Attainment in Port Costa
| Educational Attainment | Male Income | Female Income |
| Less than High School | - | - |
| High School Diploma | - | - |
| College or Associate's Degree | - | - |
| Bachelor's Degree | - | - |
| Graduate Degree | - | - |
| Total | - | - |
Family Income in Port Costa
Family Income Brackets in Port Costa
According to the Port Costa family income data, there are 39 families falling into the $75,000 to $99,999 income range, which is the most common income bracket and makes up 100.0% of all families.
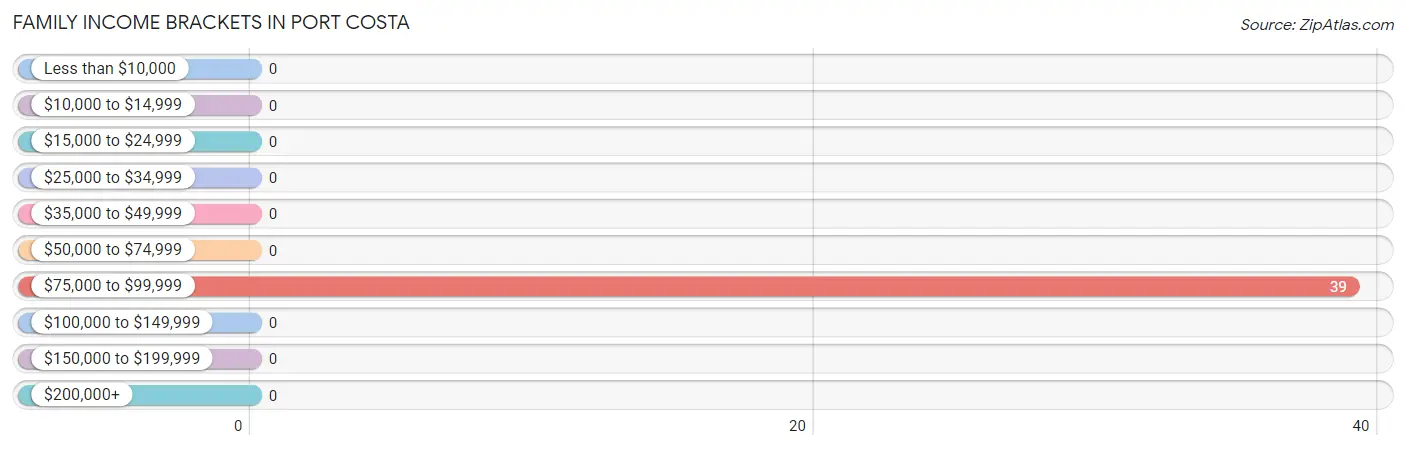
| Income Bracket | # Families | % Families |
| Less than $10,000 | 0 | 0.0% |
| $10,000 to $14,999 | 0 | 0.0% |
| $15,000 to $24,999 | 0 | 0.0% |
| $25,000 to $34,999 | 0 | 0.0% |
| $35,000 to $49,999 | 0 | 0.0% |
| $50,000 to $74,999 | 0 | 0.0% |
| $75,000 to $99,999 | 39 | 100.0% |
| $100,000 to $149,999 | 0 | 0.0% |
| $150,000 to $199,999 | 0 | 0.0% |
| $200,000+ | 0 | 0.0% |
Family Income by Famaliy Size in Port Costa
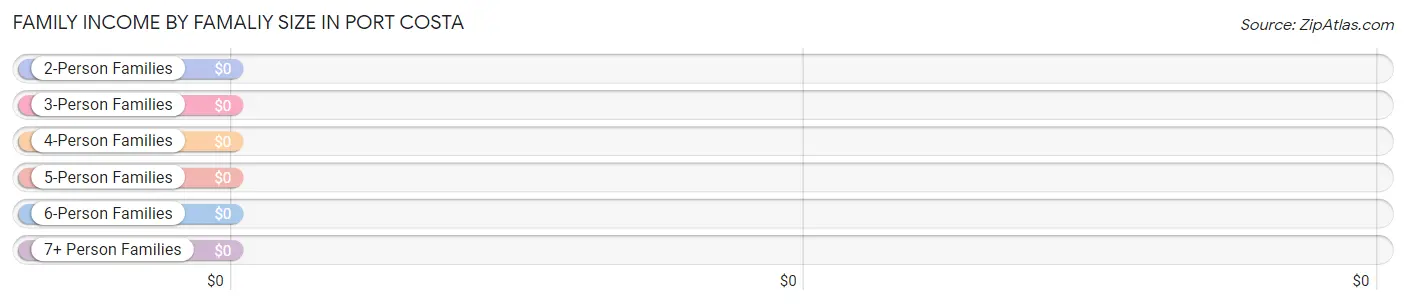
| Income Bracket | # Families | Median Income |
| 2-Person Families | 39 (100.0%) | $0 |
| 3-Person Families | 0 (0.0%) | $0 |
| 4-Person Families | 0 (0.0%) | $0 |
| 5-Person Families | 0 (0.0%) | $0 |
| 6-Person Families | 0 (0.0%) | $0 |
| 7+ Person Families | 0 (0.0%) | $0 |
| Total | 39 (100.0%) | $0 |
Family Income by Number of Earners in Port Costa
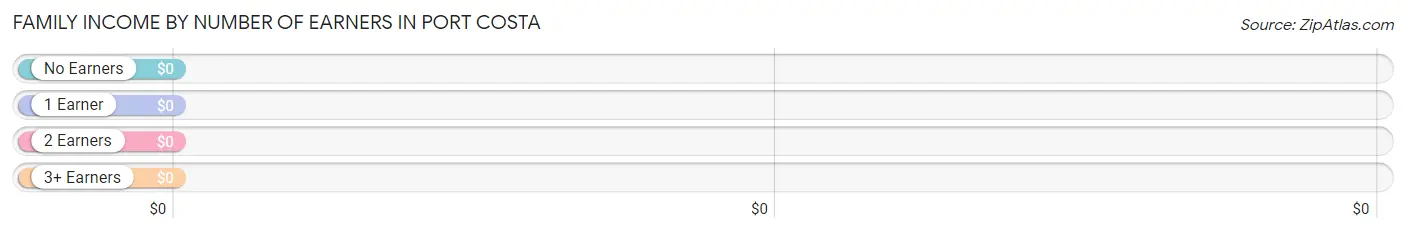
| Number of Earners | # Families | Median Income |
| No Earners | 0 (0.0%) | $0 |
| 1 Earner | 29 (74.4%) | $0 |
| 2 Earners | 10 (25.6%) | $0 |
| 3+ Earners | 0 (0.0%) | $0 |
| Total | 39 (100.0%) | $0 |
Household Income in Port Costa
Household Income Brackets in Port Costa
With 86 households falling in the category, the $25,000 to $34,999 income range is the most frequent in Port Costa, accounting for 50.3% of all households.
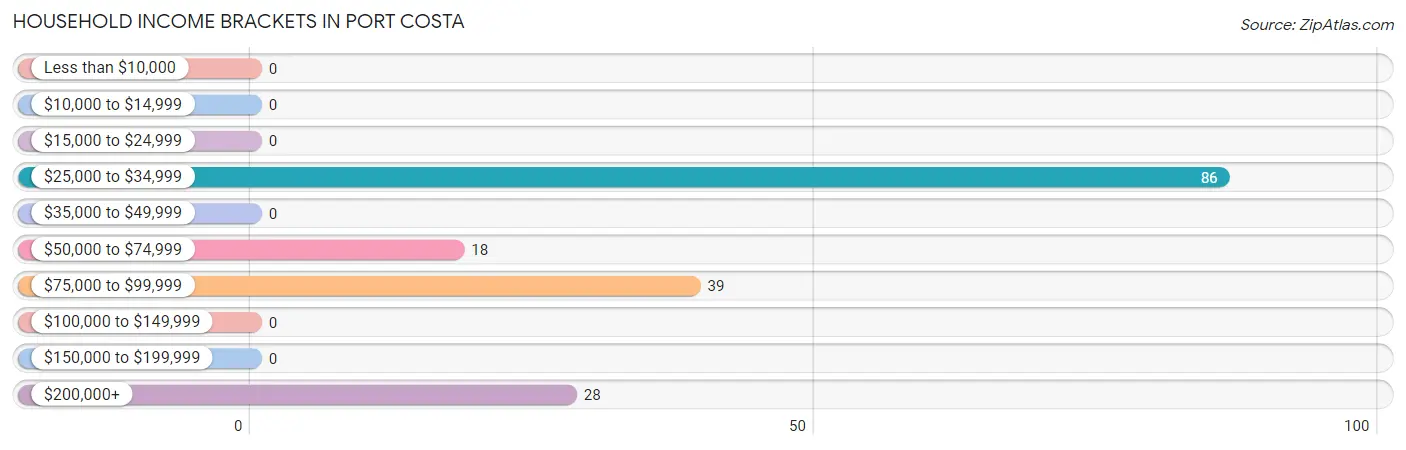
| Income Bracket | # Households | % Households |
| Less than $10,000 | 0 | 0.0% |
| $10,000 to $14,999 | 0 | 0.0% |
| $15,000 to $24,999 | 0 | 0.0% |
| $25,000 to $34,999 | 86 | 50.3% |
| $35,000 to $49,999 | 0 | 0.0% |
| $50,000 to $74,999 | 18 | 10.5% |
| $75,000 to $99,999 | 39 | 22.8% |
| $100,000 to $149,999 | 0 | 0.0% |
| $150,000 to $199,999 | 0 | 0.0% |
| $200,000+ | 28 | 16.4% |
Household Income by Householder Age in Port Costa
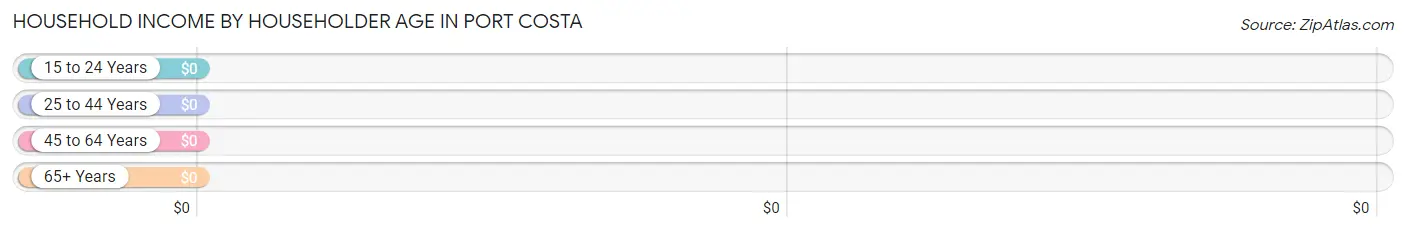
| Income Bracket | # Households | Median Income |
| 15 to 24 Years | 0 (0.0%) | $0 |
| 25 to 44 Years | 18 (10.5%) | $0 |
| 45 to 64 Years | 28 (16.4%) | $0 |
| 65+ Years | 125 (73.1%) | $0 |
| Total | 171 (100.0%) | $0 |
Poverty in Port Costa
Income Below Poverty by Sex and Age in Port Costa
| Age Bracket | Male | Female |
| Under 5 Years | 0 (0.0%) | 0 (0.0%) |
| 5 Years | 0 (0.0%) | 0 (0.0%) |
| 6 to 11 Years | 0 (0.0%) | 0 (0.0%) |
| 12 to 14 Years | 0 (0.0%) | 0 (0.0%) |
| 15 Years | 0 (0.0%) | 0 (0.0%) |
| 16 and 17 Years | 0 (0.0%) | 0 (0.0%) |
| 18 to 24 Years | 0 (0.0%) | 0 (0.0%) |
| 25 to 34 Years | 0 (0.0%) | 0 (0.0%) |
| 35 to 44 Years | 0 (0.0%) | 0 (0.0%) |
| 45 to 54 Years | 0 (0.0%) | 0 (0.0%) |
| 55 to 64 Years | 0 (0.0%) | 0 (0.0%) |
| 65 to 74 Years | 0 (0.0%) | 0 (0.0%) |
| 75 Years and over | 0 (0.0%) | 0 (0.0%) |
| Total | 0 (0.0%) | 0 (0.0%) |
Income Above Poverty by Sex and Age in Port Costa
According to the poverty statistics in Port Costa, males aged 35 to 44 years and females aged 55 to 64 years are the age groups that are most secure financially, with 100.0% of males and 100.0% of females in these age groups living above the poverty line.
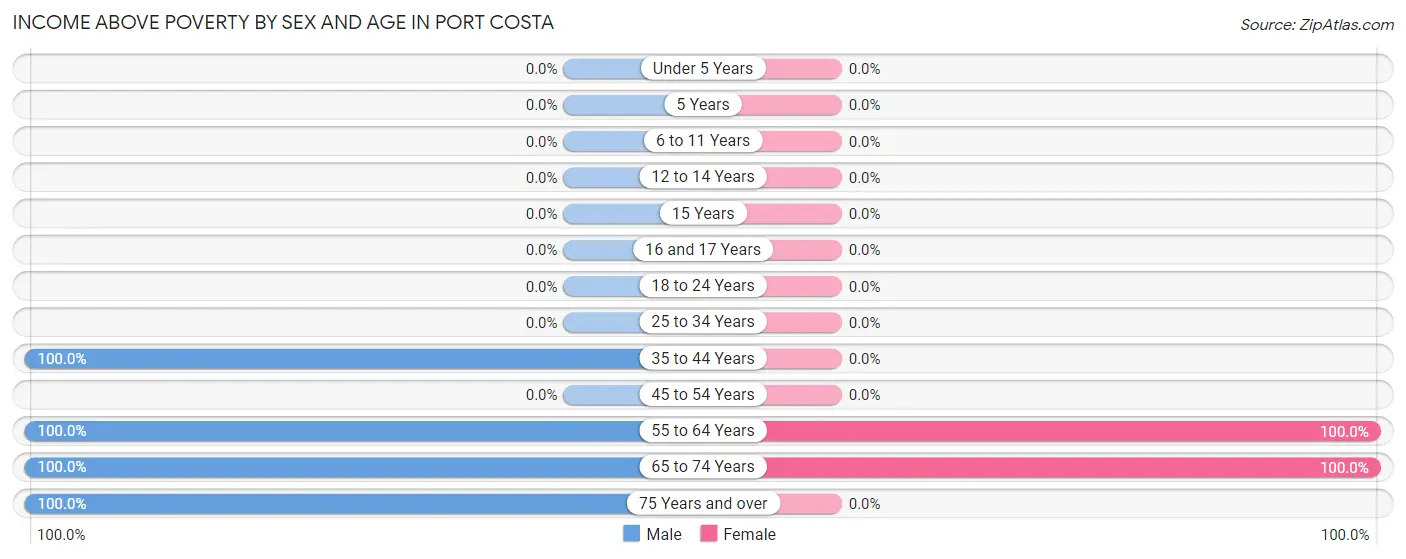
| Age Bracket | Male | Female |
| Under 5 Years | 0 (0.0%) | 0 (0.0%) |
| 5 Years | 0 (0.0%) | 0 (0.0%) |
| 6 to 11 Years | 0 (0.0%) | 0 (0.0%) |
| 12 to 14 Years | 0 (0.0%) | 0 (0.0%) |
| 15 Years | 0 (0.0%) | 0 (0.0%) |
| 16 and 17 Years | 0 (0.0%) | 0 (0.0%) |
| 18 to 24 Years | 0 (0.0%) | 0 (0.0%) |
| 25 to 34 Years | 0 (0.0%) | 0 (0.0%) |
| 35 to 44 Years | 18 (100.0%) | 0 (0.0%) |
| 45 to 54 Years | 0 (0.0%) | 0 (0.0%) |
| 55 to 64 Years | 32 (100.0%) | 39 (100.0%) |
| 65 to 74 Years | 50 (100.0%) | 37 (100.0%) |
| 75 Years and over | 75 (100.0%) | 0 (0.0%) |
| Total | 175 (100.0%) | 76 (100.0%) |
Income Below Poverty Among Married-Couple Families in Port Costa
| Children | Above Poverty | Below Poverty |
| No Children | 39 (100.0%) | 0 (0.0%) |
| 1 or 2 Children | 0 (0.0%) | 0 (0.0%) |
| 3 or 4 Children | 0 (0.0%) | 0 (0.0%) |
| 5 or more Children | 0 (0.0%) | 0 (0.0%) |
| Total | 39 (100.0%) | 0 (0.0%) |
Income Below Poverty Among Single-Parent Households in Port Costa
| Children | Single Father | Single Mother |
| No Children | 0 (0.0%) | 0 (0.0%) |
| 1 or 2 Children | 0 (0.0%) | 0 (0.0%) |
| 3 or 4 Children | 0 (0.0%) | 0 (0.0%) |
| 5 or more Children | 0 (0.0%) | 0 (0.0%) |
| Total | 0 (0.0%) | 0 (0.0%) |
Income Below Poverty Among Married-Couple vs Single-Parent Households in Port Costa
| Children | Married-Couple Families | Single-Parent Households |
| No Children | 0 (0.0%) | 0 (0.0%) |
| 1 or 2 Children | 0 (0.0%) | 0 (0.0%) |
| 3 or 4 Children | 0 (0.0%) | 0 (0.0%) |
| 5 or more Children | 0 (0.0%) | 0 (0.0%) |
| Total | 0 (0.0%) | 0 (0.0%) |
Race in Port Costa
The most populous races in Port Costa are White / Caucasian (222 | 88.4%), Hispanic or Latino (29 | 11.6%), and Some other Race (18 | 7.2%).
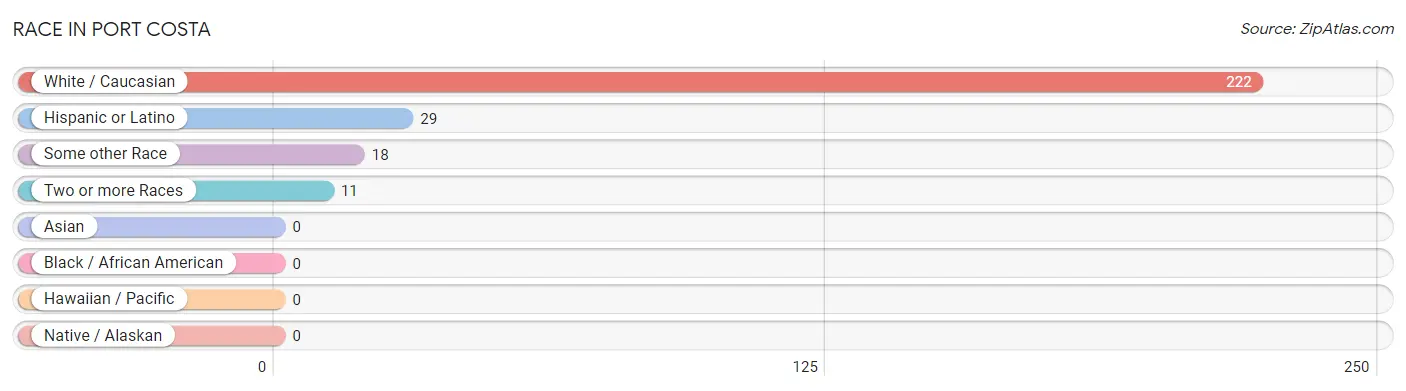
| Race | # Population | % Population |
| Asian | 0 | 0.0% |
| Black / African American | 0 | 0.0% |
| Hawaiian / Pacific | 0 | 0.0% |
| Hispanic or Latino | 29 | 11.6% |
| Native / Alaskan | 0 | 0.0% |
| White / Caucasian | 222 | 88.4% |
| Two or more Races | 11 | 4.4% |
| Some other Race | 18 | 7.2% |
| Total | 251 | 100.0% |
Ancestry in Port Costa
The most populous ancestries reported in Port Costa are Irish (201 | 80.1%), German (162 | 64.5%), Norwegian (28 | 11.2%), Central American (18 | 7.2%), and Guatemalan (18 | 7.2%), together accounting for 170.1% of all Port Costa residents.
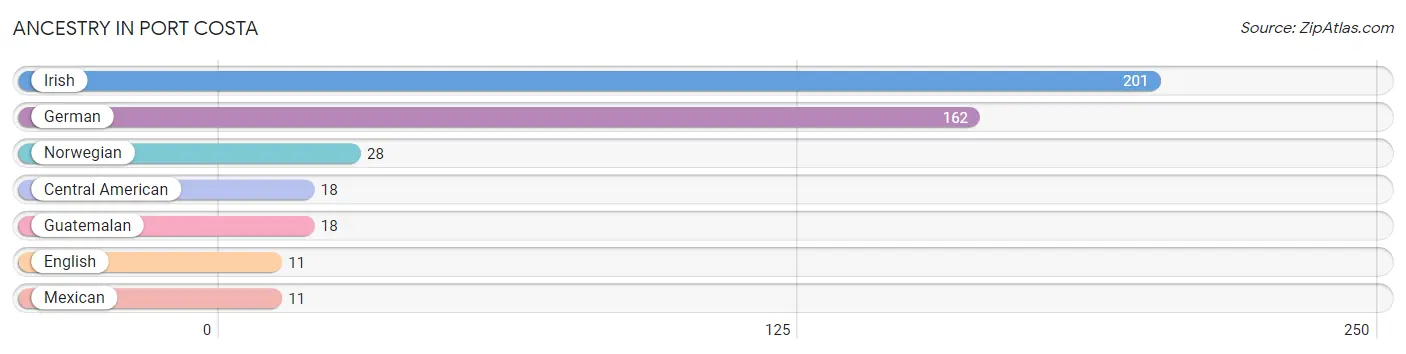
| Ancestry | # Population | % Population |
| Central American | 18 | 7.2% |
| English | 11 | 4.4% |
| German | 162 | 64.5% |
| Guatemalan | 18 | 7.2% |
| Irish | 201 | 80.1% |
| Mexican | 11 | 4.4% |
| Norwegian | 28 | 11.2% | View All 7 Rows |
Immigrants in Port Costa
The most numerous immigrant groups reported in Port Costa came from Central America (18 | 7.2%), Guatemala (18 | 7.2%), and Latin America (18 | 7.2%), together accounting for 21.5% of all Port Costa residents.
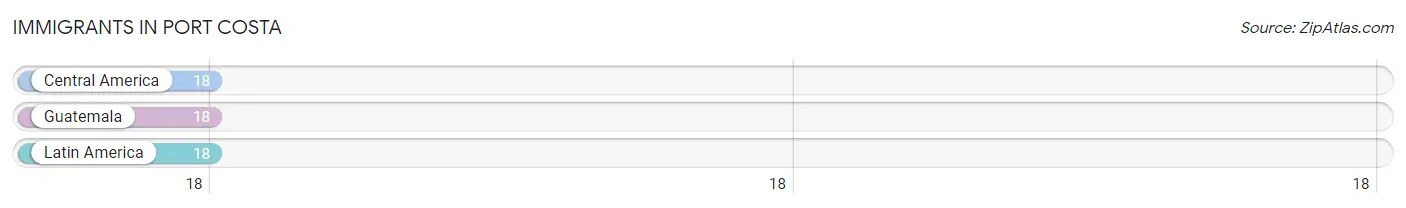
| Immigration Origin | # Population | % Population |
| Central America | 18 | 7.2% |
| Guatemala | 18 | 7.2% |
| Latin America | 18 | 7.2% | View All 3 Rows |
Sex and Age in Port Costa
Sex and Age in Port Costa
The most populous age groups in Port Costa are 75 to 79 Years (75 | 42.9%) for men and 65 to 69 Years (37 | 48.7%) for women.
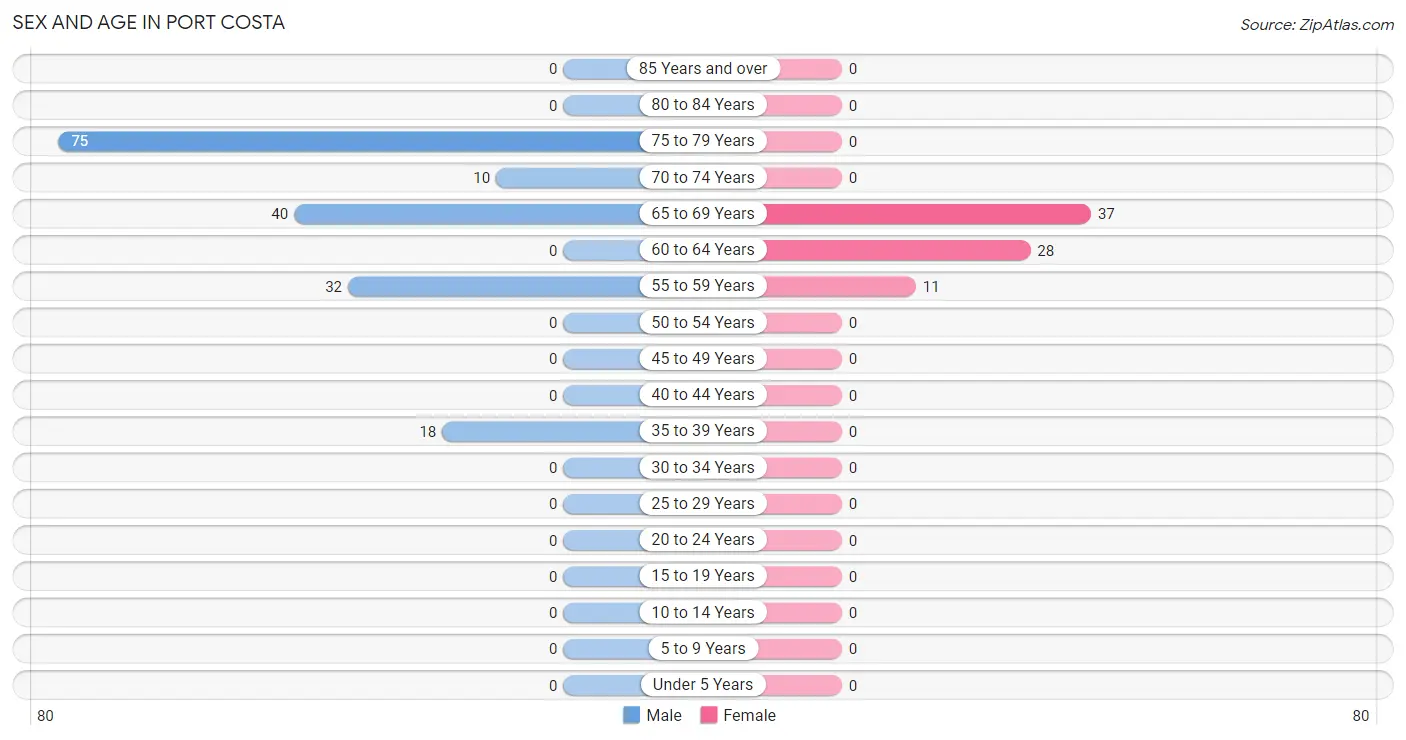
| Age Bracket | Male | Female |
| Under 5 Years | 0 (0.0%) | 0 (0.0%) |
| 5 to 9 Years | 0 (0.0%) | 0 (0.0%) |
| 10 to 14 Years | 0 (0.0%) | 0 (0.0%) |
| 15 to 19 Years | 0 (0.0%) | 0 (0.0%) |
| 20 to 24 Years | 0 (0.0%) | 0 (0.0%) |
| 25 to 29 Years | 0 (0.0%) | 0 (0.0%) |
| 30 to 34 Years | 0 (0.0%) | 0 (0.0%) |
| 35 to 39 Years | 18 (10.3%) | 0 (0.0%) |
| 40 to 44 Years | 0 (0.0%) | 0 (0.0%) |
| 45 to 49 Years | 0 (0.0%) | 0 (0.0%) |
| 50 to 54 Years | 0 (0.0%) | 0 (0.0%) |
| 55 to 59 Years | 32 (18.3%) | 11 (14.5%) |
| 60 to 64 Years | 0 (0.0%) | 28 (36.8%) |
| 65 to 69 Years | 40 (22.9%) | 37 (48.7%) |
| 70 to 74 Years | 10 (5.7%) | 0 (0.0%) |
| 75 to 79 Years | 75 (42.9%) | 0 (0.0%) |
| 80 to 84 Years | 0 (0.0%) | 0 (0.0%) |
| 85 Years and over | 0 (0.0%) | 0 (0.0%) |
| Total | 175 (100.0%) | 76 (100.0%) |
Families and Households in Port Costa
Median Family Size in Port Costa
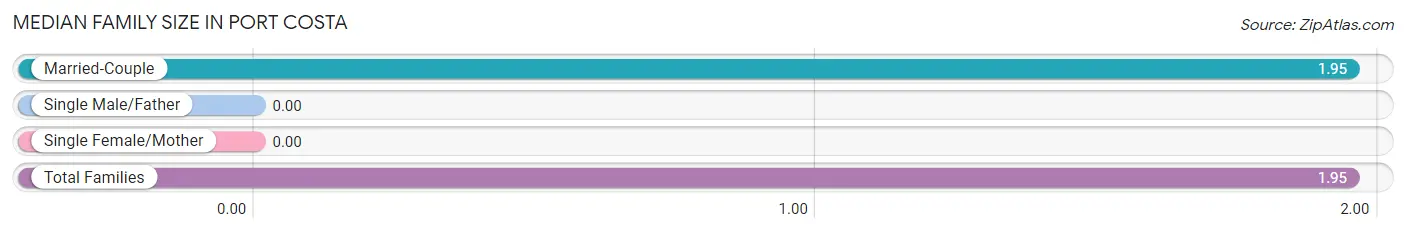
| Family Type | # Families | Family Size |
| Married-Couple | 39 (100.0%) | 1.95 |
| Single Male/Father | 0 (0.0%) | - |
| Single Female/Mother | 0 (0.0%) | - |
| Total Families | 39 (100.0%) | 1.95 |
Median Household Size in Port Costa
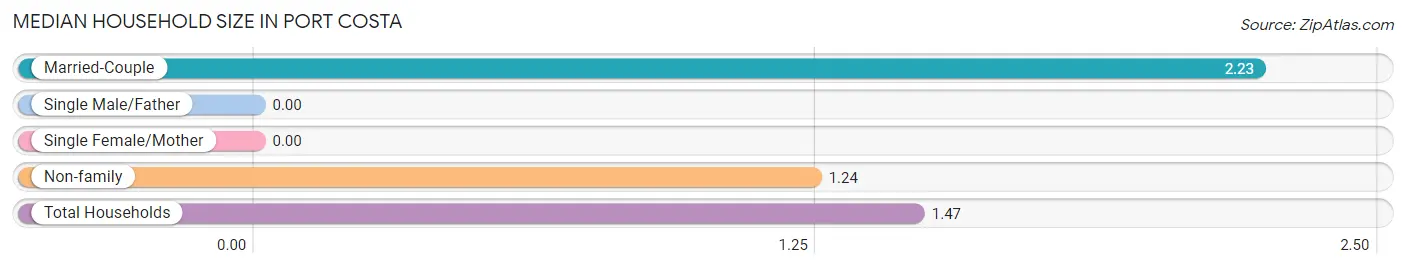
| Household Type | # Households | Household Size |
| Married-Couple | 39 (22.8%) | 2.23 |
| Single Male/Father | 0 (0.0%) | - |
| Single Female/Mother | 0 (0.0%) | - |
| Non-family | 132 (77.2%) | 1.24 |
| Total Households | 171 (100.0%) | 1.47 |
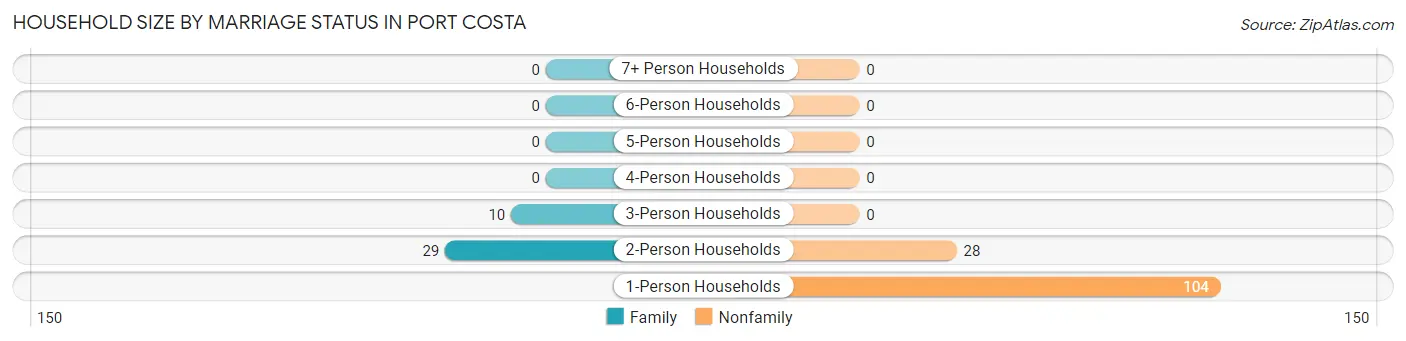
Household Size by Marriage Status in Port Costa
Out of a total of 171 households in Port Costa, 39 (22.8%) are family households, while 132 (77.2%) are nonfamily households. The most numerous type of family households are 2-person households, comprising 29, and the most common type of nonfamily households are 1-person households, comprising 104.
| Household Size | Family Households | Nonfamily Households |
| 1-Person Households | - | 104 (60.8%) |
| 2-Person Households | 29 (17.0%) | 28 (16.4%) |
| 3-Person Households | 10 (5.9%) | 0 (0.0%) |
| 4-Person Households | 0 (0.0%) | 0 (0.0%) |
| 5-Person Households | 0 (0.0%) | 0 (0.0%) |
| 6-Person Households | 0 (0.0%) | 0 (0.0%) |
| 7+ Person Households | 0 (0.0%) | 0 (0.0%) |
| Total | 39 (22.8%) | 132 (77.2%) |
Female Fertility in Port Costa
Fertility by Age in Port Costa
| Age Bracket | Women with Births | Births / 1,000 Women |
| 15 to 19 years | 0 (0.0%) | 0.0 |
| 20 to 34 years | 0 (0.0%) | 0.0 |
| 35 to 50 years | 0 (0.0%) | 0.0 |
| Total | 0 (0.0%) | 0.0 |
Fertility by Age by Marriage Status in Port Costa
| Age Bracket | Married | Unmarried |
| 15 to 19 years | 0 (0.0%) | 0 (0.0%) |
| 20 to 34 years | 0 (0.0%) | 0 (0.0%) |
| 35 to 50 years | 0 (0.0%) | 0 (0.0%) |
| Total | 0 (0.0%) | 0 (0.0%) |
Fertility by Education in Port Costa
| Educational Attainment | Women with Births | Births / 1,000 Women |
| Less than High School | 0 (0.0%) | 0.0 |
| High School Diploma | 0 (0.0%) | 0.0 |
| College or Associate's Degree | 0 (0.0%) | 0.0 |
| Bachelor's Degree | 0 (0.0%) | 0.0 |
| Graduate Degree | 0 (0.0%) | 0.0 |
| Total | 0 (0.0%) | 0.0 |
Fertility by Education by Marriage Status in Port Costa
| Educational Attainment | Married | Unmarried |
| Less than High School | 0 (0.0%) | 0 (0.0%) |
| High School Diploma | 0 (0.0%) | 0 (0.0%) |
| College or Associate's Degree | 0 (0.0%) | 0 (0.0%) |
| Bachelor's Degree | 0 (0.0%) | 0 (0.0%) |
| Graduate Degree | 0 (0.0%) | 0 (0.0%) |
| Total | 0 (0.0%) | 0 (0.0%) |
Employment Characteristics in Port Costa
Employment by Class of Employer in Port Costa
Among the 127 employed individuals in Port Costa, private company employees (50 | 39.4%), local government employees (48 | 37.8%), and self-employed (not incorporated) (29 | 22.8%) make up the most common classes of employment.
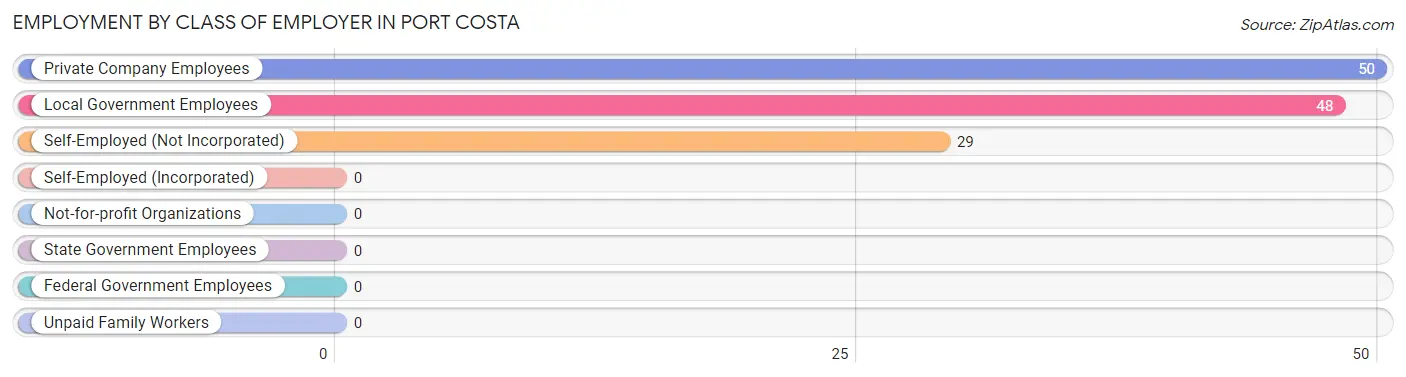
| Employer Class | # Employees | % Employees |
| Private Company Employees | 50 | 39.4% |
| Self-Employed (Incorporated) | 0 | 0.0% |
| Self-Employed (Not Incorporated) | 29 | 22.8% |
| Not-for-profit Organizations | 0 | 0.0% |
| Local Government Employees | 48 | 37.8% |
| State Government Employees | 0 | 0.0% |
| Federal Government Employees | 0 | 0.0% |
| Unpaid Family Workers | 0 | 0.0% |
| Total | 127 | 100.0% |
Employment Status by Age in Port Costa
According to the labor force statistics for Port Costa, out of the total population over 16 years of age (251), 59.4% or 149 individuals are in the labor force, with 7.4% or 11 of them unemployed. The age group with the highest labor force participation rate is 35 to 44 years, with 100.0% or 18 individuals in the labor force. Within the labor force, the 65 to 74 years age range has the highest percentage of unemployed individuals, with 18.3% or 11 of them being unemployed.
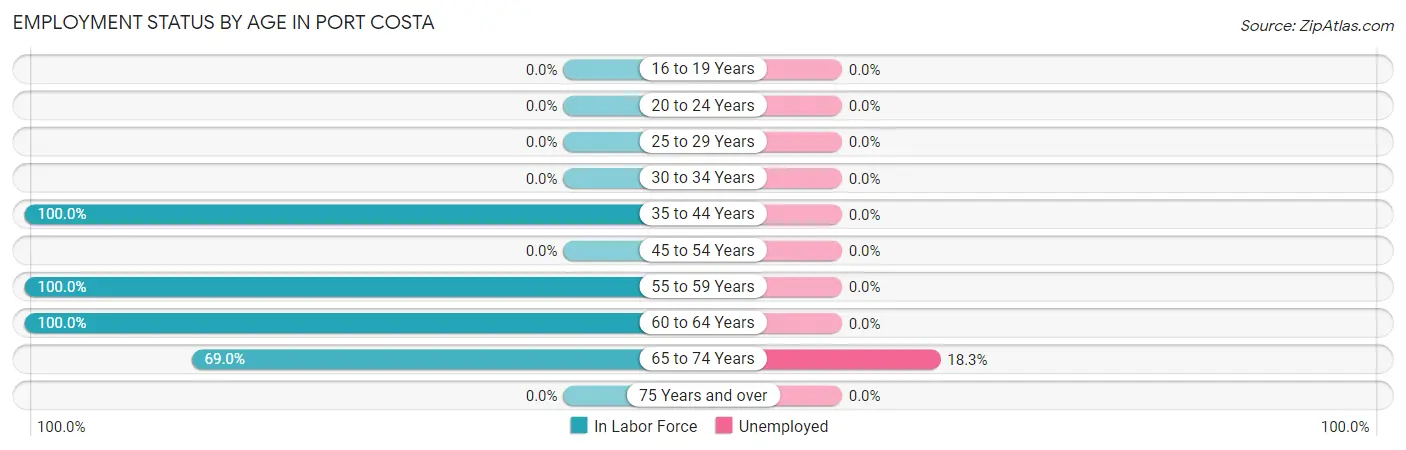
| Age Bracket | In Labor Force | Unemployed |
| 16 to 19 Years | 0 (0.0%) | 0 (0.0%) |
| 20 to 24 Years | 0 (0.0%) | 0 (0.0%) |
| 25 to 29 Years | 0 (0.0%) | 0 (0.0%) |
| 30 to 34 Years | 0 (0.0%) | 0 (0.0%) |
| 35 to 44 Years | 18 (100.0%) | 0 (0.0%) |
| 45 to 54 Years | 0 (0.0%) | 0 (0.0%) |
| 55 to 59 Years | 43 (100.0%) | 0 (0.0%) |
| 60 to 64 Years | 28 (100.0%) | 0 (0.0%) |
| 65 to 74 Years | 60 (69.0%) | 11 (18.3%) |
| 75 Years and over | 0 (0.0%) | 0 (0.0%) |
| Total | 149 (59.4%) | 11 (7.4%) |
Employment Status by Educational Attainment in Port Costa
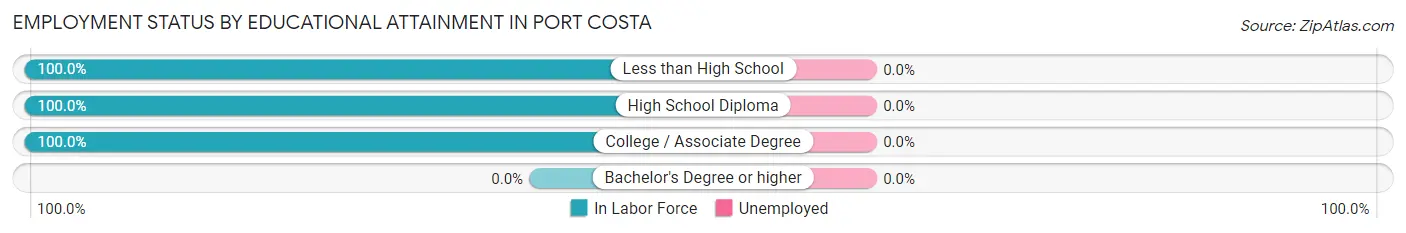
| Educational Attainment | In Labor Force | Unemployed |
| Less than High School | 32 (100.0%) | 0 (0.0%) |
| High School Diploma | 29 (100.0%) | 0 (0.0%) |
| College / Associate Degree | 28 (100.0%) | 0 (0.0%) |
| Bachelor's Degree or higher | 0 (0.0%) | 0 (0.0%) |
| Total | 89 (100.0%) | 0 (0.0%) |
Employment Occupations by Sex in Port Costa
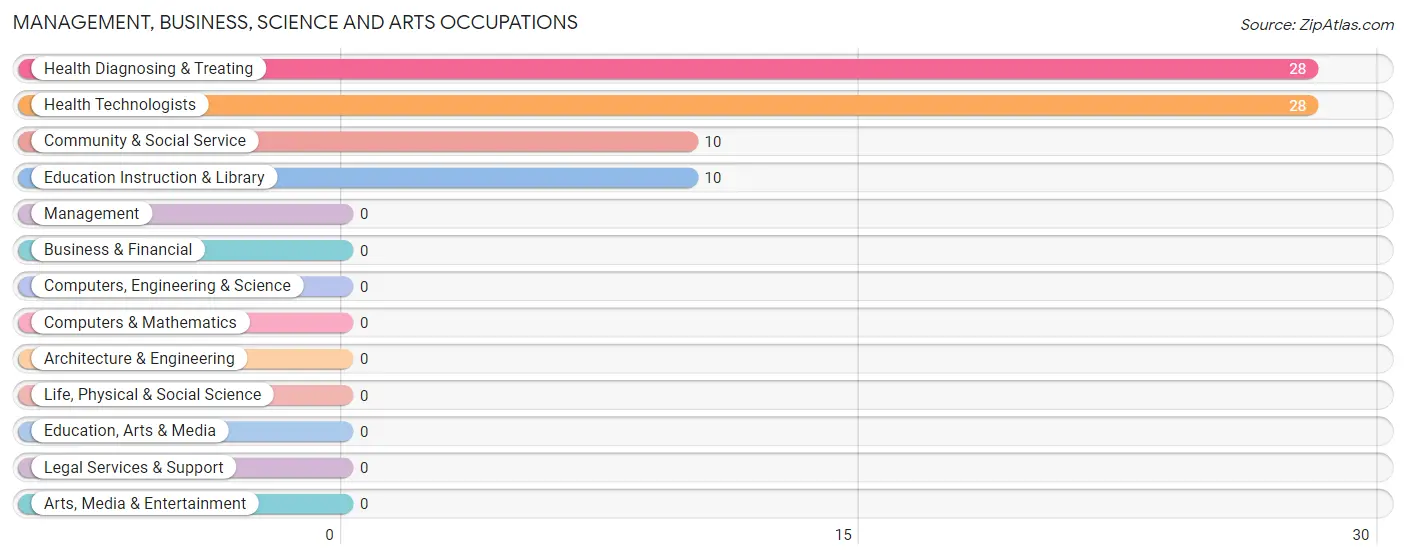
Management, Business, Science and Arts Occupations
The most common Management, Business, Science and Arts occupations in Port Costa are Health Diagnosing & Treating (28 | 20.3%), Health Technologists (28 | 20.3%), Community & Social Service (10 | 7.2%), and Education Instruction & Library (10 | 7.2%).
Management, Business, Science and Arts Occupations by Sex
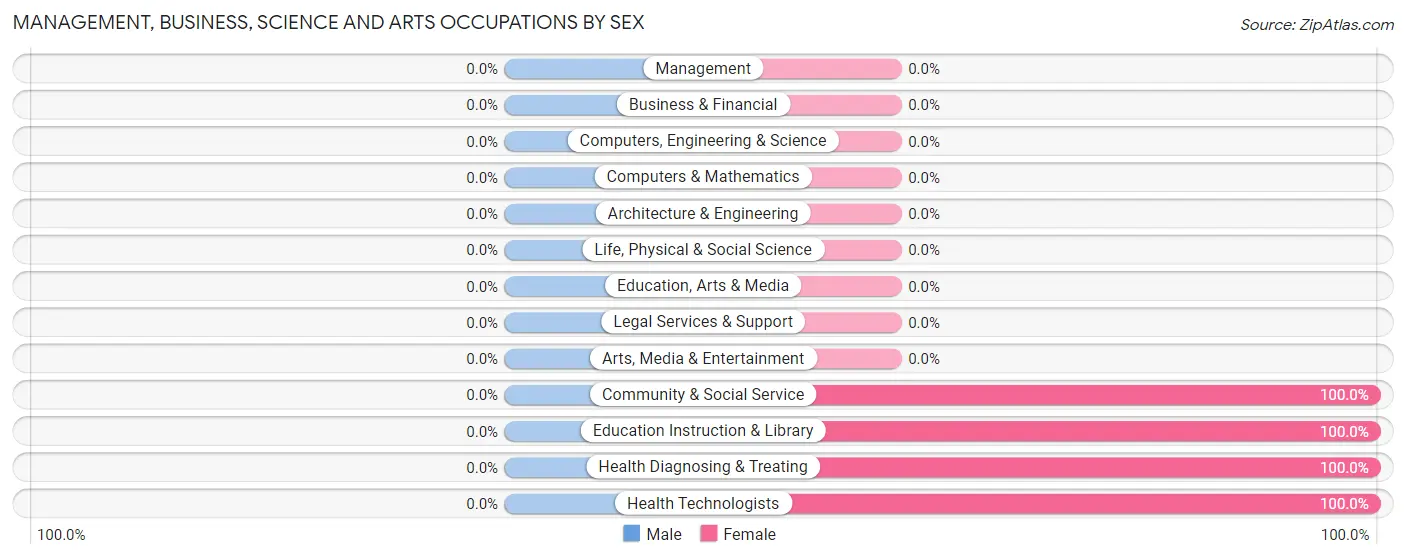
| Occupation | Male | Female |
| Management | 0 (0.0%) | 0 (0.0%) |
| Business & Financial | 0 (0.0%) | 0 (0.0%) |
| Computers, Engineering & Science | 0 (0.0%) | 0 (0.0%) |
| Computers & Mathematics | 0 (0.0%) | 0 (0.0%) |
| Architecture & Engineering | 0 (0.0%) | 0 (0.0%) |
| Life, Physical & Social Science | 0 (0.0%) | 0 (0.0%) |
| Community & Social Service | 0 (0.0%) | 10 (100.0%) |
| Education, Arts & Media | 0 (0.0%) | 0 (0.0%) |
| Legal Services & Support | 0 (0.0%) | 0 (0.0%) |
| Education Instruction & Library | 0 (0.0%) | 10 (100.0%) |
| Arts, Media & Entertainment | 0 (0.0%) | 0 (0.0%) |
| Health Diagnosing & Treating | 0 (0.0%) | 28 (100.0%) |
| Health Technologists | 0 (0.0%) | 28 (100.0%) |
| Total (Category) | 0 (0.0%) | 38 (100.0%) |
| Total (Overall) | 89 (64.5%) | 49 (35.5%) |
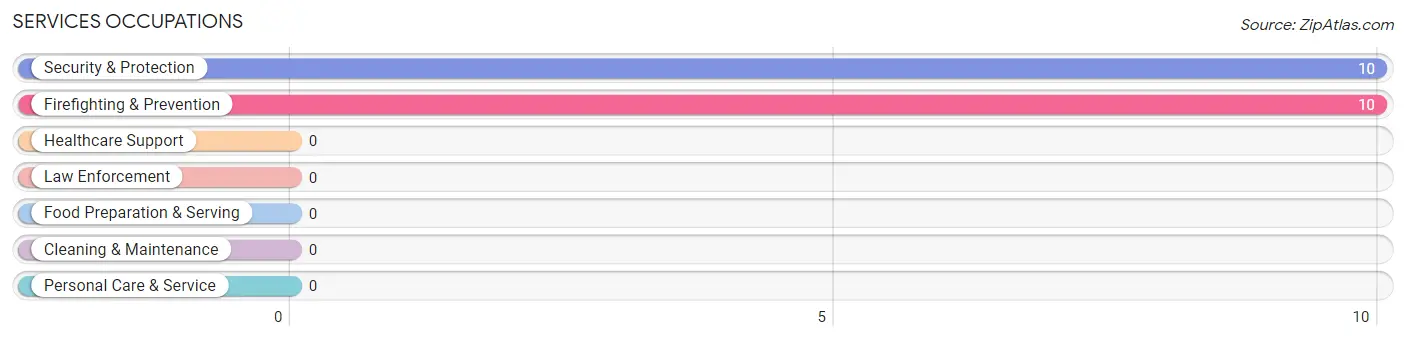
Services Occupations
The most common Services occupations in Port Costa are Security & Protection (10 | 7.2%), and Firefighting & Prevention (10 | 7.2%).
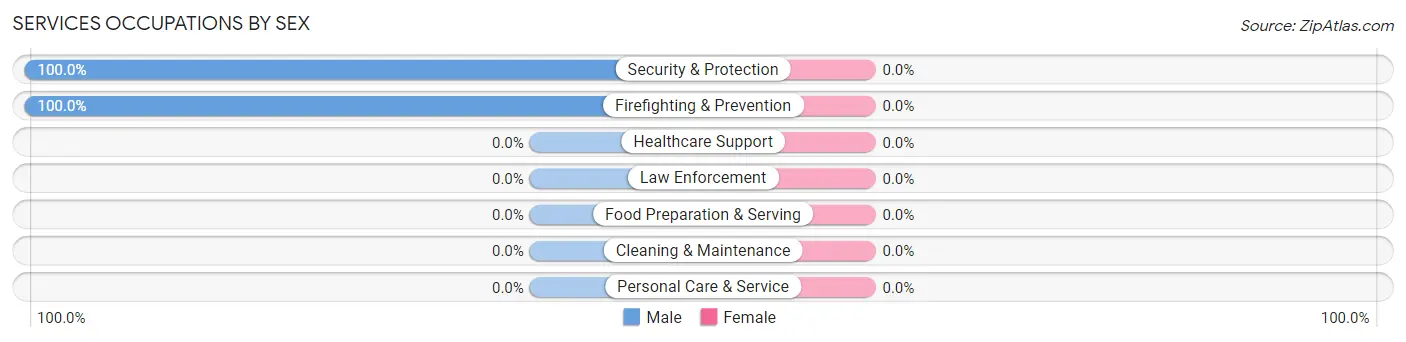
Services Occupations by Sex
| Occupation | Male | Female |
| Healthcare Support | 0 (0.0%) | 0 (0.0%) |
| Security & Protection | 10 (100.0%) | 0 (0.0%) |
| Firefighting & Prevention | 10 (100.0%) | 0 (0.0%) |
| Law Enforcement | 0 (0.0%) | 0 (0.0%) |
| Food Preparation & Serving | 0 (0.0%) | 0 (0.0%) |
| Cleaning & Maintenance | 0 (0.0%) | 0 (0.0%) |
| Personal Care & Service | 0 (0.0%) | 0 (0.0%) |
| Total (Category) | 10 (100.0%) | 0 (0.0%) |
| Total (Overall) | 89 (64.5%) | 49 (35.5%) |
Sales and Office Occupations

Sales and Office Occupations by Sex
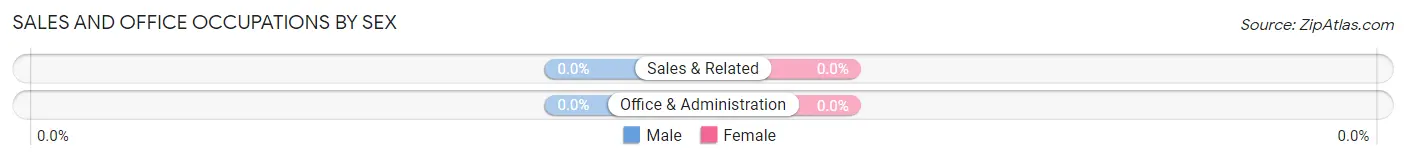
| Occupation | Male | Female |
| Sales & Related | 0 (0.0%) | 0 (0.0%) |
| Office & Administration | 0 (0.0%) | 0 (0.0%) |
| Total (Category) | 0 (0.0%) | 0 (0.0%) |
| Total (Overall) | 89 (64.5%) | 49 (35.5%) |
Natural Resources, Construction and Maintenance Occupations
The most common Natural Resources, Construction and Maintenance occupations in Port Costa are , and Construction & Extraction (90 | 65.2%).
Natural Resources, Construction and Maintenance Occupations by Sex
| Occupation | Male | Female |
| Farming, Fishing & Forestry | 0 (0.0%) | 0 (0.0%) |
| Construction & Extraction | 79 (87.8%) | 11 (12.2%) |
| Installation, Maintenance & Repair | 0 (0.0%) | 0 (0.0%) |
| Total (Category) | 79 (87.8%) | 11 (12.2%) |
| Total (Overall) | 89 (64.5%) | 49 (35.5%) |
Production, Transportation and Moving Occupations
Production, Transportation and Moving Occupations by Sex
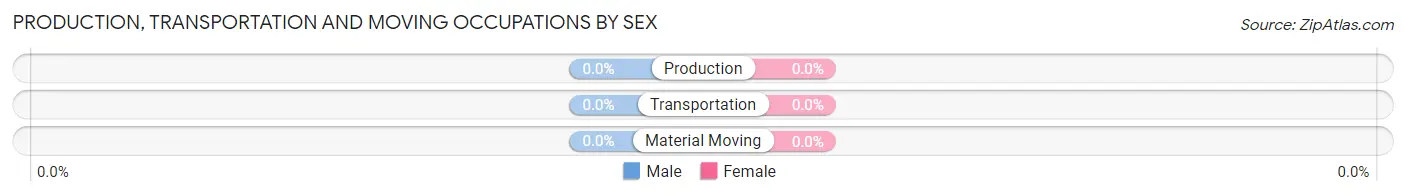
| Occupation | Male | Female |
| Production | 0 (0.0%) | 0 (0.0%) |
| Transportation | 0 (0.0%) | 0 (0.0%) |
| Material Moving | 0 (0.0%) | 0 (0.0%) |
| Total (Category) | 0 (0.0%) | 0 (0.0%) |
| Total (Overall) | 89 (64.5%) | 49 (35.5%) |
Employment Industries by Sex in Port Costa
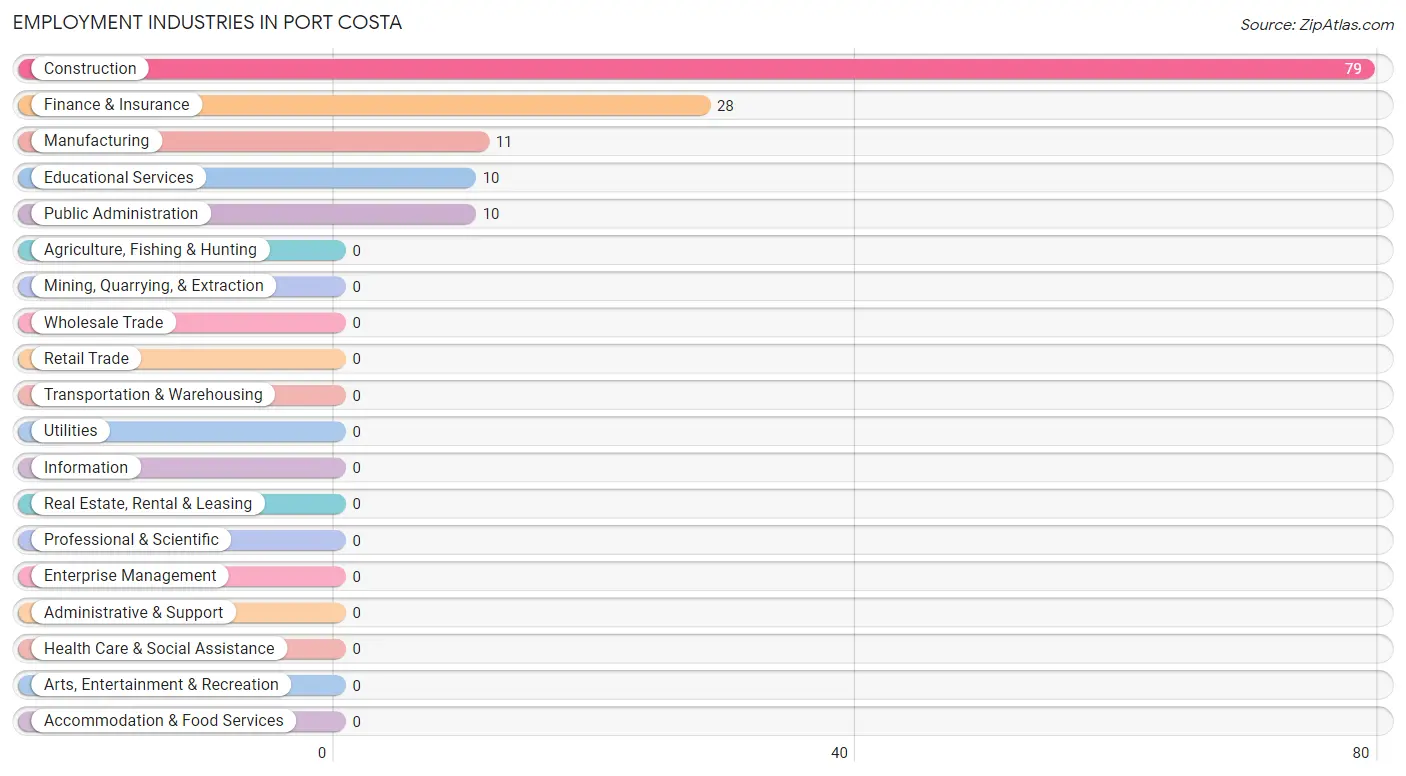
Employment Industries in Port Costa
The major employment industries in Port Costa include Construction (79 | 57.3%), Finance & Insurance (28 | 20.3%), Manufacturing (11 | 8.0%), Educational Services (10 | 7.2%), and Public Administration (10 | 7.2%).
Employment Industries by Sex in Port Costa
The Port Costa industries that see more men than women are Construction (100.0%), and Public Administration (100.0%), whereas the industries that tend to have a higher number of women are Manufacturing (100.0%), Finance & Insurance (100.0%), and Educational Services (100.0%).
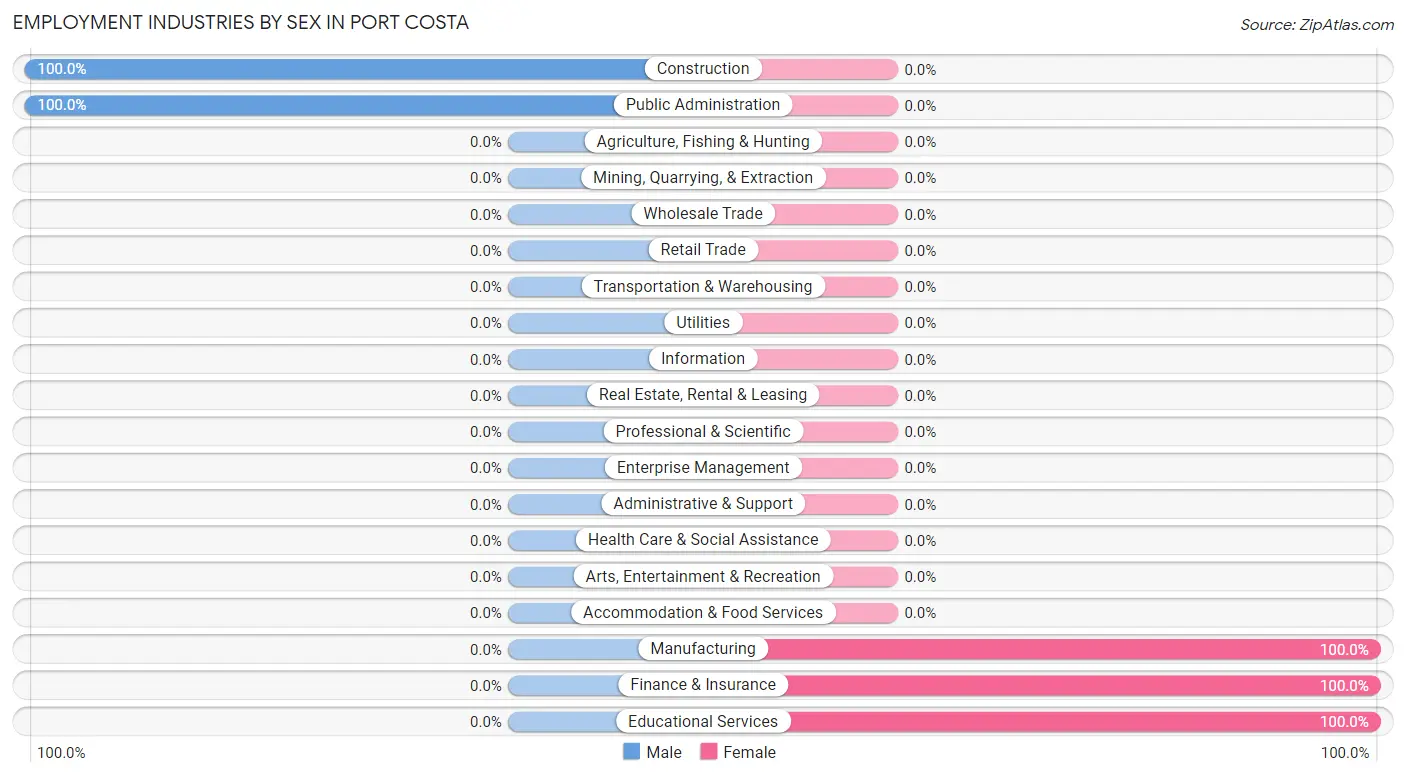
| Industry | Male | Female |
| Agriculture, Fishing & Hunting | 0 (0.0%) | 0 (0.0%) |
| Mining, Quarrying, & Extraction | 0 (0.0%) | 0 (0.0%) |
| Construction | 79 (100.0%) | 0 (0.0%) |
| Manufacturing | 0 (0.0%) | 11 (100.0%) |
| Wholesale Trade | 0 (0.0%) | 0 (0.0%) |
| Retail Trade | 0 (0.0%) | 0 (0.0%) |
| Transportation & Warehousing | 0 (0.0%) | 0 (0.0%) |
| Utilities | 0 (0.0%) | 0 (0.0%) |
| Information | 0 (0.0%) | 0 (0.0%) |
| Finance & Insurance | 0 (0.0%) | 28 (100.0%) |
| Real Estate, Rental & Leasing | 0 (0.0%) | 0 (0.0%) |
| Professional & Scientific | 0 (0.0%) | 0 (0.0%) |
| Enterprise Management | 0 (0.0%) | 0 (0.0%) |
| Administrative & Support | 0 (0.0%) | 0 (0.0%) |
| Educational Services | 0 (0.0%) | 10 (100.0%) |
| Health Care & Social Assistance | 0 (0.0%) | 0 (0.0%) |
| Arts, Entertainment & Recreation | 0 (0.0%) | 0 (0.0%) |
| Accommodation & Food Services | 0 (0.0%) | 0 (0.0%) |
| Public Administration | 10 (100.0%) | 0 (0.0%) |
| Total | 89 (64.5%) | 49 (35.5%) |
Education in Port Costa
School Enrollment in Port Costa
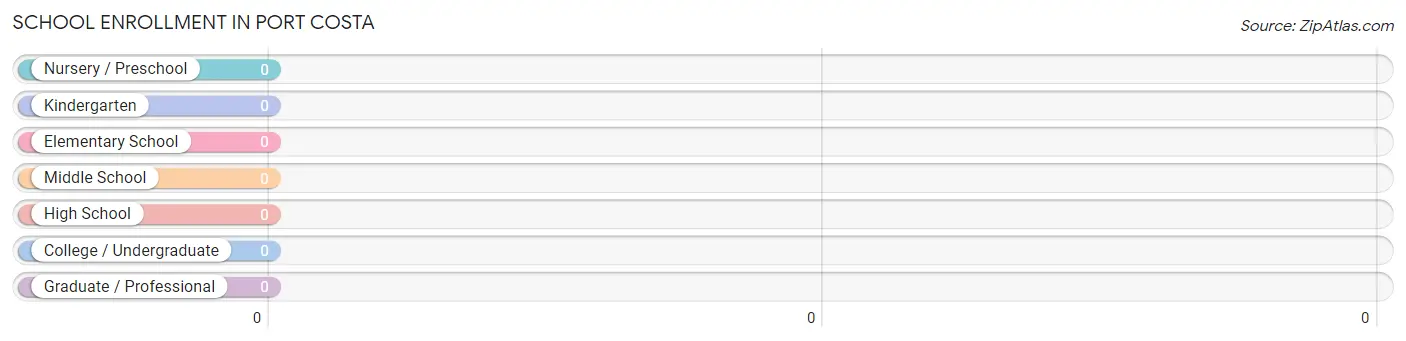
| School Level | # Students | % Students |
| Nursery / Preschool | 0 | 0.0% |
| Kindergarten | 0 | 0.0% |
| Elementary School | 0 | 0.0% |
| Middle School | 0 | 0.0% |
| High School | 0 | 0.0% |
| College / Undergraduate | 0 | 0.0% |
| Graduate / Professional | 0 | 0.0% |
| Total | 0 | 0.0% |
School Enrollment by Age by Funding Source in Port Costa
| Age Bracket | Public School | Private School |
| 3 to 4 Year Olds | 0 (0.0%) | 0 (0.0%) |
| 5 to 9 Year Old | 0 (0.0%) | 0 (0.0%) |
| 10 to 14 Year Olds | 0 (0.0%) | 0 (0.0%) |
| 15 to 17 Year Olds | 0 (0.0%) | 0 (0.0%) |
| 18 to 19 Year Olds | 0 (0.0%) | 0 (0.0%) |
| 20 to 24 Year Olds | 0 (0.0%) | 0 (0.0%) |
| 25 to 34 Year Olds | 0 (0.0%) | 0 (0.0%) |
| 35 Years and over | 0 (0.0%) | 0 (0.0%) |
| Total | 0 (0.0%) | 0 (0.0%) |
Educational Attainment by Field of Study in Port Costa
Science & technology (27 | 57.5%), communications (10 | 21.3%), and arts & humanities (10 | 21.3%) are the most common fields of study among 47 individuals in Port Costa who have obtained a bachelor's degree or higher.
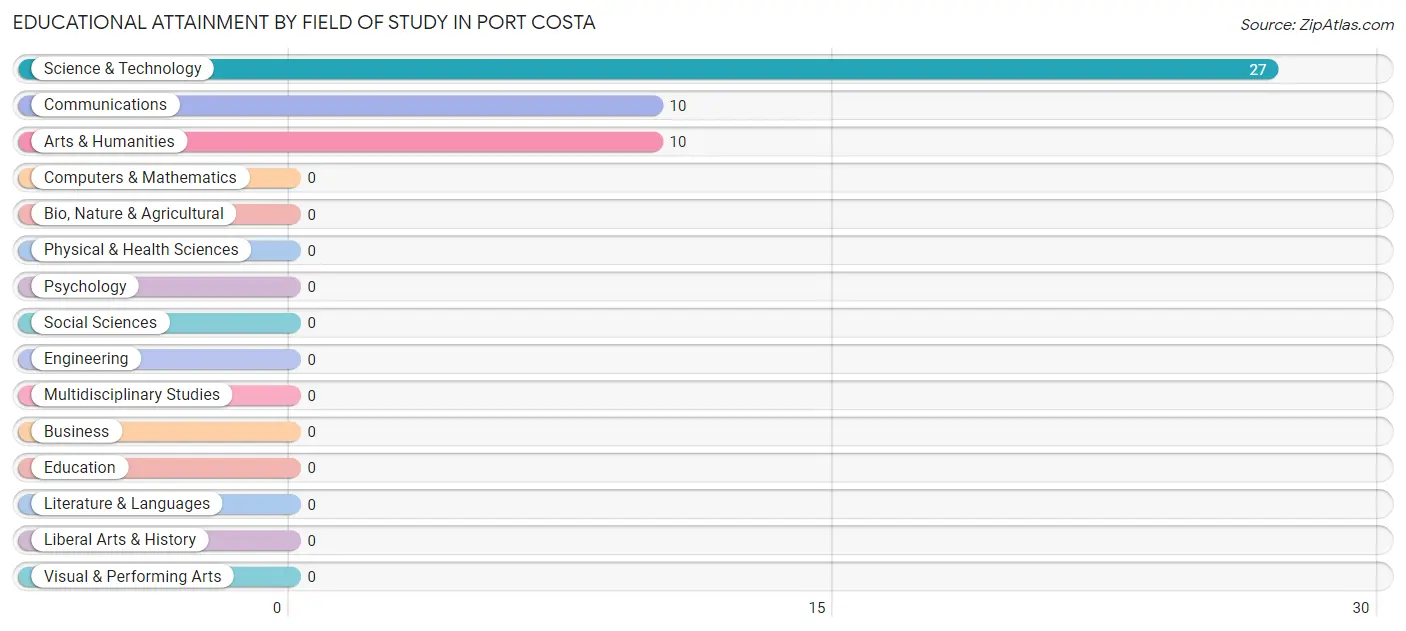
| Field of Study | # Graduates | % Graduates |
| Computers & Mathematics | 0 | 0.0% |
| Bio, Nature & Agricultural | 0 | 0.0% |
| Physical & Health Sciences | 0 | 0.0% |
| Psychology | 0 | 0.0% |
| Social Sciences | 0 | 0.0% |
| Engineering | 0 | 0.0% |
| Multidisciplinary Studies | 0 | 0.0% |
| Science & Technology | 27 | 57.5% |
| Business | 0 | 0.0% |
| Education | 0 | 0.0% |
| Literature & Languages | 0 | 0.0% |
| Liberal Arts & History | 0 | 0.0% |
| Visual & Performing Arts | 0 | 0.0% |
| Communications | 10 | 21.3% |
| Arts & Humanities | 10 | 21.3% |
| Total | 47 | 100.0% |
Transportation & Commute in Port Costa
Vehicle Availability by Sex in Port Costa
The most prevalent vehicle ownership categories in Port Costa are males with 4 vehicles (32, accounting for 36.0%) and females with 4 vehicles (28, making up 84.2%).
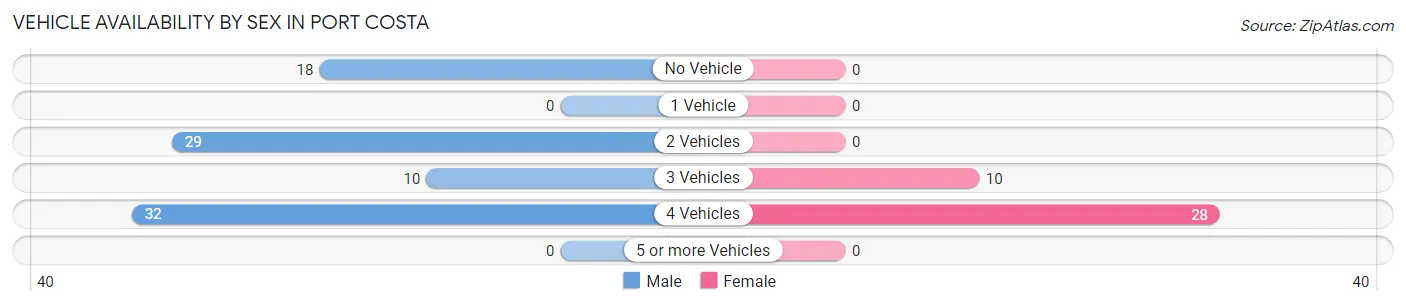
| Vehicles Available | Male | Female |
| No Vehicle | 18 (20.2%) | 0 (0.0%) |
| 1 Vehicle | 0 (0.0%) | 0 (0.0%) |
| 2 Vehicles | 29 (32.6%) | 0 (0.0%) |
| 3 Vehicles | 10 (11.2%) | 10 (26.3%) |
| 4 Vehicles | 32 (36.0%) | 28 (73.7%) |
| 5 or more Vehicles | 0 (0.0%) | 0 (0.0%) |
| Total | 89 (100.0%) | 38 (100.0%) |
Commute Time in Port Costa
The most frequently occuring commute durations in Port Costa are less than 5 minutes (39 commuters, 30.7%), 30 to 34 minutes (32 commuters, 25.2%), and 5 to 9 minutes (28 commuters, 22.1%).
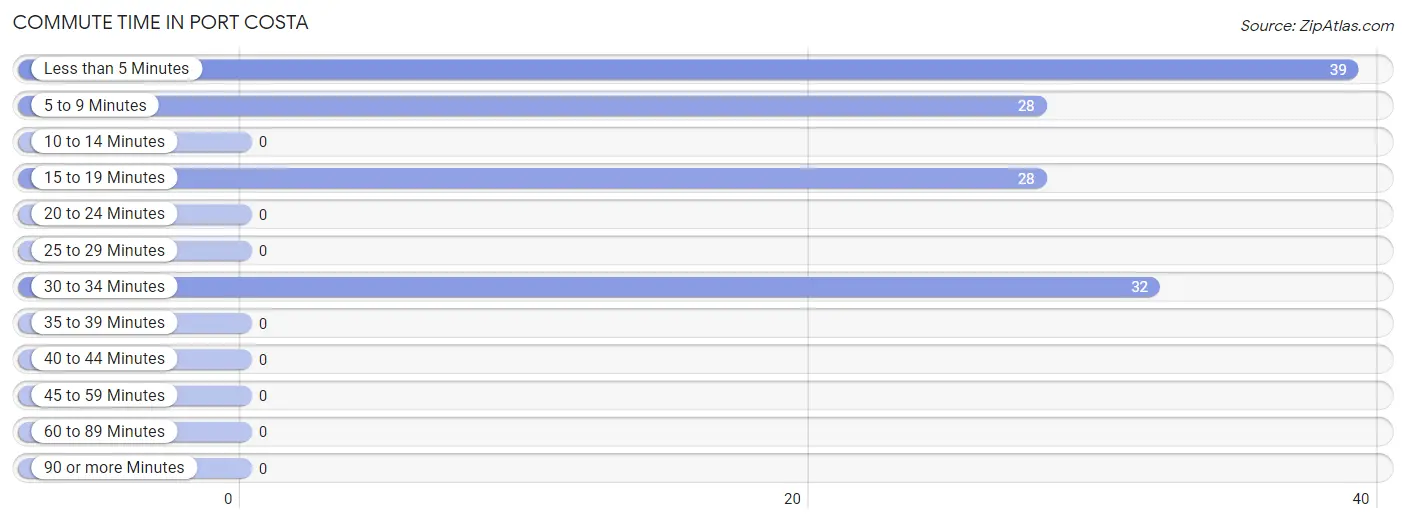
| Commute Time | # Commuters | % Commuters |
| Less than 5 Minutes | 39 | 30.7% |
| 5 to 9 Minutes | 28 | 22.1% |
| 10 to 14 Minutes | 0 | 0.0% |
| 15 to 19 Minutes | 28 | 22.1% |
| 20 to 24 Minutes | 0 | 0.0% |
| 25 to 29 Minutes | 0 | 0.0% |
| 30 to 34 Minutes | 32 | 25.2% |
| 35 to 39 Minutes | 0 | 0.0% |
| 40 to 44 Minutes | 0 | 0.0% |
| 45 to 59 Minutes | 0 | 0.0% |
| 60 to 89 Minutes | 0 | 0.0% |
| 90 or more Minutes | 0 | 0.0% |
Commute Time by Sex in Port Costa
The most common commute times in Port Costa are less than 5 minutes (39 commuters, 43.8%) for males and 15 to 19 minutes (28 commuters, 73.7%) for females.
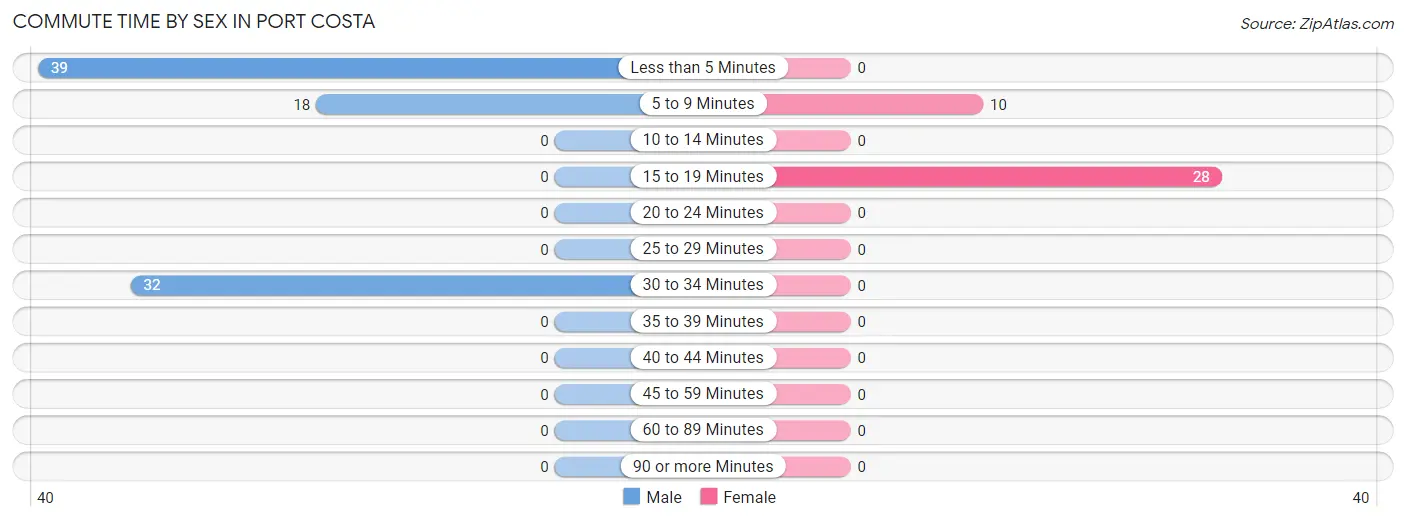
| Commute Time | Male | Female |
| Less than 5 Minutes | 39 (43.8%) | 0 (0.0%) |
| 5 to 9 Minutes | 18 (20.2%) | 10 (26.3%) |
| 10 to 14 Minutes | 0 (0.0%) | 0 (0.0%) |
| 15 to 19 Minutes | 0 (0.0%) | 28 (73.7%) |
| 20 to 24 Minutes | 0 (0.0%) | 0 (0.0%) |
| 25 to 29 Minutes | 0 (0.0%) | 0 (0.0%) |
| 30 to 34 Minutes | 32 (36.0%) | 0 (0.0%) |
| 35 to 39 Minutes | 0 (0.0%) | 0 (0.0%) |
| 40 to 44 Minutes | 0 (0.0%) | 0 (0.0%) |
| 45 to 59 Minutes | 0 (0.0%) | 0 (0.0%) |
| 60 to 89 Minutes | 0 (0.0%) | 0 (0.0%) |
| 90 or more Minutes | 0 (0.0%) | 0 (0.0%) |
Time of Departure to Work by Sex in Port Costa
The most frequent times of departure to work in Port Costa are 7:00 AM to 7:29 AM (32, 36.0%) for males and 7:30 AM to 7:59 AM (28, 73.7%) for females.
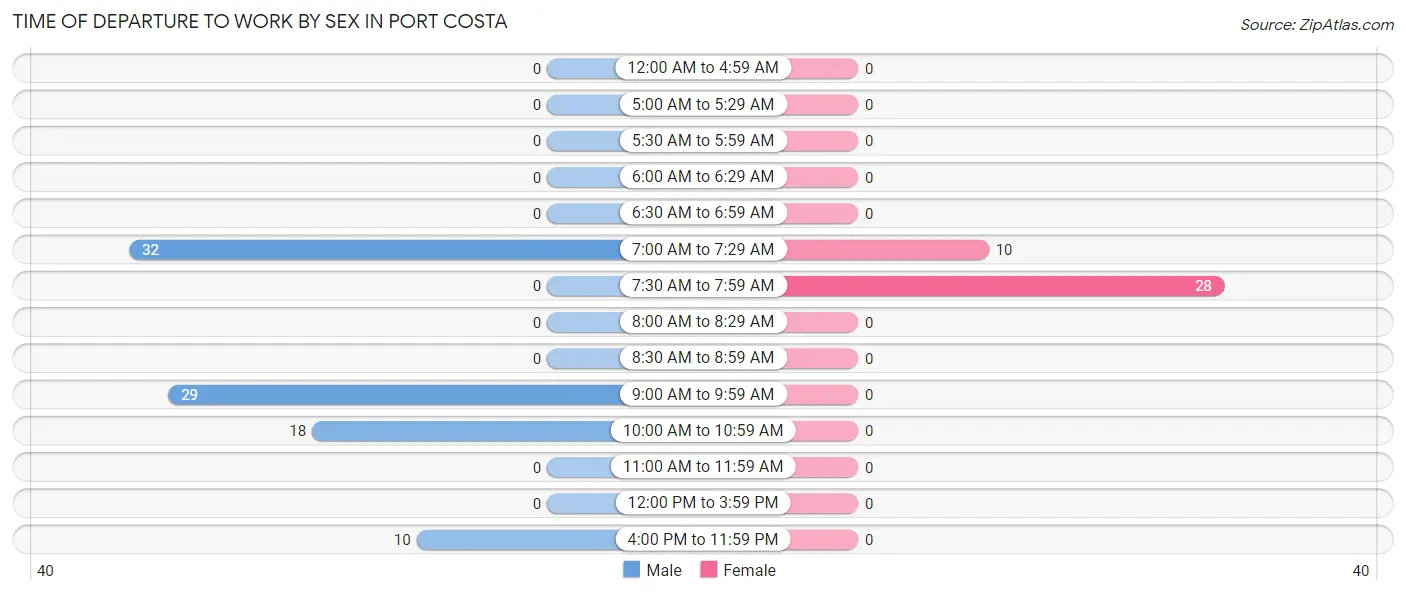
| Time of Departure | Male | Female |
| 12:00 AM to 4:59 AM | 0 (0.0%) | 0 (0.0%) |
| 5:00 AM to 5:29 AM | 0 (0.0%) | 0 (0.0%) |
| 5:30 AM to 5:59 AM | 0 (0.0%) | 0 (0.0%) |
| 6:00 AM to 6:29 AM | 0 (0.0%) | 0 (0.0%) |
| 6:30 AM to 6:59 AM | 0 (0.0%) | 0 (0.0%) |
| 7:00 AM to 7:29 AM | 32 (36.0%) | 10 (26.3%) |
| 7:30 AM to 7:59 AM | 0 (0.0%) | 28 (73.7%) |
| 8:00 AM to 8:29 AM | 0 (0.0%) | 0 (0.0%) |
| 8:30 AM to 8:59 AM | 0 (0.0%) | 0 (0.0%) |
| 9:00 AM to 9:59 AM | 29 (32.6%) | 0 (0.0%) |
| 10:00 AM to 10:59 AM | 18 (20.2%) | 0 (0.0%) |
| 11:00 AM to 11:59 AM | 0 (0.0%) | 0 (0.0%) |
| 12:00 PM to 3:59 PM | 0 (0.0%) | 0 (0.0%) |
| 4:00 PM to 11:59 PM | 10 (11.2%) | 0 (0.0%) |
| Total | 89 (100.0%) | 38 (100.0%) |
Housing Occupancy in Port Costa
Occupancy by Ownership in Port Costa
Of the total 171 dwellings in Port Costa, owner-occupied units account for 50 (29.2%), while renter-occupied units make up 121 (70.8%).
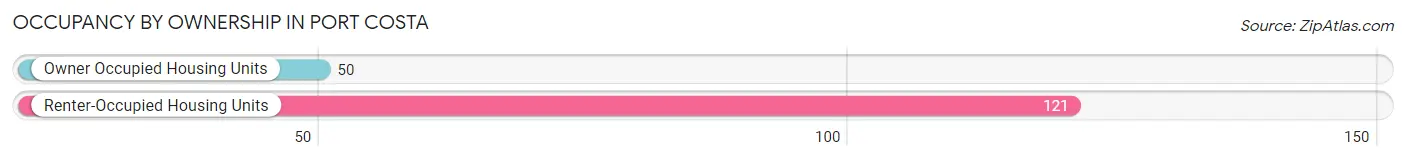
| Occupancy | # Housing Units | % Housing Units |
| Owner Occupied Housing Units | 50 | 29.2% |
| Renter-Occupied Housing Units | 121 | 70.8% |
| Total Occupied Housing Units | 171 | 100.0% |
Occupancy by Household Size in Port Costa
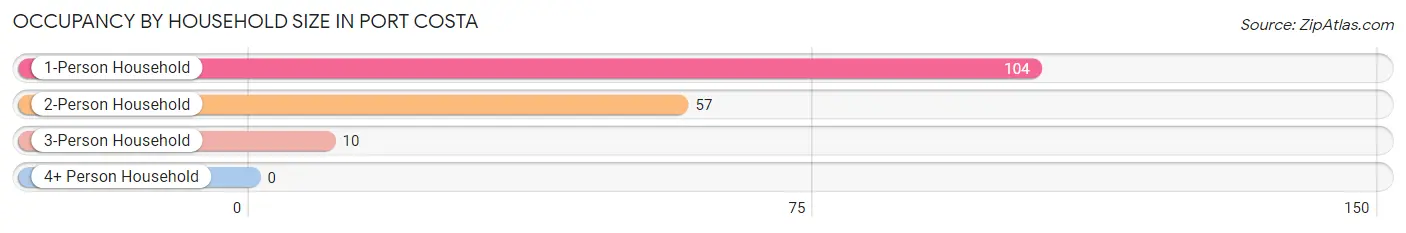
| Household Size | # Housing Units | % Housing Units |
| 1-Person Household | 104 | 60.8% |
| 2-Person Household | 57 | 33.3% |
| 3-Person Household | 10 | 5.9% |
| 4+ Person Household | 0 | 0.0% |
| Total Housing Units | 171 | 100.0% |
Occupancy by Ownership by Household Size in Port Costa
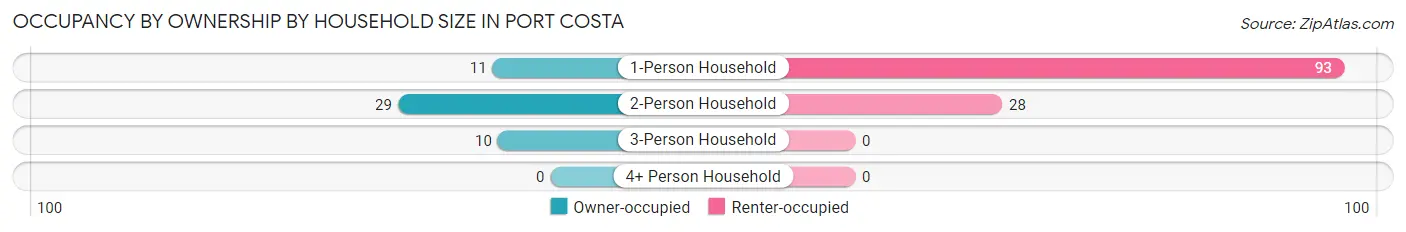
| Household Size | Owner-occupied | Renter-occupied |
| 1-Person Household | 11 (10.6%) | 93 (89.4%) |
| 2-Person Household | 29 (50.9%) | 28 (49.1%) |
| 3-Person Household | 10 (100.0%) | 0 (0.0%) |
| 4+ Person Household | 0 (0.0%) | 0 (0.0%) |
| Total Housing Units | 50 (29.2%) | 121 (70.8%) |
Occupancy by Educational Attainment in Port Costa
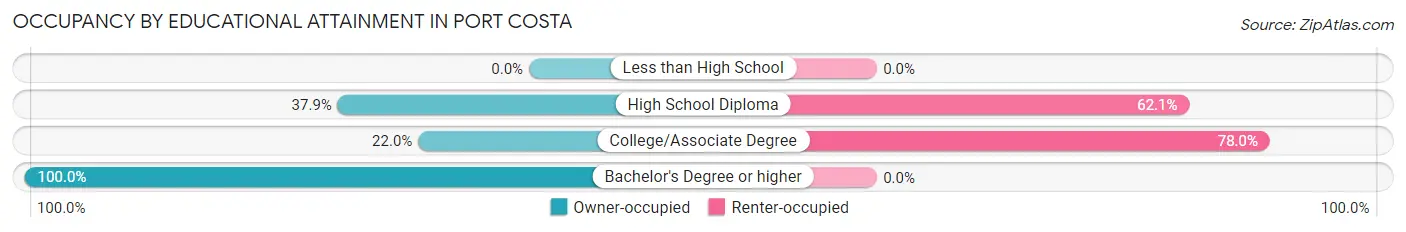
| Household Size | Owner-occupied | Renter-occupied |
| Less than High School | 0 (0.0%) | 0 (0.0%) |
| High School Diploma | 11 (37.9%) | 18 (62.1%) |
| College/Associate Degree | 29 (22.0%) | 103 (78.0%) |
| Bachelor's Degree or higher | 10 (100.0%) | 0 (0.0%) |
Occupancy by Age of Householder in Port Costa
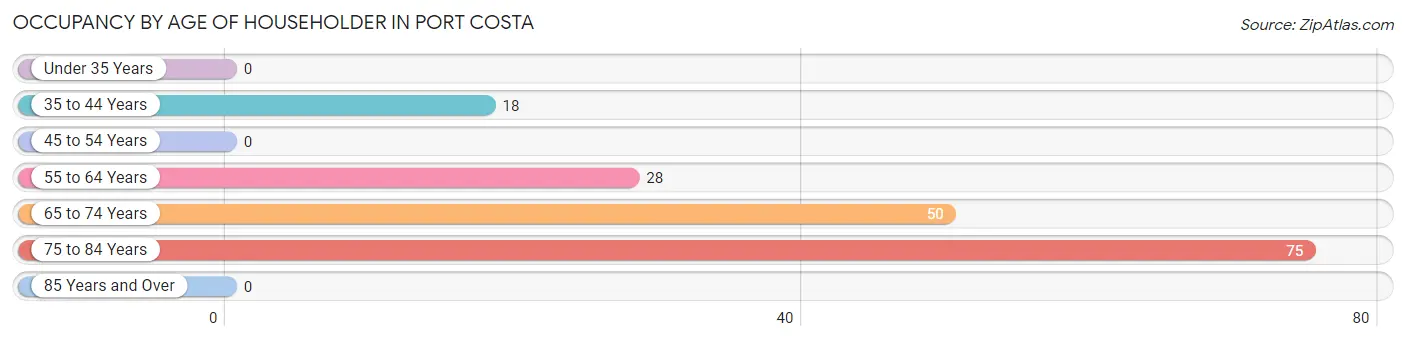
| Age Bracket | # Households | % Households |
| Under 35 Years | 0 | 0.0% |
| 35 to 44 Years | 18 | 10.5% |
| 45 to 54 Years | 0 | 0.0% |
| 55 to 64 Years | 28 | 16.4% |
| 65 to 74 Years | 50 | 29.2% |
| 75 to 84 Years | 75 | 43.9% |
| 85 Years and Over | 0 | 0.0% |
| Total | 171 | 100.0% |
Housing Finances in Port Costa
Median Income by Occupancy in Port Costa
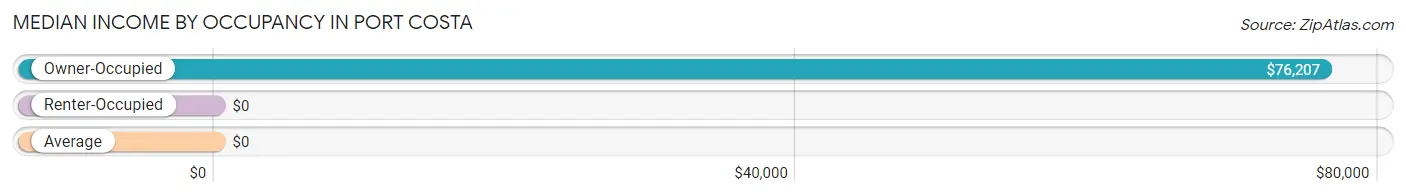
| Occupancy Type | # Households | Median Income |
| Owner-Occupied | 50 (29.2%) | $76,207 |
| Renter-Occupied | 121 (70.8%) | $0 |
| Average | 171 (100.0%) | $0 |
Occupancy by Householder Income Bracket in Port Costa
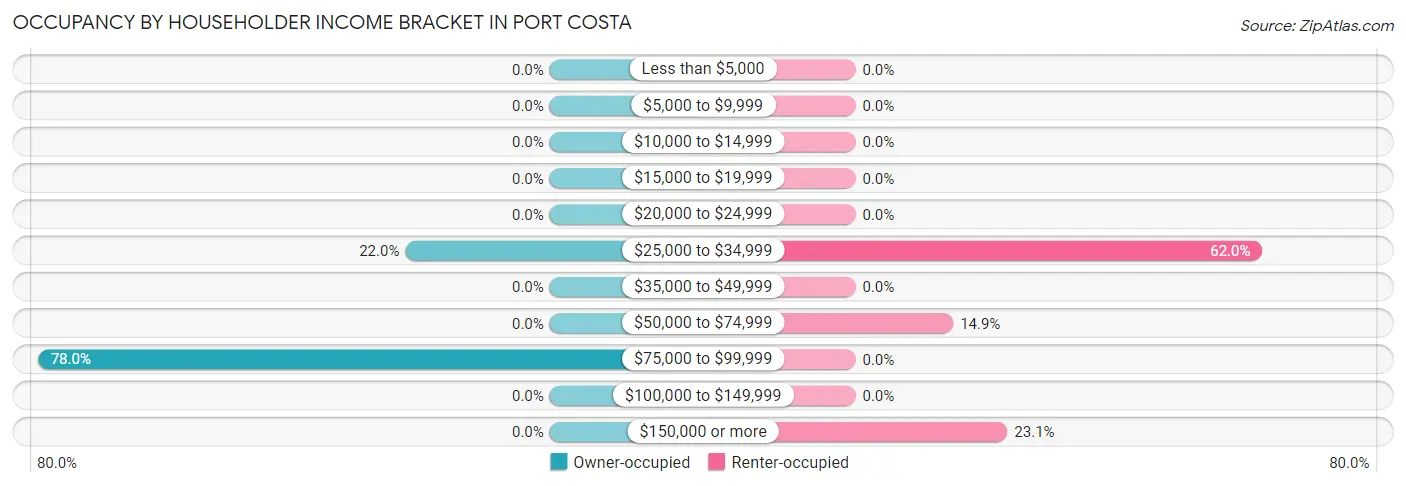
| Income Bracket | Owner-occupied | Renter-occupied |
| Less than $5,000 | 0 (0.0%) | 0 (0.0%) |
| $5,000 to $9,999 | 0 (0.0%) | 0 (0.0%) |
| $10,000 to $14,999 | 0 (0.0%) | 0 (0.0%) |
| $15,000 to $19,999 | 0 (0.0%) | 0 (0.0%) |
| $20,000 to $24,999 | 0 (0.0%) | 0 (0.0%) |
| $25,000 to $34,999 | 11 (22.0%) | 75 (62.0%) |
| $35,000 to $49,999 | 0 (0.0%) | 0 (0.0%) |
| $50,000 to $74,999 | 0 (0.0%) | 18 (14.9%) |
| $75,000 to $99,999 | 39 (78.0%) | 0 (0.0%) |
| $100,000 to $149,999 | 0 (0.0%) | 0 (0.0%) |
| $150,000 or more | 0 (0.0%) | 28 (23.1%) |
| Total | 50 (100.0%) | 121 (100.0%) |
Monthly Housing Cost Tiers in Port Costa
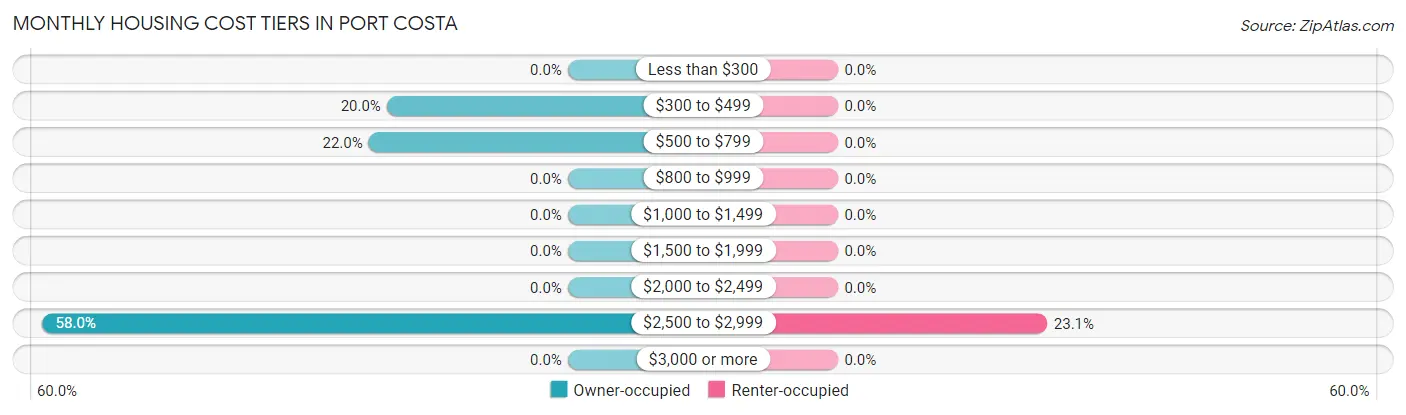
| Monthly Cost | Owner-occupied | Renter-occupied |
| Less than $300 | 0 (0.0%) | 0 (0.0%) |
| $300 to $499 | 10 (20.0%) | 0 (0.0%) |
| $500 to $799 | 11 (22.0%) | 0 (0.0%) |
| $800 to $999 | 0 (0.0%) | 0 (0.0%) |
| $1,000 to $1,499 | 0 (0.0%) | 0 (0.0%) |
| $1,500 to $1,999 | 0 (0.0%) | 0 (0.0%) |
| $2,000 to $2,499 | 0 (0.0%) | 0 (0.0%) |
| $2,500 to $2,999 | 29 (58.0%) | 28 (23.1%) |
| $3,000 or more | 0 (0.0%) | 0 (0.0%) |
| Total | 50 (100.0%) | 121 (100.0%) |
Physical Housing Characteristics in Port Costa
Housing Structures in Port Costa
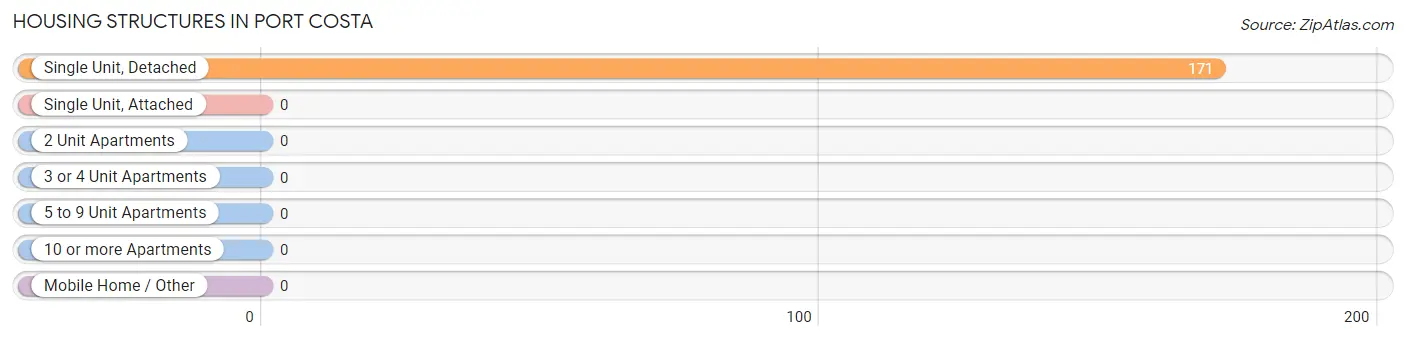
| Structure Type | # Housing Units | % Housing Units |
| Single Unit, Detached | 171 | 100.0% |
| Single Unit, Attached | 0 | 0.0% |
| 2 Unit Apartments | 0 | 0.0% |
| 3 or 4 Unit Apartments | 0 | 0.0% |
| 5 to 9 Unit Apartments | 0 | 0.0% |
| 10 or more Apartments | 0 | 0.0% |
| Mobile Home / Other | 0 | 0.0% |
| Total | 171 | 100.0% |
Housing Structures by Occupancy in Port Costa
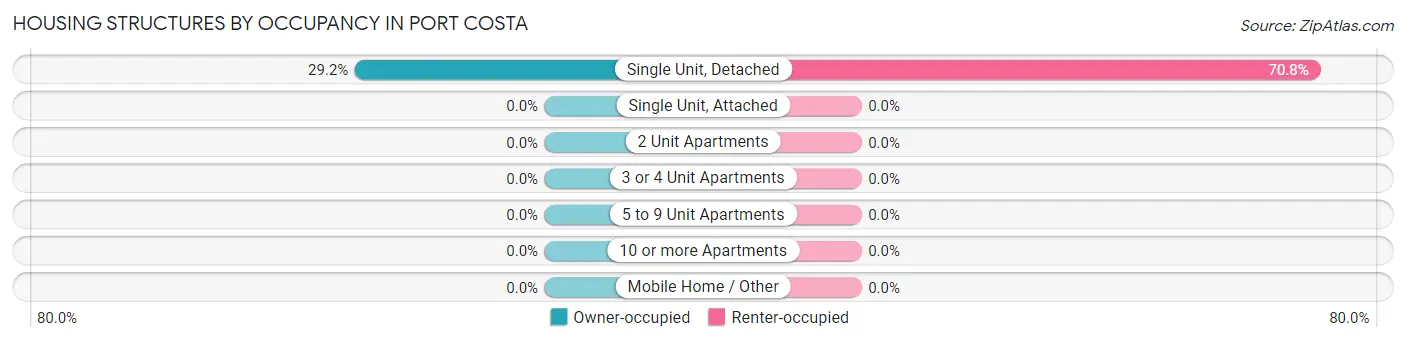
| Structure Type | Owner-occupied | Renter-occupied |
| Single Unit, Detached | 50 (29.2%) | 121 (70.8%) |
| Single Unit, Attached | 0 (0.0%) | 0 (0.0%) |
| 2 Unit Apartments | 0 (0.0%) | 0 (0.0%) |
| 3 or 4 Unit Apartments | 0 (0.0%) | 0 (0.0%) |
| 5 to 9 Unit Apartments | 0 (0.0%) | 0 (0.0%) |
| 10 or more Apartments | 0 (0.0%) | 0 (0.0%) |
| Mobile Home / Other | 0 (0.0%) | 0 (0.0%) |
| Total | 50 (29.2%) | 121 (70.8%) |
Housing Structures by Number of Rooms in Port Costa
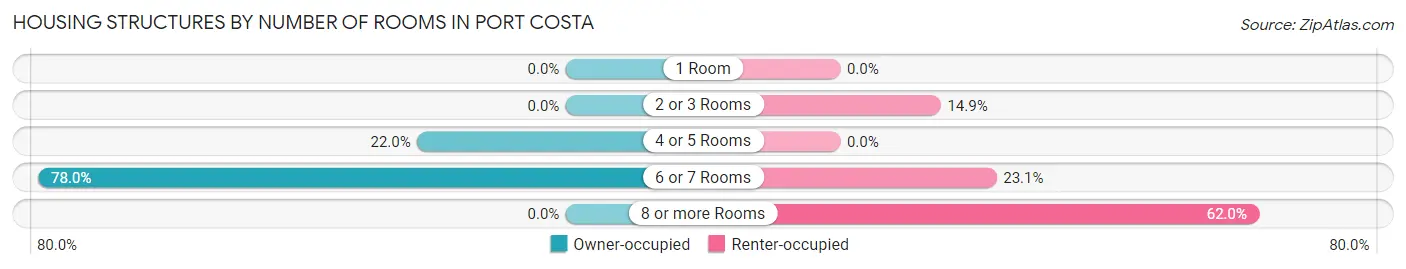
| Number of Rooms | Owner-occupied | Renter-occupied |
| 1 Room | 0 (0.0%) | 0 (0.0%) |
| 2 or 3 Rooms | 0 (0.0%) | 18 (14.9%) |
| 4 or 5 Rooms | 11 (22.0%) | 0 (0.0%) |
| 6 or 7 Rooms | 39 (78.0%) | 28 (23.1%) |
| 8 or more Rooms | 0 (0.0%) | 75 (62.0%) |
| Total | 50 (100.0%) | 121 (100.0%) |
Housing Structure by Heating Type in Port Costa
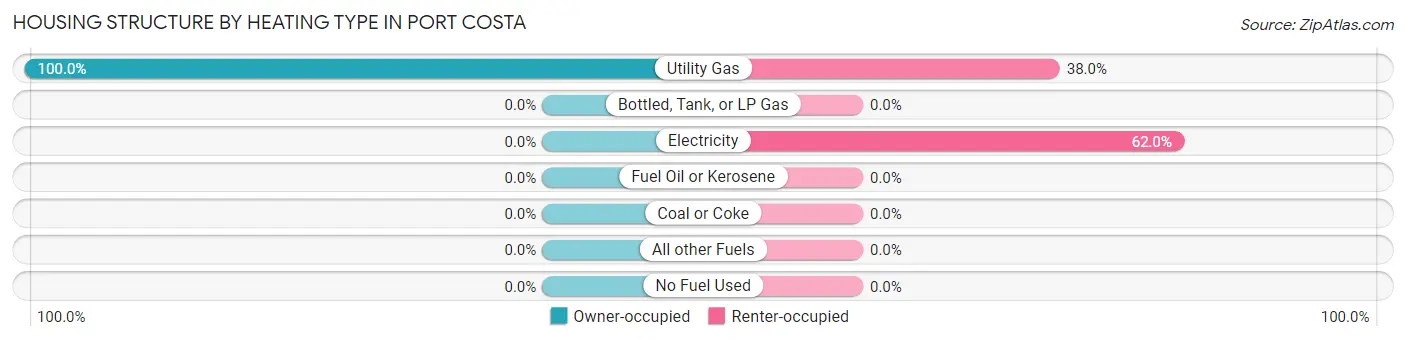
| Heating Type | Owner-occupied | Renter-occupied |
| Utility Gas | 50 (100.0%) | 46 (38.0%) |
| Bottled, Tank, or LP Gas | 0 (0.0%) | 0 (0.0%) |
| Electricity | 0 (0.0%) | 75 (62.0%) |
| Fuel Oil or Kerosene | 0 (0.0%) | 0 (0.0%) |
| Coal or Coke | 0 (0.0%) | 0 (0.0%) |
| All other Fuels | 0 (0.0%) | 0 (0.0%) |
| No Fuel Used | 0 (0.0%) | 0 (0.0%) |
| Total | 50 (100.0%) | 121 (100.0%) |
Household Vehicle Usage in Port Costa
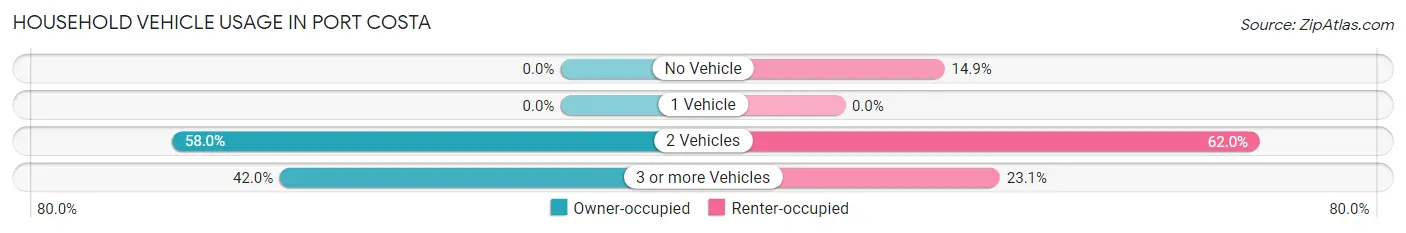
| Vehicles per Household | Owner-occupied | Renter-occupied |
| No Vehicle | 0 (0.0%) | 18 (14.9%) |
| 1 Vehicle | 0 (0.0%) | 0 (0.0%) |
| 2 Vehicles | 29 (58.0%) | 75 (62.0%) |
| 3 or more Vehicles | 21 (42.0%) | 28 (23.1%) |
| Total | 50 (100.0%) | 121 (100.0%) |
Real Estate & Mortgages in Port Costa
Real Estate and Mortgage Overview in Port Costa
| Characteristic | Without Mortgage | With Mortgage |
| Housing Units | 10 | 40 |
| Median Property Value | - | - |
| Median Household Income | - | - |
| Monthly Housing Costs | - | - |
| Real Estate Taxes | - | - |
Property Value by Mortgage Status in Port Costa
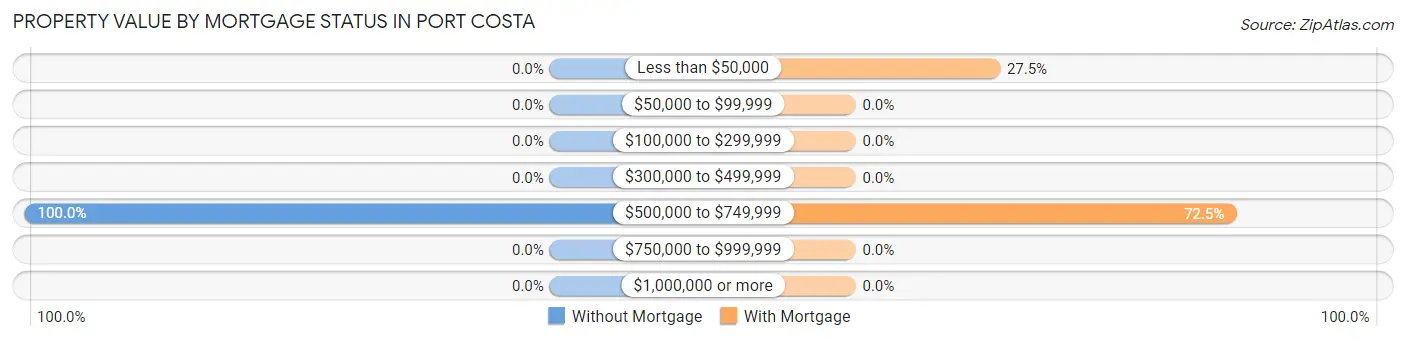
| Property Value | Without Mortgage | With Mortgage |
| Less than $50,000 | 0 (0.0%) | 11 (27.5%) |
| $50,000 to $99,999 | 0 (0.0%) | 0 (0.0%) |
| $100,000 to $299,999 | 0 (0.0%) | 0 (0.0%) |
| $300,000 to $499,999 | 0 (0.0%) | 0 (0.0%) |
| $500,000 to $749,999 | 10 (100.0%) | 29 (72.5%) |
| $750,000 to $999,999 | 0 (0.0%) | 0 (0.0%) |
| $1,000,000 or more | 0 (0.0%) | 0 (0.0%) |
| Total | 10 (100.0%) | 40 (100.0%) |
Household Income by Mortgage Status in Port Costa
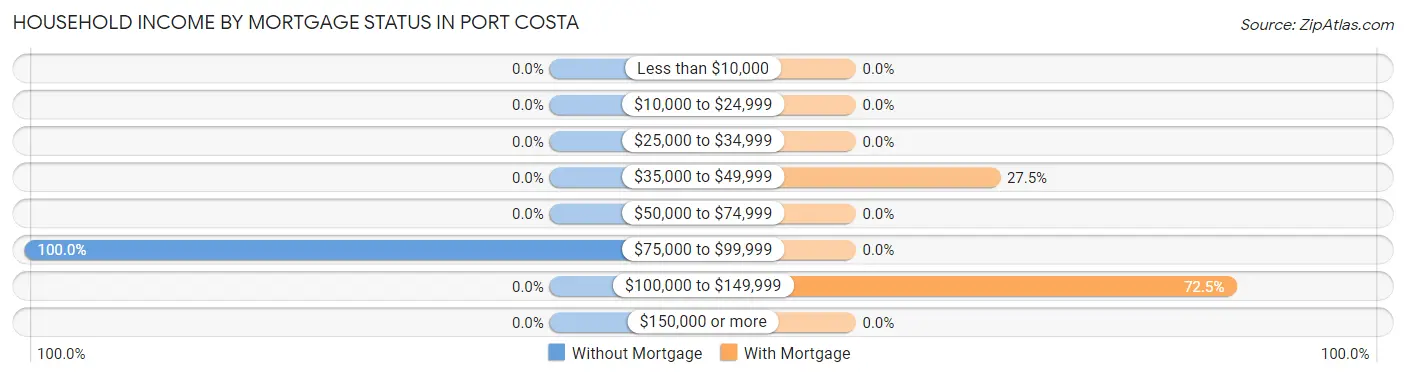
| Household Income | Without Mortgage | With Mortgage |
| Less than $10,000 | 0 (0.0%) | 0 (0.0%) |
| $10,000 to $24,999 | 0 (0.0%) | 0 (0.0%) |
| $25,000 to $34,999 | 0 (0.0%) | 0 (0.0%) |
| $35,000 to $49,999 | 0 (0.0%) | 11 (27.5%) |
| $50,000 to $74,999 | 0 (0.0%) | 0 (0.0%) |
| $75,000 to $99,999 | 10 (100.0%) | 0 (0.0%) |
| $100,000 to $149,999 | 0 (0.0%) | 29 (72.5%) |
| $150,000 or more | 0 (0.0%) | 0 (0.0%) |
| Total | 10 (100.0%) | 40 (100.0%) |
Property Value to Household Income Ratio in Port Costa
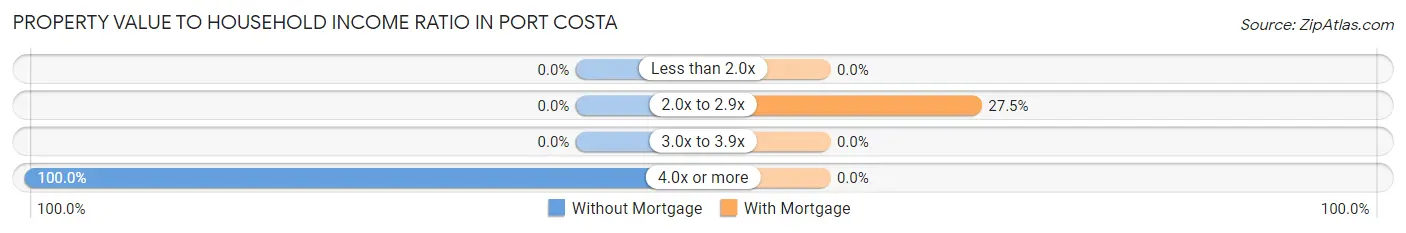
| Value-to-Income Ratio | Without Mortgage | With Mortgage |
| Less than 2.0x | 0 (0.0%) | 0 (0.0%) |
| 2.0x to 2.9x | 0 (0.0%) | 11 (27.5%) |
| 3.0x to 3.9x | 0 (0.0%) | 0 (0.0%) |
| 4.0x or more | 10 (100.0%) | 0 (0.0%) |
| Total | 10 (100.0%) | 40 (100.0%) |
Real Estate Taxes by Mortgage Status in Port Costa
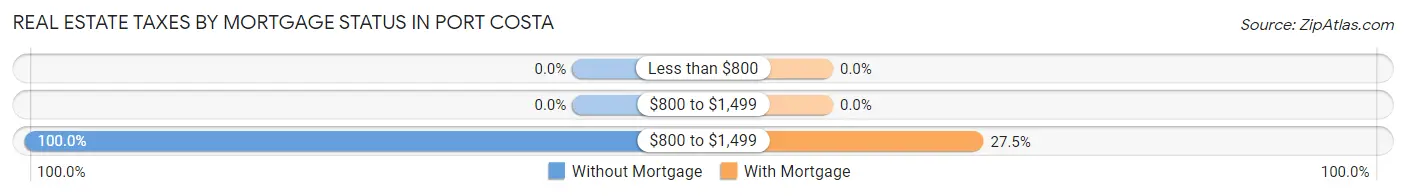
| Property Taxes | Without Mortgage | With Mortgage |
| Less than $800 | 0 (0.0%) | 0 (0.0%) |
| $800 to $1,499 | 0 (0.0%) | 0 (0.0%) |
| $800 to $1,499 | 10 (100.0%) | 11 (27.5%) |
| Total | 10 (100.0%) | 40 (100.0%) |
Health & Disability in Port Costa
Health Insurance Coverage by Age in Port Costa
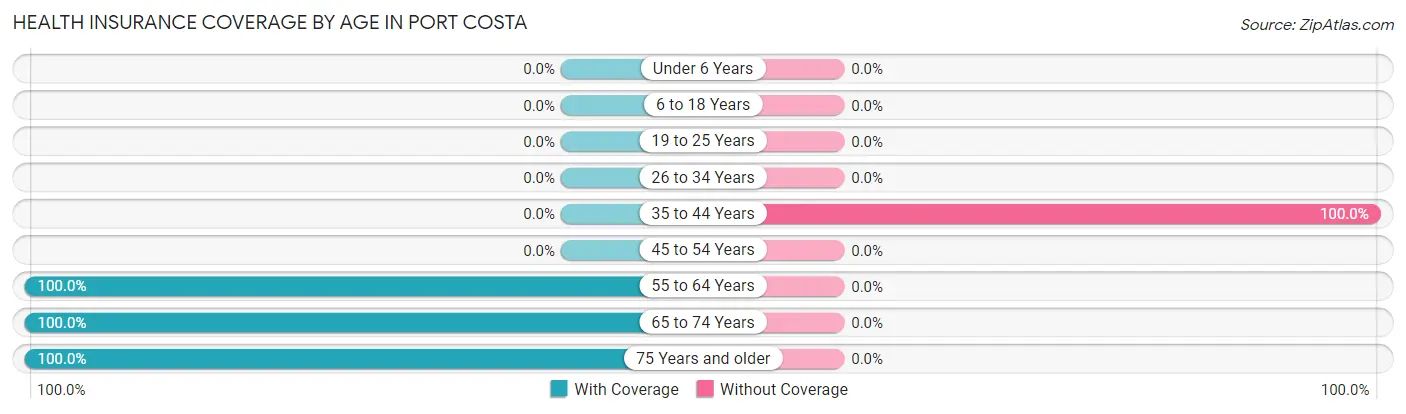
| Age Bracket | With Coverage | Without Coverage |
| Under 6 Years | 0 (0.0%) | 0 (0.0%) |
| 6 to 18 Years | 0 (0.0%) | 0 (0.0%) |
| 19 to 25 Years | 0 (0.0%) | 0 (0.0%) |
| 26 to 34 Years | 0 (0.0%) | 0 (0.0%) |
| 35 to 44 Years | 0 (0.0%) | 18 (100.0%) |
| 45 to 54 Years | 0 (0.0%) | 0 (0.0%) |
| 55 to 64 Years | 71 (100.0%) | 0 (0.0%) |
| 65 to 74 Years | 87 (100.0%) | 0 (0.0%) |
| 75 Years and older | 75 (100.0%) | 0 (0.0%) |
| Total | 233 (92.8%) | 18 (7.2%) |
Health Insurance Coverage by Citizenship Status in Port Costa

| Citizenship Status | With Coverage | Without Coverage |
| Native Born | 0 (0.0%) | 0 (0.0%) |
| Foreign Born, Citizen | 0 (0.0%) | 0 (0.0%) |
| Foreign Born, not a Citizen | 0 (0.0%) | 0 (0.0%) |
Health Insurance Coverage by Household Income in Port Costa
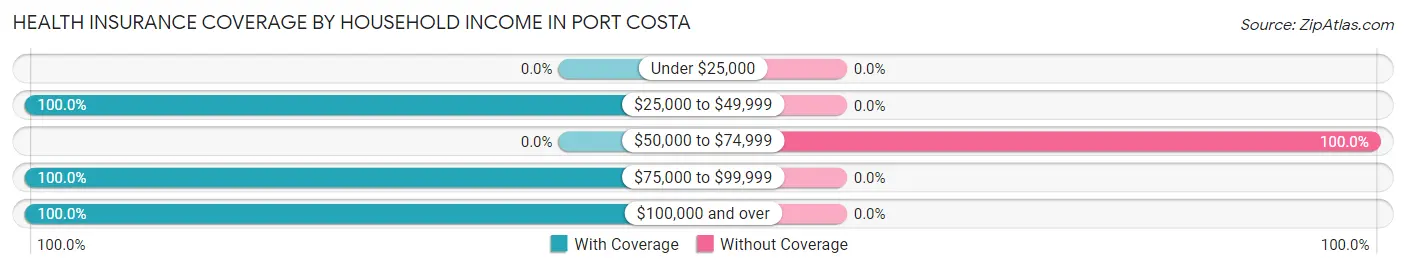
| Household Income | With Coverage | Without Coverage |
| Under $25,000 | 0 (0.0%) | 0 (0.0%) |
| $25,000 to $49,999 | 86 (100.0%) | 0 (0.0%) |
| $50,000 to $74,999 | 0 (0.0%) | 18 (100.0%) |
| $75,000 to $99,999 | 87 (100.0%) | 0 (0.0%) |
| $100,000 and over | 60 (100.0%) | 0 (0.0%) |
Public vs Private Health Insurance Coverage by Age in Port Costa
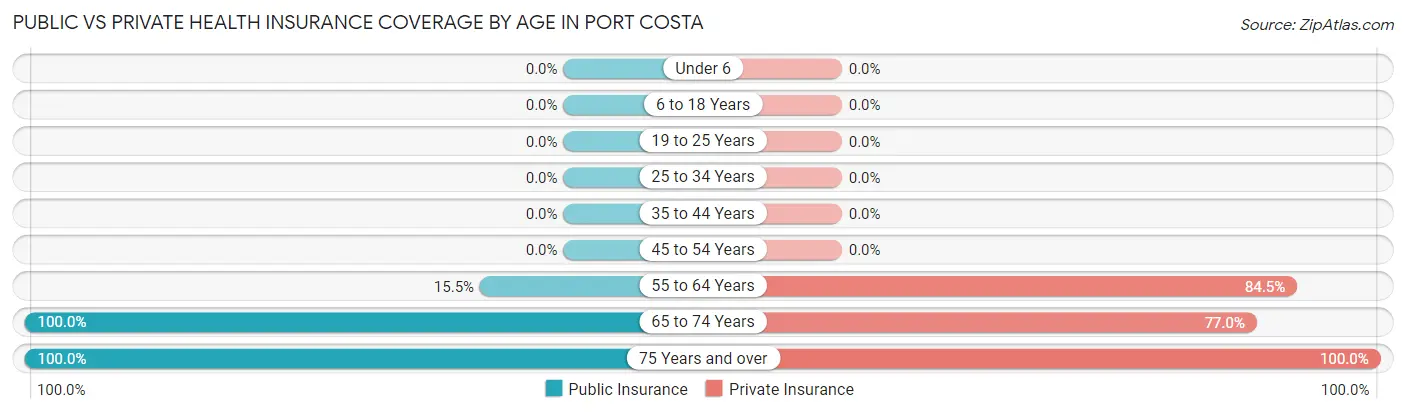
| Age Bracket | Public Insurance | Private Insurance |
| Under 6 | 0 (0.0%) | 0 (0.0%) |
| 6 to 18 Years | 0 (0.0%) | 0 (0.0%) |
| 19 to 25 Years | 0 (0.0%) | 0 (0.0%) |
| 25 to 34 Years | 0 (0.0%) | 0 (0.0%) |
| 35 to 44 Years | 0 (0.0%) | 0 (0.0%) |
| 45 to 54 Years | 0 (0.0%) | 0 (0.0%) |
| 55 to 64 Years | 11 (15.5%) | 60 (84.5%) |
| 65 to 74 Years | 87 (100.0%) | 67 (77.0%) |
| 75 Years and over | 75 (100.0%) | 75 (100.0%) |
| Total | 173 (68.9%) | 202 (80.5%) |
Disability Status by Sex by Age in Port Costa
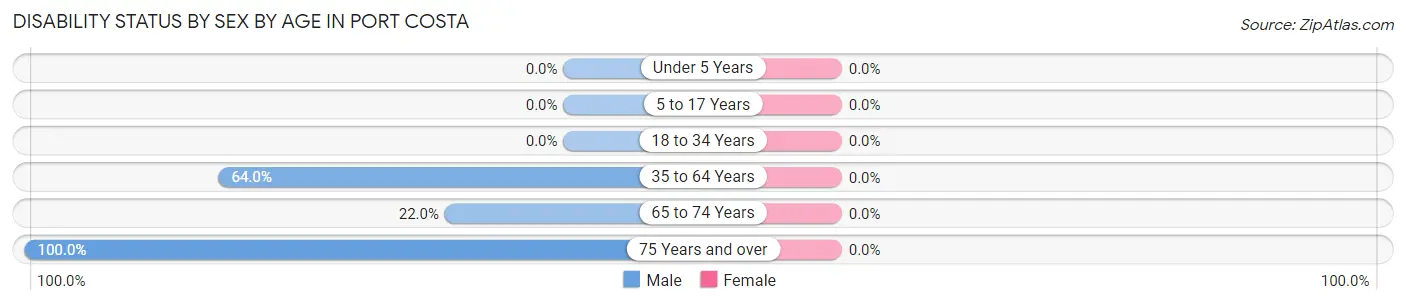
| Age Bracket | Male | Female |
| Under 5 Years | 0 (0.0%) | 0 (0.0%) |
| 5 to 17 Years | 0 (0.0%) | 0 (0.0%) |
| 18 to 34 Years | 0 (0.0%) | 0 (0.0%) |
| 35 to 64 Years | 32 (64.0%) | 0 (0.0%) |
| 65 to 74 Years | 11 (22.0%) | 0 (0.0%) |
| 75 Years and over | 75 (100.0%) | 0 (0.0%) |
Disability Class by Sex by Age in Port Costa
Disability Class: Hearing Difficulty
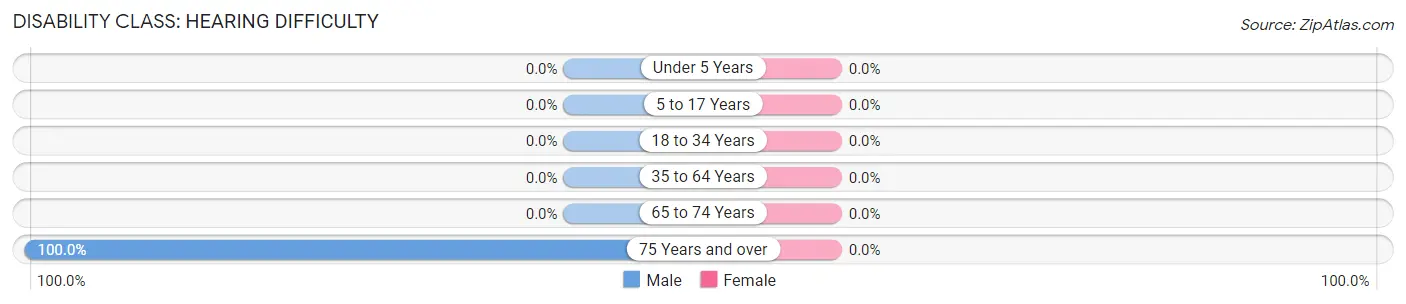
| Age Bracket | Male | Female |
| Under 5 Years | 0 (0.0%) | 0 (0.0%) |
| 5 to 17 Years | 0 (0.0%) | 0 (0.0%) |
| 18 to 34 Years | 0 (0.0%) | 0 (0.0%) |
| 35 to 64 Years | 0 (0.0%) | 0 (0.0%) |
| 65 to 74 Years | 0 (0.0%) | 0 (0.0%) |
| 75 Years and over | 75 (100.0%) | 0 (0.0%) |
Disability Class: Vision Difficulty
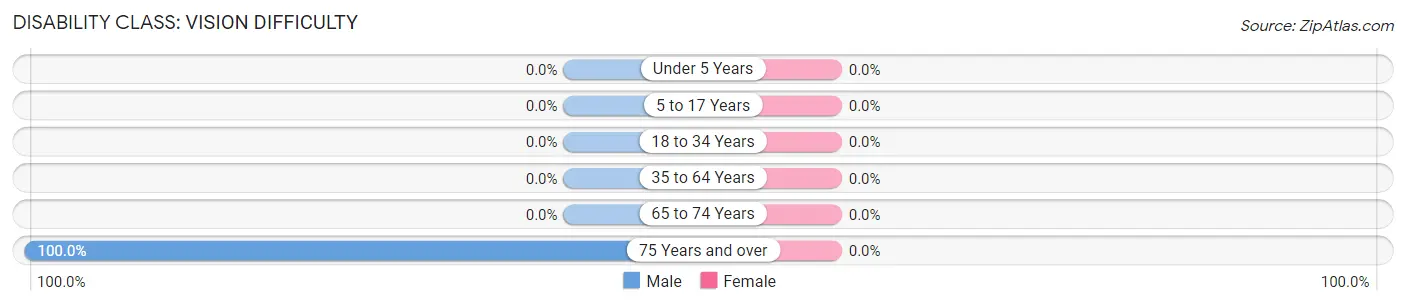
| Age Bracket | Male | Female |
| Under 5 Years | 0 (0.0%) | 0 (0.0%) |
| 5 to 17 Years | 0 (0.0%) | 0 (0.0%) |
| 18 to 34 Years | 0 (0.0%) | 0 (0.0%) |
| 35 to 64 Years | 0 (0.0%) | 0 (0.0%) |
| 65 to 74 Years | 0 (0.0%) | 0 (0.0%) |
| 75 Years and over | 75 (100.0%) | 0 (0.0%) |
Disability Class: Cognitive Difficulty
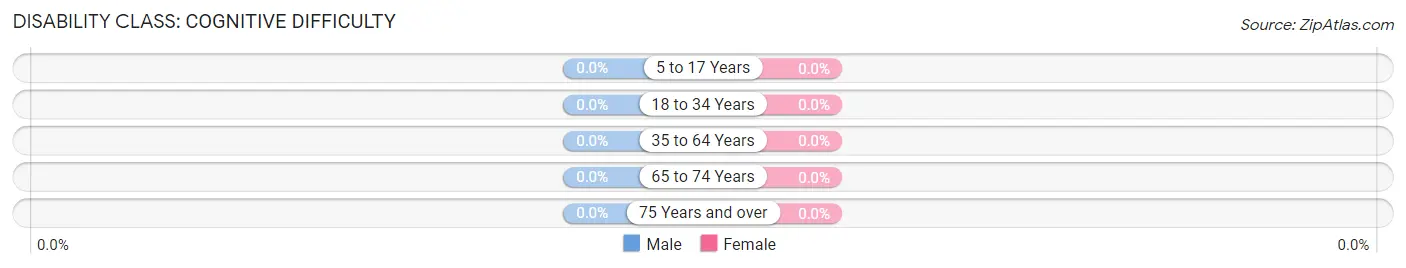
| Age Bracket | Male | Female |
| 5 to 17 Years | 0 (0.0%) | 0 (0.0%) |
| 18 to 34 Years | 0 (0.0%) | 0 (0.0%) |
| 35 to 64 Years | 0 (0.0%) | 0 (0.0%) |
| 65 to 74 Years | 0 (0.0%) | 0 (0.0%) |
| 75 Years and over | 0 (0.0%) | 0 (0.0%) |
Disability Class: Ambulatory Difficulty
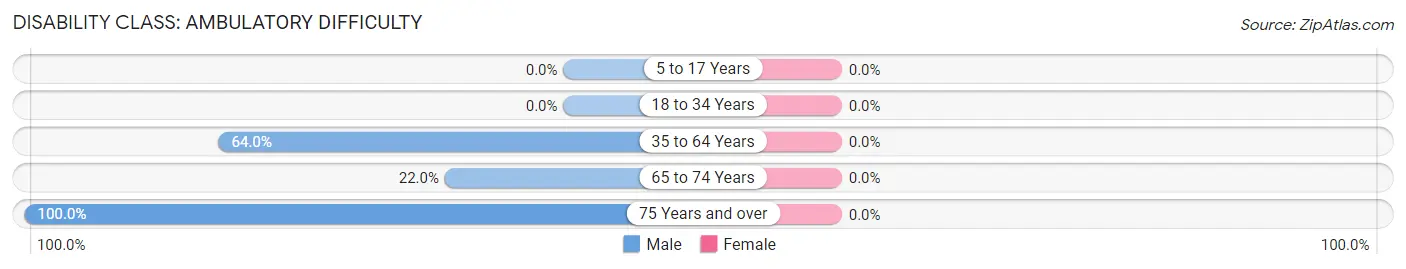
| Age Bracket | Male | Female |
| 5 to 17 Years | 0 (0.0%) | 0 (0.0%) |
| 18 to 34 Years | 0 (0.0%) | 0 (0.0%) |
| 35 to 64 Years | 32 (64.0%) | 0 (0.0%) |
| 65 to 74 Years | 11 (22.0%) | 0 (0.0%) |
| 75 Years and over | 75 (100.0%) | 0 (0.0%) |
Disability Class: Self-Care Difficulty
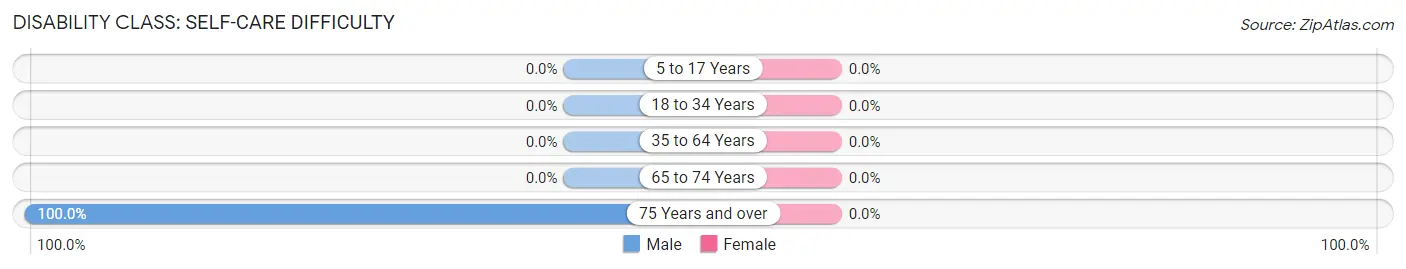
| Age Bracket | Male | Female |
| 5 to 17 Years | 0 (0.0%) | 0 (0.0%) |
| 18 to 34 Years | 0 (0.0%) | 0 (0.0%) |
| 35 to 64 Years | 0 (0.0%) | 0 (0.0%) |
| 65 to 74 Years | 0 (0.0%) | 0 (0.0%) |
| 75 Years and over | 75 (100.0%) | 0 (0.0%) |
Technology Access in Port Costa
Computing Device Access in Port Costa
| Device Type | # Households | % Households |
| Desktop or Laptop | 153 | 89.5% |
| Smartphone | 171 | 100.0% |
| Tablet | 49 | 28.6% |
| No Computing Device | 0 | 0.0% |
| Total | 171 | 100.0% |
Internet Access in Port Costa
| Internet Type | # Households | % Households |
| Dial-Up Internet | 0 | 0.0% |
| Broadband Home | 78 | 45.6% |
| Cellular Data Only | 18 | 10.5% |
| Satellite Internet | 75 | 43.9% |
| No Internet | 0 | 0.0% |
| Total | 171 | 100.0% |
Port Costa Summary
Introduction
Port Costa is a small unincorporated community located in Contra Costa County, California. It is situated on the Carquinez Strait, which is part of the San Francisco Bay. The town is known for its historic buildings, its picturesque waterfront, and its unique atmosphere. It is a popular destination for tourists and locals alike.
History
Port Costa was founded in 1879 by John C. Reed, a former wharf operator from San Francisco. He purchased the land from the Mexican government and established a wharf and a warehouse. The town quickly grew and became a major shipping port for the region. In the late 1800s, the town was a major hub for the shipping of grain, lumber, and other goods.
In the early 1900s, the town began to decline as the shipping industry moved away from the area. The town was nearly abandoned by the 1950s. In the 1960s, the town was rediscovered by artists and writers who were drawn to its unique atmosphere. The town was revitalized and became a popular tourist destination.
Geography
Port Costa is located in Contra Costa County, California. It is situated on the Carquinez Strait, which is part of the San Francisco Bay. The town is surrounded by rolling hills and is located near the Carquinez Bridge. The town is located about 30 miles northeast of San Francisco.
The climate in Port Costa is mild and temperate. The average temperature in the summer is around 70 degrees Fahrenheit and the average temperature in the winter is around 50 degrees Fahrenheit.
Economy
The economy of Port Costa is largely based on tourism. The town is a popular destination for visitors who are drawn to its unique atmosphere and historic buildings. The town also has a few small businesses, including a cafe, a general store, and a few antique shops.
Demographics
As of the 2010 census, the population of Port Costa was 250. The racial makeup of the town was 94.4% White, 0.8% African American, 0.4% Native American, 0.4% Asian, 0.4% Pacific Islander, and 3.2% from other races. The median household income was $50,000.
Conclusion
Port Costa is a small unincorporated community located in Contra Costa County, California. It is situated on the Carquinez Strait, which is part of the San Francisco Bay. The town is known for its historic buildings, its picturesque waterfront, and its unique atmosphere. It is a popular destination for tourists and locals alike. The economy of Port Costa is largely based on tourism and the town has a population of 250.
Common Questions
What is Per Capita Income in Port Costa?
Per Capita income in Port Costa is $53,593.
What is Inequality or Gini Index in Port Costa?
Inequality or Gini Index in Port Costa is 0.44.
What is the Total Population of Port Costa?
Total Population of Port Costa is 251.
What is the Total Male Population of Port Costa?
Total Male Population of Port Costa is 175.
What is the Total Female Population of Port Costa?
Total Female Population of Port Costa is 76.
What is the Ratio of Males per 100 Females in Port Costa?
There are 230.26 Males per 100 Females in Port Costa.
What is the Ratio of Females per 100 Males in Port Costa?
There are 43.43 Females per 100 Males in Port Costa.
What is the Median Population Age in Port Costa?
Median Population Age in Port Costa is 66.8 Years.
What is the Average Family Size in Port Costa
Average Family Size in Port Costa is 1.9 People.
What is the Average Household Size in Port Costa
Average Household Size in Port Costa is 1.5 People.
How Large is the Labor Force in Port Costa?
There are 149 People in the Labor Forcein in Port Costa.
What is the Percentage of People in the Labor Force in Port Costa?
59.4% of People are in the Labor Force in Port Costa.
What is the Unemployment Rate in Port Costa?
Unemployment Rate in Port Costa is 7.4%.