Cambrian Park, CA Map & Demographics
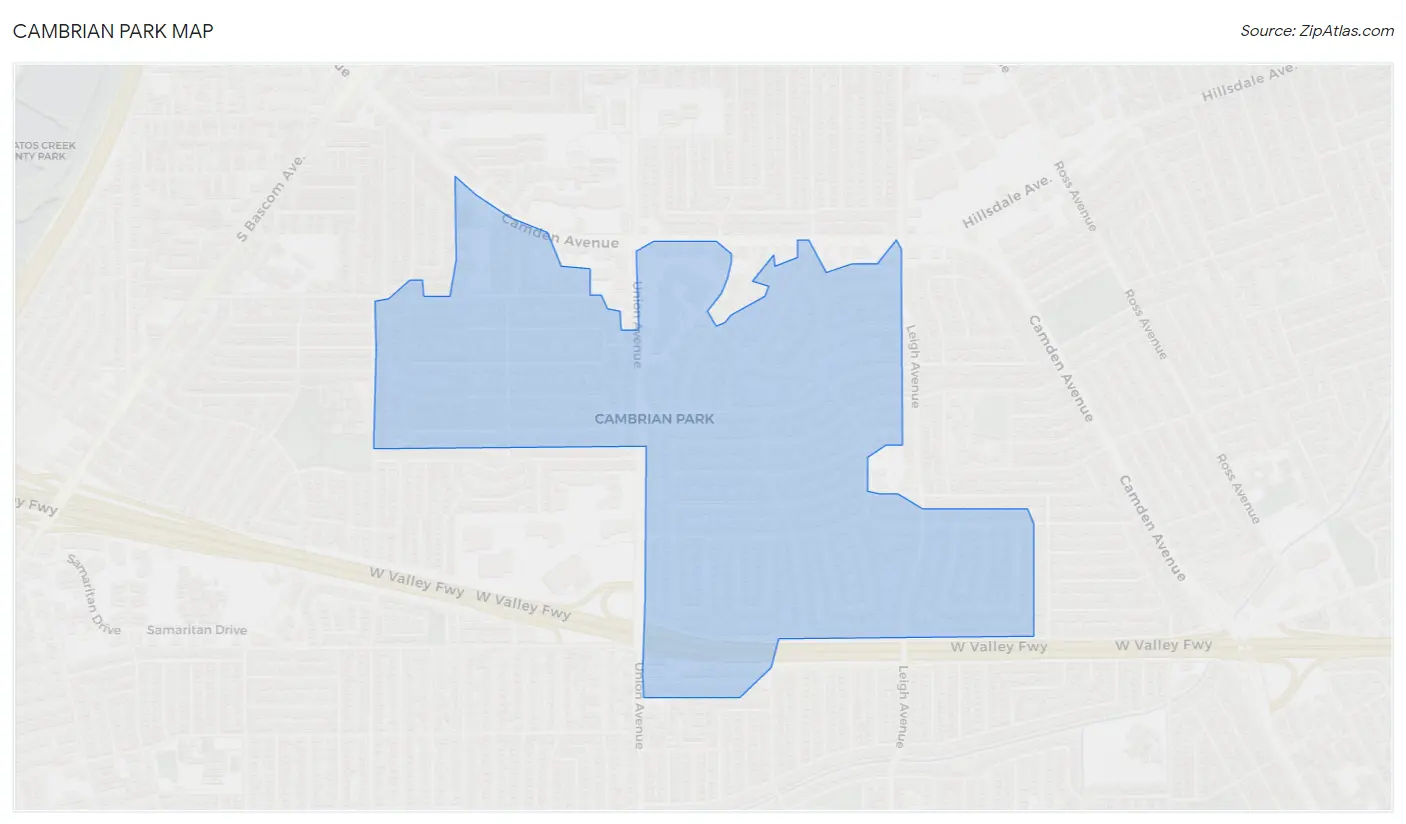
Cambrian Park Map
Cambrian Park Overview
$109,617
PER CAPITA INCOME
$250,001
AVG FAMILY INCOME
$232,000
AVG HOUSEHOLD INCOME
54.7%
WAGE / INCOME GAP [ % ]
45.3¢/ $1
WAGE / INCOME GAP [ $ ]
0.46
INEQUALITY / GINI INDEX
3,551
TOTAL POPULATION
1,642
MALE POPULATION
1,909
FEMALE POPULATION
86.01
MALES / 100 FEMALES
116.26
FEMALES / 100 MALES
44.8
MEDIAN AGE
3.2
AVG FAMILY SIZE
2.9
AVG HOUSEHOLD SIZE
1,885
LABOR FORCE [ PEOPLE ]
65.7%
PERCENT IN LABOR FORCE
0.9%
UNEMPLOYMENT RATE
Income in Cambrian Park
Income Overview in Cambrian Park
Per Capita Income in Cambrian Park is $109,617, while median incomes of families and households are $250,001 and $232,000 respectively.
| Characteristic | Number | Measure |
| Per Capita Income | 3,551 | $109,617 |
| Median Family Income | 977 | $250,001 |
| Mean Family Income | 977 | $347,727 |
| Median Household Income | 1,210 | $232,000 |
| Mean Household Income | 1,210 | $314,858 |
| Income Deficit | 977 | $0 |
| Wage / Income Gap (%) | 3,551 | 54.69% |
| Wage / Income Gap ($) | 3,551 | 45.31¢ per $1 |
| Gini / Inequality Index | 3,551 | 0.46 |
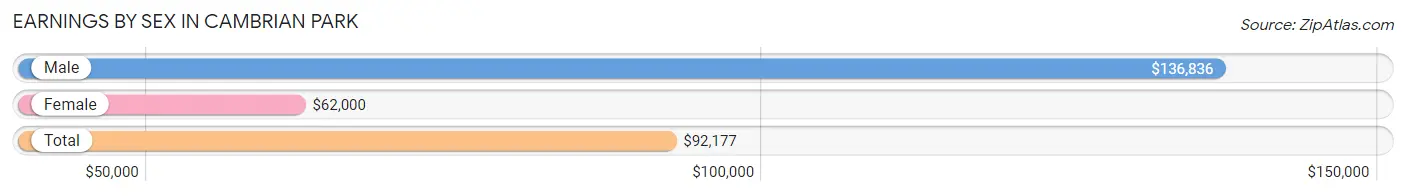
Earnings by Sex in Cambrian Park
Average Earnings in Cambrian Park are $92,177, $136,836 for men and $62,000 for women, a difference of 54.7%.
| Sex | Number | Average Earnings |
| Male | 981 (49.9%) | $136,836 |
| Female | 986 (50.1%) | $62,000 |
| Total | 1,967 (100.0%) | $92,177 |
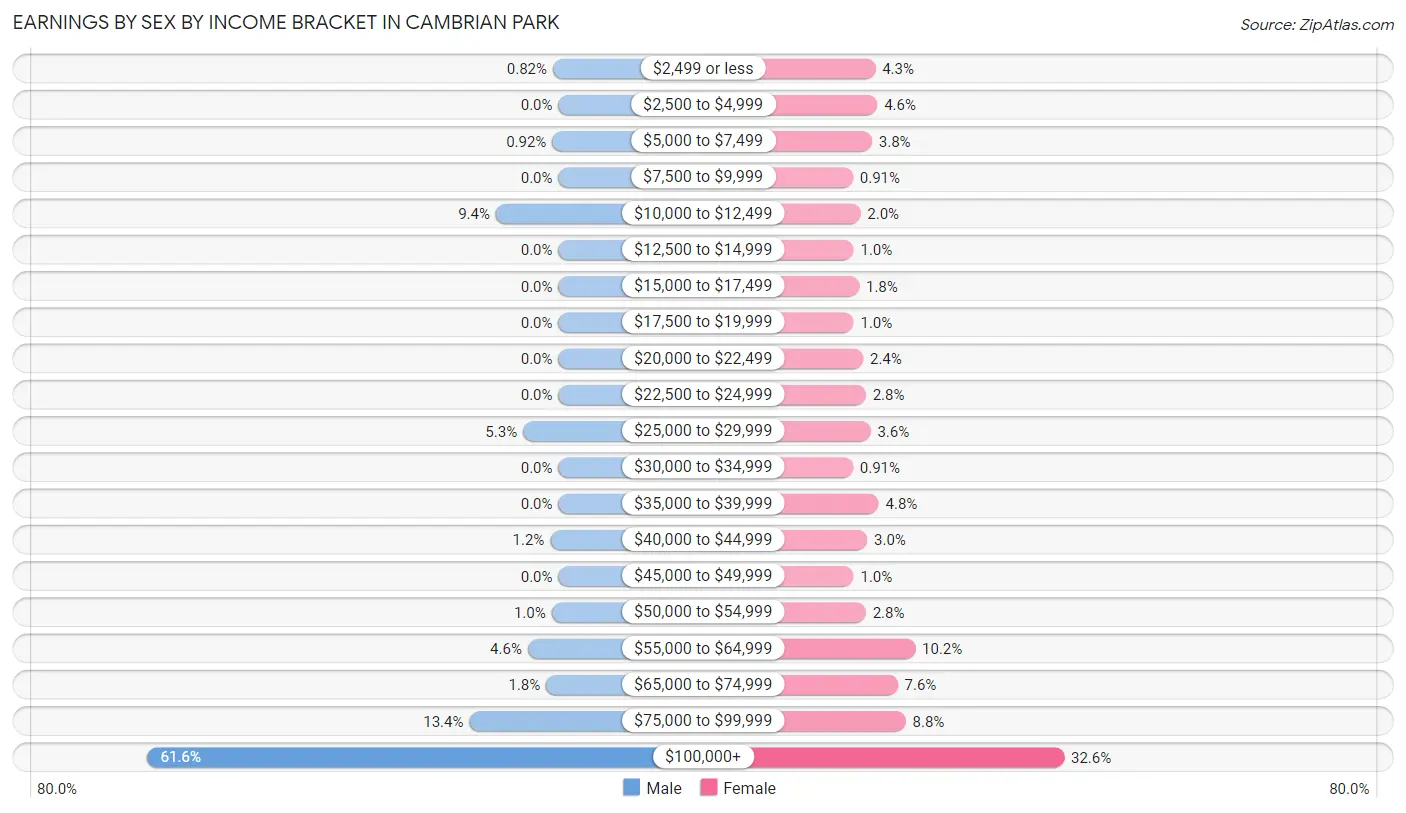
Earnings by Sex by Income Bracket in Cambrian Park
The most common earnings brackets in Cambrian Park are $100,000+ for men (604 | 61.6%) and $100,000+ for women (321 | 32.6%).
| Income | Male | Female |
| $2,499 or less | 8 (0.8%) | 42 (4.3%) |
| $2,500 to $4,999 | 0 (0.0%) | 45 (4.6%) |
| $5,000 to $7,499 | 9 (0.9%) | 37 (3.7%) |
| $7,500 to $9,999 | 0 (0.0%) | 9 (0.9%) |
| $10,000 to $12,499 | 92 (9.4%) | 20 (2.0%) |
| $12,500 to $14,999 | 0 (0.0%) | 10 (1.0%) |
| $15,000 to $17,499 | 0 (0.0%) | 18 (1.8%) |
| $17,500 to $19,999 | 0 (0.0%) | 10 (1.0%) |
| $20,000 to $22,499 | 0 (0.0%) | 24 (2.4%) |
| $22,500 to $24,999 | 0 (0.0%) | 28 (2.8%) |
| $25,000 to $29,999 | 52 (5.3%) | 35 (3.5%) |
| $30,000 to $34,999 | 0 (0.0%) | 9 (0.9%) |
| $35,000 to $39,999 | 0 (0.0%) | 47 (4.8%) |
| $40,000 to $44,999 | 12 (1.2%) | 30 (3.0%) |
| $45,000 to $49,999 | 0 (0.0%) | 10 (1.0%) |
| $50,000 to $54,999 | 10 (1.0%) | 28 (2.8%) |
| $55,000 to $64,999 | 45 (4.6%) | 101 (10.2%) |
| $65,000 to $74,999 | 18 (1.8%) | 75 (7.6%) |
| $75,000 to $99,999 | 131 (13.4%) | 87 (8.8%) |
| $100,000+ | 604 (61.6%) | 321 (32.6%) |
| Total | 981 (100.0%) | 986 (100.0%) |
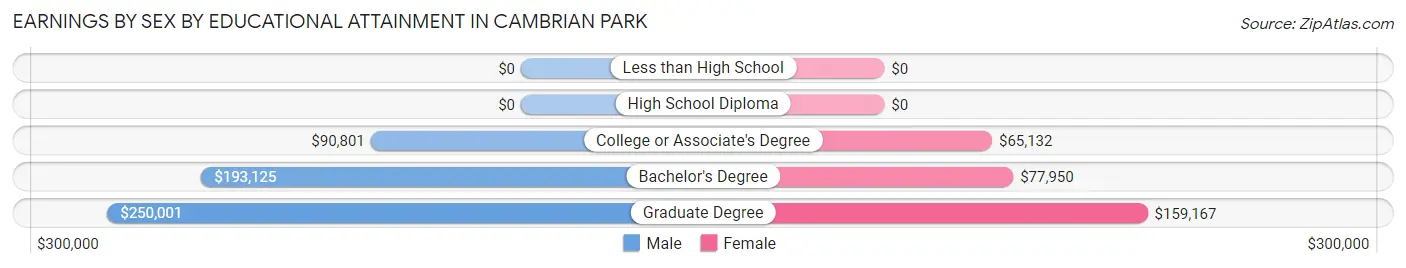
Earnings by Sex by Educational Attainment in Cambrian Park
Average earnings in Cambrian Park are $164,226 for men and $71,250 for women, a difference of 56.6%. Men with an educational attainment of graduate degree enjoy the highest average annual earnings of $250,001, while those with college or associate's degree education earn the least with $90,801. Women with an educational attainment of graduate degree earn the most with the average annual earnings of $159,167, while those with college or associate's degree education have the smallest earnings of $65,132.
| Educational Attainment | Male Income | Female Income |
| Less than High School | - | - |
| High School Diploma | - | - |
| College or Associate's Degree | $90,801 | $65,132 |
| Bachelor's Degree | $193,125 | $77,950 |
| Graduate Degree | $250,001 | $159,167 |
| Total | $164,226 | $71,250 |
Family Income in Cambrian Park
Family Income Brackets in Cambrian Park
According to the Cambrian Park family income data, there are 598 families falling into the $200,000+ income range, which is the most common income bracket and makes up 61.2% of all families.
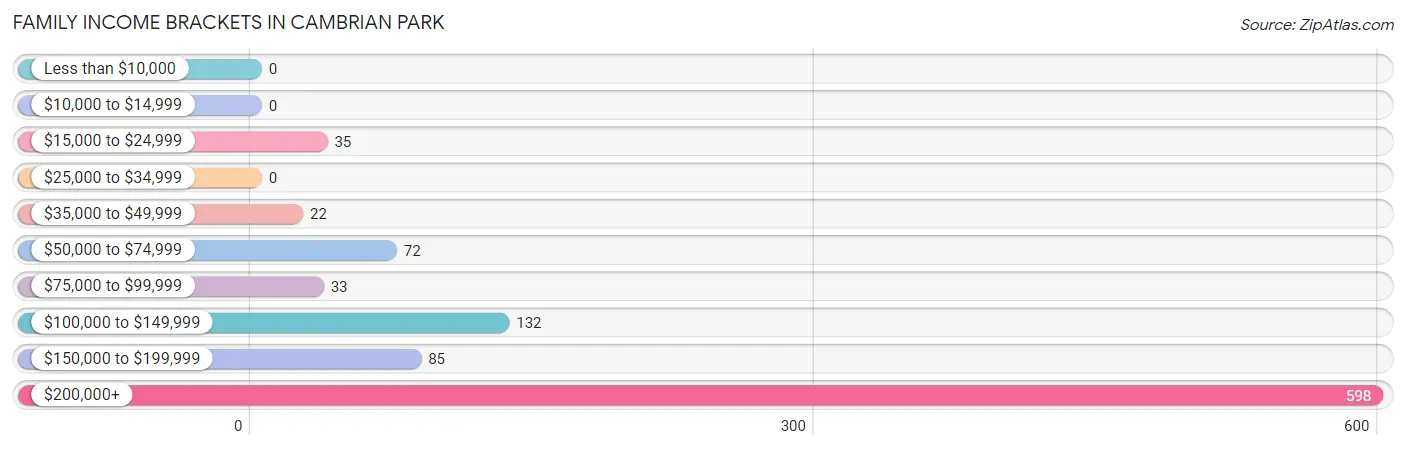
| Income Bracket | # Families | % Families |
| Less than $10,000 | 0 | 0.0% |
| $10,000 to $14,999 | 0 | 0.0% |
| $15,000 to $24,999 | 35 | 3.6% |
| $25,000 to $34,999 | 0 | 0.0% |
| $35,000 to $49,999 | 22 | 2.3% |
| $50,000 to $74,999 | 72 | 7.4% |
| $75,000 to $99,999 | 33 | 3.4% |
| $100,000 to $149,999 | 132 | 13.5% |
| $150,000 to $199,999 | 85 | 8.7% |
| $200,000+ | 598 | 61.2% |
Family Income by Famaliy Size in Cambrian Park
3-person families (298 | 30.5%) account for the highest median family income in Cambrian Park with $250,001 per family, while 2-person families (347 | 35.5%) have the highest median income of $94,610 per family member.
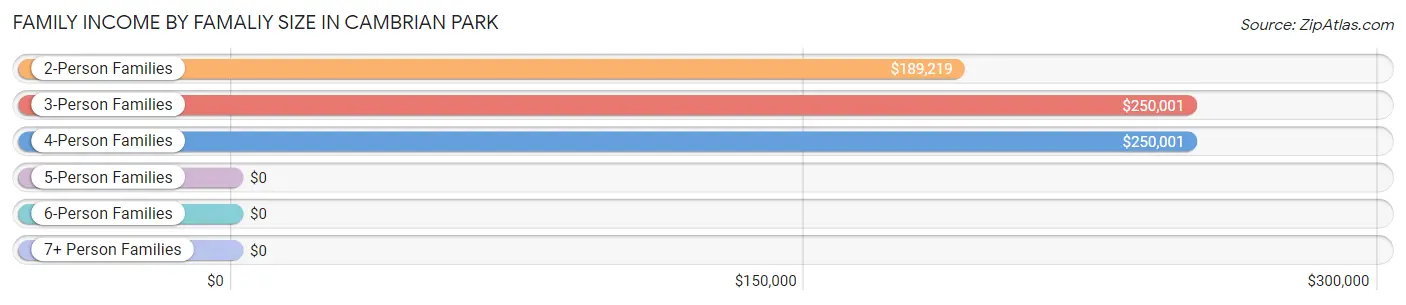
| Income Bracket | # Families | Median Income |
| 2-Person Families | 347 (35.5%) | $189,219 |
| 3-Person Families | 298 (30.5%) | $250,001 |
| 4-Person Families | 235 (24.0%) | $250,001 |
| 5-Person Families | 74 (7.6%) | $0 |
| 6-Person Families | 23 (2.4%) | $0 |
| 7+ Person Families | 0 (0.0%) | $0 |
| Total | 977 (100.0%) | $250,001 |
Family Income by Number of Earners in Cambrian Park
The median family income in Cambrian Park is $250,001, with families comprising 1 earner (223) having the highest median family income of $250,001, while families with no earners (121) have the lowest median family income of $122,949, accounting for 22.8% and 12.4% of families, respectively.
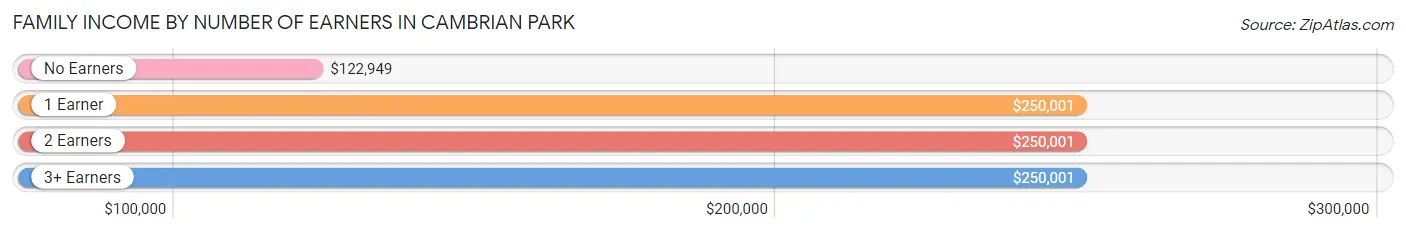
| Number of Earners | # Families | Median Income |
| No Earners | 121 (12.4%) | $122,949 |
| 1 Earner | 223 (22.8%) | $250,001 |
| 2 Earners | 458 (46.9%) | $250,001 |
| 3+ Earners | 175 (17.9%) | $250,001 |
| Total | 977 (100.0%) | $250,001 |
Household Income in Cambrian Park
Household Income Brackets in Cambrian Park
With 641 households falling in the category, the $200,000+ income range is the most frequent in Cambrian Park, accounting for 53.0% of all households.
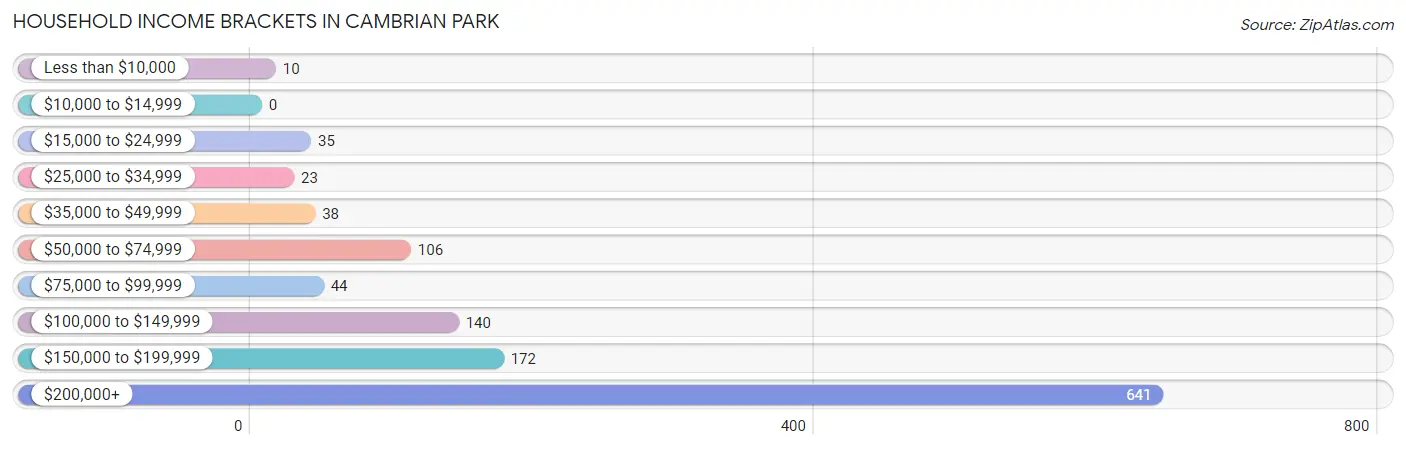
| Income Bracket | # Households | % Households |
| Less than $10,000 | 10 | 0.8% |
| $10,000 to $14,999 | 0 | 0.0% |
| $15,000 to $24,999 | 35 | 2.9% |
| $25,000 to $34,999 | 23 | 1.9% |
| $35,000 to $49,999 | 38 | 3.1% |
| $50,000 to $74,999 | 106 | 8.8% |
| $75,000 to $99,999 | 44 | 3.6% |
| $100,000 to $149,999 | 140 | 11.6% |
| $150,000 to $199,999 | 172 | 14.2% |
| $200,000+ | 641 | 53.0% |
Household Income by Householder Age in Cambrian Park
The median household income in Cambrian Park is $232,000, with the highest median household income of $250,001 found in the 45 to 64 years age bracket for the primary householder. A total of 551 households (45.5%) fall into this category.
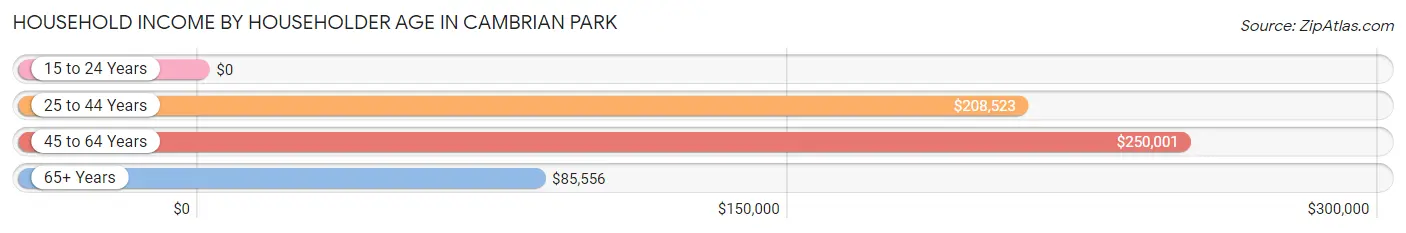
| Income Bracket | # Households | Median Income |
| 15 to 24 Years | 0 (0.0%) | $0 |
| 25 to 44 Years | 391 (32.3%) | $208,523 |
| 45 to 64 Years | 551 (45.5%) | $250,001 |
| 65+ Years | 268 (22.2%) | $85,556 |
| Total | 1,210 (100.0%) | $232,000 |
Poverty in Cambrian Park
Income Below Poverty by Sex and Age in Cambrian Park
With 6.5% poverty level for males and 6.3% for females among the residents of Cambrian Park, 15 year old males and 12 to 14 year old females are the most vulnerable to poverty, with 30 males (39.0%) and 40 females (42.5%) in their respective age groups living below the poverty level.
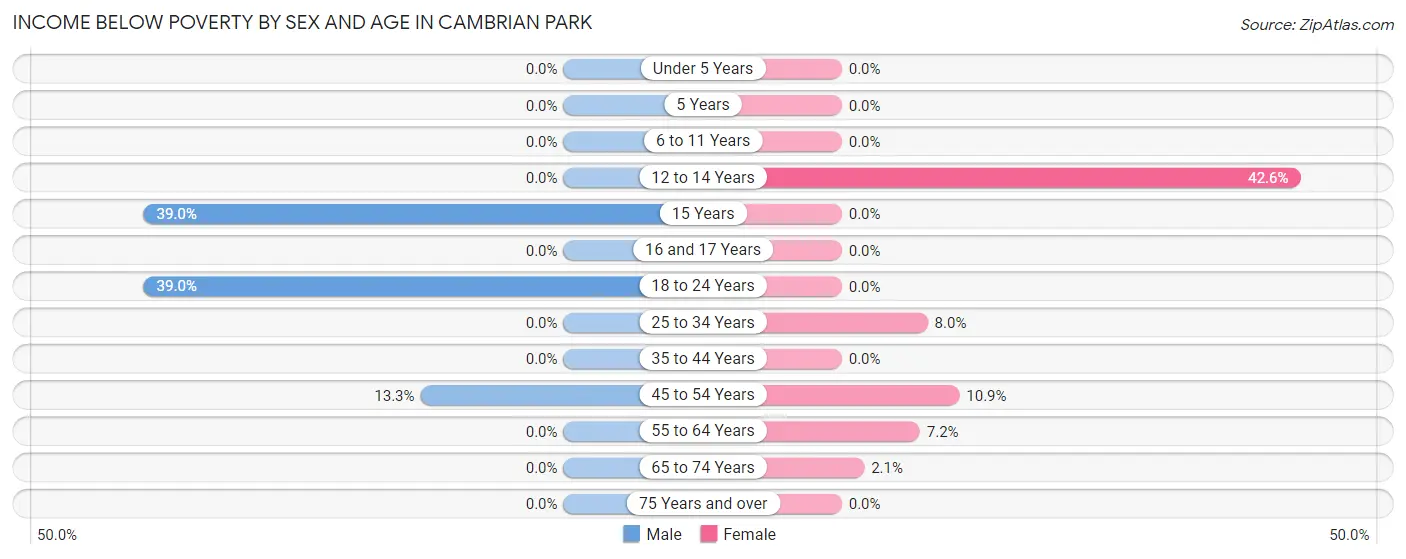
| Age Bracket | Male | Female |
| Under 5 Years | 0 (0.0%) | 0 (0.0%) |
| 5 Years | 0 (0.0%) | 0 (0.0%) |
| 6 to 11 Years | 0 (0.0%) | 0 (0.0%) |
| 12 to 14 Years | 0 (0.0%) | 40 (42.5%) |
| 15 Years | 30 (39.0%) | 0 (0.0%) |
| 16 and 17 Years | 0 (0.0%) | 0 (0.0%) |
| 18 to 24 Years | 37 (39.0%) | 0 (0.0%) |
| 25 to 34 Years | 0 (0.0%) | 20 (8.0%) |
| 35 to 44 Years | 0 (0.0%) | 0 (0.0%) |
| 45 to 54 Years | 39 (13.3%) | 36 (10.9%) |
| 55 to 64 Years | 0 (0.0%) | 21 (7.2%) |
| 65 to 74 Years | 0 (0.0%) | 2 (2.1%) |
| 75 Years and over | 0 (0.0%) | 0 (0.0%) |
| Total | 106 (6.5%) | 119 (6.3%) |
Income Above Poverty by Sex and Age in Cambrian Park
According to the poverty statistics in Cambrian Park, males aged under 5 years and females aged under 5 years are the age groups that are most secure financially, with 100.0% of males and 100.0% of females in these age groups living above the poverty line.
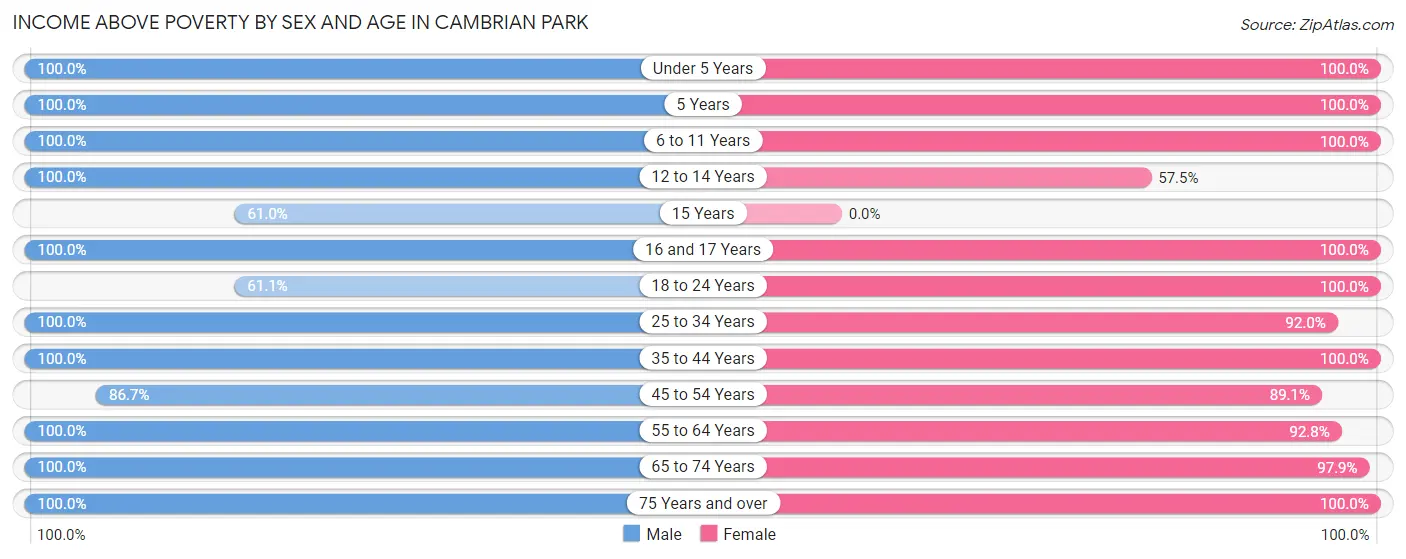
| Age Bracket | Male | Female |
| Under 5 Years | 83 (100.0%) | 191 (100.0%) |
| 5 Years | 25 (100.0%) | 10 (100.0%) |
| 6 to 11 Years | 63 (100.0%) | 111 (100.0%) |
| 12 to 14 Years | 28 (100.0%) | 54 (57.5%) |
| 15 Years | 47 (61.0%) | 0 (0.0%) |
| 16 and 17 Years | 25 (100.0%) | 18 (100.0%) |
| 18 to 24 Years | 58 (61.1%) | 195 (100.0%) |
| 25 to 34 Years | 181 (100.0%) | 231 (92.0%) |
| 35 to 44 Years | 137 (100.0%) | 211 (100.0%) |
| 45 to 54 Years | 255 (86.7%) | 294 (89.1%) |
| 55 to 64 Years | 340 (100.0%) | 269 (92.8%) |
| 65 to 74 Years | 180 (100.0%) | 94 (97.9%) |
| 75 Years and over | 103 (100.0%) | 79 (100.0%) |
| Total | 1,525 (93.5%) | 1,757 (93.7%) |
Income Below Poverty Among Married-Couple Families in Cambrian Park
The poverty statistics for married-couple families in Cambrian Park show that 3.8% or 35 of the total 915 families live below the poverty line. Families with 1 or 2 children have the highest poverty rate of 8.2%, comprising of 35 families. On the other hand, families with no children have the lowest poverty rate of 0.0%, which includes 0 families.
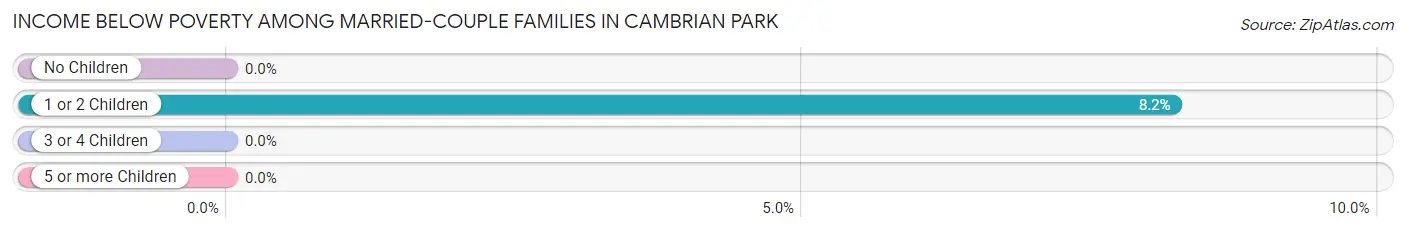
| Children | Above Poverty | Below Poverty |
| No Children | 470 (100.0%) | 0 (0.0%) |
| 1 or 2 Children | 391 (91.8%) | 35 (8.2%) |
| 3 or 4 Children | 19 (100.0%) | 0 (0.0%) |
| 5 or more Children | 0 (0.0%) | 0 (0.0%) |
| Total | 880 (96.2%) | 35 (3.8%) |
Income Below Poverty Among Single-Parent Households in Cambrian Park
| Children | Single Father | Single Mother |
| No Children | 0 (0.0%) | 0 (0.0%) |
| 1 or 2 Children | 0 (0.0%) | 0 (0.0%) |
| 3 or 4 Children | 0 (0.0%) | 0 (0.0%) |
| 5 or more Children | 0 (0.0%) | 0 (0.0%) |
| Total | 0 (0.0%) | 0 (0.0%) |
Income Below Poverty Among Married-Couple vs Single-Parent Households in Cambrian Park
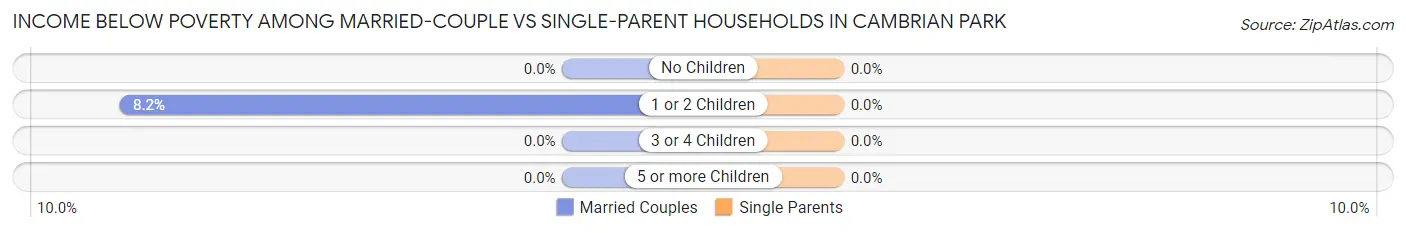
| Children | Married-Couple Families | Single-Parent Households |
| No Children | 0 (0.0%) | 0 (0.0%) |
| 1 or 2 Children | 35 (8.2%) | 0 (0.0%) |
| 3 or 4 Children | 0 (0.0%) | 0 (0.0%) |
| 5 or more Children | 0 (0.0%) | 0 (0.0%) |
| Total | 35 (3.8%) | 0 (0.0%) |
Race in Cambrian Park
The most populous races in Cambrian Park are White / Caucasian (2,155 | 60.7%), Hispanic or Latino (653 | 18.4%), and Asian (628 | 17.7%).
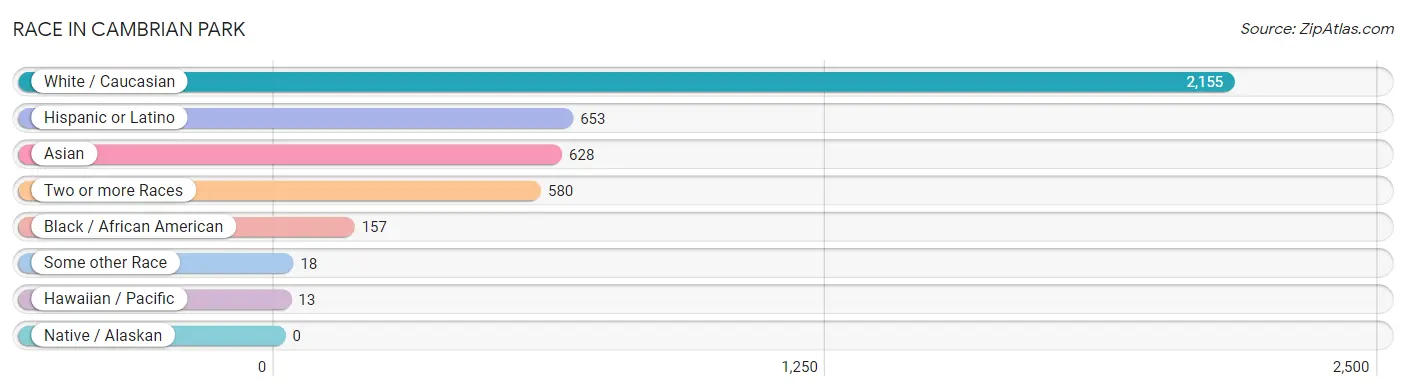
| Race | # Population | % Population |
| Asian | 628 | 17.7% |
| Black / African American | 157 | 4.4% |
| Hawaiian / Pacific | 13 | 0.4% |
| Hispanic or Latino | 653 | 18.4% |
| Native / Alaskan | 0 | 0.0% |
| White / Caucasian | 2,155 | 60.7% |
| Two or more Races | 580 | 16.3% |
| Some other Race | 18 | 0.5% |
| Total | 3,551 | 100.0% |
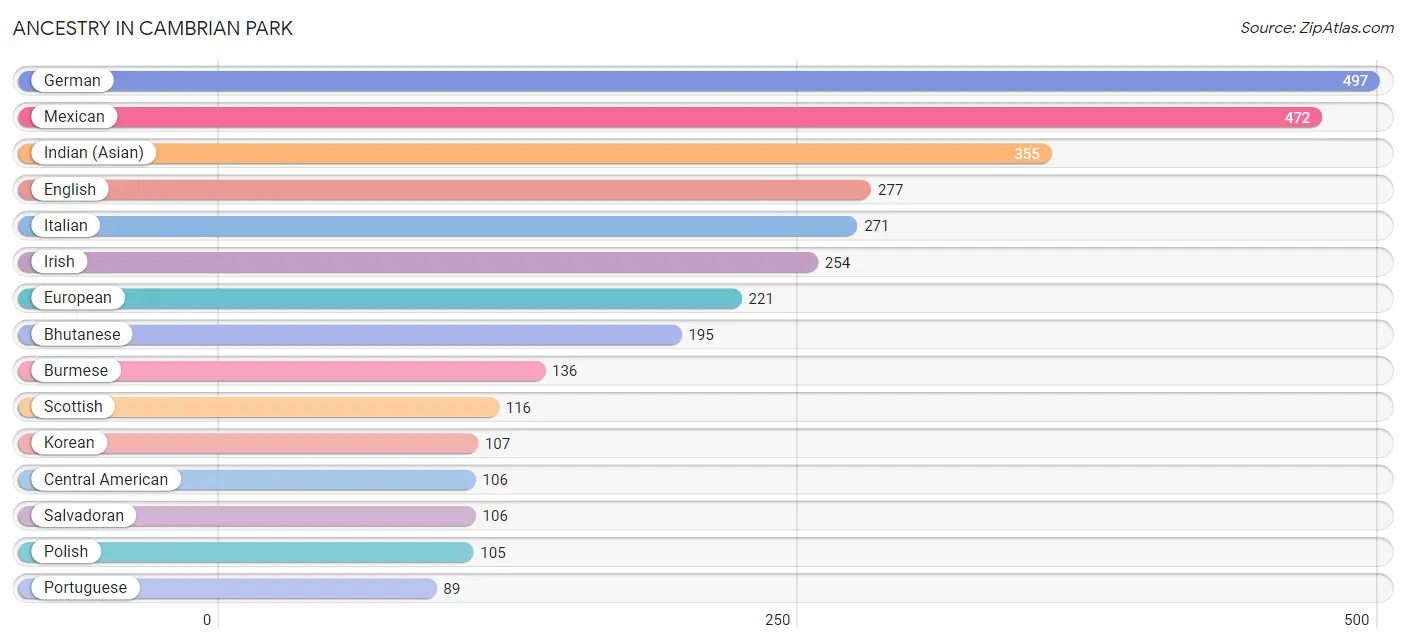
Ancestry in Cambrian Park
The most populous ancestries reported in Cambrian Park are German (497 | 14.0%), Mexican (472 | 13.3%), Indian (Asian) (355 | 10.0%), English (277 | 7.8%), and Italian (271 | 7.6%), together accounting for 52.7% of all Cambrian Park residents.
| Ancestry | # Population | % Population |
| American | 57 | 1.6% |
| Australian | 20 | 0.6% |
| Austrian | 9 | 0.3% |
| Bhutanese | 195 | 5.5% |
| British | 10 | 0.3% |
| Burmese | 136 | 3.8% |
| Central American | 106 | 3.0% |
| Croatian | 67 | 1.9% |
| Czech | 13 | 0.4% |
| Danish | 21 | 0.6% |
| Dutch | 10 | 0.3% |
| Eastern European | 10 | 0.3% |
| English | 277 | 7.8% |
| European | 221 | 6.2% |
| French | 77 | 2.2% |
| French Canadian | 18 | 0.5% |
| German | 497 | 14.0% |
| Greek | 46 | 1.3% |
| Hungarian | 12 | 0.3% |
| Indian (Asian) | 355 | 10.0% |
| Iranian | 57 | 1.6% |
| Irish | 254 | 7.1% |
| Israeli | 10 | 0.3% |
| Italian | 271 | 7.6% |
| Korean | 107 | 3.0% |
| Laotian | 8 | 0.2% |
| Mexican | 472 | 13.3% |
| Northern European | 44 | 1.2% |
| Norwegian | 10 | 0.3% |
| Pakistani | 46 | 1.3% |
| Polish | 105 | 3.0% |
| Portuguese | 89 | 2.5% |
| Puerto Rican | 10 | 0.3% |
| Romanian | 12 | 0.3% |
| Russian | 20 | 0.6% |
| Salvadoran | 106 | 3.0% |
| Samoan | 13 | 0.4% |
| Scottish | 116 | 3.3% |
| South African | 26 | 0.7% |
| South American | 43 | 1.2% |
| Spanish | 8 | 0.2% |
| Sri Lankan | 79 | 2.2% |
| Subsaharan African | 26 | 0.7% |
| Swiss | 30 | 0.8% |
| Thai | 64 | 1.8% |
| Venezuelan | 43 | 1.2% | View All 46 Rows |
Immigrants in Cambrian Park
The most numerous immigrant groups reported in Cambrian Park came from Asia (358 | 10.1%), Europe (205 | 5.8%), Eastern Asia (170 | 4.8%), China (143 | 4.0%), and Western Europe (101 | 2.8%), together accounting for 27.5% of all Cambrian Park residents.
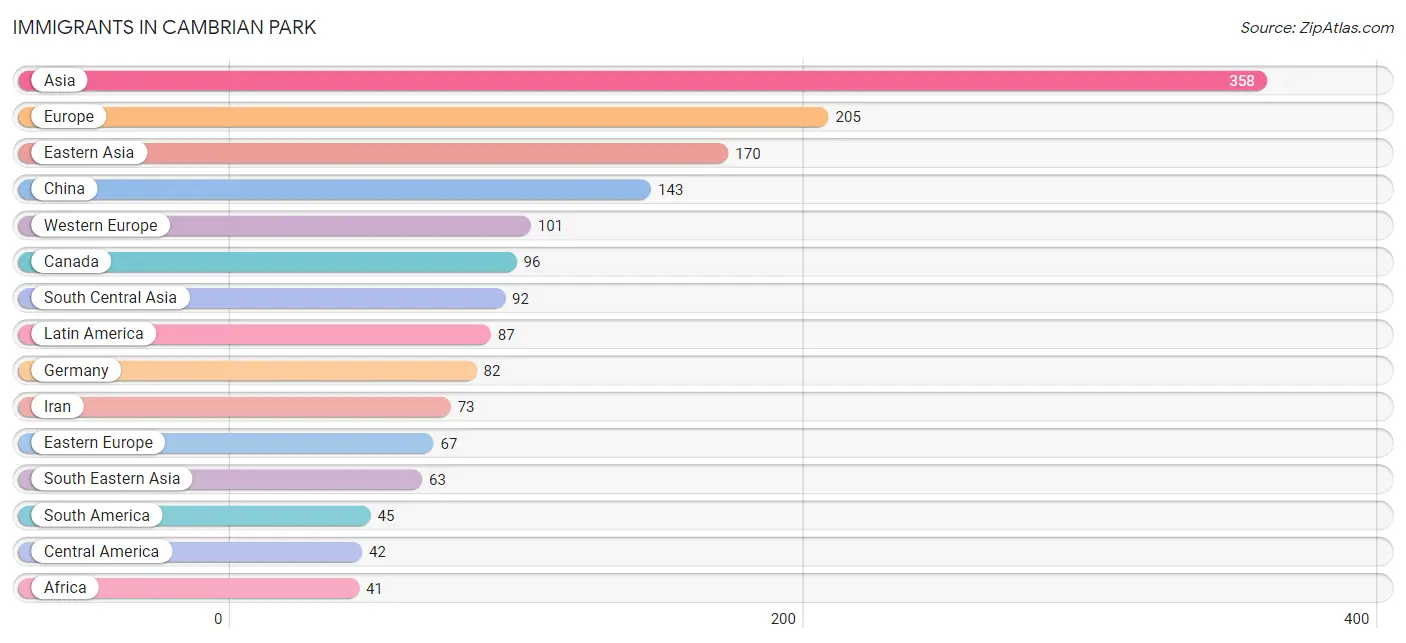
| Immigration Origin | # Population | % Population |
| Africa | 41 | 1.1% |
| Argentina | 25 | 0.7% |
| Asia | 358 | 10.1% |
| Australia | 10 | 0.3% |
| Canada | 96 | 2.7% |
| Central America | 42 | 1.2% |
| China | 143 | 4.0% |
| Croatia | 20 | 0.6% |
| Czechoslovakia | 6 | 0.2% |
| Denmark | 11 | 0.3% |
| Eastern Africa | 15 | 0.4% |
| Eastern Asia | 170 | 4.8% |
| Eastern Europe | 67 | 1.9% |
| El Salvador | 37 | 1.0% |
| England | 8 | 0.2% |
| Europe | 205 | 5.8% |
| Germany | 82 | 2.3% |
| Hong Kong | 1 | 0.0% |
| India | 19 | 0.5% |
| Indonesia | 8 | 0.2% |
| Iran | 73 | 2.1% |
| Iraq | 8 | 0.2% |
| Israel | 10 | 0.3% |
| Jordan | 15 | 0.4% |
| Kenya | 15 | 0.4% |
| Korea | 27 | 0.8% |
| Latin America | 87 | 2.5% |
| Mexico | 5 | 0.1% |
| Northern Europe | 37 | 1.0% |
| Oceania | 23 | 0.6% |
| Philippines | 31 | 0.9% |
| South Africa | 26 | 0.7% |
| South America | 45 | 1.3% |
| South Central Asia | 92 | 2.6% |
| South Eastern Asia | 63 | 1.8% |
| Sweden | 10 | 0.3% |
| Switzerland | 19 | 0.5% |
| Venezuela | 20 | 0.6% |
| Vietnam | 24 | 0.7% |
| Western Asia | 33 | 0.9% |
| Western Europe | 101 | 2.8% | View All 41 Rows |
Sex and Age in Cambrian Park
Sex and Age in Cambrian Park
The most populous age groups in Cambrian Park are 55 to 59 Years (254 | 15.5%) for men and 50 to 54 Years (225 | 11.8%) for women.
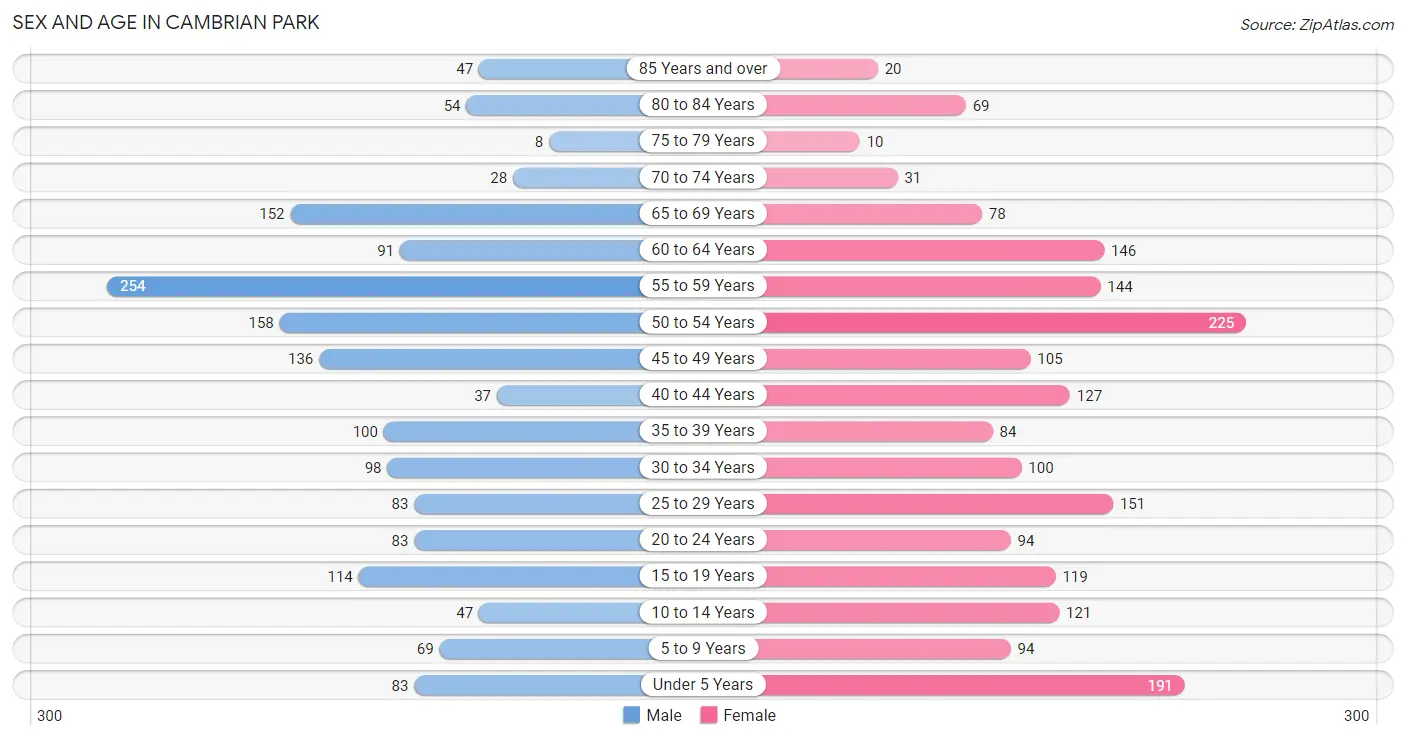
| Age Bracket | Male | Female |
| Under 5 Years | 83 (5.1%) | 191 (10.0%) |
| 5 to 9 Years | 69 (4.2%) | 94 (4.9%) |
| 10 to 14 Years | 47 (2.9%) | 121 (6.3%) |
| 15 to 19 Years | 114 (6.9%) | 119 (6.2%) |
| 20 to 24 Years | 83 (5.1%) | 94 (4.9%) |
| 25 to 29 Years | 83 (5.1%) | 151 (7.9%) |
| 30 to 34 Years | 98 (6.0%) | 100 (5.2%) |
| 35 to 39 Years | 100 (6.1%) | 84 (4.4%) |
| 40 to 44 Years | 37 (2.2%) | 127 (6.7%) |
| 45 to 49 Years | 136 (8.3%) | 105 (5.5%) |
| 50 to 54 Years | 158 (9.6%) | 225 (11.8%) |
| 55 to 59 Years | 254 (15.5%) | 144 (7.5%) |
| 60 to 64 Years | 91 (5.5%) | 146 (7.6%) |
| 65 to 69 Years | 152 (9.3%) | 78 (4.1%) |
| 70 to 74 Years | 28 (1.7%) | 31 (1.6%) |
| 75 to 79 Years | 8 (0.5%) | 10 (0.5%) |
| 80 to 84 Years | 54 (3.3%) | 69 (3.6%) |
| 85 Years and over | 47 (2.9%) | 20 (1.1%) |
| Total | 1,642 (100.0%) | 1,909 (100.0%) |
Families and Households in Cambrian Park
Median Family Size in Cambrian Park
The median family size in Cambrian Park is 3.22 persons per family, with single male/father families (20 | 2.1%) accounting for the largest median family size of 3.35 persons per family. On the other hand, single female/mother families (42 | 4.3%) represent the smallest median family size with 2.55 persons per family.
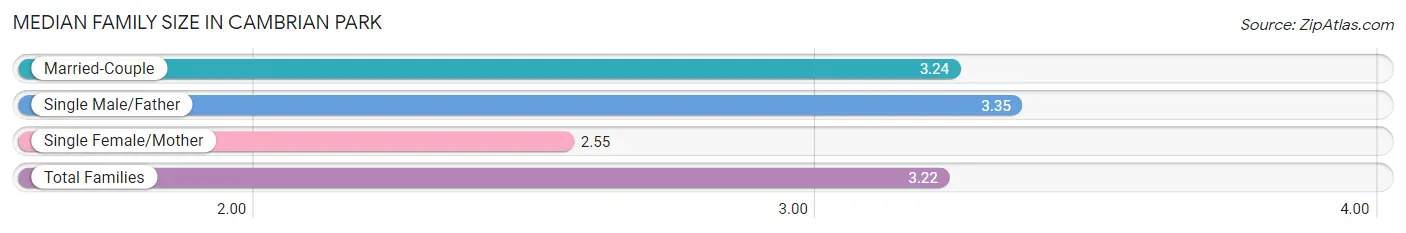
| Family Type | # Families | Family Size |
| Married-Couple | 915 (93.6%) | 3.24 |
| Single Male/Father | 20 (2.1%) | 3.35 |
| Single Female/Mother | 42 (4.3%) | 2.55 |
| Total Families | 977 (100.0%) | 3.22 |
Median Household Size in Cambrian Park
The median household size in Cambrian Park is 2.89 persons per household, with single male/father households (20 | 1.7%) accounting for the largest median household size of 3.35 persons per household. non-family households (233 | 19.3%) represent the smallest median household size with 1.21 persons per household.
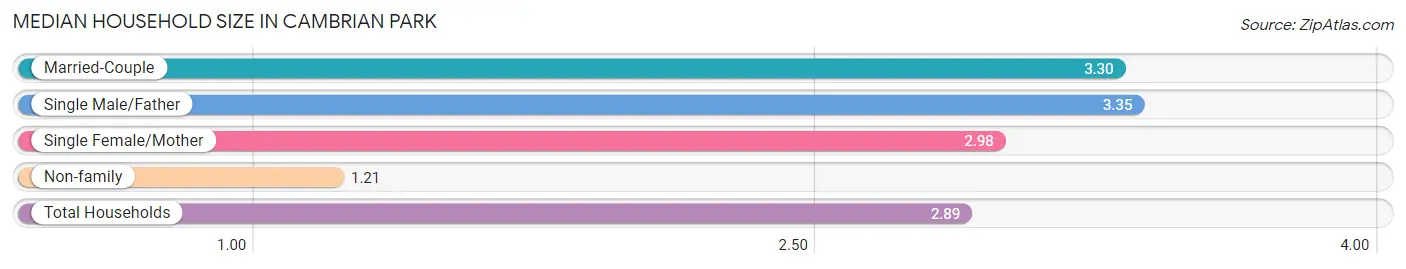
| Household Type | # Households | Household Size |
| Married-Couple | 915 (75.6%) | 3.30 |
| Single Male/Father | 20 (1.7%) | 3.35 |
| Single Female/Mother | 42 (3.5%) | 2.98 |
| Non-family | 233 (19.3%) | 1.21 |
| Total Households | 1,210 (100.0%) | 2.89 |
Household Size by Marriage Status in Cambrian Park
Out of a total of 1,210 households in Cambrian Park, 977 (80.7%) are family households, while 233 (19.3%) are nonfamily households. The most numerous type of family households are 2-person households, comprising 339, and the most common type of nonfamily households are 1-person households, comprising 194.
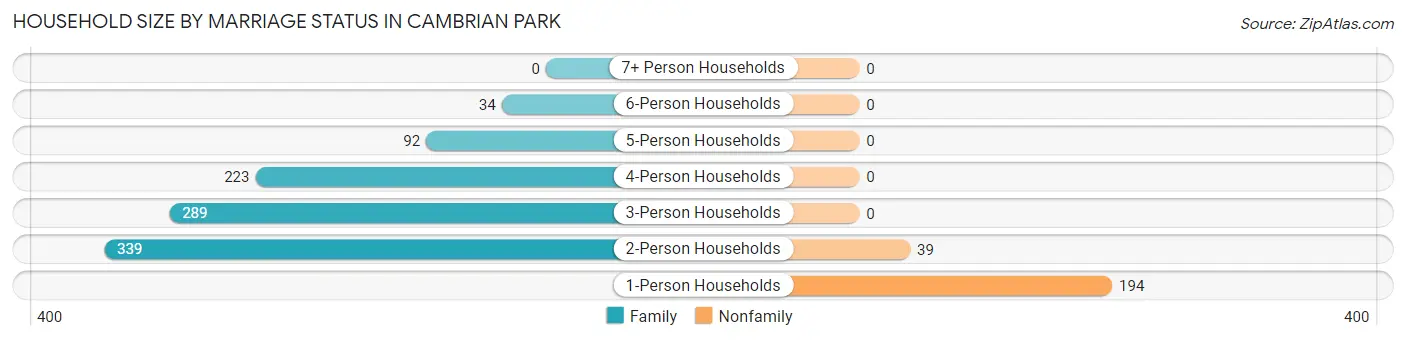
| Household Size | Family Households | Nonfamily Households |
| 1-Person Households | - | 194 (16.0%) |
| 2-Person Households | 339 (28.0%) | 39 (3.2%) |
| 3-Person Households | 289 (23.9%) | 0 (0.0%) |
| 4-Person Households | 223 (18.4%) | 0 (0.0%) |
| 5-Person Households | 92 (7.6%) | 0 (0.0%) |
| 6-Person Households | 34 (2.8%) | 0 (0.0%) |
| 7+ Person Households | 0 (0.0%) | 0 (0.0%) |
| Total | 977 (80.7%) | 233 (19.3%) |
Female Fertility in Cambrian Park
Fertility by Age in Cambrian Park
Average fertility rate in Cambrian Park is 119.0 births per 1,000 women. Women in the age bracket of 20 to 34 years have the highest fertility rate with 180.0 births per 1,000 women. Women in the age bracket of 20 to 34 years acount for 65.3% of all women with births.
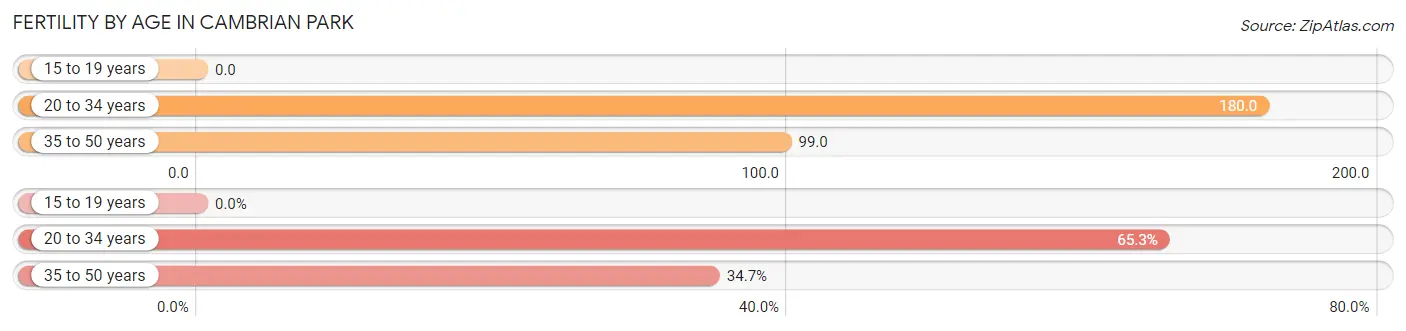
| Age Bracket | Women with Births | Births / 1,000 Women |
| 15 to 19 years | 0 (0.0%) | 0.0 |
| 20 to 34 years | 62 (65.3%) | 180.0 |
| 35 to 50 years | 33 (34.7%) | 99.0 |
| Total | 95 (100.0%) | 119.0 |
Fertility by Age by Marriage Status in Cambrian Park
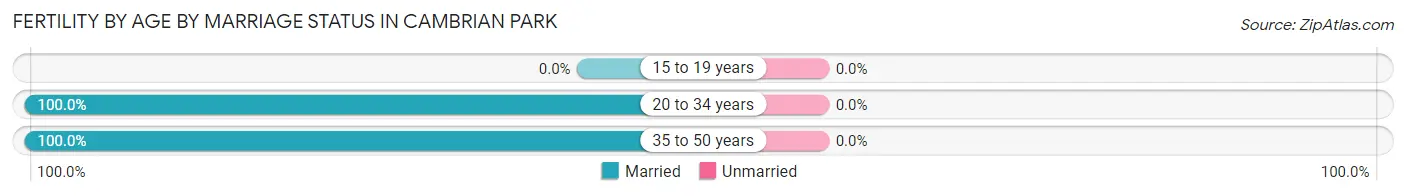
| Age Bracket | Married | Unmarried |
| 15 to 19 years | 0 (0.0%) | 0 (0.0%) |
| 20 to 34 years | 62 (100.0%) | 0 (0.0%) |
| 35 to 50 years | 33 (100.0%) | 0 (0.0%) |
| Total | 95 (100.0%) | 0 (0.0%) |
Fertility by Education in Cambrian Park
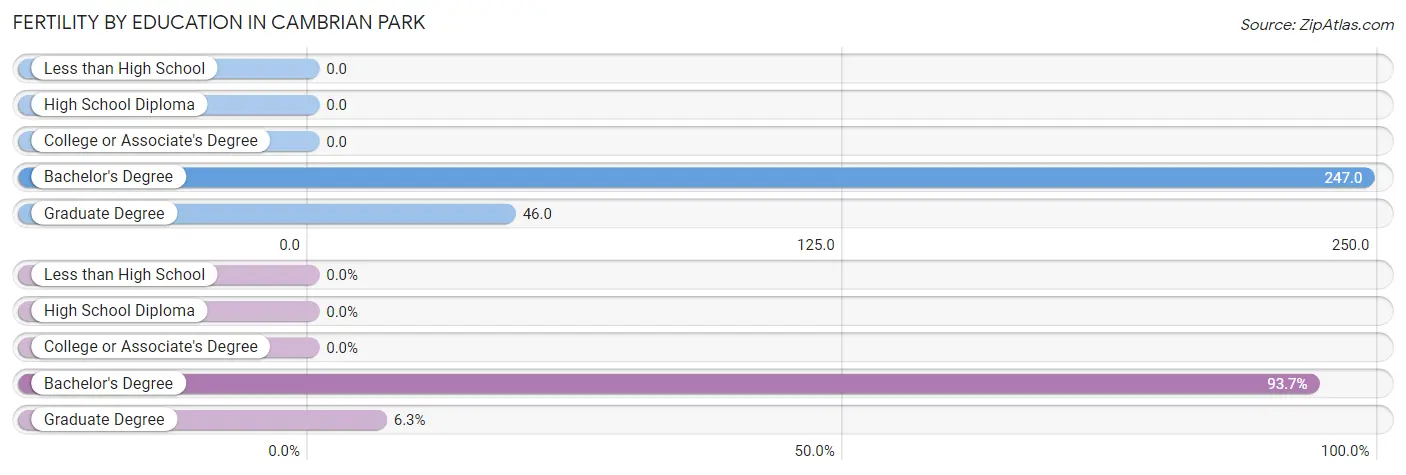
| Educational Attainment | Women with Births | Births / 1,000 Women |
| Less than High School | 0 (0.0%) | 0.0 |
| High School Diploma | 0 (0.0%) | 0.0 |
| College or Associate's Degree | 0 (0.0%) | 0.0 |
| Bachelor's Degree | 89 (93.7%) | 247.0 |
| Graduate Degree | 6 (6.3%) | 46.0 |
| Total | 95 (100.0%) | 119.0 |
Fertility by Education by Marriage Status in Cambrian Park
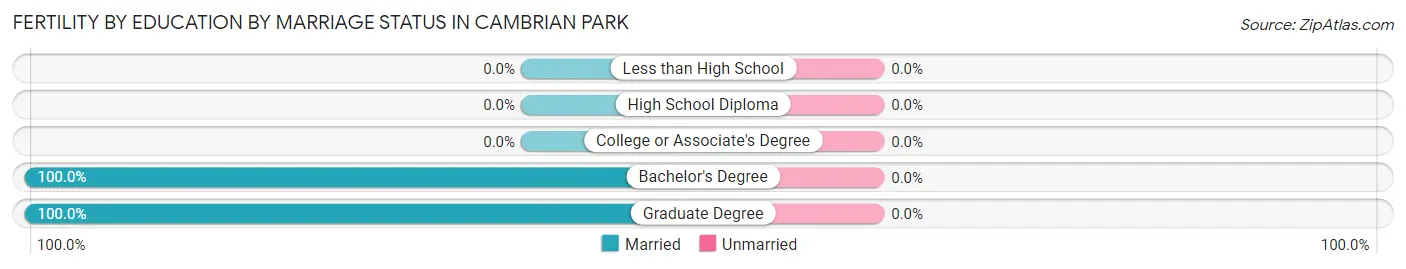
| Educational Attainment | Married | Unmarried |
| Less than High School | 0 (0.0%) | 0 (0.0%) |
| High School Diploma | 0 (0.0%) | 0 (0.0%) |
| College or Associate's Degree | 0 (0.0%) | 0 (0.0%) |
| Bachelor's Degree | 89 (100.0%) | 0 (0.0%) |
| Graduate Degree | 6 (100.0%) | 0 (0.0%) |
| Total | 95 (100.0%) | 0 (0.0%) |
Employment Characteristics in Cambrian Park
Employment by Class of Employer in Cambrian Park
Among the 1,867 employed individuals in Cambrian Park, private company employees (1,319 | 70.7%), self-employed (not incorporated) (154 | 8.3%), and not-for-profit organizations (128 | 6.9%) make up the most common classes of employment.
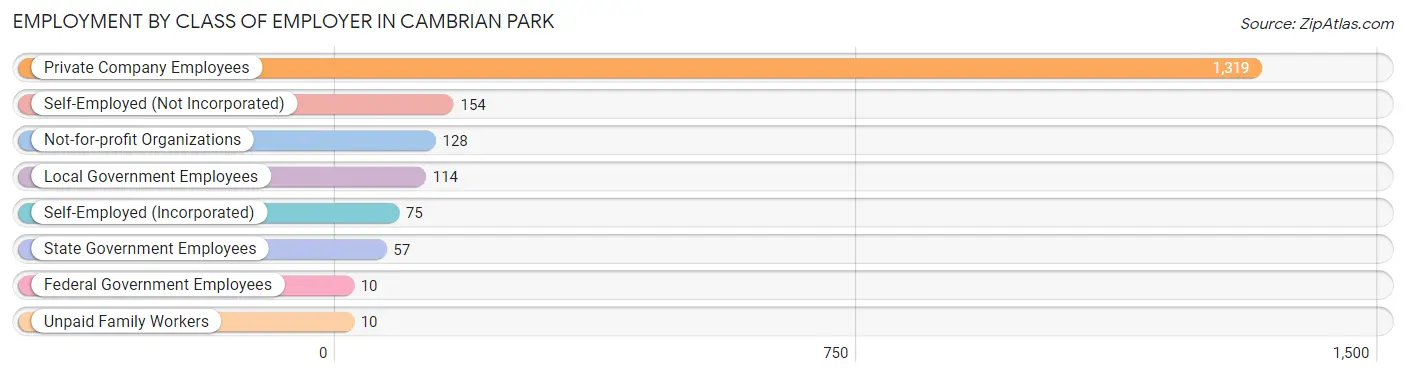
| Employer Class | # Employees | % Employees |
| Private Company Employees | 1,319 | 70.7% |
| Self-Employed (Incorporated) | 75 | 4.0% |
| Self-Employed (Not Incorporated) | 154 | 8.3% |
| Not-for-profit Organizations | 128 | 6.9% |
| Local Government Employees | 114 | 6.1% |
| State Government Employees | 57 | 3.0% |
| Federal Government Employees | 10 | 0.5% |
| Unpaid Family Workers | 10 | 0.5% |
| Total | 1,867 | 100.0% |
Employment Status by Age in Cambrian Park
According to the labor force statistics for Cambrian Park, out of the total population over 16 years of age (2,869), 65.7% or 1,885 individuals are in the labor force, with 0.9% or 17 of them unemployed. The age group with the highest labor force participation rate is 25 to 29 years, with 100.0% or 234 individuals in the labor force. Within the labor force, the 30 to 34 years age range has the highest percentage of unemployed individuals, with 6.2% or 11 of them being unemployed.
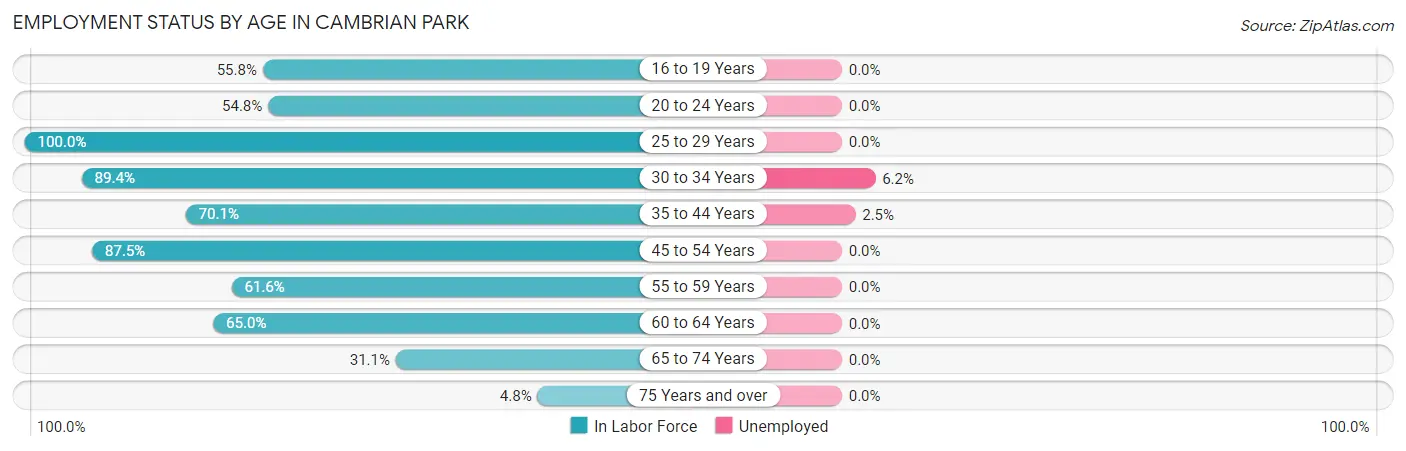
| Age Bracket | In Labor Force | Unemployed |
| 16 to 19 Years | 87 (55.8%) | 0 (0.0%) |
| 20 to 24 Years | 97 (54.8%) | 0 (0.0%) |
| 25 to 29 Years | 234 (100.0%) | 0 (0.0%) |
| 30 to 34 Years | 177 (89.4%) | 11 (6.2%) |
| 35 to 44 Years | 244 (70.1%) | 6 (2.5%) |
| 45 to 54 Years | 546 (87.5%) | 0 (0.0%) |
| 55 to 59 Years | 245 (61.6%) | 0 (0.0%) |
| 60 to 64 Years | 154 (65.0%) | 0 (0.0%) |
| 65 to 74 Years | 90 (31.1%) | 0 (0.0%) |
| 75 Years and over | 10 (4.8%) | 0 (0.0%) |
| Total | 1,885 (65.7%) | 17 (0.9%) |
Employment Status by Educational Attainment in Cambrian Park
According to labor force statistics for Cambrian Park, 78.5% of individuals (1,601) out of the total population between 25 and 64 years of age (2,039) are in the labor force, with 1.1% or 18 of them being unemployed. The group with the highest labor force participation rate are those with the educational attainment of high school diploma, with 90.4% or 123 individuals in the labor force. Within the labor force, individuals with bachelor's degree or higher education have the highest percentage of unemployment, with 1.5% or 17 of them being unemployed.
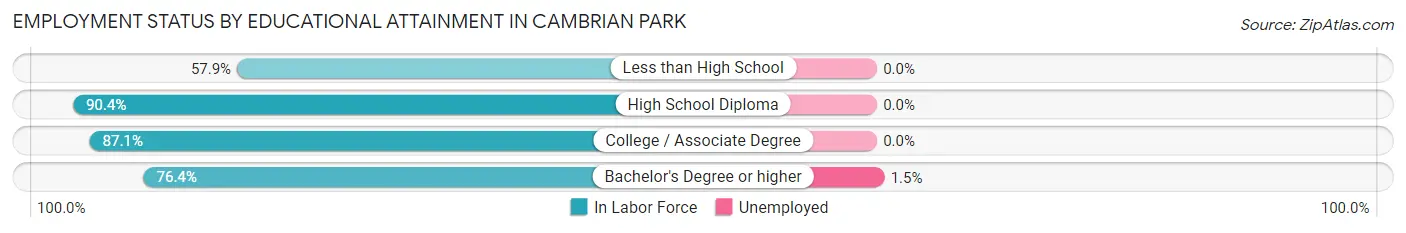
| Educational Attainment | In Labor Force | Unemployed |
| Less than High School | 44 (57.9%) | 0 (0.0%) |
| High School Diploma | 123 (90.4%) | 0 (0.0%) |
| College / Associate Degree | 297 (87.1%) | 0 (0.0%) |
| Bachelor's Degree or higher | 1,135 (76.4%) | 22 (1.5%) |
| Total | 1,601 (78.5%) | 22 (1.1%) |
Employment Occupations by Sex in Cambrian Park
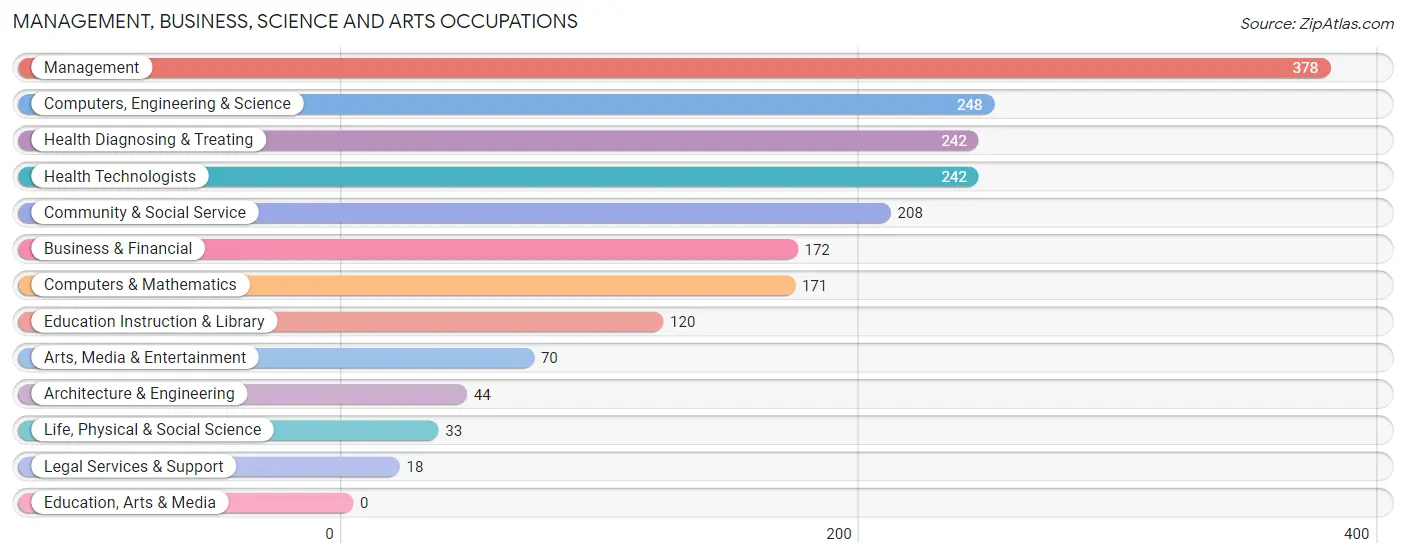
Management, Business, Science and Arts Occupations
The most common Management, Business, Science and Arts occupations in Cambrian Park are Management (378 | 20.3%), Computers, Engineering & Science (248 | 13.3%), Health Diagnosing & Treating (242 | 13.0%), Health Technologists (242 | 13.0%), and Community & Social Service (208 | 11.1%).
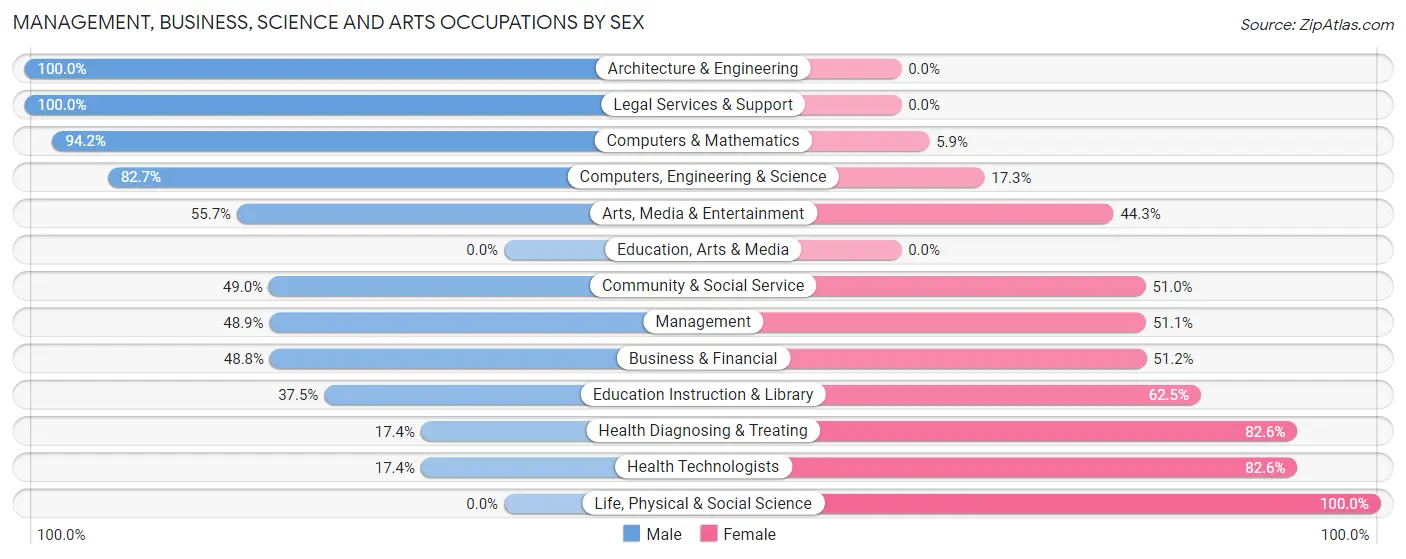
Management, Business, Science and Arts Occupations by Sex
Within the Management, Business, Science and Arts occupations in Cambrian Park, the most male-oriented occupations are Architecture & Engineering (100.0%), Legal Services & Support (100.0%), and Computers & Mathematics (94.2%), while the most female-oriented occupations are Life, Physical & Social Science (100.0%), Health Diagnosing & Treating (82.6%), and Health Technologists (82.6%).
| Occupation | Male | Female |
| Management | 185 (48.9%) | 193 (51.1%) |
| Business & Financial | 84 (48.8%) | 88 (51.2%) |
| Computers, Engineering & Science | 205 (82.7%) | 43 (17.3%) |
| Computers & Mathematics | 161 (94.2%) | 10 (5.9%) |
| Architecture & Engineering | 44 (100.0%) | 0 (0.0%) |
| Life, Physical & Social Science | 0 (0.0%) | 33 (100.0%) |
| Community & Social Service | 102 (49.0%) | 106 (51.0%) |
| Education, Arts & Media | 0 (0.0%) | 0 (0.0%) |
| Legal Services & Support | 18 (100.0%) | 0 (0.0%) |
| Education Instruction & Library | 45 (37.5%) | 75 (62.5%) |
| Arts, Media & Entertainment | 39 (55.7%) | 31 (44.3%) |
| Health Diagnosing & Treating | 42 (17.4%) | 200 (82.6%) |
| Health Technologists | 42 (17.4%) | 200 (82.6%) |
| Total (Category) | 618 (49.5%) | 630 (50.5%) |
| Total (Overall) | 944 (50.6%) | 923 (49.4%) |
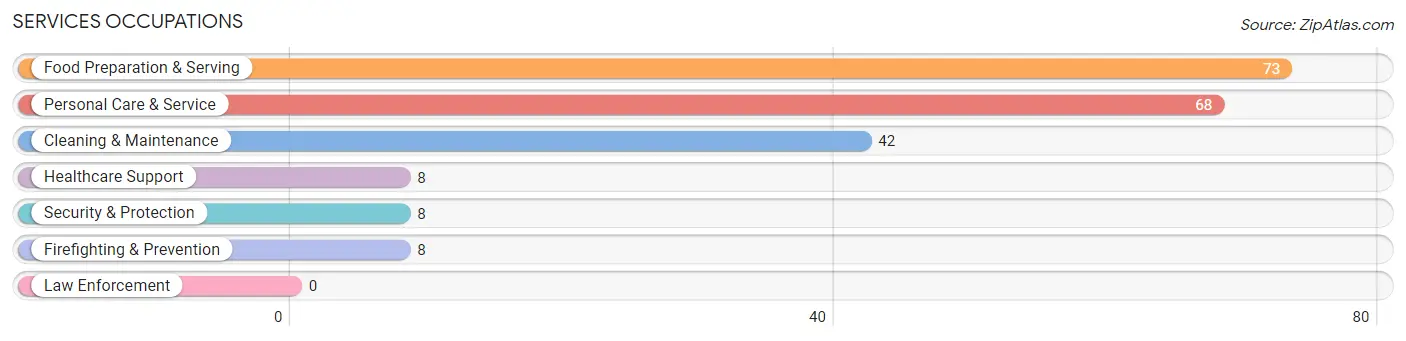
Services Occupations
The most common Services occupations in Cambrian Park are Food Preparation & Serving (73 | 3.9%), Personal Care & Service (68 | 3.6%), Cleaning & Maintenance (42 | 2.2%), Healthcare Support (8 | 0.4%), and Security & Protection (8 | 0.4%).
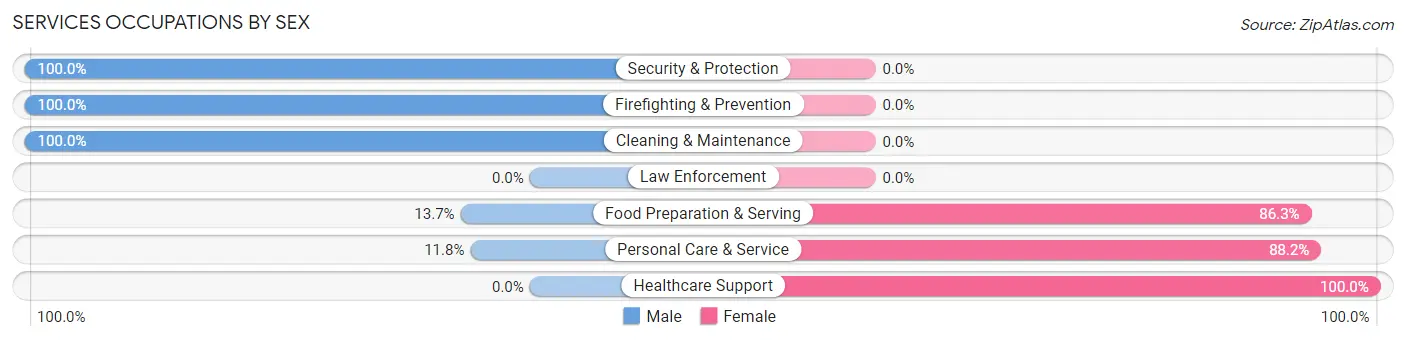
Services Occupations by Sex
Within the Services occupations in Cambrian Park, the most male-oriented occupations are Security & Protection (100.0%), Firefighting & Prevention (100.0%), and Cleaning & Maintenance (100.0%), while the most female-oriented occupations are Healthcare Support (100.0%), Personal Care & Service (88.2%), and Food Preparation & Serving (86.3%).
| Occupation | Male | Female |
| Healthcare Support | 0 (0.0%) | 8 (100.0%) |
| Security & Protection | 8 (100.0%) | 0 (0.0%) |
| Firefighting & Prevention | 8 (100.0%) | 0 (0.0%) |
| Law Enforcement | 0 (0.0%) | 0 (0.0%) |
| Food Preparation & Serving | 10 (13.7%) | 63 (86.3%) |
| Cleaning & Maintenance | 42 (100.0%) | 0 (0.0%) |
| Personal Care & Service | 8 (11.8%) | 60 (88.2%) |
| Total (Category) | 68 (34.2%) | 131 (65.8%) |
| Total (Overall) | 944 (50.6%) | 923 (49.4%) |
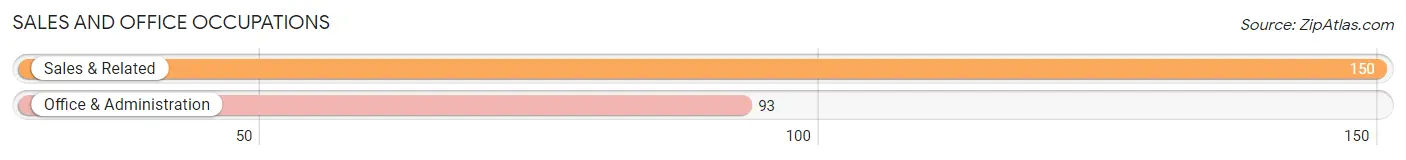
Sales and Office Occupations
The most common Sales and Office occupations in Cambrian Park are Sales & Related (150 | 8.0%), and Office & Administration (93 | 5.0%).
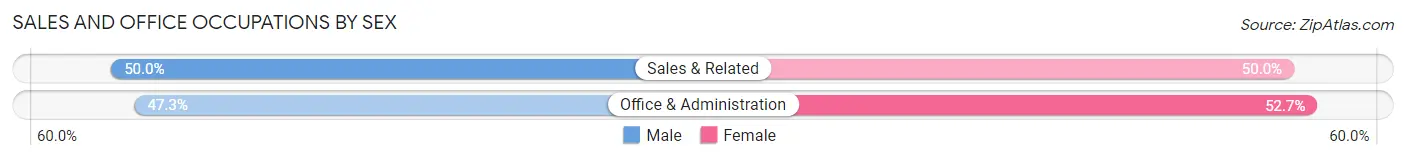
Sales and Office Occupations by Sex
| Occupation | Male | Female |
| Sales & Related | 75 (50.0%) | 75 (50.0%) |
| Office & Administration | 44 (47.3%) | 49 (52.7%) |
| Total (Category) | 119 (49.0%) | 124 (51.0%) |
| Total (Overall) | 944 (50.6%) | 923 (49.4%) |
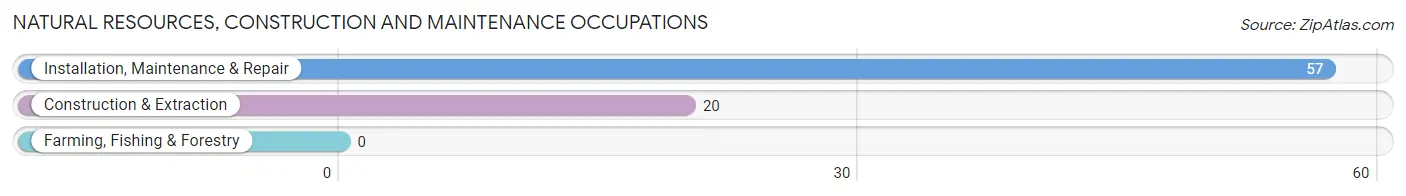
Natural Resources, Construction and Maintenance Occupations
The most common Natural Resources, Construction and Maintenance occupations in Cambrian Park are Installation, Maintenance & Repair (57 | 3.0%), and Construction & Extraction (20 | 1.1%).
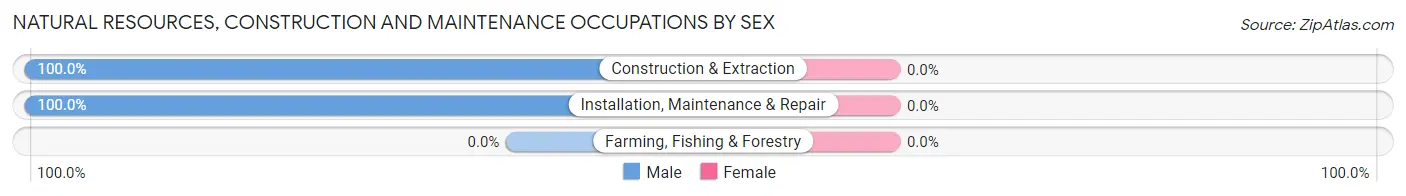
Natural Resources, Construction and Maintenance Occupations by Sex
| Occupation | Male | Female |
| Farming, Fishing & Forestry | 0 (0.0%) | 0 (0.0%) |
| Construction & Extraction | 20 (100.0%) | 0 (0.0%) |
| Installation, Maintenance & Repair | 57 (100.0%) | 0 (0.0%) |
| Total (Category) | 77 (100.0%) | 0 (0.0%) |
| Total (Overall) | 944 (50.6%) | 923 (49.4%) |
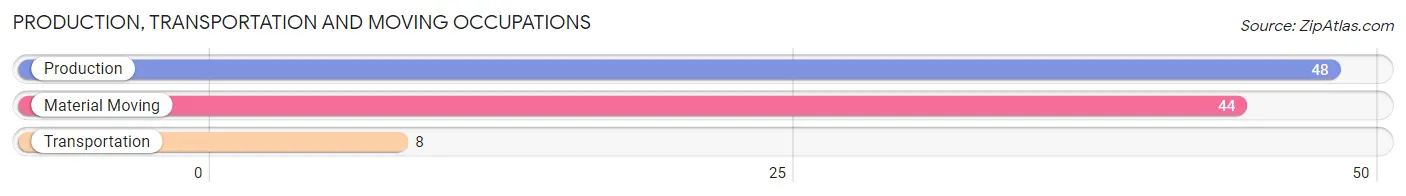
Production, Transportation and Moving Occupations
The most common Production, Transportation and Moving occupations in Cambrian Park are Production (48 | 2.6%), Material Moving (44 | 2.4%), and Transportation (8 | 0.4%).
Production, Transportation and Moving Occupations by Sex
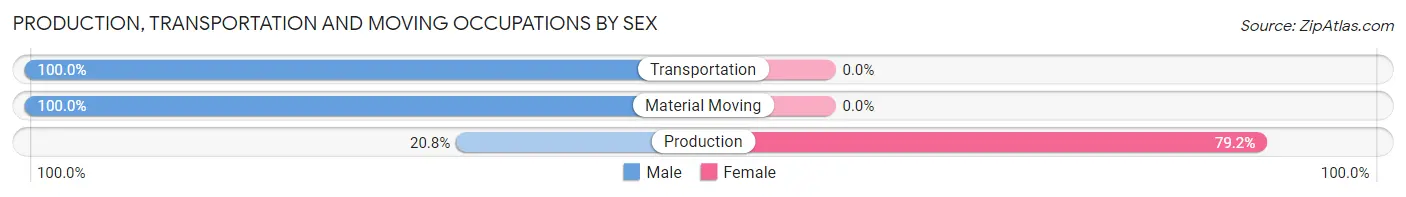
| Occupation | Male | Female |
| Production | 10 (20.8%) | 38 (79.2%) |
| Transportation | 8 (100.0%) | 0 (0.0%) |
| Material Moving | 44 (100.0%) | 0 (0.0%) |
| Total (Category) | 62 (62.0%) | 38 (38.0%) |
| Total (Overall) | 944 (50.6%) | 923 (49.4%) |
Employment Industries by Sex in Cambrian Park
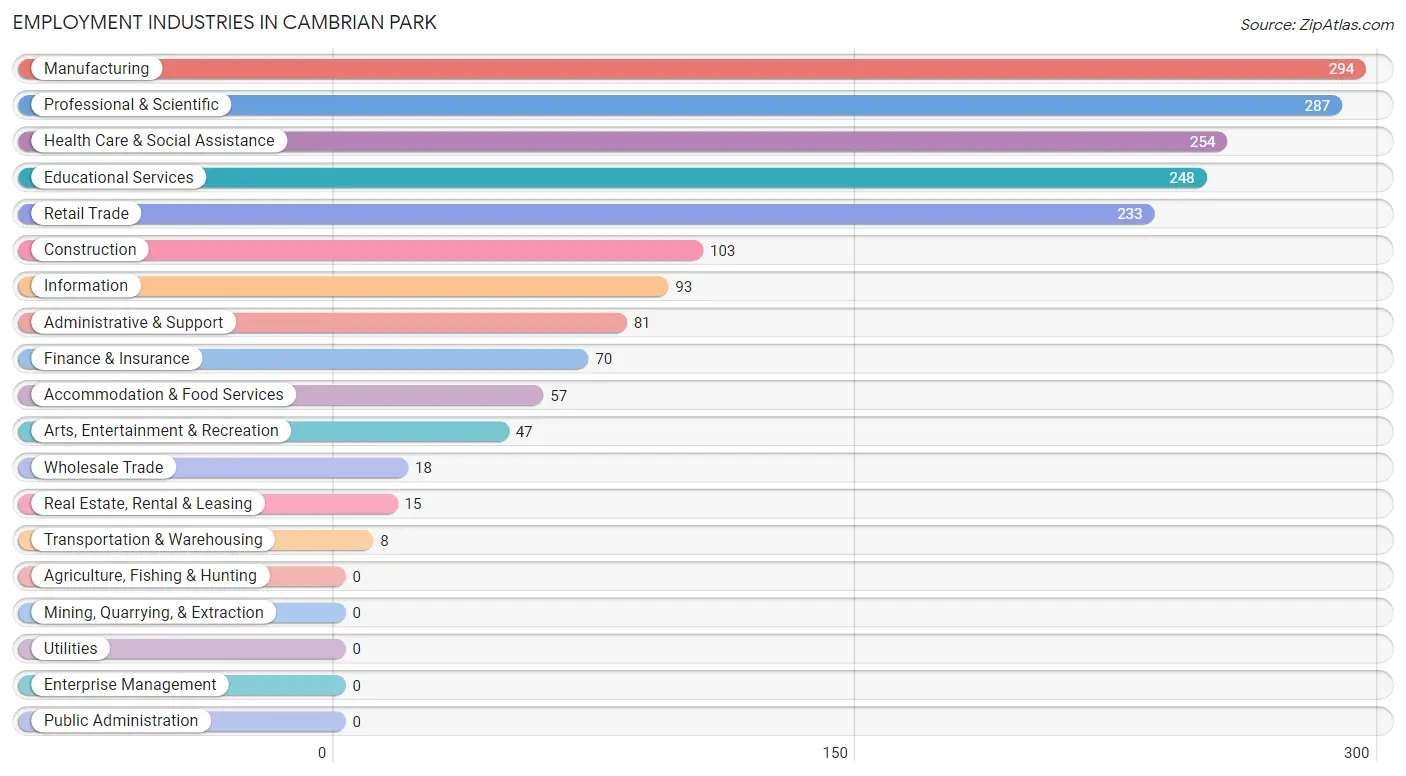
Employment Industries in Cambrian Park
The major employment industries in Cambrian Park include Manufacturing (294 | 15.8%), Professional & Scientific (287 | 15.4%), Health Care & Social Assistance (254 | 13.6%), Educational Services (248 | 13.3%), and Retail Trade (233 | 12.5%).
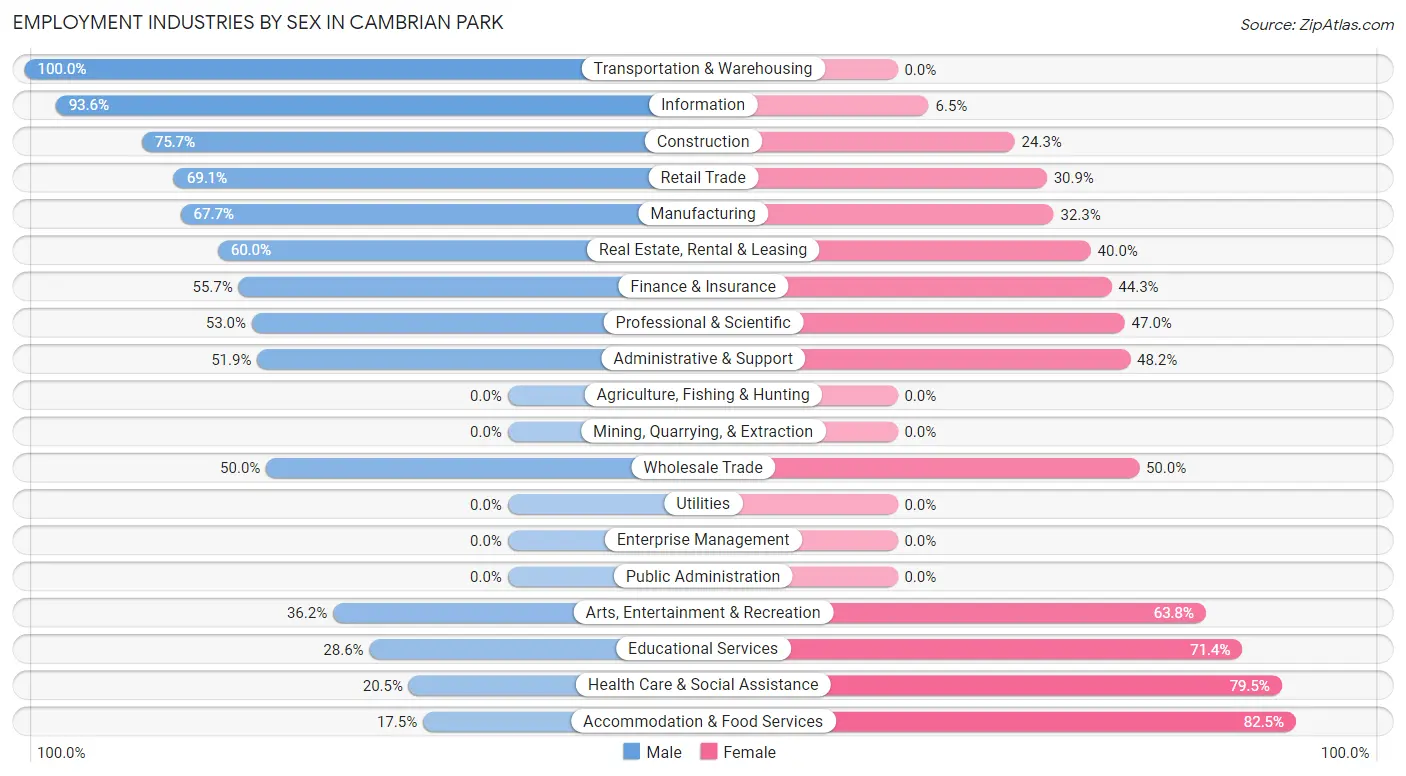
Employment Industries by Sex in Cambrian Park
The Cambrian Park industries that see more men than women are Transportation & Warehousing (100.0%), Information (93.5%), and Construction (75.7%), whereas the industries that tend to have a higher number of women are Accommodation & Food Services (82.5%), Health Care & Social Assistance (79.5%), and Educational Services (71.4%).
| Industry | Male | Female |
| Agriculture, Fishing & Hunting | 0 (0.0%) | 0 (0.0%) |
| Mining, Quarrying, & Extraction | 0 (0.0%) | 0 (0.0%) |
| Construction | 78 (75.7%) | 25 (24.3%) |
| Manufacturing | 199 (67.7%) | 95 (32.3%) |
| Wholesale Trade | 9 (50.0%) | 9 (50.0%) |
| Retail Trade | 161 (69.1%) | 72 (30.9%) |
| Transportation & Warehousing | 8 (100.0%) | 0 (0.0%) |
| Utilities | 0 (0.0%) | 0 (0.0%) |
| Information | 87 (93.5%) | 6 (6.5%) |
| Finance & Insurance | 39 (55.7%) | 31 (44.3%) |
| Real Estate, Rental & Leasing | 9 (60.0%) | 6 (40.0%) |
| Professional & Scientific | 152 (53.0%) | 135 (47.0%) |
| Enterprise Management | 0 (0.0%) | 0 (0.0%) |
| Administrative & Support | 42 (51.8%) | 39 (48.1%) |
| Educational Services | 71 (28.6%) | 177 (71.4%) |
| Health Care & Social Assistance | 52 (20.5%) | 202 (79.5%) |
| Arts, Entertainment & Recreation | 17 (36.2%) | 30 (63.8%) |
| Accommodation & Food Services | 10 (17.5%) | 47 (82.5%) |
| Public Administration | 0 (0.0%) | 0 (0.0%) |
| Total | 944 (50.6%) | 923 (49.4%) |
Education in Cambrian Park
School Enrollment in Cambrian Park
The most common levels of schooling among the 896 students in Cambrian Park are high school (193 | 21.5%), college / undergraduate (191 | 21.3%), and middle school (133 | 14.8%).
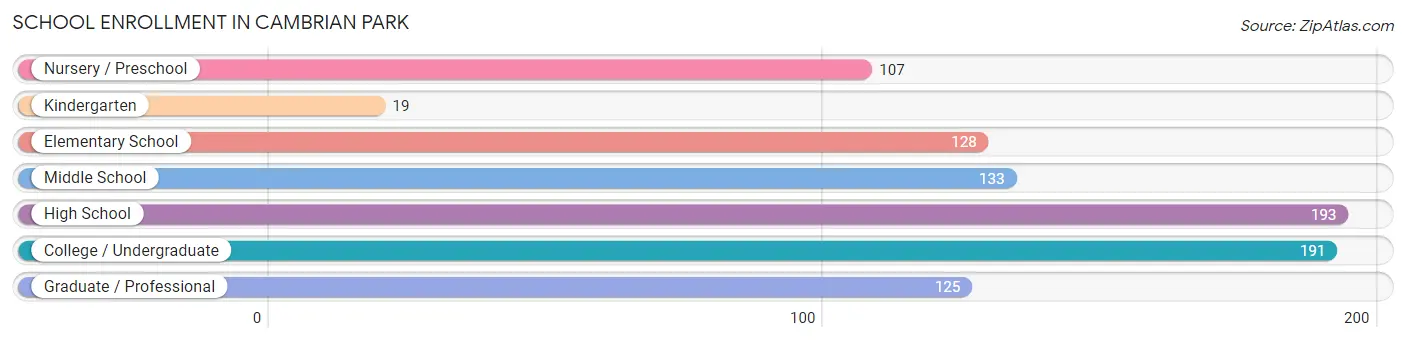
| School Level | # Students | % Students |
| Nursery / Preschool | 107 | 11.9% |
| Kindergarten | 19 | 2.1% |
| Elementary School | 128 | 14.3% |
| Middle School | 133 | 14.8% |
| High School | 193 | 21.5% |
| College / Undergraduate | 191 | 21.3% |
| Graduate / Professional | 125 | 14.0% |
| Total | 896 | 100.0% |
School Enrollment by Age by Funding Source in Cambrian Park
Out of a total of 896 students who are enrolled in schools in Cambrian Park, 393 (43.9%) attend a private institution, while the remaining 503 (56.1%) are enrolled in public schools. The age group of 3 to 4 year olds has the highest likelihood of being enrolled in private schools, with 91 (100.0% in the age bracket) enrolled. Conversely, the age group of 20 to 24 year olds has the lowest likelihood of being enrolled in a private school, with 132 (100.0% in the age bracket) attending a public institution.
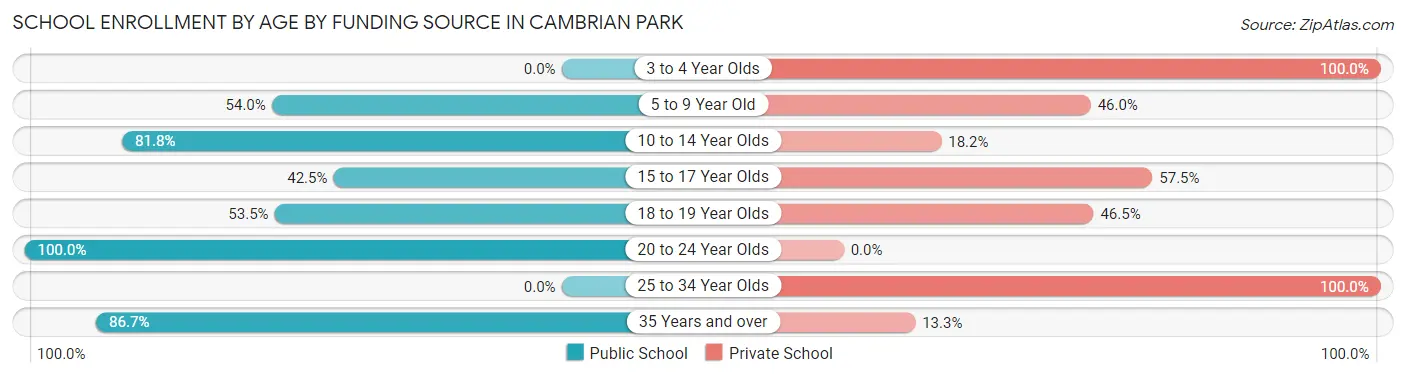
| Age Bracket | Public School | Private School |
| 3 to 4 Year Olds | 0 (0.0%) | 91 (100.0%) |
| 5 to 9 Year Old | 88 (54.0%) | 75 (46.0%) |
| 10 to 14 Year Olds | 126 (81.8%) | 28 (18.2%) |
| 15 to 17 Year Olds | 51 (42.5%) | 69 (57.5%) |
| 18 to 19 Year Olds | 54 (53.5%) | 47 (46.5%) |
| 20 to 24 Year Olds | 132 (100.0%) | 0 (0.0%) |
| 25 to 34 Year Olds | 0 (0.0%) | 75 (100.0%) |
| 35 Years and over | 52 (86.7%) | 8 (13.3%) |
| Total | 503 (56.1%) | 393 (43.9%) |
Educational Attainment by Field of Study in Cambrian Park
Science & technology (406 | 23.6%), business (259 | 15.0%), engineering (240 | 14.0%), social sciences (147 | 8.5%), and computers & mathematics (109 | 6.3%) are the most common fields of study among 1,721 individuals in Cambrian Park who have obtained a bachelor's degree or higher.
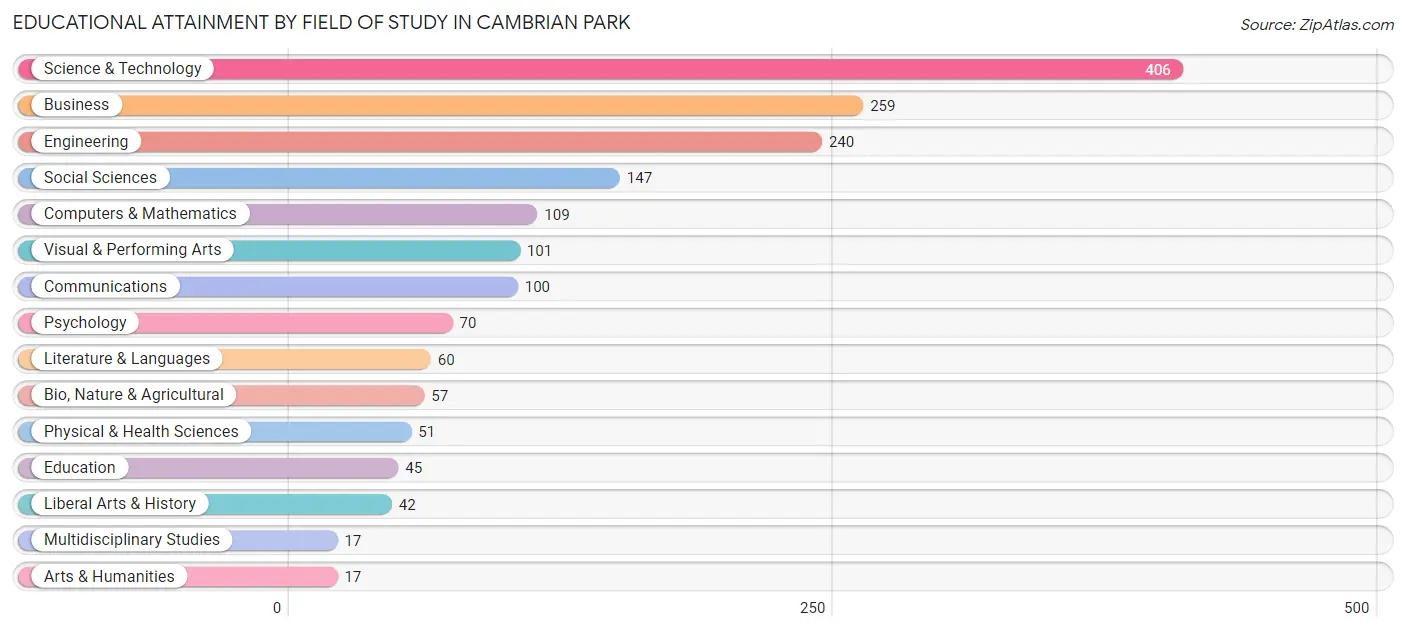
| Field of Study | # Graduates | % Graduates |
| Computers & Mathematics | 109 | 6.3% |
| Bio, Nature & Agricultural | 57 | 3.3% |
| Physical & Health Sciences | 51 | 3.0% |
| Psychology | 70 | 4.1% |
| Social Sciences | 147 | 8.5% |
| Engineering | 240 | 14.0% |
| Multidisciplinary Studies | 17 | 1.0% |
| Science & Technology | 406 | 23.6% |
| Business | 259 | 15.0% |
| Education | 45 | 2.6% |
| Literature & Languages | 60 | 3.5% |
| Liberal Arts & History | 42 | 2.4% |
| Visual & Performing Arts | 101 | 5.9% |
| Communications | 100 | 5.8% |
| Arts & Humanities | 17 | 1.0% |
| Total | 1,721 | 100.0% |
Transportation & Commute in Cambrian Park
Vehicle Availability by Sex in Cambrian Park
The most prevalent vehicle ownership categories in Cambrian Park are males with 2 vehicles (415, accounting for 44.0%) and females with 2 vehicles (357, making up 45.0%).
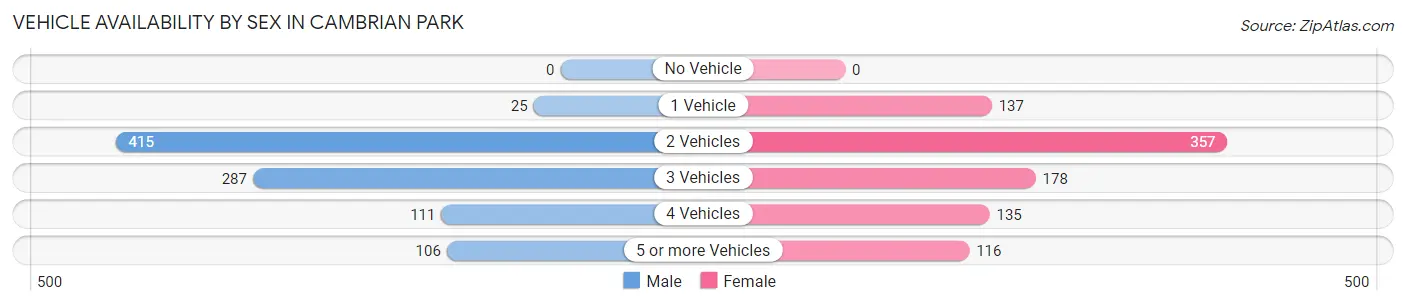
| Vehicles Available | Male | Female |
| No Vehicle | 0 (0.0%) | 0 (0.0%) |
| 1 Vehicle | 25 (2.6%) | 137 (14.8%) |
| 2 Vehicles | 415 (44.0%) | 357 (38.7%) |
| 3 Vehicles | 287 (30.4%) | 178 (19.3%) |
| 4 Vehicles | 111 (11.8%) | 135 (14.6%) |
| 5 or more Vehicles | 106 (11.2%) | 116 (12.6%) |
| Total | 944 (100.0%) | 923 (100.0%) |
Commute Time in Cambrian Park
The most frequently occuring commute durations in Cambrian Park are 10 to 14 minutes (327 commuters, 21.0%), 25 to 29 minutes (179 commuters, 11.5%), and 60 to 89 minutes (177 commuters, 11.4%).
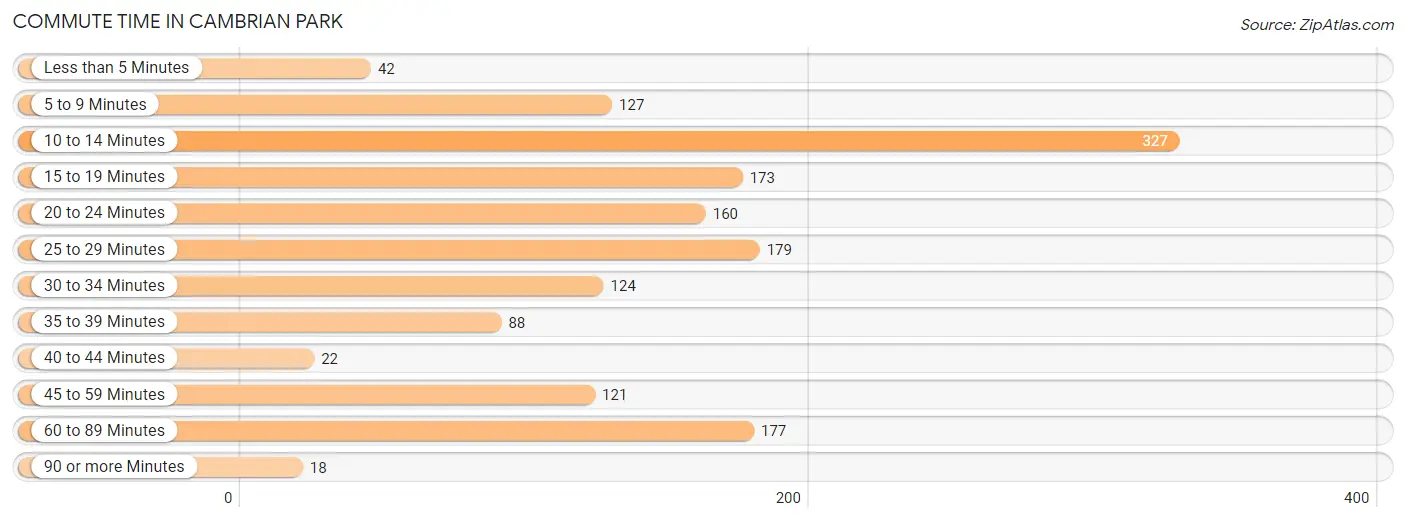
| Commute Time | # Commuters | % Commuters |
| Less than 5 Minutes | 42 | 2.7% |
| 5 to 9 Minutes | 127 | 8.2% |
| 10 to 14 Minutes | 327 | 21.0% |
| 15 to 19 Minutes | 173 | 11.1% |
| 20 to 24 Minutes | 160 | 10.3% |
| 25 to 29 Minutes | 179 | 11.5% |
| 30 to 34 Minutes | 124 | 8.0% |
| 35 to 39 Minutes | 88 | 5.7% |
| 40 to 44 Minutes | 22 | 1.4% |
| 45 to 59 Minutes | 121 | 7.8% |
| 60 to 89 Minutes | 177 | 11.4% |
| 90 or more Minutes | 18 | 1.2% |
Commute Time by Sex in Cambrian Park
The most common commute times in Cambrian Park are 15 to 19 minutes (155 commuters, 19.8%) for males and 10 to 14 minutes (226 commuters, 29.2%) for females.
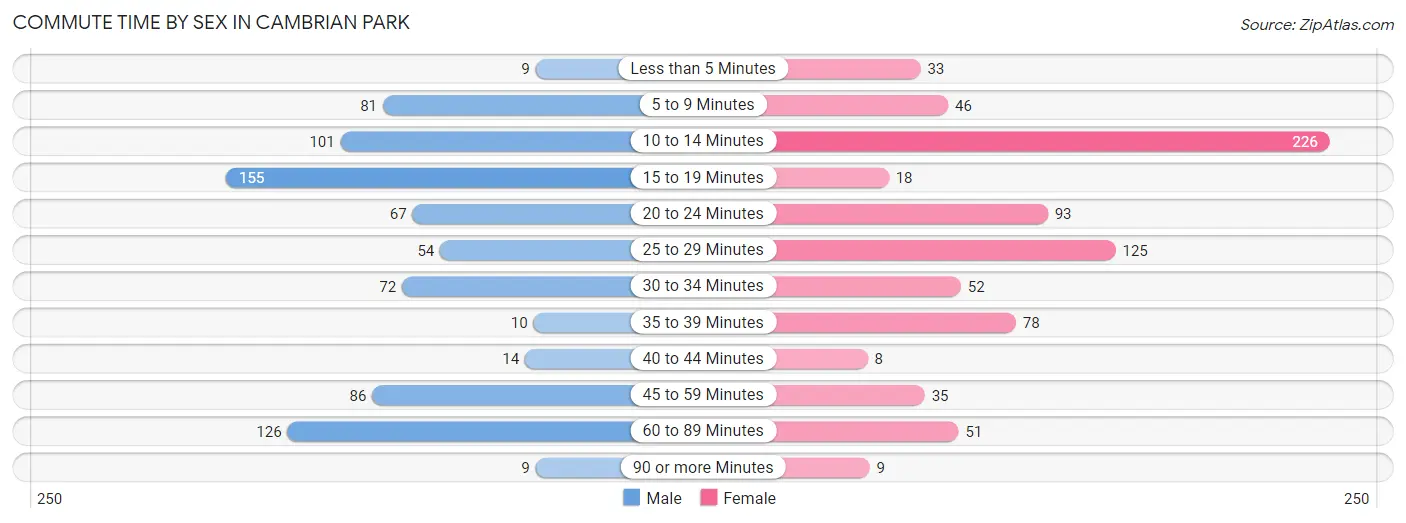
| Commute Time | Male | Female |
| Less than 5 Minutes | 9 (1.1%) | 33 (4.3%) |
| 5 to 9 Minutes | 81 (10.3%) | 46 (5.9%) |
| 10 to 14 Minutes | 101 (12.9%) | 226 (29.2%) |
| 15 to 19 Minutes | 155 (19.8%) | 18 (2.3%) |
| 20 to 24 Minutes | 67 (8.6%) | 93 (12.0%) |
| 25 to 29 Minutes | 54 (6.9%) | 125 (16.2%) |
| 30 to 34 Minutes | 72 (9.2%) | 52 (6.7%) |
| 35 to 39 Minutes | 10 (1.3%) | 78 (10.1%) |
| 40 to 44 Minutes | 14 (1.8%) | 8 (1.0%) |
| 45 to 59 Minutes | 86 (11.0%) | 35 (4.5%) |
| 60 to 89 Minutes | 126 (16.1%) | 51 (6.6%) |
| 90 or more Minutes | 9 (1.1%) | 9 (1.2%) |
Time of Departure to Work by Sex in Cambrian Park
The most frequent times of departure to work in Cambrian Park are 8:00 AM to 8:29 AM (146, 18.6%) for males and 7:00 AM to 7:29 AM (179, 23.1%) for females.
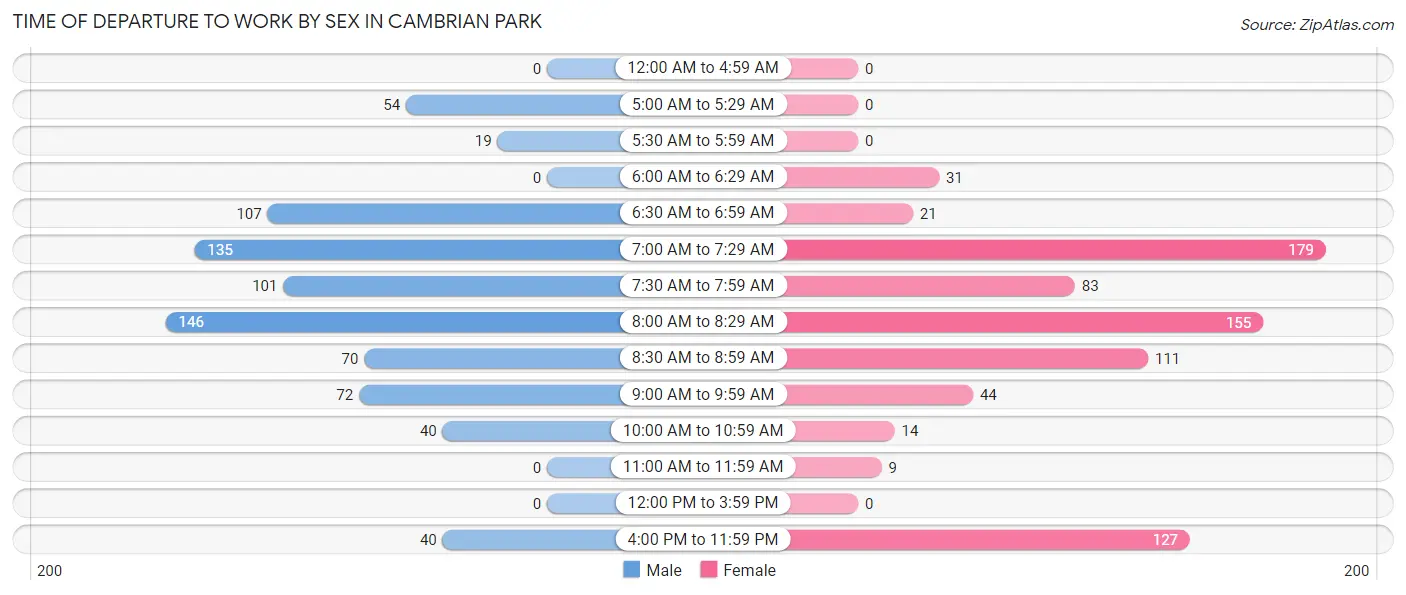
| Time of Departure | Male | Female |
| 12:00 AM to 4:59 AM | 0 (0.0%) | 0 (0.0%) |
| 5:00 AM to 5:29 AM | 54 (6.9%) | 0 (0.0%) |
| 5:30 AM to 5:59 AM | 19 (2.4%) | 0 (0.0%) |
| 6:00 AM to 6:29 AM | 0 (0.0%) | 31 (4.0%) |
| 6:30 AM to 6:59 AM | 107 (13.7%) | 21 (2.7%) |
| 7:00 AM to 7:29 AM | 135 (17.2%) | 179 (23.1%) |
| 7:30 AM to 7:59 AM | 101 (12.9%) | 83 (10.7%) |
| 8:00 AM to 8:29 AM | 146 (18.6%) | 155 (20.0%) |
| 8:30 AM to 8:59 AM | 70 (8.9%) | 111 (14.3%) |
| 9:00 AM to 9:59 AM | 72 (9.2%) | 44 (5.7%) |
| 10:00 AM to 10:59 AM | 40 (5.1%) | 14 (1.8%) |
| 11:00 AM to 11:59 AM | 0 (0.0%) | 9 (1.2%) |
| 12:00 PM to 3:59 PM | 0 (0.0%) | 0 (0.0%) |
| 4:00 PM to 11:59 PM | 40 (5.1%) | 127 (16.4%) |
| Total | 784 (100.0%) | 774 (100.0%) |
Housing Occupancy in Cambrian Park
Occupancy by Ownership in Cambrian Park
Of the total 1,210 dwellings in Cambrian Park, owner-occupied units account for 872 (72.1%), while renter-occupied units make up 338 (27.9%).
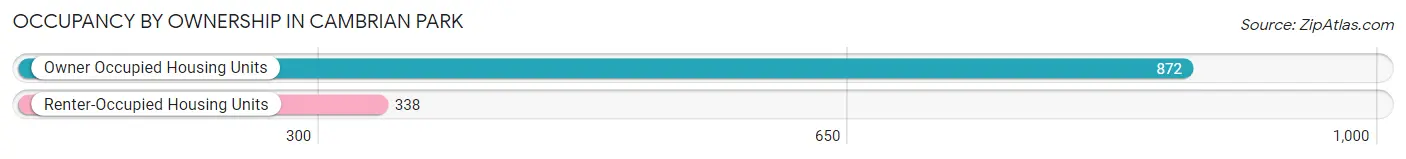
| Occupancy | # Housing Units | % Housing Units |
| Owner Occupied Housing Units | 872 | 72.1% |
| Renter-Occupied Housing Units | 338 | 27.9% |
| Total Occupied Housing Units | 1,210 | 100.0% |
Occupancy by Household Size in Cambrian Park
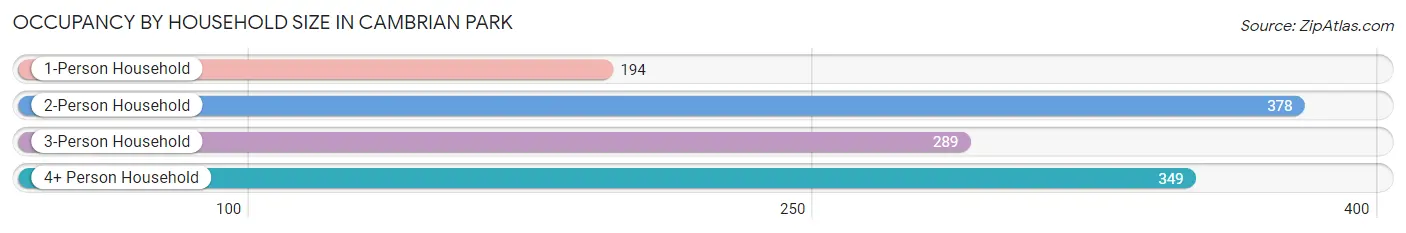
| Household Size | # Housing Units | % Housing Units |
| 1-Person Household | 194 | 16.0% |
| 2-Person Household | 378 | 31.2% |
| 3-Person Household | 289 | 23.9% |
| 4+ Person Household | 349 | 28.8% |
| Total Housing Units | 1,210 | 100.0% |
Occupancy by Ownership by Household Size in Cambrian Park
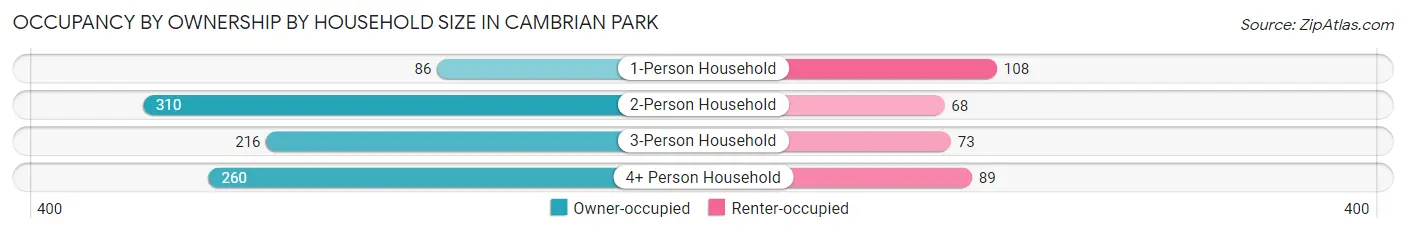
| Household Size | Owner-occupied | Renter-occupied |
| 1-Person Household | 86 (44.3%) | 108 (55.7%) |
| 2-Person Household | 310 (82.0%) | 68 (18.0%) |
| 3-Person Household | 216 (74.7%) | 73 (25.3%) |
| 4+ Person Household | 260 (74.5%) | 89 (25.5%) |
| Total Housing Units | 872 (72.1%) | 338 (27.9%) |
Occupancy by Educational Attainment in Cambrian Park
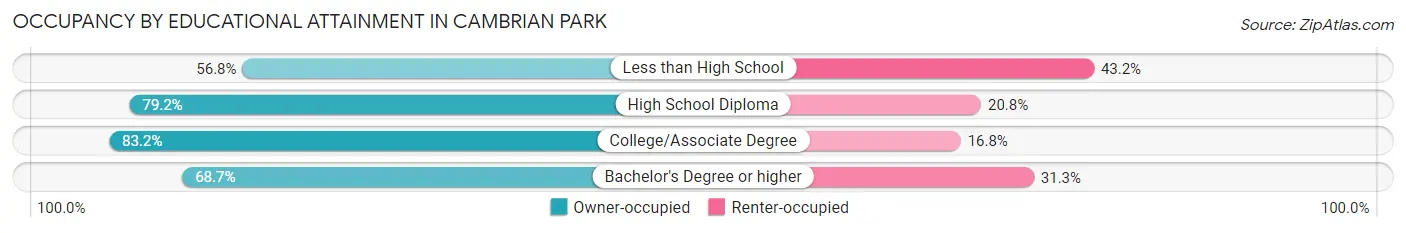
| Household Size | Owner-occupied | Renter-occupied |
| Less than High School | 25 (56.8%) | 19 (43.2%) |
| High School Diploma | 141 (79.2%) | 37 (20.8%) |
| College/Associate Degree | 154 (83.2%) | 31 (16.8%) |
| Bachelor's Degree or higher | 552 (68.7%) | 251 (31.3%) |
Occupancy by Age of Householder in Cambrian Park
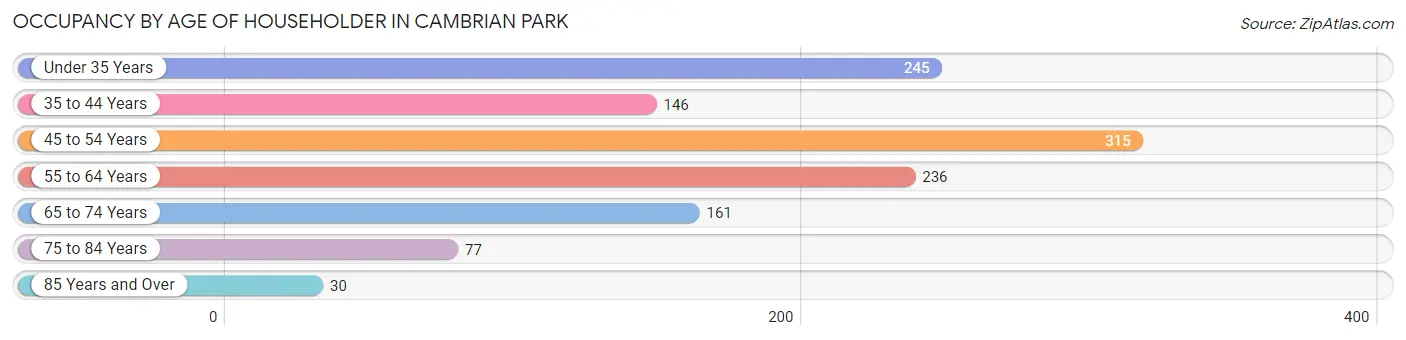
| Age Bracket | # Households | % Households |
| Under 35 Years | 245 | 20.3% |
| 35 to 44 Years | 146 | 12.1% |
| 45 to 54 Years | 315 | 26.0% |
| 55 to 64 Years | 236 | 19.5% |
| 65 to 74 Years | 161 | 13.3% |
| 75 to 84 Years | 77 | 6.4% |
| 85 Years and Over | 30 | 2.5% |
| Total | 1,210 | 100.0% |
Housing Finances in Cambrian Park
Median Income by Occupancy in Cambrian Park
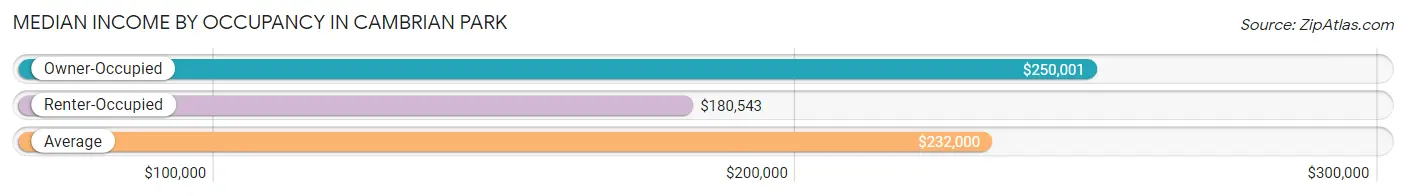
| Occupancy Type | # Households | Median Income |
| Owner-Occupied | 872 (72.1%) | $250,001 |
| Renter-Occupied | 338 (27.9%) | $180,543 |
| Average | 1,210 (100.0%) | $232,000 |
Occupancy by Householder Income Bracket in Cambrian Park
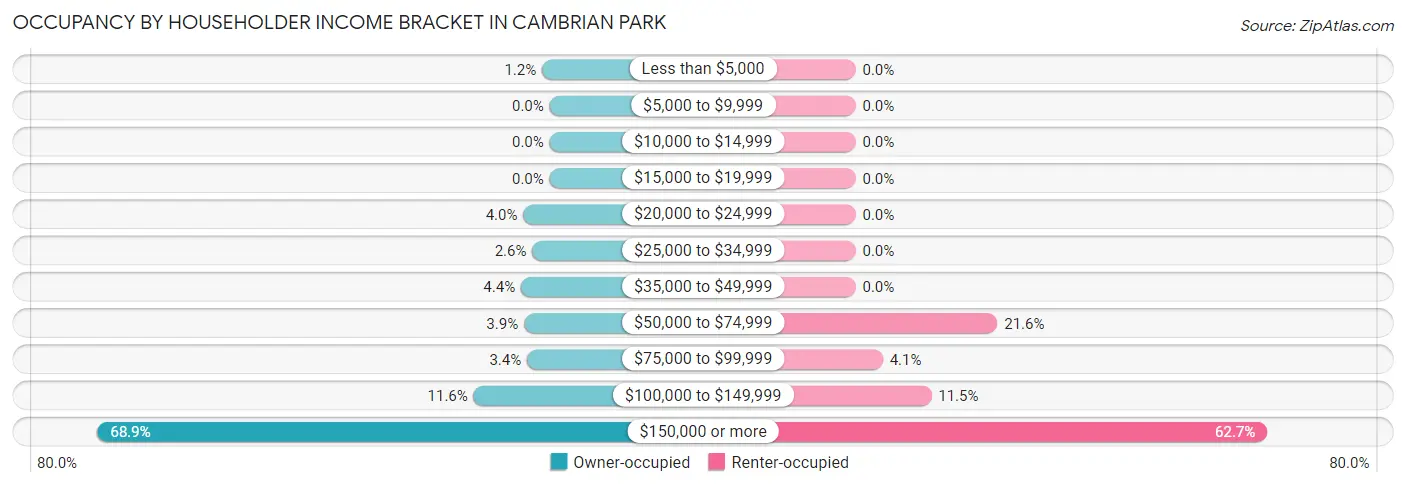
| Income Bracket | Owner-occupied | Renter-occupied |
| Less than $5,000 | 10 (1.1%) | 0 (0.0%) |
| $5,000 to $9,999 | 0 (0.0%) | 0 (0.0%) |
| $10,000 to $14,999 | 0 (0.0%) | 0 (0.0%) |
| $15,000 to $19,999 | 0 (0.0%) | 0 (0.0%) |
| $20,000 to $24,999 | 35 (4.0%) | 0 (0.0%) |
| $25,000 to $34,999 | 23 (2.6%) | 0 (0.0%) |
| $35,000 to $49,999 | 38 (4.4%) | 0 (0.0%) |
| $50,000 to $74,999 | 34 (3.9%) | 73 (21.6%) |
| $75,000 to $99,999 | 30 (3.4%) | 14 (4.1%) |
| $100,000 to $149,999 | 101 (11.6%) | 39 (11.5%) |
| $150,000 or more | 601 (68.9%) | 212 (62.7%) |
| Total | 872 (100.0%) | 338 (100.0%) |
Monthly Housing Cost Tiers in Cambrian Park
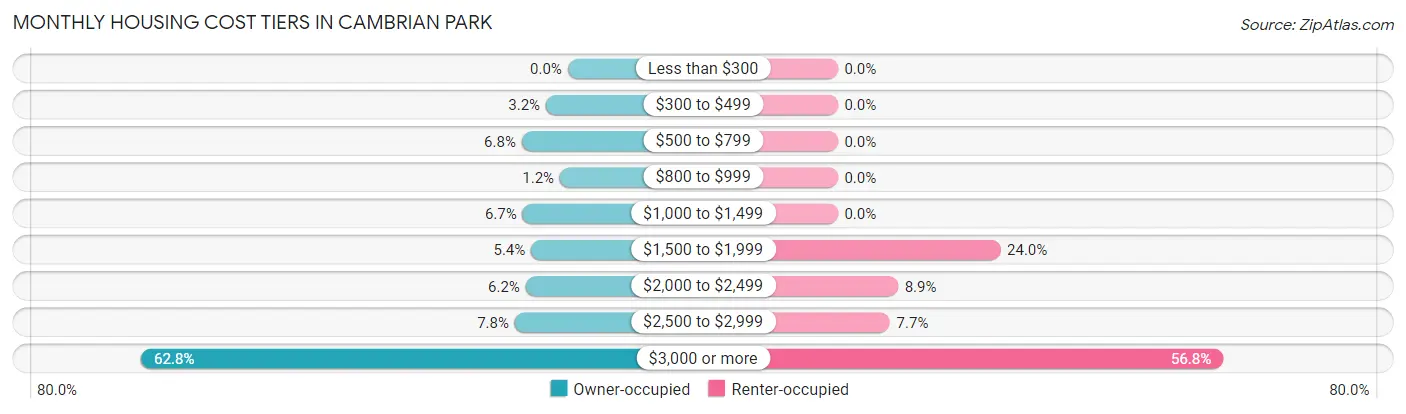
| Monthly Cost | Owner-occupied | Renter-occupied |
| Less than $300 | 0 (0.0%) | 0 (0.0%) |
| $300 to $499 | 28 (3.2%) | 0 (0.0%) |
| $500 to $799 | 59 (6.8%) | 0 (0.0%) |
| $800 to $999 | 10 (1.1%) | 0 (0.0%) |
| $1,000 to $1,499 | 58 (6.7%) | 0 (0.0%) |
| $1,500 to $1,999 | 47 (5.4%) | 81 (24.0%) |
| $2,000 to $2,499 | 54 (6.2%) | 30 (8.9%) |
| $2,500 to $2,999 | 68 (7.8%) | 26 (7.7%) |
| $3,000 or more | 548 (62.8%) | 192 (56.8%) |
| Total | 872 (100.0%) | 338 (100.0%) |
Physical Housing Characteristics in Cambrian Park
Housing Structures in Cambrian Park
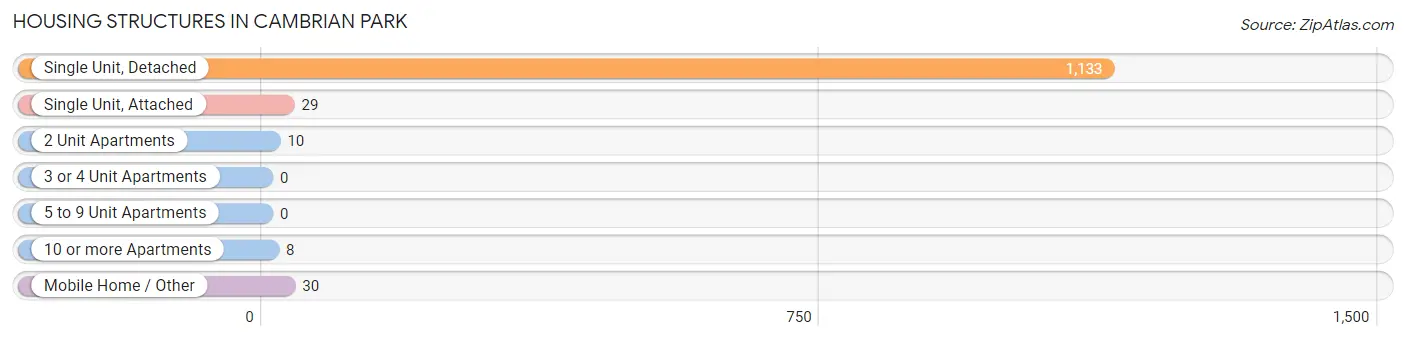
| Structure Type | # Housing Units | % Housing Units |
| Single Unit, Detached | 1,133 | 93.6% |
| Single Unit, Attached | 29 | 2.4% |
| 2 Unit Apartments | 10 | 0.8% |
| 3 or 4 Unit Apartments | 0 | 0.0% |
| 5 to 9 Unit Apartments | 0 | 0.0% |
| 10 or more Apartments | 8 | 0.7% |
| Mobile Home / Other | 30 | 2.5% |
| Total | 1,210 | 100.0% |
Housing Structures by Occupancy in Cambrian Park
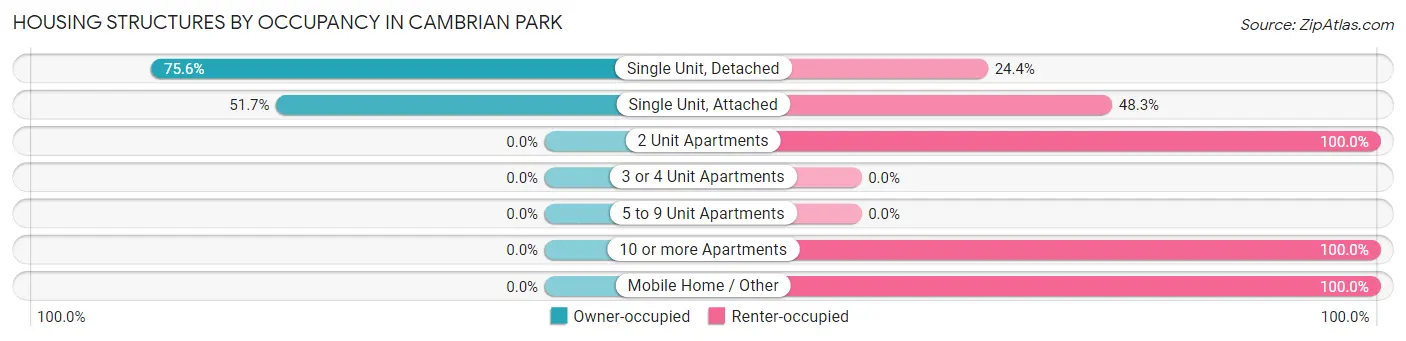
| Structure Type | Owner-occupied | Renter-occupied |
| Single Unit, Detached | 857 (75.6%) | 276 (24.4%) |
| Single Unit, Attached | 15 (51.7%) | 14 (48.3%) |
| 2 Unit Apartments | 0 (0.0%) | 10 (100.0%) |
| 3 or 4 Unit Apartments | 0 (0.0%) | 0 (0.0%) |
| 5 to 9 Unit Apartments | 0 (0.0%) | 0 (0.0%) |
| 10 or more Apartments | 0 (0.0%) | 8 (100.0%) |
| Mobile Home / Other | 0 (0.0%) | 30 (100.0%) |
| Total | 872 (72.1%) | 338 (27.9%) |
Housing Structures by Number of Rooms in Cambrian Park
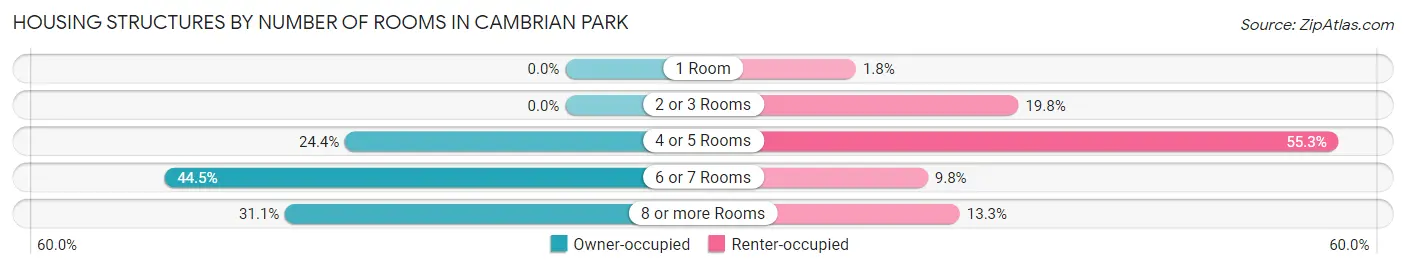
| Number of Rooms | Owner-occupied | Renter-occupied |
| 1 Room | 0 (0.0%) | 6 (1.8%) |
| 2 or 3 Rooms | 0 (0.0%) | 67 (19.8%) |
| 4 or 5 Rooms | 213 (24.4%) | 187 (55.3%) |
| 6 or 7 Rooms | 388 (44.5%) | 33 (9.8%) |
| 8 or more Rooms | 271 (31.1%) | 45 (13.3%) |
| Total | 872 (100.0%) | 338 (100.0%) |
Housing Structure by Heating Type in Cambrian Park
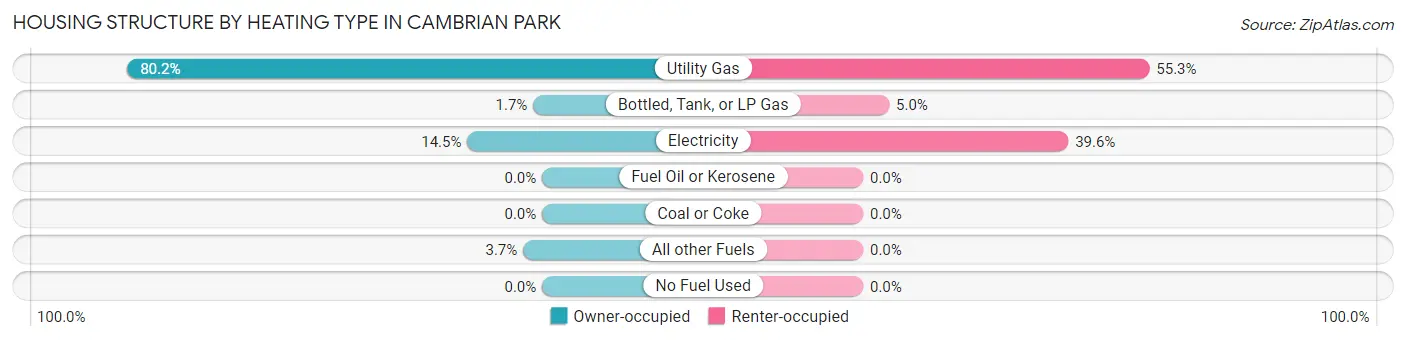
| Heating Type | Owner-occupied | Renter-occupied |
| Utility Gas | 699 (80.2%) | 187 (55.3%) |
| Bottled, Tank, or LP Gas | 15 (1.7%) | 17 (5.0%) |
| Electricity | 126 (14.4%) | 134 (39.6%) |
| Fuel Oil or Kerosene | 0 (0.0%) | 0 (0.0%) |
| Coal or Coke | 0 (0.0%) | 0 (0.0%) |
| All other Fuels | 32 (3.7%) | 0 (0.0%) |
| No Fuel Used | 0 (0.0%) | 0 (0.0%) |
| Total | 872 (100.0%) | 338 (100.0%) |
Household Vehicle Usage in Cambrian Park
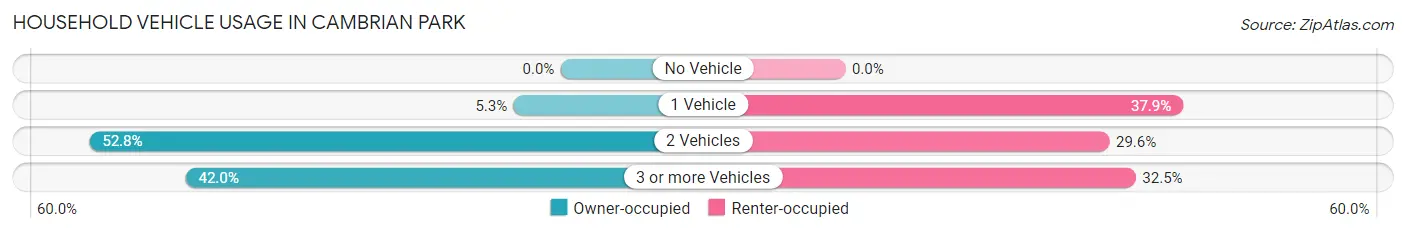
| Vehicles per Household | Owner-occupied | Renter-occupied |
| No Vehicle | 0 (0.0%) | 0 (0.0%) |
| 1 Vehicle | 46 (5.3%) | 128 (37.9%) |
| 2 Vehicles | 460 (52.7%) | 100 (29.6%) |
| 3 or more Vehicles | 366 (42.0%) | 110 (32.5%) |
| Total | 872 (100.0%) | 338 (100.0%) |
Real Estate & Mortgages in Cambrian Park
Real Estate and Mortgage Overview in Cambrian Park
| Characteristic | Without Mortgage | With Mortgage |
| Housing Units | 200 | 672 |
| Median Property Value | $1,750,000 | $2,000,001 |
| Median Household Income | $250,001 | $475 |
| Monthly Housing Costs | $1,122 | $548 |
| Real Estate Taxes | $5,403 | $0 |
Property Value by Mortgage Status in Cambrian Park
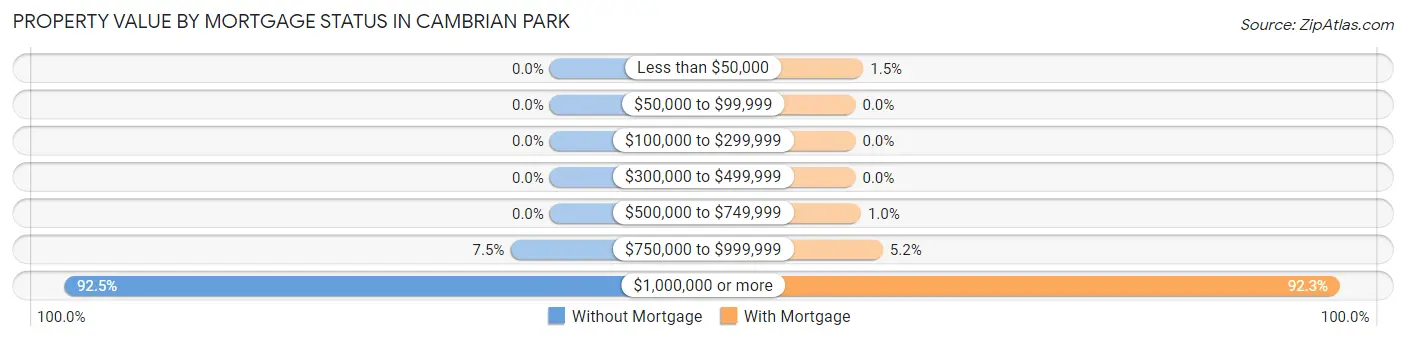
| Property Value | Without Mortgage | With Mortgage |
| Less than $50,000 | 0 (0.0%) | 10 (1.5%) |
| $50,000 to $99,999 | 0 (0.0%) | 0 (0.0%) |
| $100,000 to $299,999 | 0 (0.0%) | 0 (0.0%) |
| $300,000 to $499,999 | 0 (0.0%) | 0 (0.0%) |
| $500,000 to $749,999 | 0 (0.0%) | 7 (1.0%) |
| $750,000 to $999,999 | 15 (7.5%) | 35 (5.2%) |
| $1,000,000 or more | 185 (92.5%) | 620 (92.3%) |
| Total | 200 (100.0%) | 672 (100.0%) |
Household Income by Mortgage Status in Cambrian Park
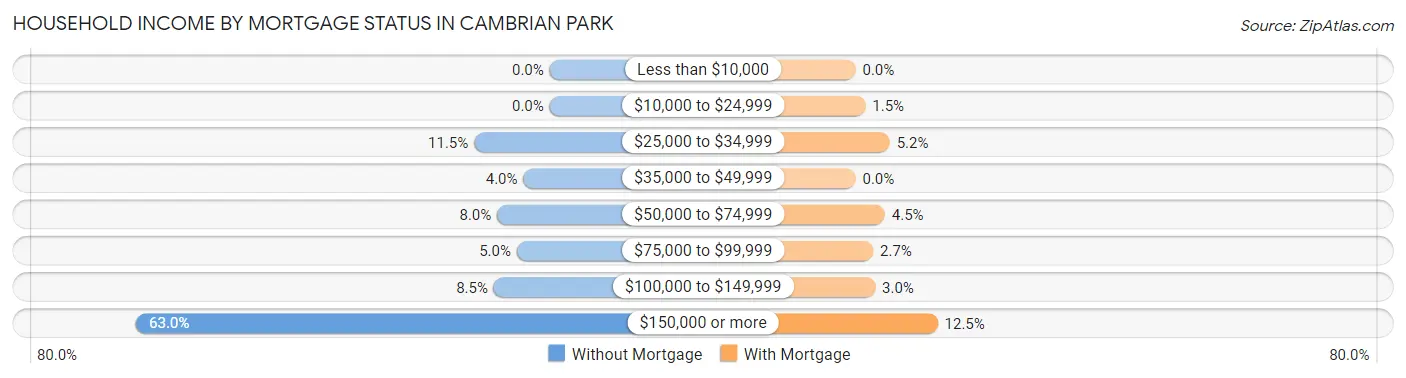
| Household Income | Without Mortgage | With Mortgage |
| Less than $10,000 | 0 (0.0%) | 0 (0.0%) |
| $10,000 to $24,999 | 0 (0.0%) | 10 (1.5%) |
| $25,000 to $34,999 | 23 (11.5%) | 35 (5.2%) |
| $35,000 to $49,999 | 8 (4.0%) | 0 (0.0%) |
| $50,000 to $74,999 | 16 (8.0%) | 30 (4.5%) |
| $75,000 to $99,999 | 10 (5.0%) | 18 (2.7%) |
| $100,000 to $149,999 | 17 (8.5%) | 20 (3.0%) |
| $150,000 or more | 126 (63.0%) | 84 (12.5%) |
| Total | 200 (100.0%) | 672 (100.0%) |
Property Value to Household Income Ratio in Cambrian Park
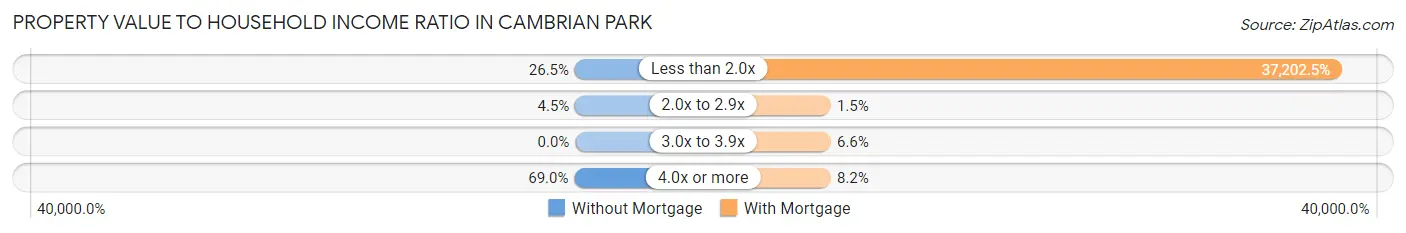
| Value-to-Income Ratio | Without Mortgage | With Mortgage |
| Less than 2.0x | 53 (26.5%) | 250,001 (37,202.5%) |
| 2.0x to 2.9x | 9 (4.5%) | 10 (1.5%) |
| 3.0x to 3.9x | 0 (0.0%) | 44 (6.6%) |
| 4.0x or more | 138 (69.0%) | 55 (8.2%) |
| Total | 200 (100.0%) | 672 (100.0%) |
Real Estate Taxes by Mortgage Status in Cambrian Park
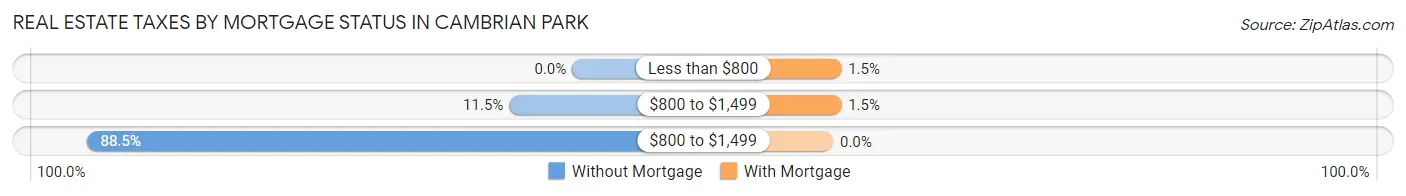
| Property Taxes | Without Mortgage | With Mortgage |
| Less than $800 | 0 (0.0%) | 10 (1.5%) |
| $800 to $1,499 | 23 (11.5%) | 10 (1.5%) |
| $800 to $1,499 | 177 (88.5%) | 0 (0.0%) |
| Total | 200 (100.0%) | 672 (100.0%) |
Health & Disability in Cambrian Park
Health Insurance Coverage by Age in Cambrian Park
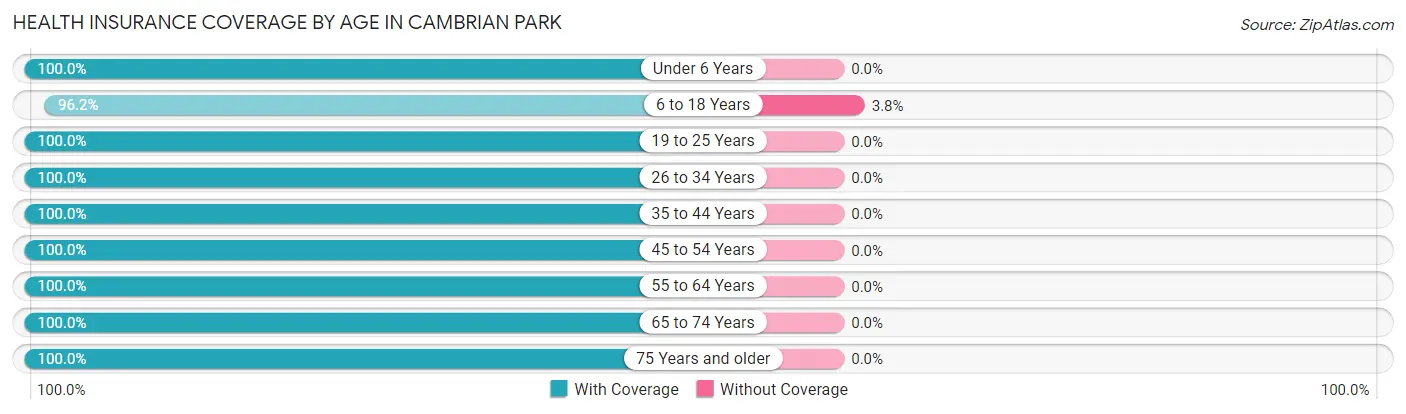
| Age Bracket | With Coverage | Without Coverage |
| Under 6 Years | 309 (100.0%) | 0 (0.0%) |
| 6 to 18 Years | 453 (96.2%) | 18 (3.8%) |
| 19 to 25 Years | 263 (100.0%) | 0 (0.0%) |
| 26 to 34 Years | 404 (100.0%) | 0 (0.0%) |
| 35 to 44 Years | 348 (100.0%) | 0 (0.0%) |
| 45 to 54 Years | 624 (100.0%) | 0 (0.0%) |
| 55 to 64 Years | 630 (100.0%) | 0 (0.0%) |
| 65 to 74 Years | 276 (100.0%) | 0 (0.0%) |
| 75 Years and older | 182 (100.0%) | 0 (0.0%) |
| Total | 3,489 (99.5%) | 18 (0.5%) |
Health Insurance Coverage by Citizenship Status in Cambrian Park
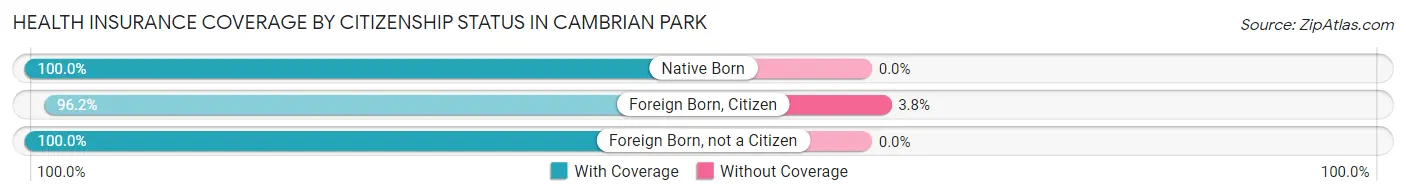
| Citizenship Status | With Coverage | Without Coverage |
| Native Born | 309 (100.0%) | 0 (0.0%) |
| Foreign Born, Citizen | 453 (96.2%) | 18 (3.8%) |
| Foreign Born, not a Citizen | 263 (100.0%) | 0 (0.0%) |
Health Insurance Coverage by Household Income in Cambrian Park
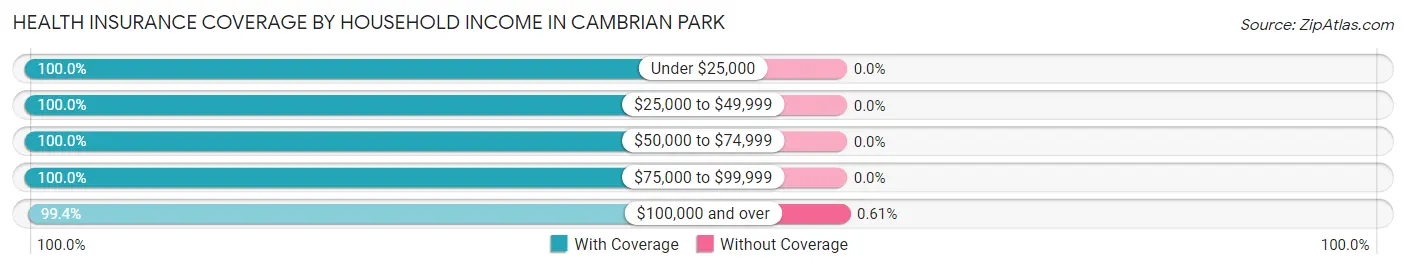
| Household Income | With Coverage | Without Coverage |
| Under $25,000 | 188 (100.0%) | 0 (0.0%) |
| $25,000 to $49,999 | 83 (100.0%) | 0 (0.0%) |
| $50,000 to $74,999 | 212 (100.0%) | 0 (0.0%) |
| $75,000 to $99,999 | 84 (100.0%) | 0 (0.0%) |
| $100,000 and over | 2,909 (99.4%) | 18 (0.6%) |
Public vs Private Health Insurance Coverage by Age in Cambrian Park
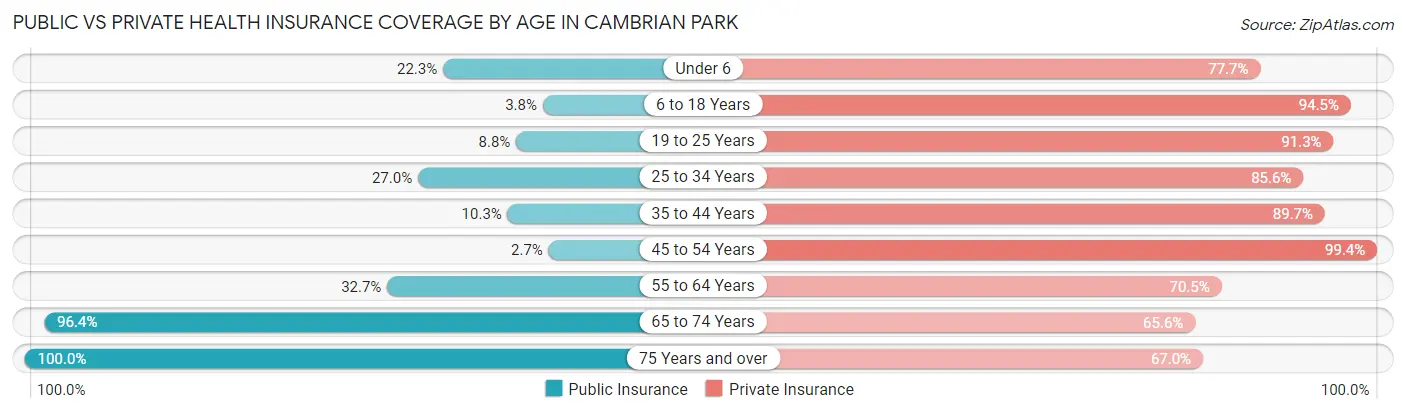
| Age Bracket | Public Insurance | Private Insurance |
| Under 6 | 69 (22.3%) | 240 (77.7%) |
| 6 to 18 Years | 18 (3.8%) | 445 (94.5%) |
| 19 to 25 Years | 23 (8.7%) | 240 (91.2%) |
| 25 to 34 Years | 109 (27.0%) | 346 (85.6%) |
| 35 to 44 Years | 36 (10.3%) | 312 (89.7%) |
| 45 to 54 Years | 17 (2.7%) | 620 (99.4%) |
| 55 to 64 Years | 206 (32.7%) | 444 (70.5%) |
| 65 to 74 Years | 266 (96.4%) | 181 (65.6%) |
| 75 Years and over | 182 (100.0%) | 122 (67.0%) |
| Total | 926 (26.4%) | 2,950 (84.1%) |
Disability Status by Sex by Age in Cambrian Park
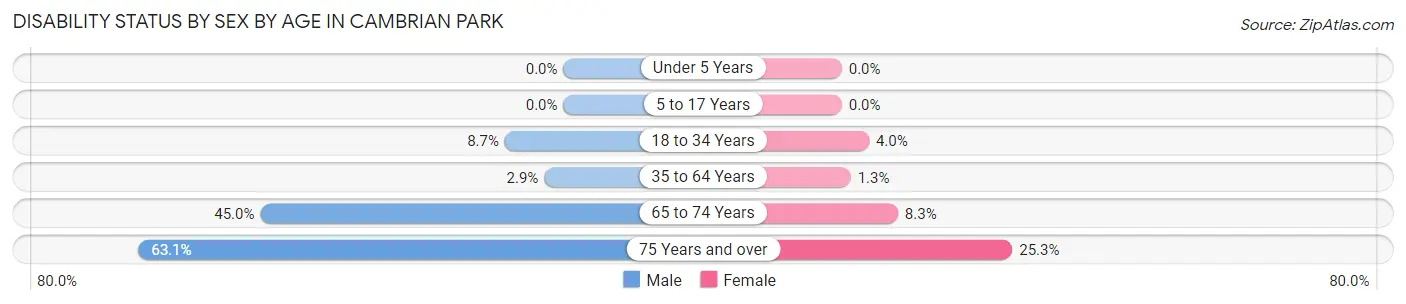
| Age Bracket | Male | Female |
| Under 5 Years | 0 (0.0%) | 0 (0.0%) |
| 5 to 17 Years | 0 (0.0%) | 0 (0.0%) |
| 18 to 34 Years | 24 (8.7%) | 18 (4.0%) |
| 35 to 64 Years | 22 (2.9%) | 11 (1.3%) |
| 65 to 74 Years | 81 (45.0%) | 8 (8.3%) |
| 75 Years and over | 65 (63.1%) | 20 (25.3%) |
Disability Class by Sex by Age in Cambrian Park
Disability Class: Hearing Difficulty
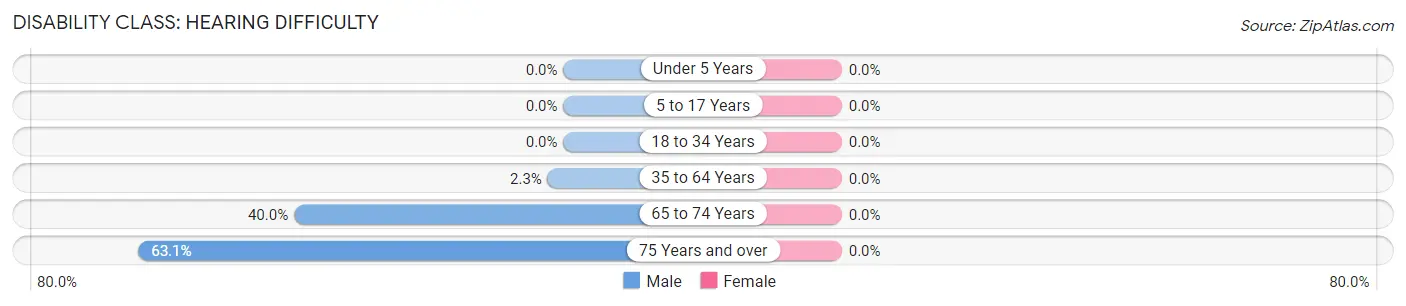
| Age Bracket | Male | Female |
| Under 5 Years | 0 (0.0%) | 0 (0.0%) |
| 5 to 17 Years | 0 (0.0%) | 0 (0.0%) |
| 18 to 34 Years | 0 (0.0%) | 0 (0.0%) |
| 35 to 64 Years | 18 (2.3%) | 0 (0.0%) |
| 65 to 74 Years | 72 (40.0%) | 0 (0.0%) |
| 75 Years and over | 65 (63.1%) | 0 (0.0%) |
Disability Class: Vision Difficulty
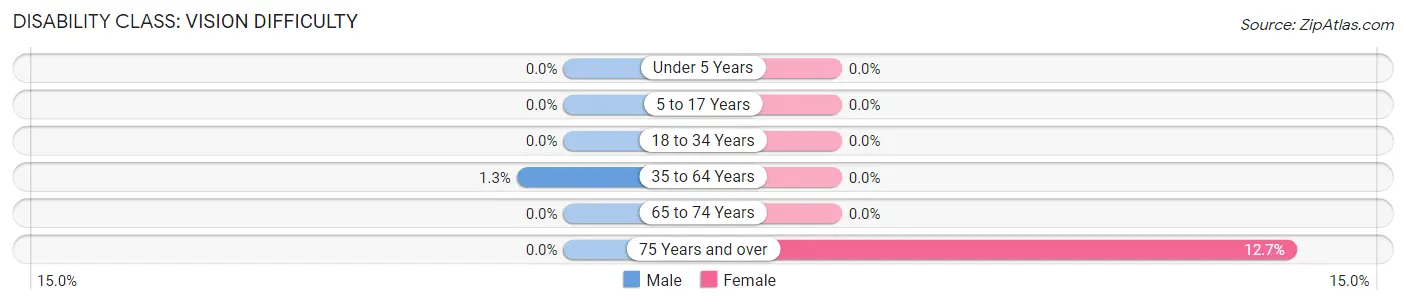
| Age Bracket | Male | Female |
| Under 5 Years | 0 (0.0%) | 0 (0.0%) |
| 5 to 17 Years | 0 (0.0%) | 0 (0.0%) |
| 18 to 34 Years | 0 (0.0%) | 0 (0.0%) |
| 35 to 64 Years | 10 (1.3%) | 0 (0.0%) |
| 65 to 74 Years | 0 (0.0%) | 0 (0.0%) |
| 75 Years and over | 0 (0.0%) | 10 (12.7%) |
Disability Class: Cognitive Difficulty
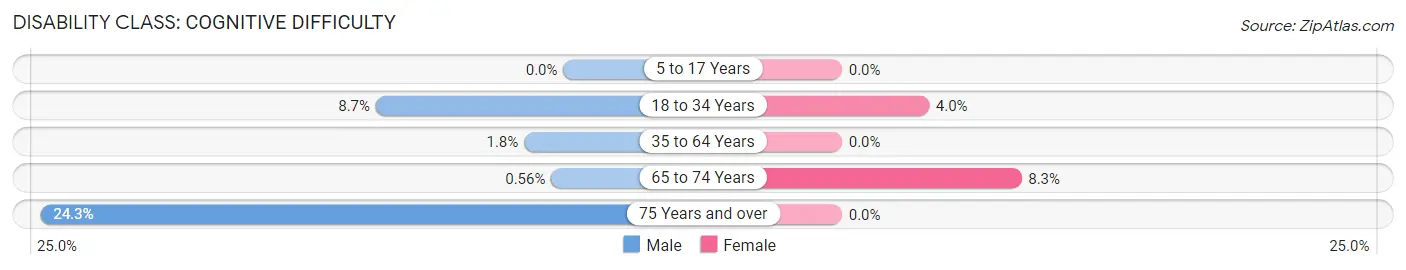
| Age Bracket | Male | Female |
| 5 to 17 Years | 0 (0.0%) | 0 (0.0%) |
| 18 to 34 Years | 24 (8.7%) | 18 (4.0%) |
| 35 to 64 Years | 14 (1.8%) | 0 (0.0%) |
| 65 to 74 Years | 1 (0.6%) | 8 (8.3%) |
| 75 Years and over | 25 (24.3%) | 0 (0.0%) |
Disability Class: Ambulatory Difficulty
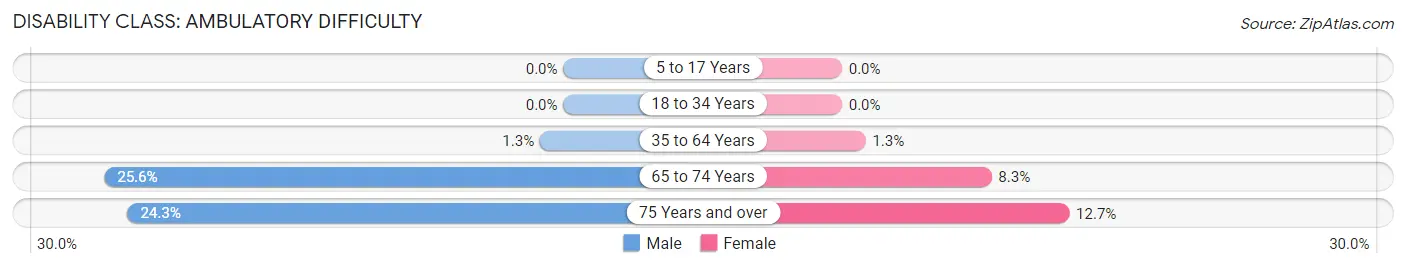
| Age Bracket | Male | Female |
| 5 to 17 Years | 0 (0.0%) | 0 (0.0%) |
| 18 to 34 Years | 0 (0.0%) | 0 (0.0%) |
| 35 to 64 Years | 10 (1.3%) | 11 (1.3%) |
| 65 to 74 Years | 46 (25.6%) | 8 (8.3%) |
| 75 Years and over | 25 (24.3%) | 10 (12.7%) |
Disability Class: Self-Care Difficulty
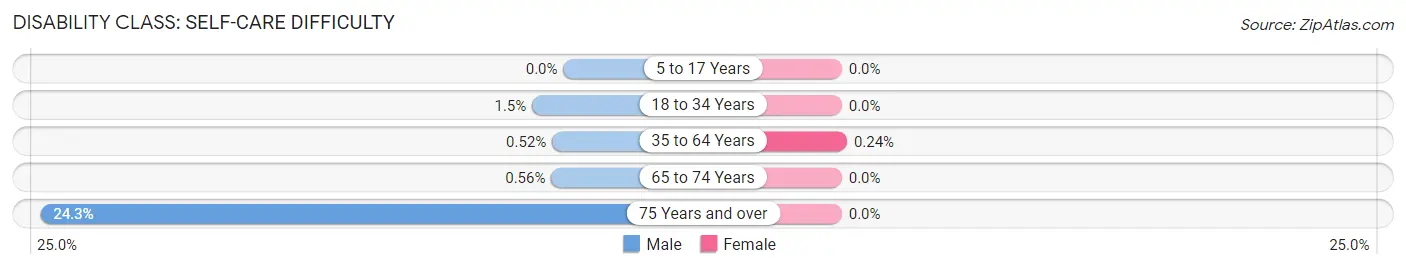
| Age Bracket | Male | Female |
| 5 to 17 Years | 0 (0.0%) | 0 (0.0%) |
| 18 to 34 Years | 4 (1.5%) | 0 (0.0%) |
| 35 to 64 Years | 4 (0.5%) | 2 (0.2%) |
| 65 to 74 Years | 1 (0.6%) | 0 (0.0%) |
| 75 Years and over | 25 (24.3%) | 0 (0.0%) |
Technology Access in Cambrian Park
Computing Device Access in Cambrian Park
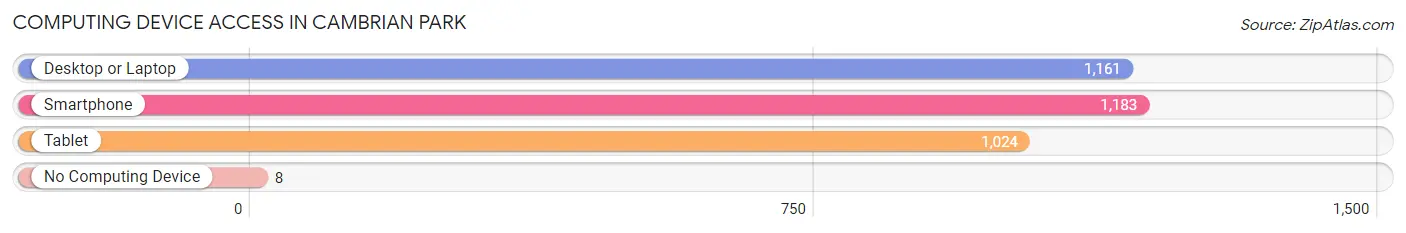
| Device Type | # Households | % Households |
| Desktop or Laptop | 1,161 | 96.0% |
| Smartphone | 1,183 | 97.8% |
| Tablet | 1,024 | 84.6% |
| No Computing Device | 8 | 0.7% |
| Total | 1,210 | 100.0% |
Internet Access in Cambrian Park
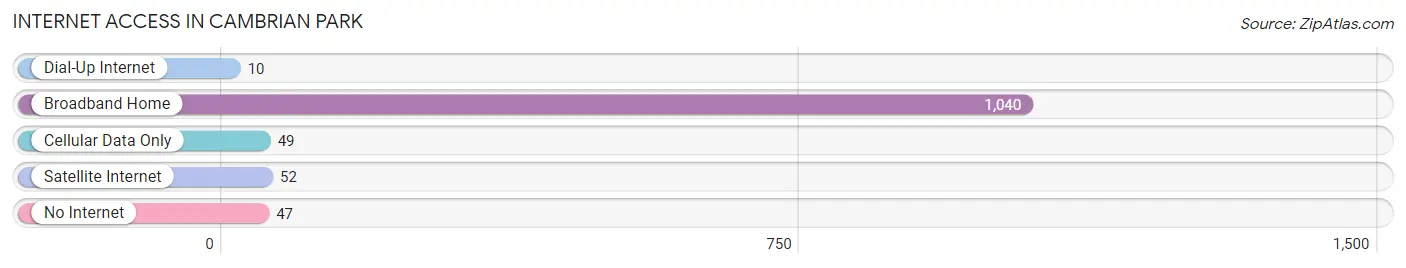
| Internet Type | # Households | % Households |
| Dial-Up Internet | 10 | 0.8% |
| Broadband Home | 1,040 | 86.0% |
| Cellular Data Only | 49 | 4.1% |
| Satellite Internet | 52 | 4.3% |
| No Internet | 47 | 3.9% |
| Total | 1,210 | 100.0% |
Cambrian Park Summary
Cambrian Park is a census-designated place (CDP) located in Santa Clara County, California. It is situated in the foothills of the Santa Cruz Mountains, approximately 10 miles west of San Jose. The population of Cambrian Park was 15,958 at the 2010 census.
Geography
Cambrian Park is located at 37°14'17" North, 121°56'45" West (37.238, -121.946). It is bordered by Los Gatos to the north, San Jose to the east, Almaden Valley to the south, and the Santa Cruz Mountains to the west. The area is approximately 4.5 square miles in size.
The terrain of Cambrian Park is mostly rolling hills, with some flat areas. The area is mostly residential, with some commercial and industrial areas. The area is served by several major highways, including State Route 17, State Route 85, and State Route 87.
History
Cambrian Park was originally inhabited by the Ohlone people, who lived in the area for thousands of years before the arrival of Europeans. The area was first settled by Europeans in the late 1700s, when Spanish missionaries established a mission in the area.
In the late 1800s, the area was developed as a farming community. The area was known as "Cambrian" after the Cambrian period, a geological period that lasted from 541 to 485 million years ago. The area was officially incorporated as the town of Cambrian Park in 1954.
Economy
Cambrian Park is primarily a residential area, with some commercial and industrial areas. The area is home to several large employers, including Cisco Systems, eBay, and Adobe Systems. The area is also home to several small businesses, including restaurants, retail stores, and professional services.
Demographics
As of the 2010 census, the population of Cambrian Park was 15,958. The racial makeup of the area was 57.3% White, 24.2% Asian, 11.2% Hispanic or Latino, 5.2% African American, and 2.1% other. The median household income was $107,837, and the median family income was $118,945.
Conclusion
Cambrian Park is a census-designated place located in Santa Clara County, California. It is situated in the foothills of the Santa Cruz Mountains, approximately 10 miles west of San Jose. The area is mostly residential, with some commercial and industrial areas. The population of Cambrian Park was 15,958 at the 2010 census, and the median household income was $107,837. The area is home to several large employers, including Cisco Systems, eBay, and Adobe Systems.
Common Questions
What is Per Capita Income in Cambrian Park?
Per Capita income in Cambrian Park is $109,617.
What is the Median Family Income in Cambrian Park?
Median Family Income in Cambrian Park is $250,001.
What is the Median Household income in Cambrian Park?
Median Household Income in Cambrian Park is $232,000.
What is Income or Wage Gap in Cambrian Park?
Income or Wage Gap in Cambrian Park is 54.7%.
Women in Cambrian Park earn 45.3 cents for every dollar earned by a man.
What is Inequality or Gini Index in Cambrian Park?
Inequality or Gini Index in Cambrian Park is 0.46.
What is the Total Population of Cambrian Park?
Total Population of Cambrian Park is 3,551.
What is the Total Male Population of Cambrian Park?
Total Male Population of Cambrian Park is 1,642.
What is the Total Female Population of Cambrian Park?
Total Female Population of Cambrian Park is 1,909.
What is the Ratio of Males per 100 Females in Cambrian Park?
There are 86.01 Males per 100 Females in Cambrian Park.
What is the Ratio of Females per 100 Males in Cambrian Park?
There are 116.26 Females per 100 Males in Cambrian Park.
What is the Median Population Age in Cambrian Park?
Median Population Age in Cambrian Park is 44.8 Years.
What is the Average Family Size in Cambrian Park
Average Family Size in Cambrian Park is 3.2 People.
What is the Average Household Size in Cambrian Park
Average Household Size in Cambrian Park is 2.9 People.
How Large is the Labor Force in Cambrian Park?
There are 1,885 People in the Labor Forcein in Cambrian Park.
What is the Percentage of People in the Labor Force in Cambrian Park?
65.7% of People are in the Labor Force in Cambrian Park.
What is the Unemployment Rate in Cambrian Park?
Unemployment Rate in Cambrian Park is 0.9%.