Zip Codes with the Highest Percentage of Population Employed in Health Diagnosing & Treating in Edwards, CA
RELATED REPORTS & OPTIONS
Health Diagnosing & Treating
Edwards
Compare Zip Codes
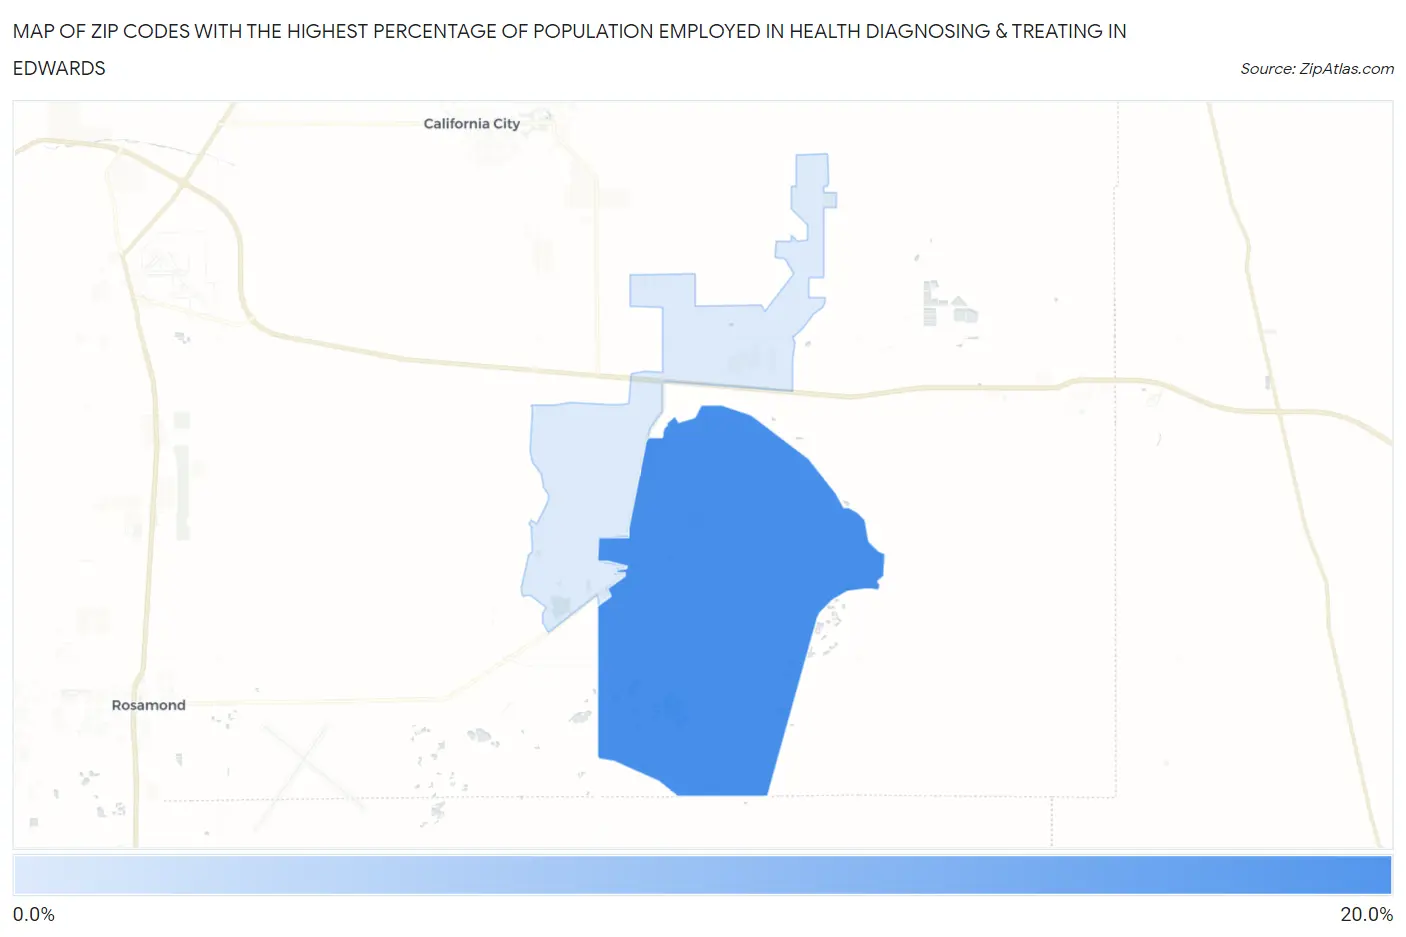
Map of Zip Codes with the Highest Percentage of Population Employed in Health Diagnosing & Treating in Edwards
3.0%
20.0%
Zip Codes with the Highest Percentage of Population Employed in Health Diagnosing & Treating in Edwards, CA
| Zip Code | % Employed | vs State | vs National | |
| 1. | 93524 | 20.0% | 5.3%(+14.7)#25 | 6.2%(+13.8)#551 |
| 2. | 93523 | 3.0% | 5.3%(-2.34)#1,199 | 6.2%(-3.28)#24,398 |
1
Common Questions
What are the Top Zip Codes with the Highest Percentage of Population Employed in Health Diagnosing & Treating in Edwards, CA?
Top Zip Codes with the Highest Percentage of Population Employed in Health Diagnosing & Treating in Edwards, CA are:
What zip code has the Highest Percentage of Population Employed in Health Diagnosing & Treating in Edwards, CA?
93524 has the Highest Percentage of Population Employed in Health Diagnosing & Treating in Edwards, CA with 20.0%.
What is the Percentage of Population Employed in Health Diagnosing & Treating in California?
Percentage of Population Employed in Health Diagnosing & Treating in California is 5.3%.
What is the Percentage of Population Employed in Health Diagnosing & Treating in the United States?
Percentage of Population Employed in Health Diagnosing & Treating in the United States is 6.2%.