Cities with the Highest Percentage of Population Employed in Health Diagnosing & Treating in the United States
RELATED REPORTS & OPTIONS
Health Diagnosing & Treating
United States
Compare Cities
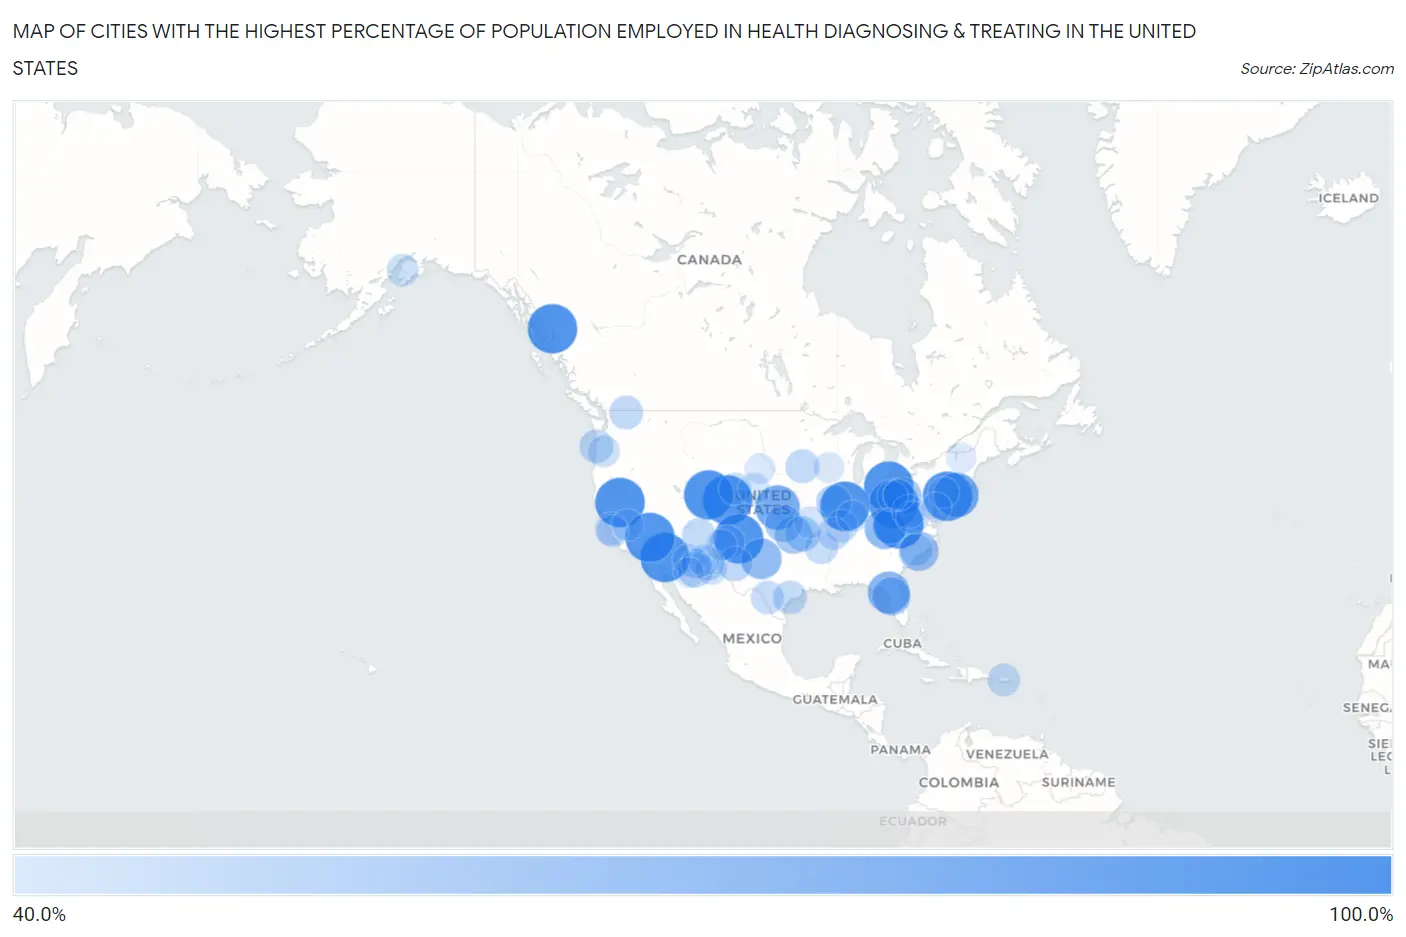
Map of Cities with the Highest Percentage of Population Employed in Health Diagnosing & Treating in the United States
0.0%
100.0%
Cities with the Highest Percentage of Population Employed in Health Diagnosing & Treating in the United States
| City | % Employed | vs State | vs National | |
| 1. | La Paz Valley | 100.0% | 5.9%(+94.1)#1 | 6.2%(+93.8)#1 |
| 2. | Crumpler | 100.0% | 8.0%(+92.0)#1 | 6.2%(+93.8)#2 |
| 3. | Hickox | 100.0% | 5.7%(+94.3)#1 | 6.2%(+93.8)#3 |
| 4. | Medanales | 100.0% | 5.9%(+94.1)#1 | 6.2%(+93.8)#4 |
| 5. | Meacham | 100.0% | 6.1%(+93.9)#1 | 6.2%(+93.8)#5 |
| 6. | Crystal Rock | 100.0% | 7.2%(+92.8)#1 | 6.2%(+93.8)#6 |
| 7. | Gold Mountain | 100.0% | 5.3%(+94.7)#1 | 6.2%(+93.8)#7 |
| 8. | Encantado | 100.0% | 5.9%(+94.1)#2 | 6.2%(+93.8)#8 |
| 9. | Clyde | 100.0% | 6.2%(+93.8)#1 | 6.2%(+93.8)#9 |
| 10. | Rendville | 100.0% | 7.2%(+92.8)#2 | 6.2%(+93.8)#10 |
| 11. | Vanoss | 100.0% | 6.4%(+93.6)#1 | 6.2%(+93.8)#11 |
| 12. | Argyle | 100.0% | 6.2%(+93.8)#1 | 6.2%(+93.8)#12 |
| 13. | Edgemont | 100.0% | 7.2%(+92.8)#1 | 6.2%(+93.8)#13 |
| 14. | Hidden Lake | 100.0% | 5.8%(+94.2)#1 | 6.2%(+93.8)#14 |
| 15. | Rainsville | 100.0% | 6.6%(+93.4)#1 | 6.2%(+93.8)#15 |
| 16. | Mosquero | 100.0% | 5.9%(+94.1)#3 | 6.2%(+93.8)#16 |
| 17. | Shoshone | 100.0% | 5.3%(+94.7)#2 | 6.2%(+93.8)#17 |
| 18. | Maybell | 100.0% | 5.8%(+94.2)#2 | 6.2%(+93.8)#18 |
| 19. | Lakewood | 100.0% | 6.2%(+93.8)#1 | 6.2%(+93.8)#19 |
| 20. | Hyder | 100.0% | 5.8%(+94.2)#1 | 6.2%(+93.8)#20 |
| 21. | Candlewood Lake Club | 88.1% | 6.7%(+81.4)#1 | 6.2%(+81.9)#21 |
| 22. | Gilgo | 86.5% | 6.6%(+79.9)#1 | 6.2%(+80.2)#22 |
| 23. | Hunter | 85.7% | 6.6%(+79.1)#1 | 6.2%(+79.5)#23 |
| 24. | Waynesville | 78.9% | 5.7%(+73.2)#2 | 6.2%(+72.6)#24 |
| 25. | Otter Creek | 78.3% | 6.4%(+71.9)#1 | 6.2%(+72.1)#25 |
| 26. | Coxton | 75.0% | 7.2%(+67.8)#1 | 6.2%(+68.8)#26 |
| 27. | Girard | 75.0% | 5.5%(+69.5)#1 | 6.2%(+68.8)#27 |
| 28. | Millers Lake | 74.7% | 6.6%(+68.1)#1 | 6.2%(+68.5)#28 |
| 29. | Hallsboro | 71.4% | 6.4%(+65.0)#1 | 6.2%(+65.2)#29 |
| 30. | Mccaulley | 69.2% | 5.5%(+63.7)#2 | 6.2%(+63.0)#30 |
| 31. | Black Diamond | 67.9% | 6.4%(+61.5)#2 | 6.2%(+61.7)#31 |
| 32. | Knottsville | 67.8% | 7.2%(+60.6)#2 | 6.2%(+61.5)#32 |
| 33. | Townshend | 67.7% | 6.9%(+60.9)#1 | 6.2%(+61.5)#33 |
| 34. | East Springfield | 67.5% | 7.2%(+60.3)#3 | 6.2%(+61.3)#34 |
| 35. | Jewell Ridge | 66.7% | 5.7%(+61.0)#1 | 6.2%(+60.4)#35 |
| 36. | Lotsee | 66.7% | 6.4%(+60.3)#2 | 6.2%(+60.4)#36 |
| 37. | Viola | 65.4% | 6.6%(+58.8)#2 | 6.2%(+59.1)#37 |
| 38. | Cliftondale Park | 61.5% | 5.7%(+55.9)#2 | 6.2%(+55.3)#38 |
| 39. | Linoma Beach | 61.5% | 6.2%(+55.3)#1 | 6.2%(+55.3)#39 |
| 40. | Glacier Colony | 61.1% | 6.6%(+54.6)#1 | 6.2%(+54.9)#40 |
| 41. | Mcroberts | 60.4% | 7.2%(+53.2)#3 | 6.2%(+54.1)#41 |
| 42. | Naples | 59.6% | 6.2%(+53.4)#2 | 6.2%(+53.4)#42 |
| 43. | Bull Hollow | 59.6% | 6.4%(+53.2)#3 | 6.2%(+53.3)#43 |
| 44. | Manor | 59.2% | 5.7%(+53.5)#3 | 6.2%(+52.9)#44 |
| 45. | Dragoon | 59.0% | 5.9%(+53.2)#2 | 6.2%(+52.8)#45 |
| 46. | Tocsin | 58.4% | 6.6%(+51.8)#2 | 6.2%(+52.1)#46 |
| 47. | Sena | 58.0% | 5.9%(+52.0)#4 | 6.2%(+51.7)#47 |
| 48. | Morningside | 57.9% | 5.9%(+52.0)#5 | 6.2%(+51.7)#48 |
| 49. | Trent | 57.4% | 6.1%(+51.4)#2 | 6.2%(+51.2)#49 |
| 50. | Delacroix | 56.7% | 7.2%(+49.5)#1 | 6.2%(+50.4)#50 |
| 51. | Denton | 56.2% | 6.9%(+49.3)#1 | 6.2%(+50.0)#51 |
| 52. | Cape Meares | 55.6% | 6.1%(+49.5)#3 | 6.2%(+49.3)#52 |
| 53. | Pinos Altos | 55.6% | 5.9%(+49.6)#6 | 6.2%(+49.3)#53 |
| 54. | Loomis | 55.6% | 5.6%(+50.0)#1 | 6.2%(+49.3)#54 |
| 55. | Alpha | 55.4% | 6.8%(+48.7)#1 | 6.2%(+49.2)#55 |
| 56. | Vanderbilt | 55.3% | 5.5%(+49.8)#3 | 6.2%(+49.1)#56 |
| 57. | Sagar | 54.8% | 5.9%(+48.9)#7 | 6.2%(+48.6)#57 |
| 58. | Del Muerto | 54.6% | 5.9%(+48.7)#3 | 6.2%(+48.4)#58 |
| 59. | Valley Bend | 54.5% | 8.0%(+46.5)#2 | 6.2%(+48.2)#59 |
| 60. | Loma Grande | 54.3% | 5.5%(+48.7)#4 | 6.2%(+48.0)#60 |
| 61. | College Station | 54.2% | 7.2%(+47.0)#2 | 6.2%(+47.9)#61 |
| 62. | Evergreen | 53.6% | 6.4%(+47.2)#2 | 6.2%(+47.3)#62 |
| 63. | Lambert | 53.6% | 6.9%(+46.7)#2 | 6.2%(+47.3)#63 |
| 64. | Pajaro Dunes | 53.3% | 5.3%(+48.0)#3 | 6.2%(+47.1)#64 |
| 65. | Oak Hills | 53.2% | 6.2%(+47.0)#2 | 6.2%(+46.9)#65 |
| 66. | Tibes | 53.1% | 6.7%(+46.4)#1 | 6.2%(+46.9)#66 |
| 67. | Fairfield | 53.0% | 5.7%(+47.4)#3 | 6.2%(+46.8)#67 |
| 68. | Deerfield | 53.0% | 5.7%(+47.3)#4 | 6.2%(+46.7)#68 |
| 69. | Knobel | 52.5% | 7.2%(+45.3)#3 | 6.2%(+46.2)#69 |
| 70. | Canton | 52.2% | 6.6%(+45.6)#3 | 6.2%(+45.9)#70 |
| 71. | Acorn | 51.7% | 7.2%(+44.5)#4 | 6.2%(+45.4)#71 |
| 72. | Hillsdale | 51.6% | 5.9%(+45.7)#1 | 6.2%(+45.4)#72 |
| 73. | Top Of The World | 51.4% | 5.9%(+45.5)#4 | 6.2%(+45.2)#73 |
| 74. | Kasilof | 51.3% | 5.8%(+45.6)#2 | 6.2%(+45.1)#74 |
| 75. | Brooks | 51.1% | 6.1%(+45.0)#4 | 6.2%(+44.8)#75 |
| 76. | Pecan Park | 50.9% | 5.9%(+45.0)#8 | 6.2%(+44.7)#76 |
| 77. | Spreckels | 50.8% | 5.3%(+45.5)#4 | 6.2%(+44.5)#77 |
| 78. | Bass Lake | 50.5% | 5.3%(+45.1)#5 | 6.2%(+44.2)#78 |
| 79. | Griffin | 50.0% | 6.6%(+43.4)#4 | 6.2%(+43.8)#79 |
| 80. | Martin | 50.0% | 6.2%(+43.8)#2 | 6.2%(+43.8)#80 |
| 81. | Glenwood | 50.0% | 5.9%(+44.1)#9 | 6.2%(+43.8)#81 |
| 82. | Arcola | 50.0% | 6.9%(+43.1)#3 | 6.2%(+43.8)#82 |
| 83. | Eagle Bay | 50.0% | 6.6%(+43.4)#2 | 6.2%(+43.8)#83 |
| 84. | Sumner | 50.0% | 6.4%(+43.6)#4 | 6.2%(+43.8)#84 |
| 85. | Green Hills Borough | 50.0% | 7.4%(+42.6)#1 | 6.2%(+43.8)#85 |
| 86. | Cedro | 49.4% | 5.9%(+43.4)#10 | 6.2%(+43.1)#86 |
| 87. | Raleigh | 49.1% | 8.0%(+41.1)#3 | 6.2%(+42.8)#87 |
| 88. | Sandyville | 48.7% | 7.2%(+41.6)#4 | 6.2%(+42.5)#88 |
| 89. | Buttzville | 48.1% | 6.2%(+41.8)#2 | 6.2%(+41.8)#89 |
| 90. | De Soto | 47.6% | 6.3%(+41.3)#1 | 6.2%(+41.4)#90 |
| 91. | Hardy | 47.1% | 6.6%(+40.5)#2 | 6.2%(+40.8)#91 |
| 92. | Central | 46.9% | 5.9%(+41.0)#5 | 6.2%(+40.6)#92 |
| 93. | Soldier Creek | 46.7% | 7.5%(+39.1)#1 | 6.2%(+40.4)#93 |
| 94. | Paris Crossing | 46.7% | 6.6%(+40.1)#5 | 6.2%(+40.4)#94 |
| 95. | Georgetown | 46.4% | 6.2%(+40.2)#1 | 6.2%(+40.2)#95 |
| 96. | Elephant Head | 46.3% | 5.9%(+40.4)#6 | 6.2%(+40.0)#96 |
| 97. | Howard | 46.1% | 7.2%(+38.9)#5 | 6.2%(+39.8)#97 |
| 98. | Stowe | 46.0% | 6.9%(+39.2)#2 | 6.2%(+39.8)#98 |
| 99. | Mariah Hill | 46.0% | 6.6%(+39.5)#6 | 6.2%(+39.8)#99 |
| 100. | Bloomfield | 45.9% | 6.2%(+39.7)#3 | 6.2%(+39.7)#100 |
Common Questions
What are the Top 10 Cities with the Highest Percentage of Population Employed in Health Diagnosing & Treating in the United States?
Top 10 Cities with the Highest Percentage of Population Employed in Health Diagnosing & Treating in the United States are:
#1
100.0%
#2
100.0%
#3
100.0%
#4
100.0%
#5
100.0%
#6
100.0%
#7
100.0%
#8
100.0%
#9
100.0%
#10
100.0%
What city has the Highest Percentage of Population Employed in Health Diagnosing & Treating in the United States?
La Paz Valley has the Highest Percentage of Population Employed in Health Diagnosing & Treating in the United States with 100.0%.
What is the Percentage of Population Employed in Health Diagnosing & Treating in the United States?
Percentage of Population Employed in Health Diagnosing & Treating in the United States is 6.2%.