Los Ranchos, CA Map & Demographics
Los Ranchos Map
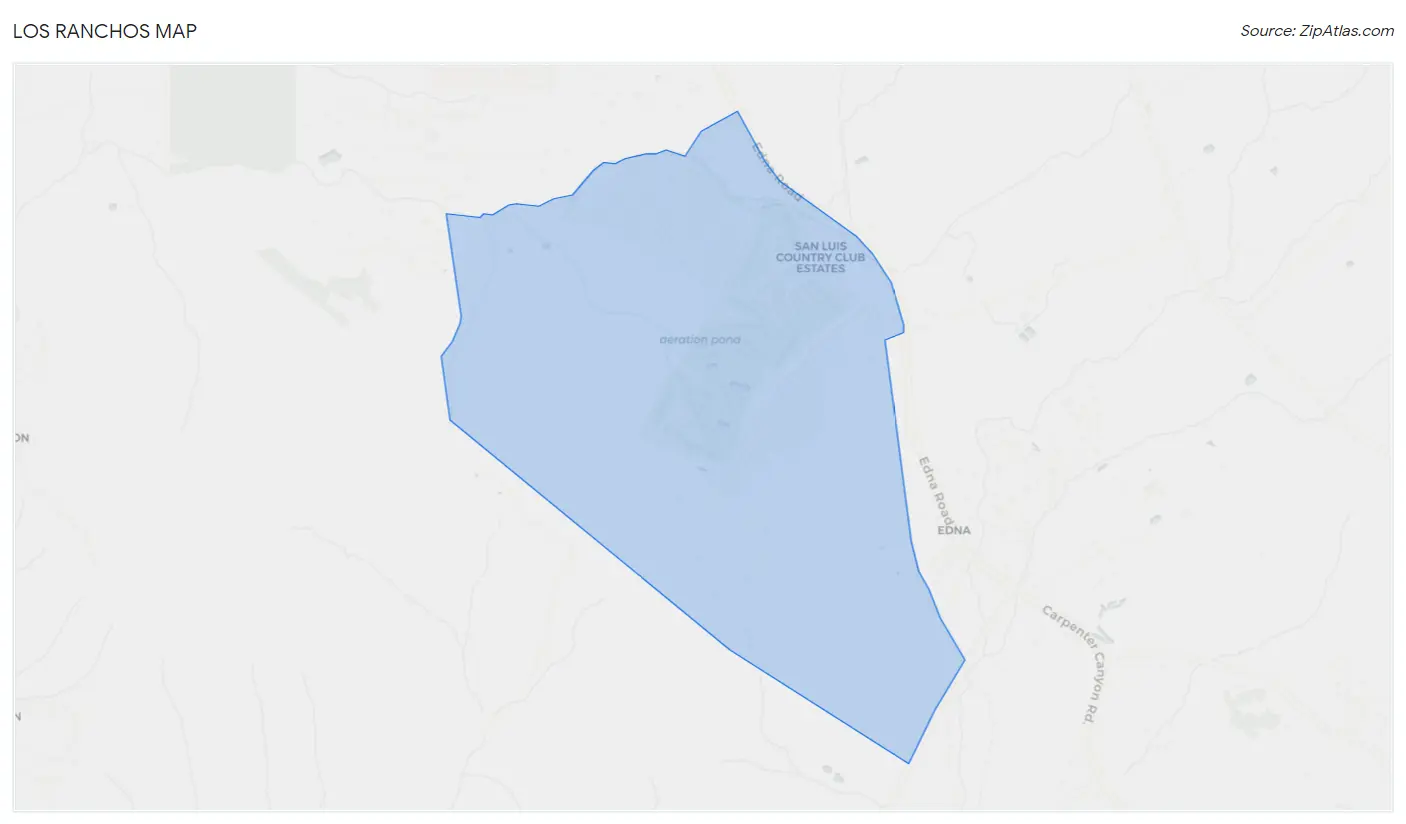
Los Ranchos Overview
$83,221
PER CAPITA INCOME
$154,000
AVG FAMILY INCOME
$148,500
AVG HOUSEHOLD INCOME
45.5%
WAGE / INCOME GAP [ % ]
54.5¢/ $1
WAGE / INCOME GAP [ $ ]
0.43
INEQUALITY / GINI INDEX
1,571
TOTAL POPULATION
774
MALE POPULATION
797
FEMALE POPULATION
97.11
MALES / 100 FEMALES
102.97
FEMALES / 100 MALES
53.7
MEDIAN AGE
2.9
AVG FAMILY SIZE
2.6
AVG HOUSEHOLD SIZE
615
LABOR FORCE [ PEOPLE ]
49.4%
PERCENT IN LABOR FORCE
2.6%
UNEMPLOYMENT RATE
Income in Los Ranchos
Income Overview in Los Ranchos
Per Capita Income in Los Ranchos is $83,221, while median incomes of families and households are $154,000 and $148,500 respectively.
| Characteristic | Number | Measure |
| Per Capita Income | 1,571 | $83,221 |
| Median Family Income | 488 | $154,000 |
| Mean Family Income | 488 | $224,240 |
| Median Household Income | 614 | $148,500 |
| Mean Household Income | 614 | $213,326 |
| Income Deficit | 488 | $0 |
| Wage / Income Gap (%) | 1,571 | 45.46% |
| Wage / Income Gap ($) | 1,571 | 54.54¢ per $1 |
| Gini / Inequality Index | 1,571 | 0.43 |
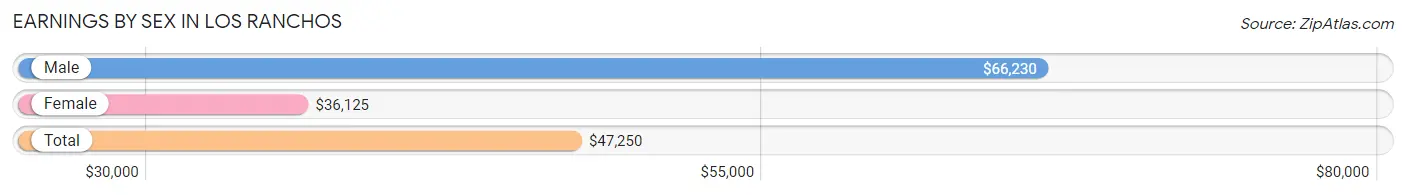
Earnings by Sex in Los Ranchos
Average Earnings in Los Ranchos are $47,250, $66,230 for men and $36,125 for women, a difference of 45.5%.
| Sex | Number | Average Earnings |
| Male | 263 (42.3%) | $66,230 |
| Female | 359 (57.7%) | $36,125 |
| Total | 622 (100.0%) | $47,250 |
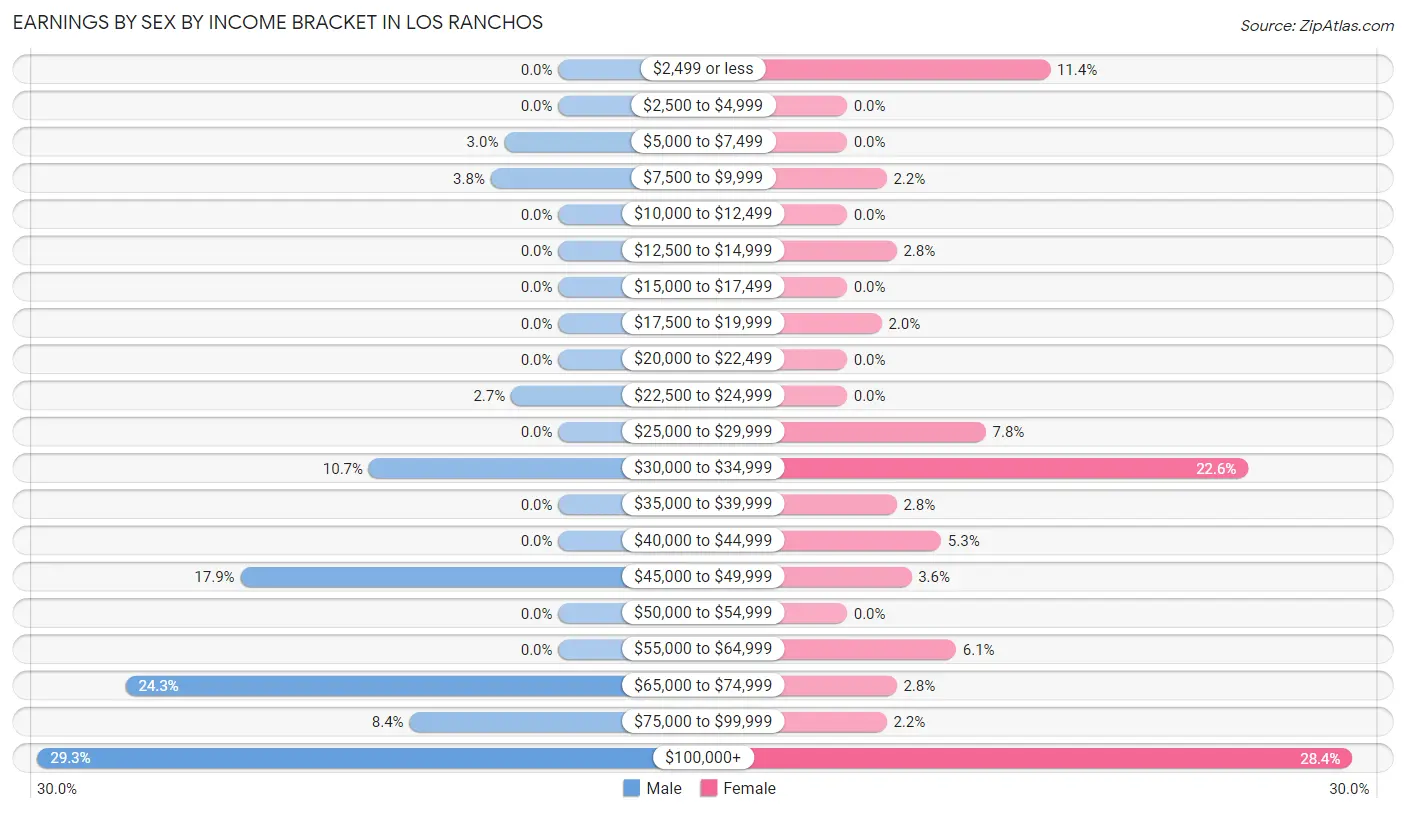
Earnings by Sex by Income Bracket in Los Ranchos
The most common earnings brackets in Los Ranchos are $100,000+ for men (77 | 29.3%) and $100,000+ for women (102 | 28.4%).
| Income | Male | Female |
| $2,499 or less | 0 (0.0%) | 41 (11.4%) |
| $2,500 to $4,999 | 0 (0.0%) | 0 (0.0%) |
| $5,000 to $7,499 | 8 (3.0%) | 0 (0.0%) |
| $7,500 to $9,999 | 10 (3.8%) | 8 (2.2%) |
| $10,000 to $12,499 | 0 (0.0%) | 0 (0.0%) |
| $12,500 to $14,999 | 0 (0.0%) | 10 (2.8%) |
| $15,000 to $17,499 | 0 (0.0%) | 0 (0.0%) |
| $17,500 to $19,999 | 0 (0.0%) | 7 (1.9%) |
| $20,000 to $22,499 | 0 (0.0%) | 0 (0.0%) |
| $22,500 to $24,999 | 7 (2.7%) | 0 (0.0%) |
| $25,000 to $29,999 | 0 (0.0%) | 28 (7.8%) |
| $30,000 to $34,999 | 28 (10.6%) | 81 (22.6%) |
| $35,000 to $39,999 | 0 (0.0%) | 10 (2.8%) |
| $40,000 to $44,999 | 0 (0.0%) | 19 (5.3%) |
| $45,000 to $49,999 | 47 (17.9%) | 13 (3.6%) |
| $50,000 to $54,999 | 0 (0.0%) | 0 (0.0%) |
| $55,000 to $64,999 | 0 (0.0%) | 22 (6.1%) |
| $65,000 to $74,999 | 64 (24.3%) | 10 (2.8%) |
| $75,000 to $99,999 | 22 (8.4%) | 8 (2.2%) |
| $100,000+ | 77 (29.3%) | 102 (28.4%) |
| Total | 263 (100.0%) | 359 (100.0%) |
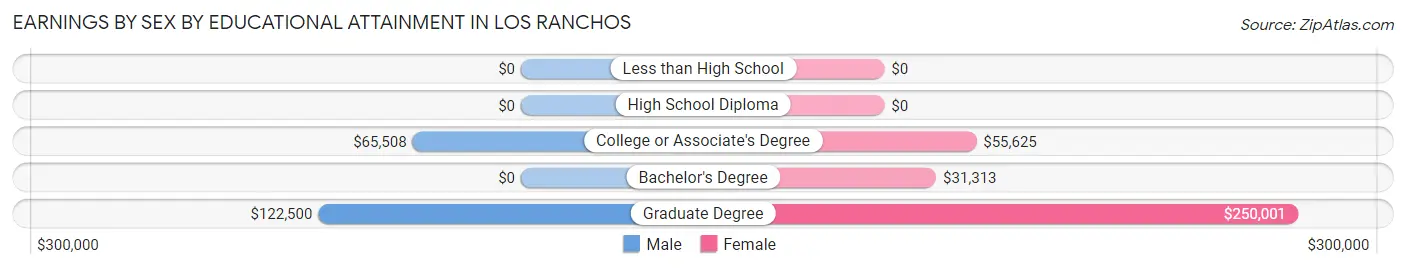
Earnings by Sex by Educational Attainment in Los Ranchos
Average earnings in Los Ranchos are $66,230 for men and $38,750 for women, a difference of 41.5%. Men with an educational attainment of graduate degree enjoy the highest average annual earnings of $122,500, while those with college or associate's degree education earn the least with $65,508. Women with an educational attainment of graduate degree earn the most with the average annual earnings of $250,001, while those with bachelor's degree education have the smallest earnings of $31,313.
| Educational Attainment | Male Income | Female Income |
| Less than High School | - | - |
| High School Diploma | - | - |
| College or Associate's Degree | $65,508 | $55,625 |
| Bachelor's Degree | - | - |
| Graduate Degree | $122,500 | $250,001 |
| Total | $66,230 | $38,750 |
Family Income in Los Ranchos
Family Income Brackets in Los Ranchos
According to the Los Ranchos family income data, there are 195 families falling into the $200,000+ income range, which is the most common income bracket and makes up 40.0% of all families.
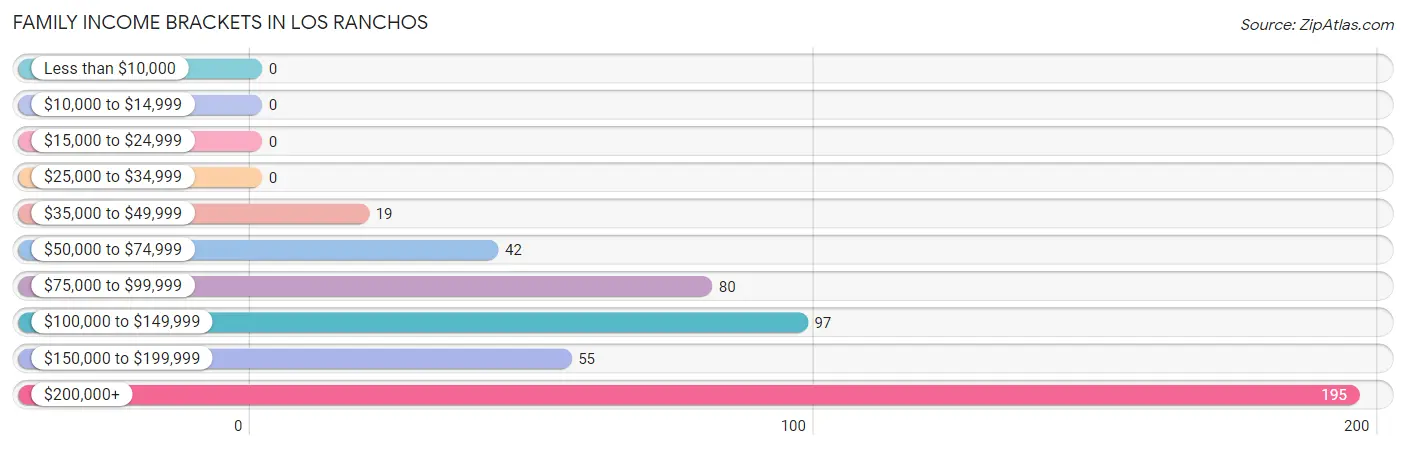
| Income Bracket | # Families | % Families |
| Less than $10,000 | 0 | 0.0% |
| $10,000 to $14,999 | 0 | 0.0% |
| $15,000 to $24,999 | 0 | 0.0% |
| $25,000 to $34,999 | 0 | 0.0% |
| $35,000 to $49,999 | 19 | 3.9% |
| $50,000 to $74,999 | 42 | 8.6% |
| $75,000 to $99,999 | 80 | 16.4% |
| $100,000 to $149,999 | 97 | 19.9% |
| $150,000 to $199,999 | 55 | 11.3% |
| $200,000+ | 195 | 40.0% |
Family Income by Famaliy Size in Los Ranchos
2-person families (316 | 64.7%) account for the highest median family income in Los Ranchos with $175,143 per family, while 2-person families (316 | 64.7%) have the highest median income of $87,572 per family member.
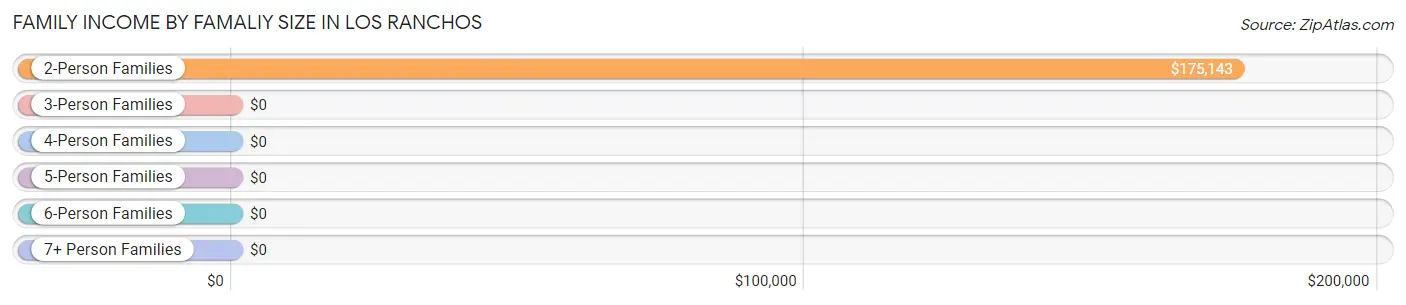
| Income Bracket | # Families | Median Income |
| 2-Person Families | 316 (64.7%) | $175,143 |
| 3-Person Families | 67 (13.7%) | $0 |
| 4-Person Families | 39 (8.0%) | $0 |
| 5-Person Families | 26 (5.3%) | $0 |
| 6-Person Families | 40 (8.2%) | $0 |
| 7+ Person Families | 0 (0.0%) | $0 |
| Total | 488 (100.0%) | $154,000 |
Family Income by Number of Earners in Los Ranchos
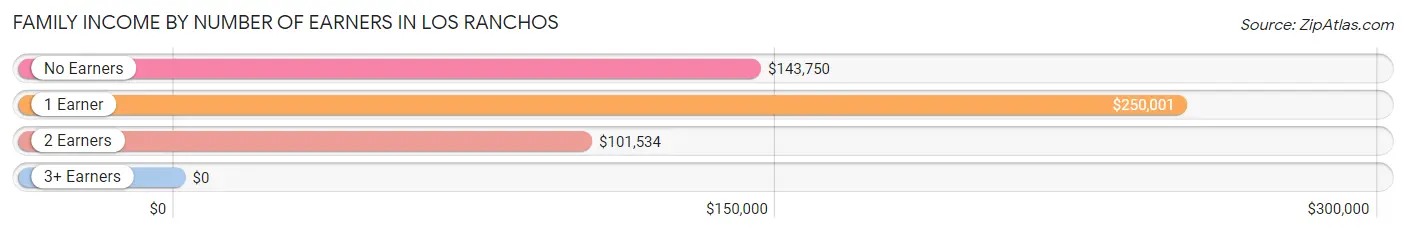
| Number of Earners | # Families | Median Income |
| No Earners | 167 (34.2%) | $143,750 |
| 1 Earner | 138 (28.3%) | $250,001 |
| 2 Earners | 167 (34.2%) | $101,534 |
| 3+ Earners | 16 (3.3%) | $0 |
| Total | 488 (100.0%) | $154,000 |
Household Income in Los Ranchos
Household Income Brackets in Los Ranchos
With 219 households falling in the category, the $200,000+ income range is the most frequent in Los Ranchos, accounting for 35.7% of all households.
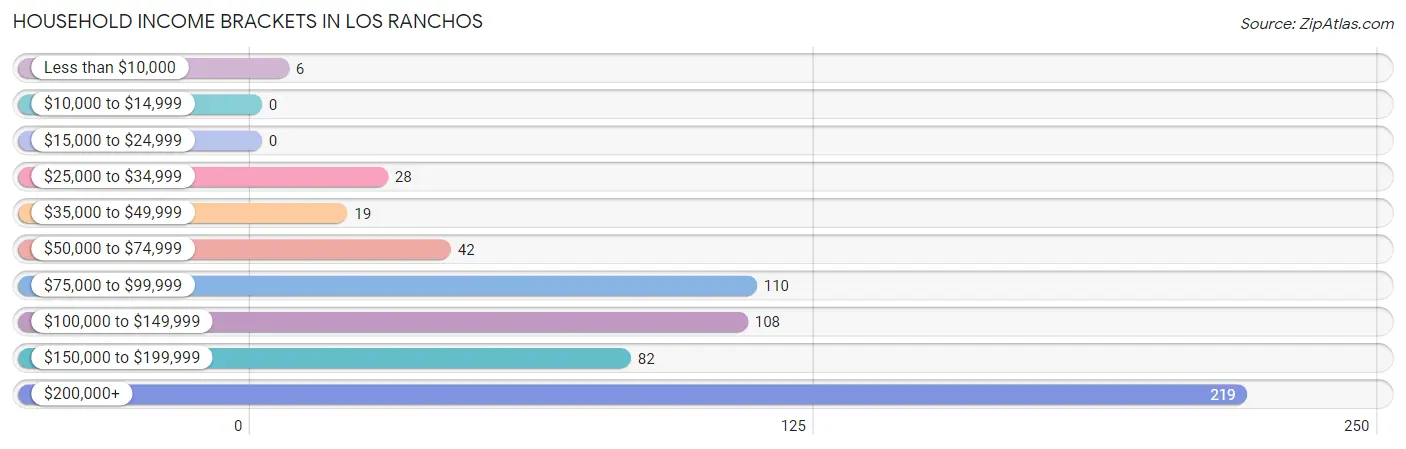
| Income Bracket | # Households | % Households |
| Less than $10,000 | 6 | 1.0% |
| $10,000 to $14,999 | 0 | 0.0% |
| $15,000 to $24,999 | 0 | 0.0% |
| $25,000 to $34,999 | 28 | 4.6% |
| $35,000 to $49,999 | 19 | 3.1% |
| $50,000 to $74,999 | 42 | 6.8% |
| $75,000 to $99,999 | 110 | 17.9% |
| $100,000 to $149,999 | 108 | 17.6% |
| $150,000 to $199,999 | 82 | 13.4% |
| $200,000+ | 219 | 35.7% |
Household Income by Householder Age in Los Ranchos
The median household income in Los Ranchos is $148,500, with the highest median household income of $149,750 found in the 65+ years age bracket for the primary householder. A total of 274 households (44.6%) fall into this category.
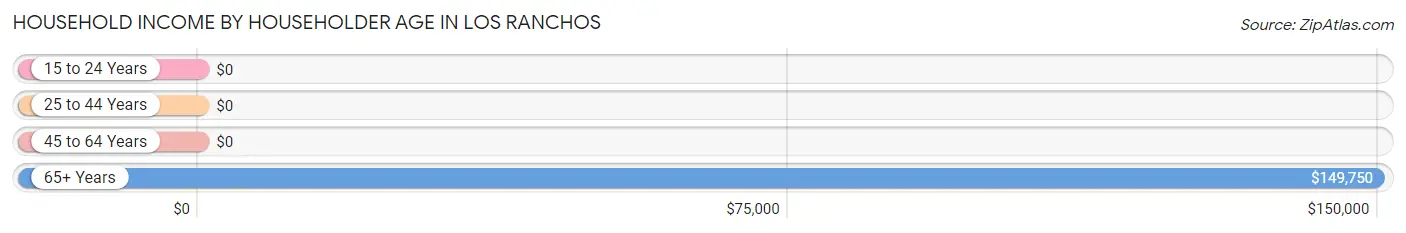
| Income Bracket | # Households | Median Income |
| 15 to 24 Years | 0 (0.0%) | $0 |
| 25 to 44 Years | 139 (22.6%) | $0 |
| 45 to 64 Years | 201 (32.7%) | $0 |
| 65+ Years | 274 (44.6%) | $149,750 |
| Total | 614 (100.0%) | $148,500 |
Poverty in Los Ranchos
Income Below Poverty by Sex and Age in Los Ranchos
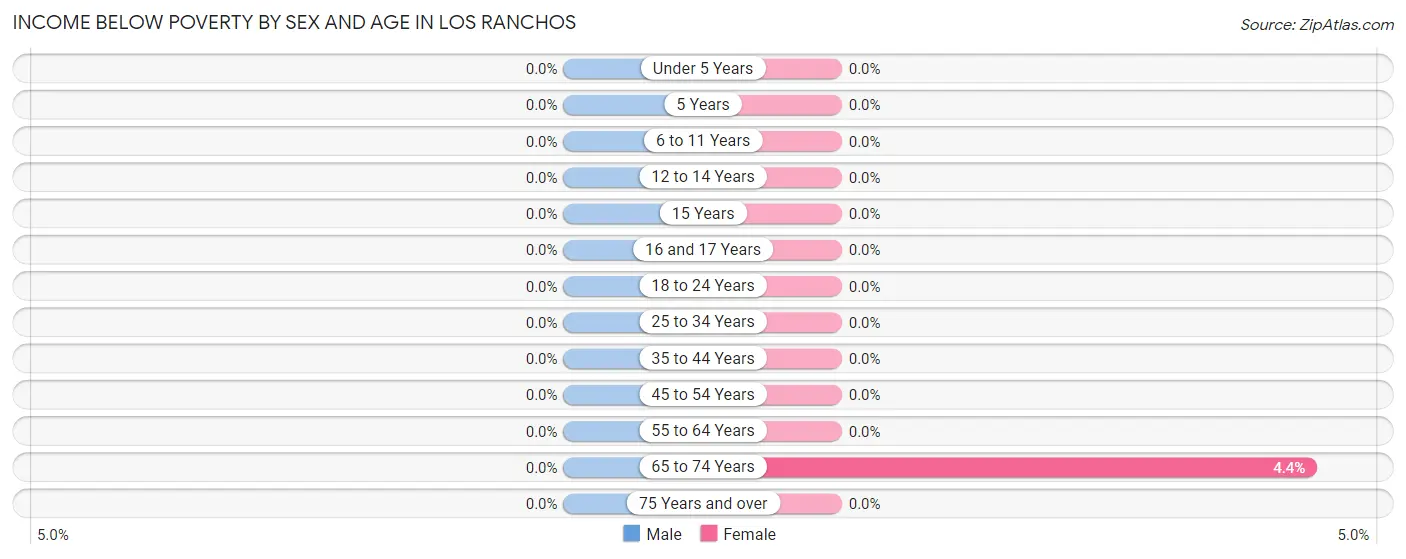
| Age Bracket | Male | Female |
| Under 5 Years | 0 (0.0%) | 0 (0.0%) |
| 5 Years | 0 (0.0%) | 0 (0.0%) |
| 6 to 11 Years | 0 (0.0%) | 0 (0.0%) |
| 12 to 14 Years | 0 (0.0%) | 0 (0.0%) |
| 15 Years | 0 (0.0%) | 0 (0.0%) |
| 16 and 17 Years | 0 (0.0%) | 0 (0.0%) |
| 18 to 24 Years | 0 (0.0%) | 0 (0.0%) |
| 25 to 34 Years | 0 (0.0%) | 0 (0.0%) |
| 35 to 44 Years | 0 (0.0%) | 0 (0.0%) |
| 45 to 54 Years | 0 (0.0%) | 0 (0.0%) |
| 55 to 64 Years | 0 (0.0%) | 0 (0.0%) |
| 65 to 74 Years | 0 (0.0%) | 6 (4.4%) |
| 75 Years and over | 0 (0.0%) | 0 (0.0%) |
| Total | 0 (0.0%) | 6 (0.7%) |
Income Above Poverty by Sex and Age in Los Ranchos
According to the poverty statistics in Los Ranchos, males aged under 5 years and females aged 6 to 11 years are the age groups that are most secure financially, with 100.0% of males and 100.0% of females in these age groups living above the poverty line.
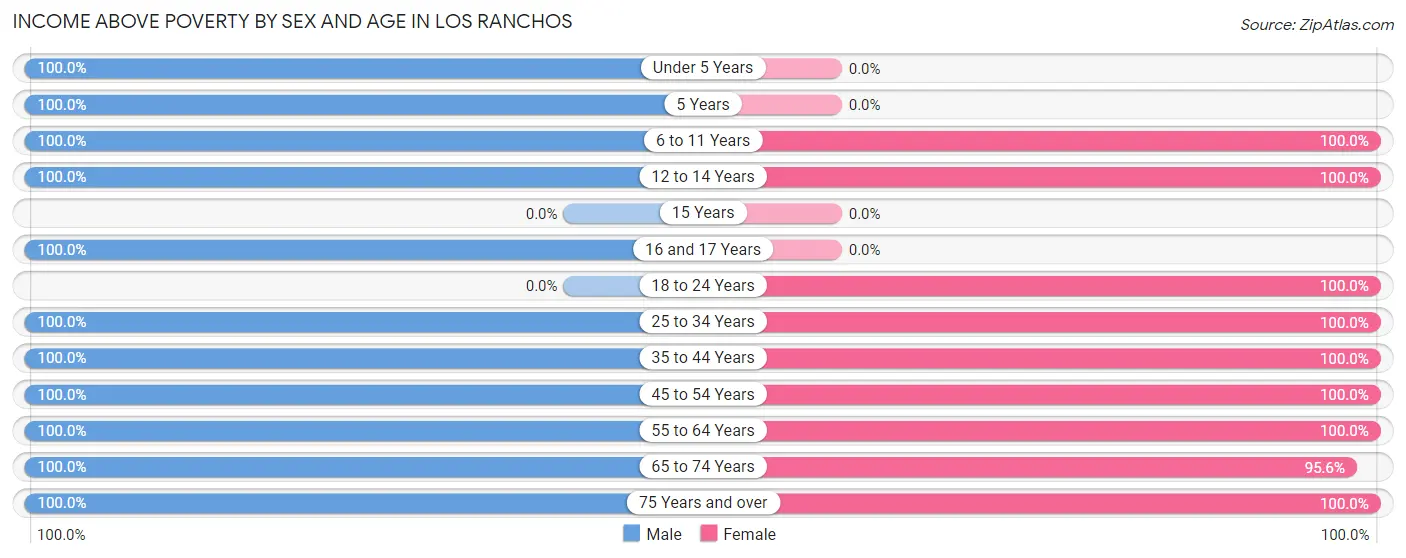
| Age Bracket | Male | Female |
| Under 5 Years | 56 (100.0%) | 0 (0.0%) |
| 5 Years | 29 (100.0%) | 0 (0.0%) |
| 6 to 11 Years | 11 (100.0%) | 158 (100.0%) |
| 12 to 14 Years | 39 (100.0%) | 34 (100.0%) |
| 15 Years | 0 (0.0%) | 0 (0.0%) |
| 16 and 17 Years | 70 (100.0%) | 0 (0.0%) |
| 18 to 24 Years | 0 (0.0%) | 11 (100.0%) |
| 25 to 34 Years | 43 (100.0%) | 30 (100.0%) |
| 35 to 44 Years | 50 (100.0%) | 94 (100.0%) |
| 45 to 54 Years | 77 (100.0%) | 107 (100.0%) |
| 55 to 64 Years | 163 (100.0%) | 100 (100.0%) |
| 65 to 74 Years | 112 (100.0%) | 130 (95.6%) |
| 75 Years and over | 124 (100.0%) | 127 (100.0%) |
| Total | 774 (100.0%) | 791 (99.3%) |
Income Below Poverty Among Married-Couple Families in Los Ranchos
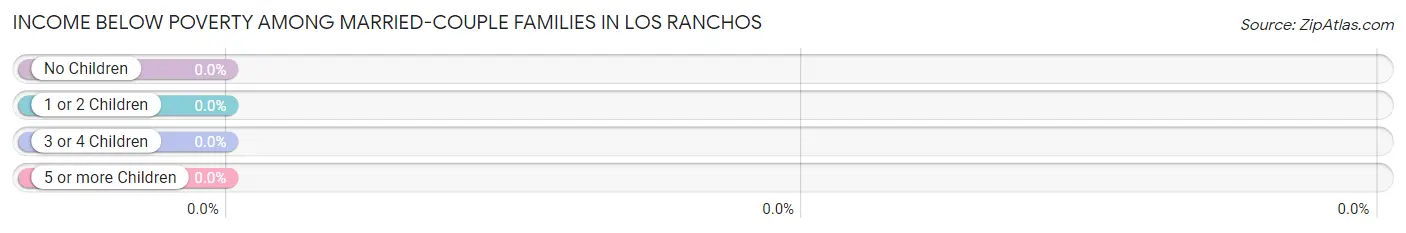
| Children | Above Poverty | Below Poverty |
| No Children | 300 (100.0%) | 0 (0.0%) |
| 1 or 2 Children | 99 (100.0%) | 0 (0.0%) |
| 3 or 4 Children | 61 (100.0%) | 0 (0.0%) |
| 5 or more Children | 0 (0.0%) | 0 (0.0%) |
| Total | 460 (100.0%) | 0 (0.0%) |
Income Below Poverty Among Single-Parent Households in Los Ranchos
| Children | Single Father | Single Mother |
| No Children | 0 (0.0%) | 0 (0.0%) |
| 1 or 2 Children | 0 (0.0%) | 0 (0.0%) |
| 3 or 4 Children | 0 (0.0%) | 0 (0.0%) |
| 5 or more Children | 0 (0.0%) | 0 (0.0%) |
| Total | 0 (0.0%) | 0 (0.0%) |
Income Below Poverty Among Married-Couple vs Single-Parent Households in Los Ranchos
| Children | Married-Couple Families | Single-Parent Households |
| No Children | 0 (0.0%) | 0 (0.0%) |
| 1 or 2 Children | 0 (0.0%) | 0 (0.0%) |
| 3 or 4 Children | 0 (0.0%) | 0 (0.0%) |
| 5 or more Children | 0 (0.0%) | 0 (0.0%) |
| Total | 0 (0.0%) | 0 (0.0%) |
Race in Los Ranchos
The most populous races in Los Ranchos are White / Caucasian (1,484 | 94.5%), Hispanic or Latino (136 | 8.7%), and Asian (53 | 3.4%).
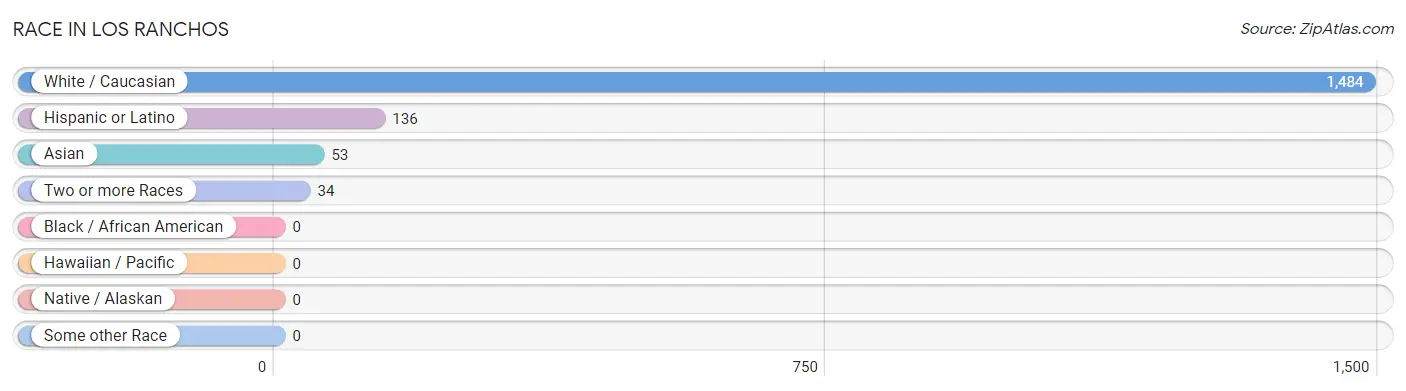
| Race | # Population | % Population |
| Asian | 53 | 3.4% |
| Black / African American | 0 | 0.0% |
| Hawaiian / Pacific | 0 | 0.0% |
| Hispanic or Latino | 136 | 8.7% |
| Native / Alaskan | 0 | 0.0% |
| White / Caucasian | 1,484 | 94.5% |
| Two or more Races | 34 | 2.2% |
| Some other Race | 0 | 0.0% |
| Total | 1,571 | 100.0% |
Ancestry in Los Ranchos
The most populous ancestries reported in Los Ranchos are German (375 | 23.9%), Italian (274 | 17.4%), Irish (257 | 16.4%), English (168 | 10.7%), and Mexican (113 | 7.2%), together accounting for 75.5% of all Los Ranchos residents.
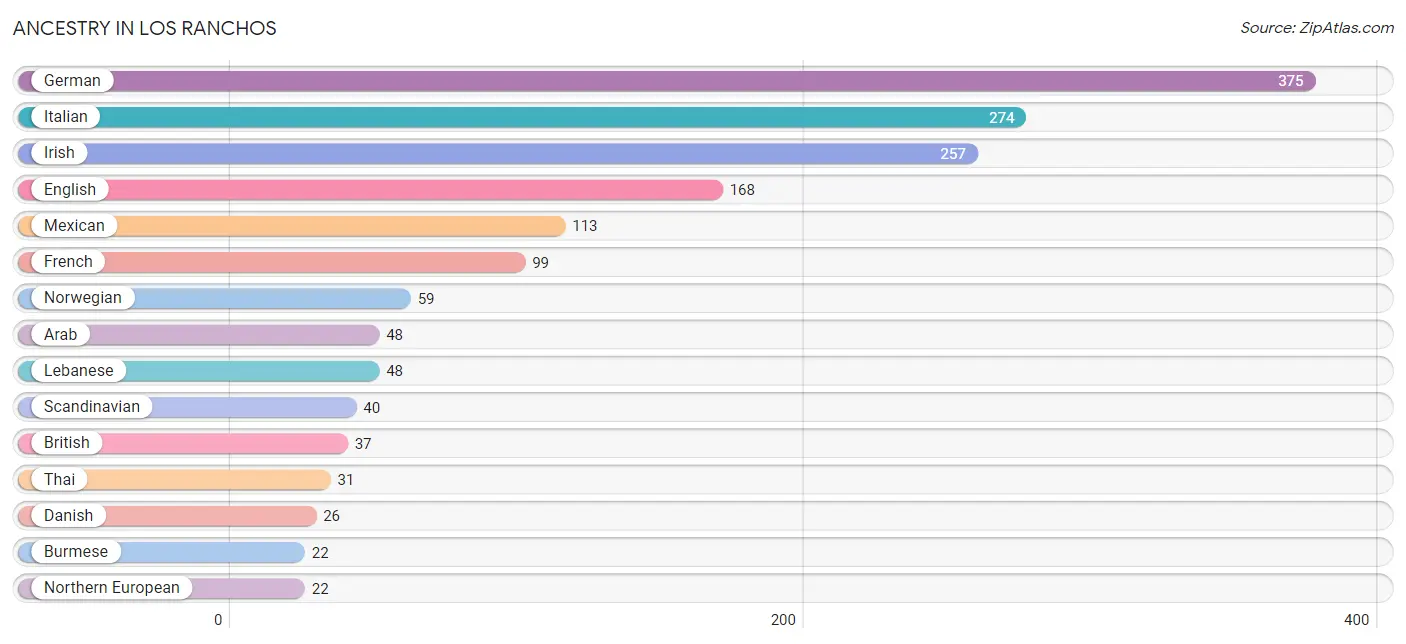
| Ancestry | # Population | % Population |
| American | 20 | 1.3% |
| Arab | 48 | 3.1% |
| British | 37 | 2.4% |
| Burmese | 22 | 1.4% |
| Central American | 11 | 0.7% |
| Costa Rican | 11 | 0.7% |
| Czech | 5 | 0.3% |
| Czechoslovakian | 4 | 0.3% |
| Danish | 26 | 1.7% |
| Dutch | 16 | 1.0% |
| English | 168 | 10.7% |
| French | 99 | 6.3% |
| French Canadian | 16 | 1.0% |
| German | 375 | 23.9% |
| Indian (Asian) | 12 | 0.8% |
| Irish | 257 | 16.4% |
| Italian | 274 | 17.4% |
| Lebanese | 48 | 3.1% |
| Mexican | 113 | 7.2% |
| Northern European | 22 | 1.4% |
| Norwegian | 59 | 3.8% |
| Polish | 8 | 0.5% |
| Russian | 17 | 1.1% |
| Scandinavian | 40 | 2.5% |
| Scotch-Irish | 11 | 0.7% |
| Scottish | 10 | 0.6% |
| Slovak | 12 | 0.8% |
| Spaniard | 12 | 0.8% |
| Swiss | 12 | 0.8% |
| Thai | 31 | 2.0% | View All 30 Rows |
Immigrants in Los Ranchos
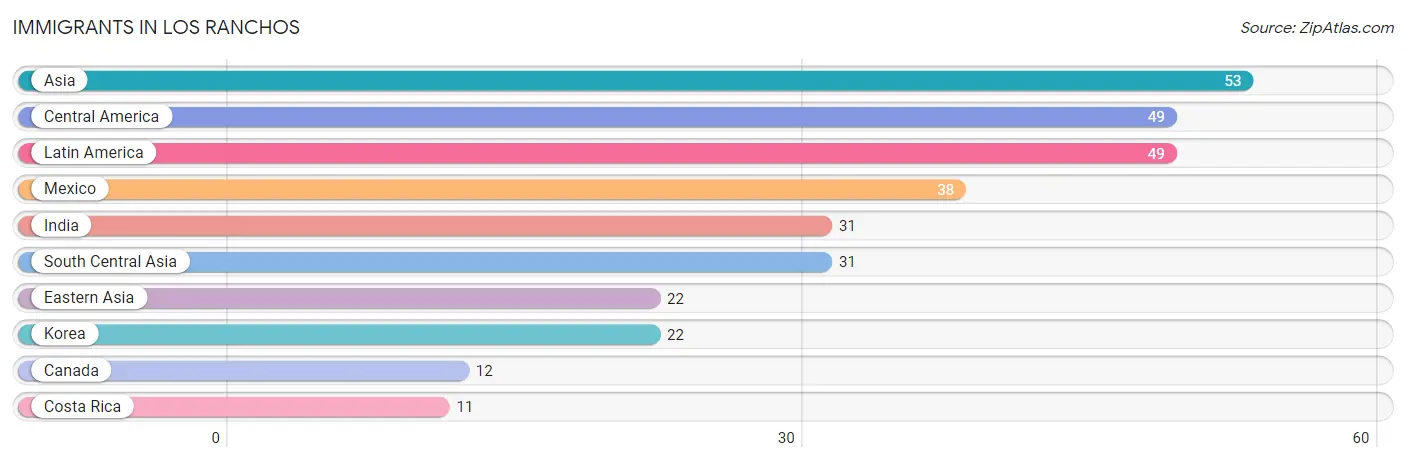
The most numerous immigrant groups reported in Los Ranchos came from Asia (53 | 3.4%), Central America (49 | 3.1%), Latin America (49 | 3.1%), Mexico (38 | 2.4%), and India (31 | 2.0%), together accounting for 14.0% of all Los Ranchos residents.
| Immigration Origin | # Population | % Population |
| Asia | 53 | 3.4% |
| Canada | 12 | 0.8% |
| Central America | 49 | 3.1% |
| Costa Rica | 11 | 0.7% |
| Eastern Asia | 22 | 1.4% |
| India | 31 | 2.0% |
| Korea | 22 | 1.4% |
| Latin America | 49 | 3.1% |
| Mexico | 38 | 2.4% |
| South Central Asia | 31 | 2.0% | View All 10 Rows |
Sex and Age in Los Ranchos
Sex and Age in Los Ranchos
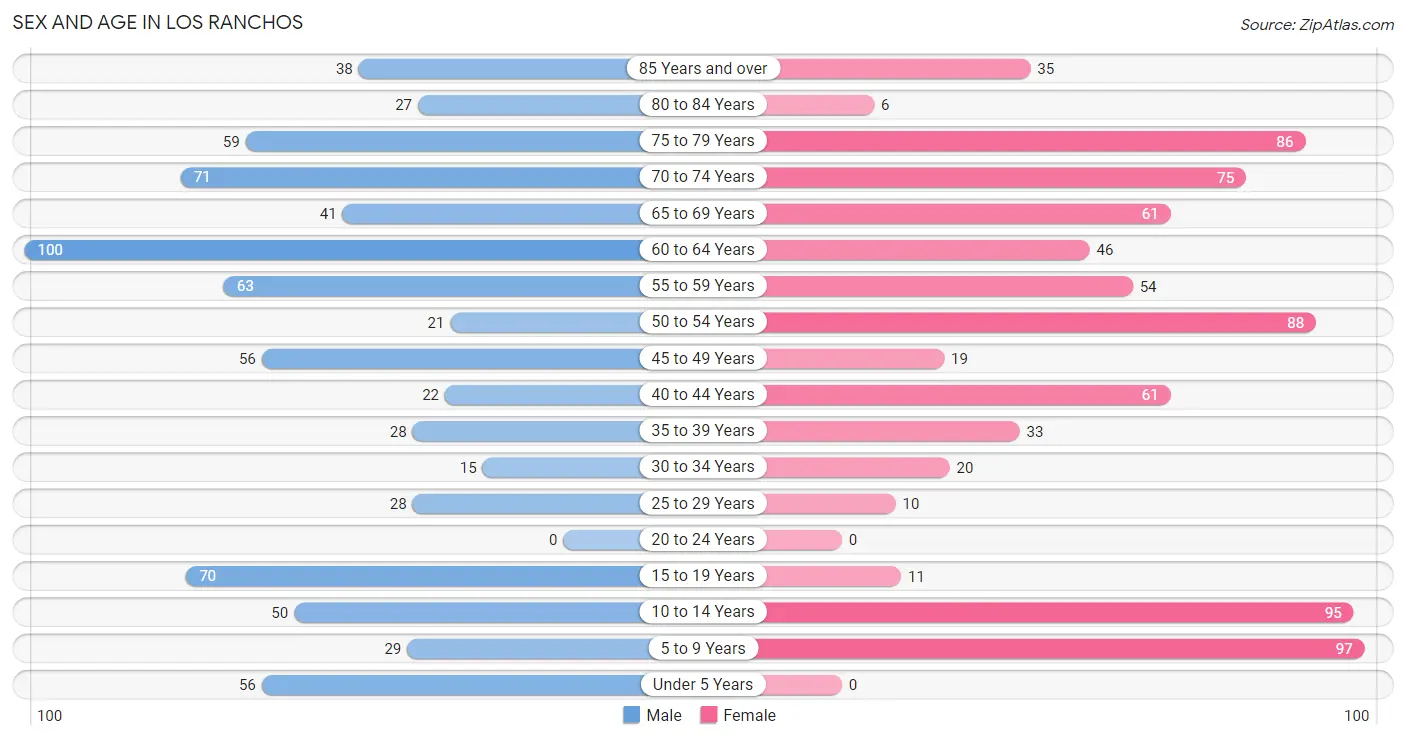
The most populous age groups in Los Ranchos are 60 to 64 Years (100 | 12.9%) for men and 5 to 9 Years (97 | 12.2%) for women.
| Age Bracket | Male | Female |
| Under 5 Years | 56 (7.2%) | 0 (0.0%) |
| 5 to 9 Years | 29 (3.7%) | 97 (12.2%) |
| 10 to 14 Years | 50 (6.5%) | 95 (11.9%) |
| 15 to 19 Years | 70 (9.0%) | 11 (1.4%) |
| 20 to 24 Years | 0 (0.0%) | 0 (0.0%) |
| 25 to 29 Years | 28 (3.6%) | 10 (1.3%) |
| 30 to 34 Years | 15 (1.9%) | 20 (2.5%) |
| 35 to 39 Years | 28 (3.6%) | 33 (4.1%) |
| 40 to 44 Years | 22 (2.8%) | 61 (7.6%) |
| 45 to 49 Years | 56 (7.2%) | 19 (2.4%) |
| 50 to 54 Years | 21 (2.7%) | 88 (11.0%) |
| 55 to 59 Years | 63 (8.1%) | 54 (6.8%) |
| 60 to 64 Years | 100 (12.9%) | 46 (5.8%) |
| 65 to 69 Years | 41 (5.3%) | 61 (7.6%) |
| 70 to 74 Years | 71 (9.2%) | 75 (9.4%) |
| 75 to 79 Years | 59 (7.6%) | 86 (10.8%) |
| 80 to 84 Years | 27 (3.5%) | 6 (0.7%) |
| 85 Years and over | 38 (4.9%) | 35 (4.4%) |
| Total | 774 (100.0%) | 797 (100.0%) |
Families and Households in Los Ranchos
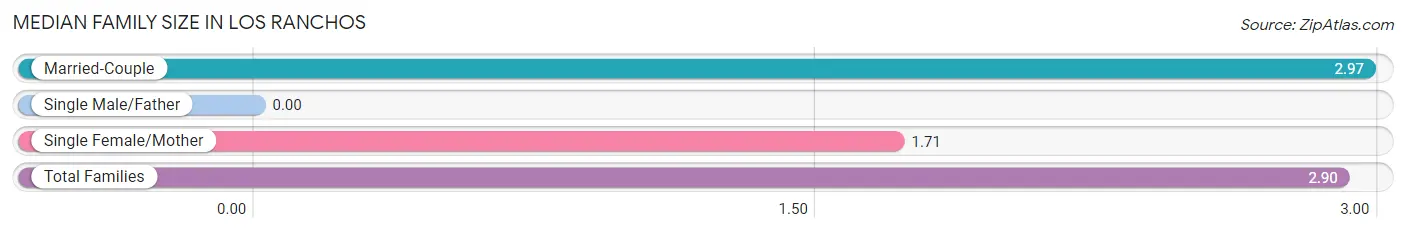
Median Family Size in Los Ranchos
| Family Type | # Families | Family Size |
| Married-Couple | 460 (94.3%) | 2.97 |
| Single Male/Father | 0 (0.0%) | - |
| Single Female/Mother | 28 (5.7%) | 1.71 |
| Total Families | 488 (100.0%) | 2.90 |
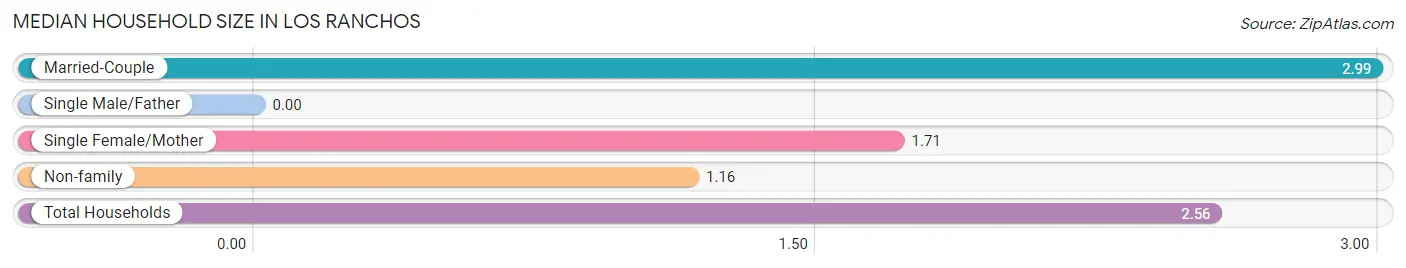
Median Household Size in Los Ranchos
| Household Type | # Households | Household Size |
| Married-Couple | 460 (74.9%) | 2.99 |
| Single Male/Father | 0 (0.0%) | - |
| Single Female/Mother | 28 (4.6%) | 1.71 |
| Non-family | 126 (20.5%) | 1.16 |
| Total Households | 614 (100.0%) | 2.56 |
Household Size by Marriage Status in Los Ranchos
Out of a total of 614 households in Los Ranchos, 488 (79.5%) are family households, while 126 (20.5%) are nonfamily households. The most numerous type of family households are 2-person households, comprising 305, and the most common type of nonfamily households are 1-person households, comprising 105.
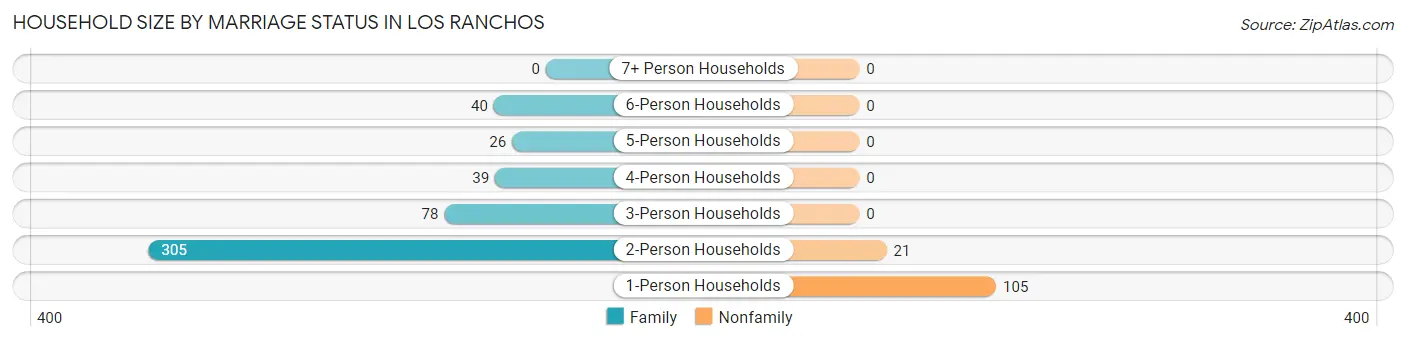
| Household Size | Family Households | Nonfamily Households |
| 1-Person Households | - | 105 (17.1%) |
| 2-Person Households | 305 (49.7%) | 21 (3.4%) |
| 3-Person Households | 78 (12.7%) | 0 (0.0%) |
| 4-Person Households | 39 (6.4%) | 0 (0.0%) |
| 5-Person Households | 26 (4.2%) | 0 (0.0%) |
| 6-Person Households | 40 (6.5%) | 0 (0.0%) |
| 7+ Person Households | 0 (0.0%) | 0 (0.0%) |
| Total | 488 (79.5%) | 126 (20.5%) |
Female Fertility in Los Ranchos
Fertility by Age in Los Ranchos
| Age Bracket | Women with Births | Births / 1,000 Women |
| 15 to 19 years | 0 (0.0%) | 0.0 |
| 20 to 34 years | 0 (0.0%) | 0.0 |
| 35 to 50 years | 0 (0.0%) | 0.0 |
| Total | 0 (0.0%) | 0.0 |
Fertility by Age by Marriage Status in Los Ranchos
| Age Bracket | Married | Unmarried |
| 15 to 19 years | 0 (0.0%) | 0 (0.0%) |
| 20 to 34 years | 0 (0.0%) | 0 (0.0%) |
| 35 to 50 years | 0 (0.0%) | 0 (0.0%) |
| Total | 0 (0.0%) | 0 (0.0%) |
Fertility by Education in Los Ranchos
| Educational Attainment | Women with Births | Births / 1,000 Women |
| Less than High School | 0 (0.0%) | 0.0 |
| High School Diploma | 0 (0.0%) | 0.0 |
| College or Associate's Degree | 0 (0.0%) | 0.0 |
| Bachelor's Degree | 0 (0.0%) | 0.0 |
| Graduate Degree | 0 (0.0%) | 0.0 |
| Total | 0 (0.0%) | 0.0 |
Fertility by Education by Marriage Status in Los Ranchos
| Educational Attainment | Married | Unmarried |
| Less than High School | 0 (0.0%) | 0 (0.0%) |
| High School Diploma | 0 (0.0%) | 0 (0.0%) |
| College or Associate's Degree | 0 (0.0%) | 0 (0.0%) |
| Bachelor's Degree | 0 (0.0%) | 0 (0.0%) |
| Graduate Degree | 0 (0.0%) | 0 (0.0%) |
| Total | 0 (0.0%) | 0 (0.0%) |
Employment Characteristics in Los Ranchos
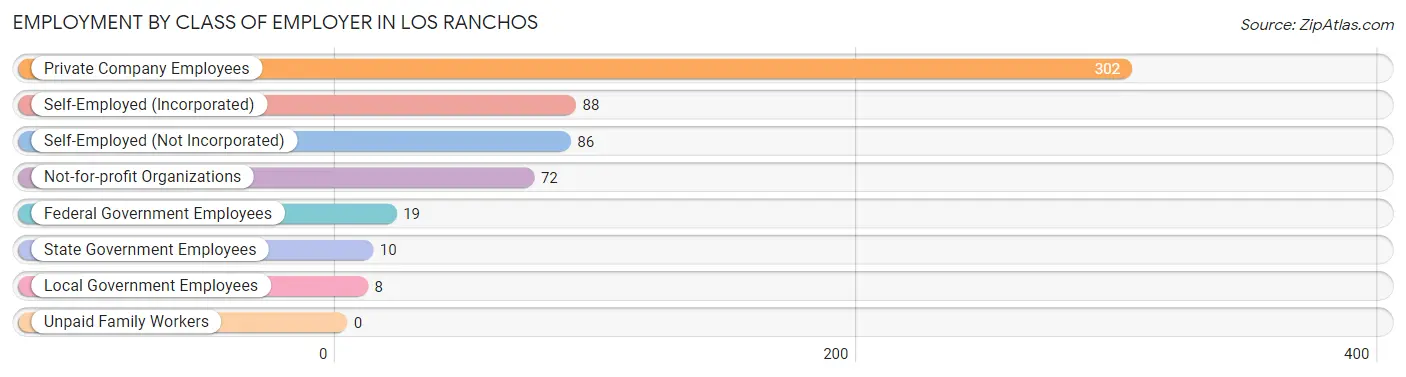
Employment by Class of Employer in Los Ranchos
Among the 585 employed individuals in Los Ranchos, private company employees (302 | 51.6%), self-employed (incorporated) (88 | 15.0%), and self-employed (not incorporated) (86 | 14.7%) make up the most common classes of employment.
| Employer Class | # Employees | % Employees |
| Private Company Employees | 302 | 51.6% |
| Self-Employed (Incorporated) | 88 | 15.0% |
| Self-Employed (Not Incorporated) | 86 | 14.7% |
| Not-for-profit Organizations | 72 | 12.3% |
| Local Government Employees | 8 | 1.4% |
| State Government Employees | 10 | 1.7% |
| Federal Government Employees | 19 | 3.3% |
| Unpaid Family Workers | 0 | 0.0% |
| Total | 585 | 100.0% |
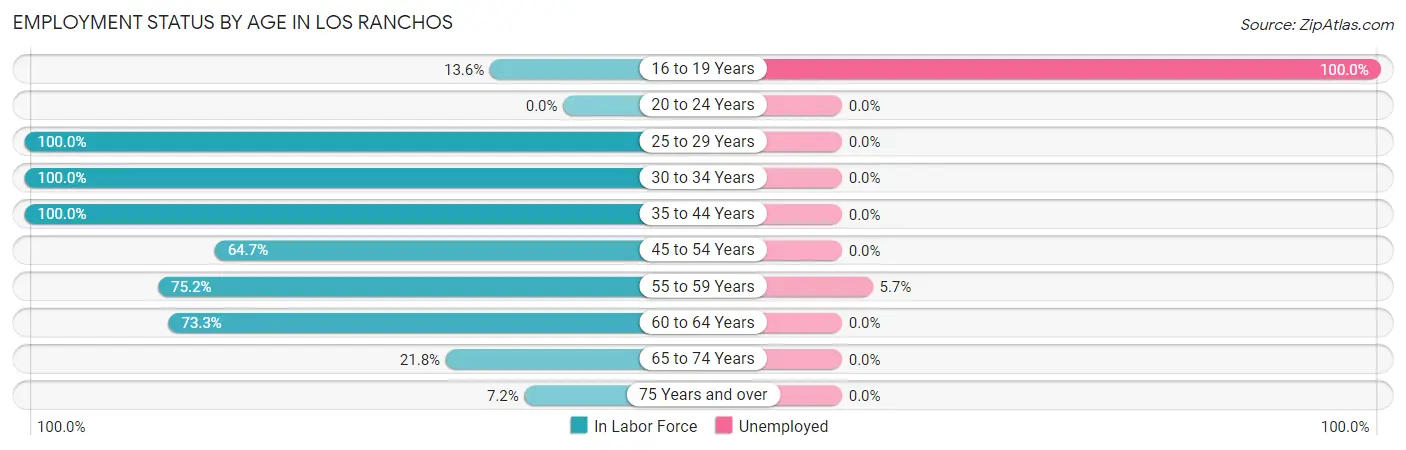
Employment Status by Age in Los Ranchos
According to the labor force statistics for Los Ranchos, out of the total population over 16 years of age (1,244), 49.4% or 615 individuals are in the labor force, with 2.6% or 16 of them unemployed. The age group with the highest labor force participation rate is 25 to 29 years, with 100.0% or 38 individuals in the labor force. Within the labor force, the 16 to 19 years age range has the highest percentage of unemployed individuals, with 100.0% or 11 of them being unemployed.
| Age Bracket | In Labor Force | Unemployed |
| 16 to 19 Years | 11 (13.6%) | 11 (100.0%) |
| 20 to 24 Years | 0 (0.0%) | 0 (0.0%) |
| 25 to 29 Years | 38 (100.0%) | 0 (0.0%) |
| 30 to 34 Years | 35 (100.0%) | 0 (0.0%) |
| 35 to 44 Years | 144 (100.0%) | 0 (0.0%) |
| 45 to 54 Years | 119 (64.7%) | 0 (0.0%) |
| 55 to 59 Years | 88 (75.2%) | 5 (5.7%) |
| 60 to 64 Years | 107 (73.3%) | 0 (0.0%) |
| 65 to 74 Years | 54 (21.8%) | 0 (0.0%) |
| 75 Years and over | 18 (7.2%) | 0 (0.0%) |
| Total | 615 (49.4%) | 16 (2.6%) |
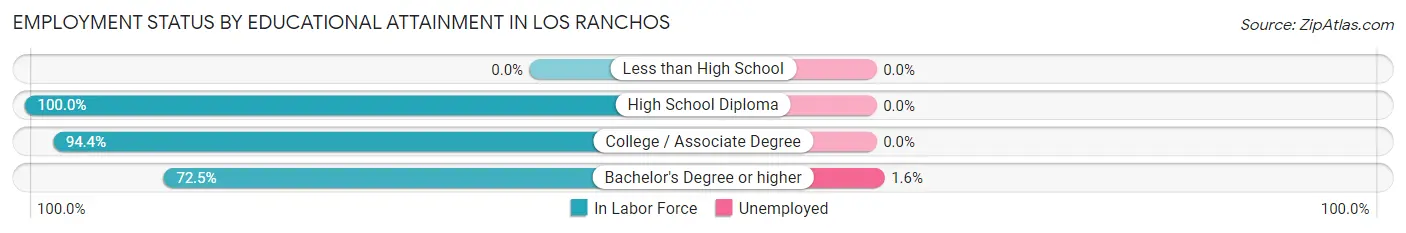
Employment Status by Educational Attainment in Los Ranchos
According to labor force statistics for Los Ranchos, 80.0% of individuals (531) out of the total population between 25 and 64 years of age (664) are in the labor force, with 0.9% or 5 of them being unemployed. The group with the highest labor force participation rate are those with the educational attainment of high school diploma, with 100.0% or 10 individuals in the labor force. Within the labor force, individuals with bachelor's degree or higher education have the highest percentage of unemployment, with 1.6% or 5 of them being unemployed.
| Educational Attainment | In Labor Force | Unemployed |
| Less than High School | 0 (0.0%) | 0 (0.0%) |
| High School Diploma | 10 (100.0%) | 0 (0.0%) |
| College / Associate Degree | 202 (94.4%) | 0 (0.0%) |
| Bachelor's Degree or higher | 319 (72.5%) | 7 (1.6%) |
| Total | 531 (80.0%) | 6 (0.9%) |
Employment Occupations by Sex in Los Ranchos
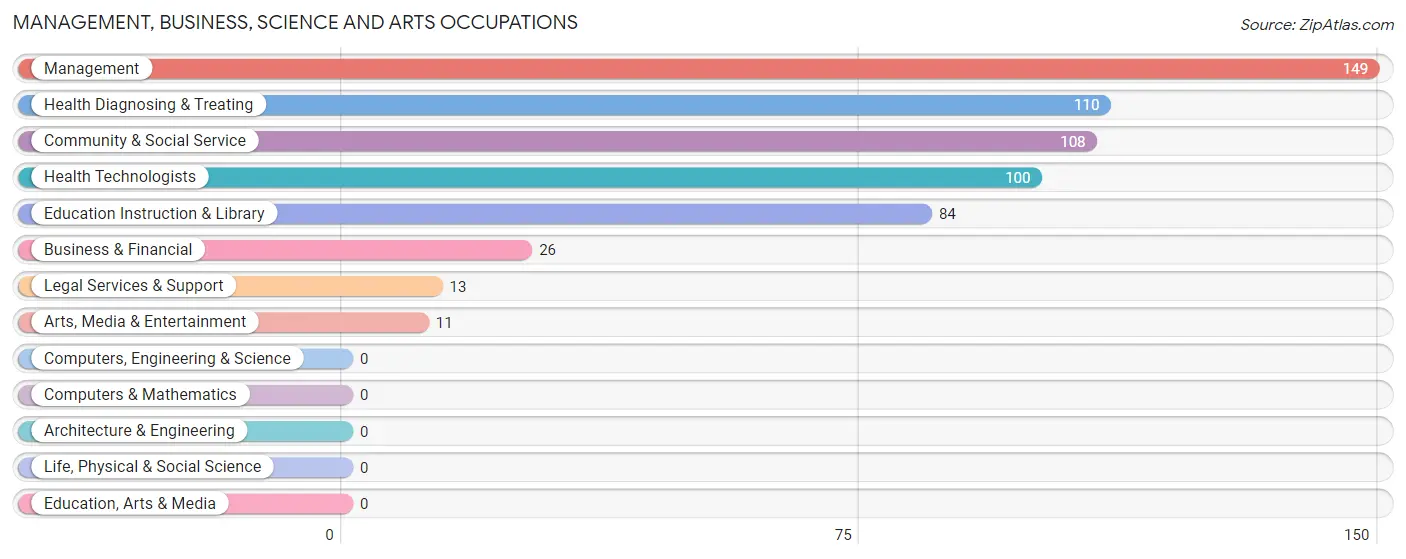
Management, Business, Science and Arts Occupations
The most common Management, Business, Science and Arts occupations in Los Ranchos are Management (149 | 24.9%), Health Diagnosing & Treating (110 | 18.4%), Community & Social Service (108 | 18.1%), Health Technologists (100 | 16.7%), and Education Instruction & Library (84 | 14.1%).
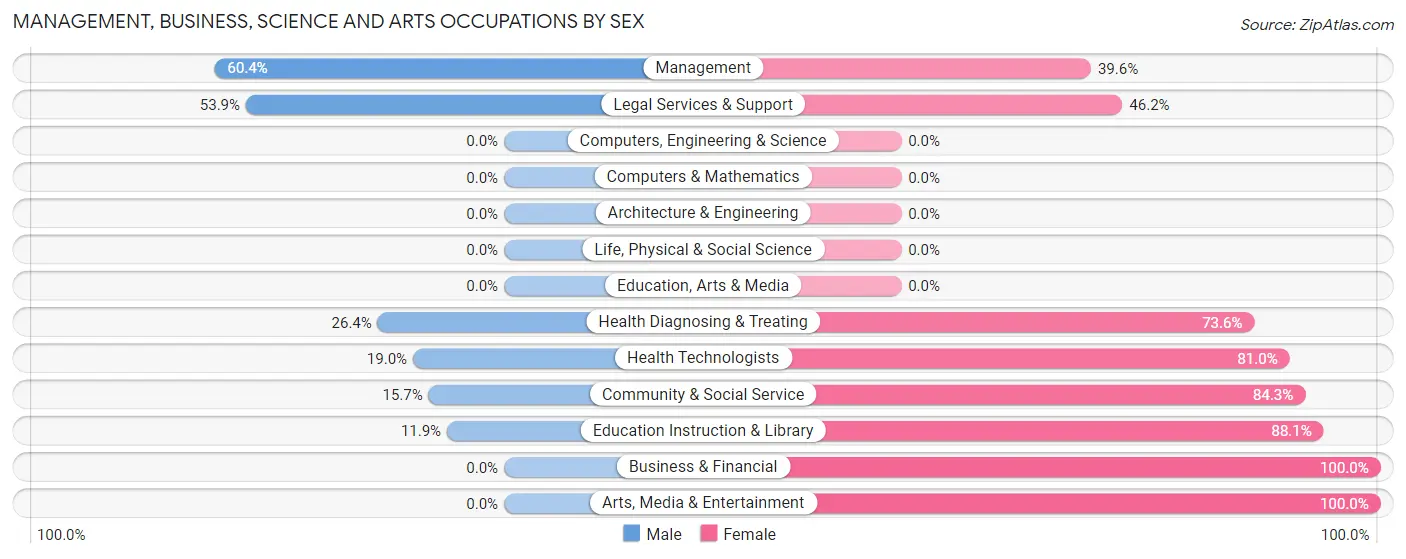
Management, Business, Science and Arts Occupations by Sex
Within the Management, Business, Science and Arts occupations in Los Ranchos, the most male-oriented occupations are Management (60.4%), Legal Services & Support (53.8%), and Health Diagnosing & Treating (26.4%), while the most female-oriented occupations are Business & Financial (100.0%), Arts, Media & Entertainment (100.0%), and Education Instruction & Library (88.1%).
| Occupation | Male | Female |
| Management | 90 (60.4%) | 59 (39.6%) |
| Business & Financial | 0 (0.0%) | 26 (100.0%) |
| Computers, Engineering & Science | 0 (0.0%) | 0 (0.0%) |
| Computers & Mathematics | 0 (0.0%) | 0 (0.0%) |
| Architecture & Engineering | 0 (0.0%) | 0 (0.0%) |
| Life, Physical & Social Science | 0 (0.0%) | 0 (0.0%) |
| Community & Social Service | 17 (15.7%) | 91 (84.3%) |
| Education, Arts & Media | 0 (0.0%) | 0 (0.0%) |
| Legal Services & Support | 7 (53.8%) | 6 (46.2%) |
| Education Instruction & Library | 10 (11.9%) | 74 (88.1%) |
| Arts, Media & Entertainment | 0 (0.0%) | 11 (100.0%) |
| Health Diagnosing & Treating | 29 (26.4%) | 81 (73.6%) |
| Health Technologists | 19 (19.0%) | 81 (81.0%) |
| Total (Category) | 136 (34.6%) | 257 (65.4%) |
| Total (Overall) | 255 (42.6%) | 343 (57.4%) |
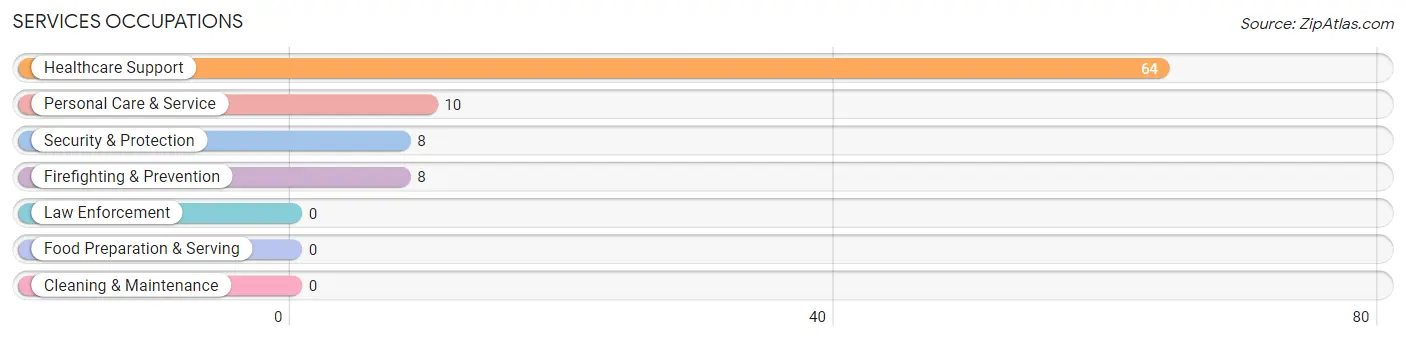
Services Occupations
The most common Services occupations in Los Ranchos are Healthcare Support (64 | 10.7%), Personal Care & Service (10 | 1.7%), Security & Protection (8 | 1.3%), and Firefighting & Prevention (8 | 1.3%).
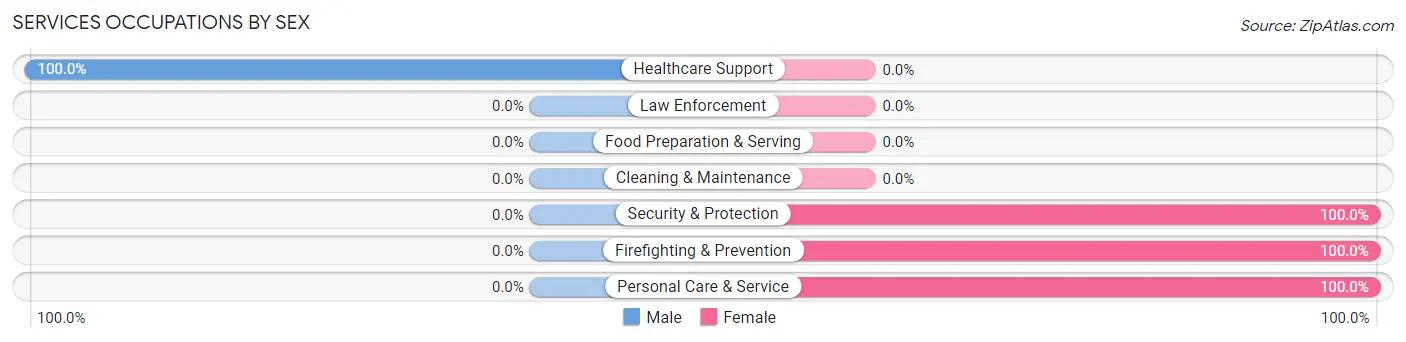
Services Occupations by Sex
| Occupation | Male | Female |
| Healthcare Support | 64 (100.0%) | 0 (0.0%) |
| Security & Protection | 0 (0.0%) | 8 (100.0%) |
| Firefighting & Prevention | 0 (0.0%) | 8 (100.0%) |
| Law Enforcement | 0 (0.0%) | 0 (0.0%) |
| Food Preparation & Serving | 0 (0.0%) | 0 (0.0%) |
| Cleaning & Maintenance | 0 (0.0%) | 0 (0.0%) |
| Personal Care & Service | 0 (0.0%) | 10 (100.0%) |
| Total (Category) | 64 (78.0%) | 18 (22.0%) |
| Total (Overall) | 255 (42.6%) | 343 (57.4%) |
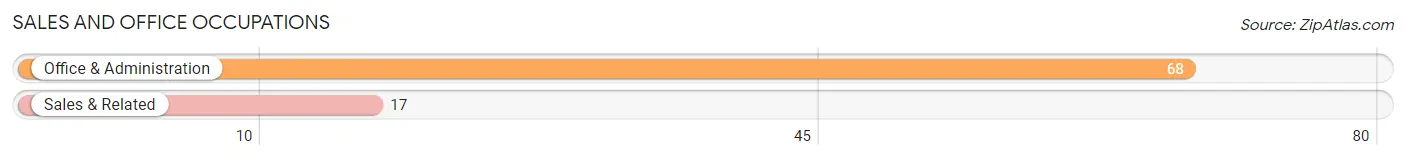
Sales and Office Occupations
The most common Sales and Office occupations in Los Ranchos are Office & Administration (68 | 11.4%), and Sales & Related (17 | 2.8%).
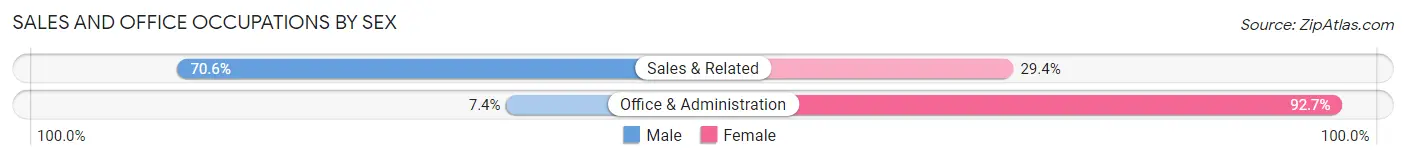
Sales and Office Occupations by Sex
| Occupation | Male | Female |
| Sales & Related | 12 (70.6%) | 5 (29.4%) |
| Office & Administration | 5 (7.3%) | 63 (92.6%) |
| Total (Category) | 17 (20.0%) | 68 (80.0%) |
| Total (Overall) | 255 (42.6%) | 343 (57.4%) |
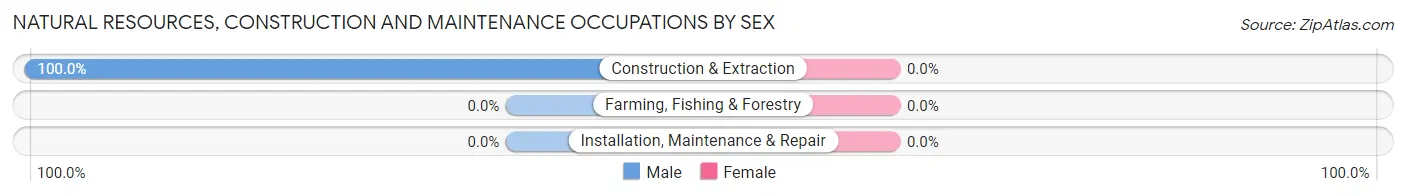
Natural Resources, Construction and Maintenance Occupations
The most common Natural Resources, Construction and Maintenance occupations in Los Ranchos are , and Construction & Extraction (10 | 1.7%).

Natural Resources, Construction and Maintenance Occupations by Sex
| Occupation | Male | Female |
| Farming, Fishing & Forestry | 0 (0.0%) | 0 (0.0%) |
| Construction & Extraction | 10 (100.0%) | 0 (0.0%) |
| Installation, Maintenance & Repair | 0 (0.0%) | 0 (0.0%) |
| Total (Category) | 10 (100.0%) | 0 (0.0%) |
| Total (Overall) | 255 (42.6%) | 343 (57.4%) |
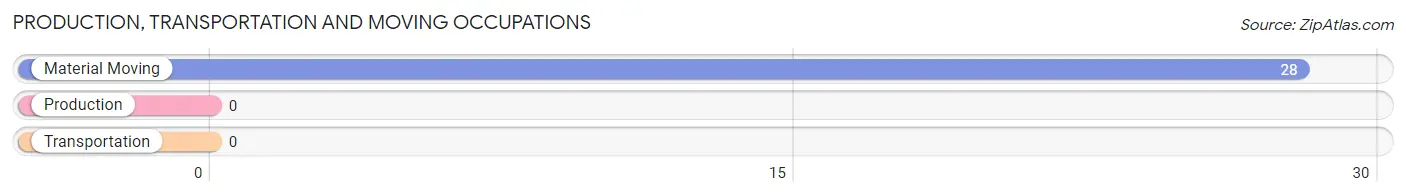
Production, Transportation and Moving Occupations
The most common Production, Transportation and Moving occupations in Los Ranchos are , and Material Moving (28 | 4.7%).
Production, Transportation and Moving Occupations by Sex
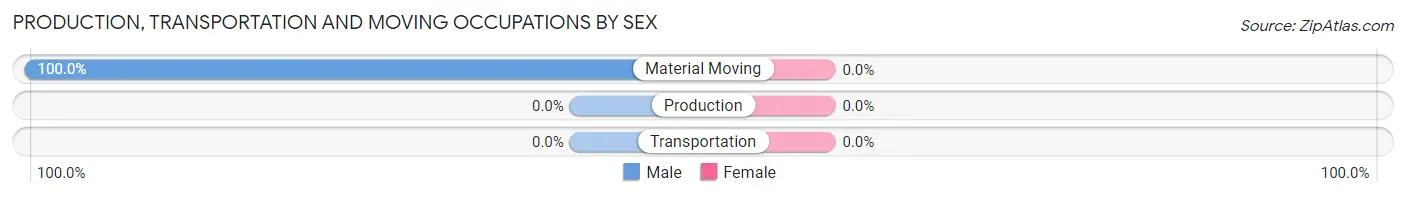
| Occupation | Male | Female |
| Production | 0 (0.0%) | 0 (0.0%) |
| Transportation | 0 (0.0%) | 0 (0.0%) |
| Material Moving | 28 (100.0%) | 0 (0.0%) |
| Total (Category) | 28 (100.0%) | 0 (0.0%) |
| Total (Overall) | 255 (42.6%) | 343 (57.4%) |
Employment Industries by Sex in Los Ranchos
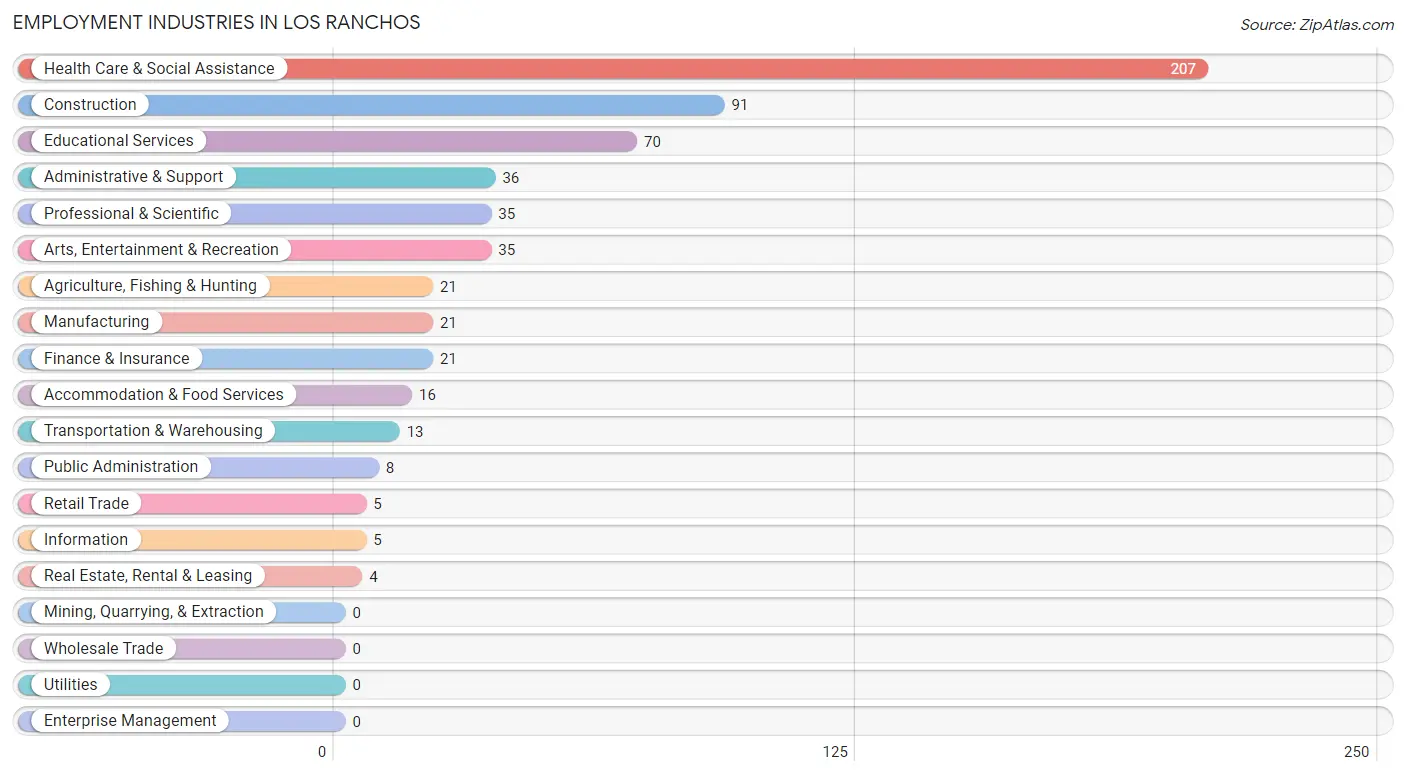
Employment Industries in Los Ranchos
The major employment industries in Los Ranchos include Health Care & Social Assistance (207 | 34.6%), Construction (91 | 15.2%), Educational Services (70 | 11.7%), Administrative & Support (36 | 6.0%), and Professional & Scientific (35 | 5.9%).
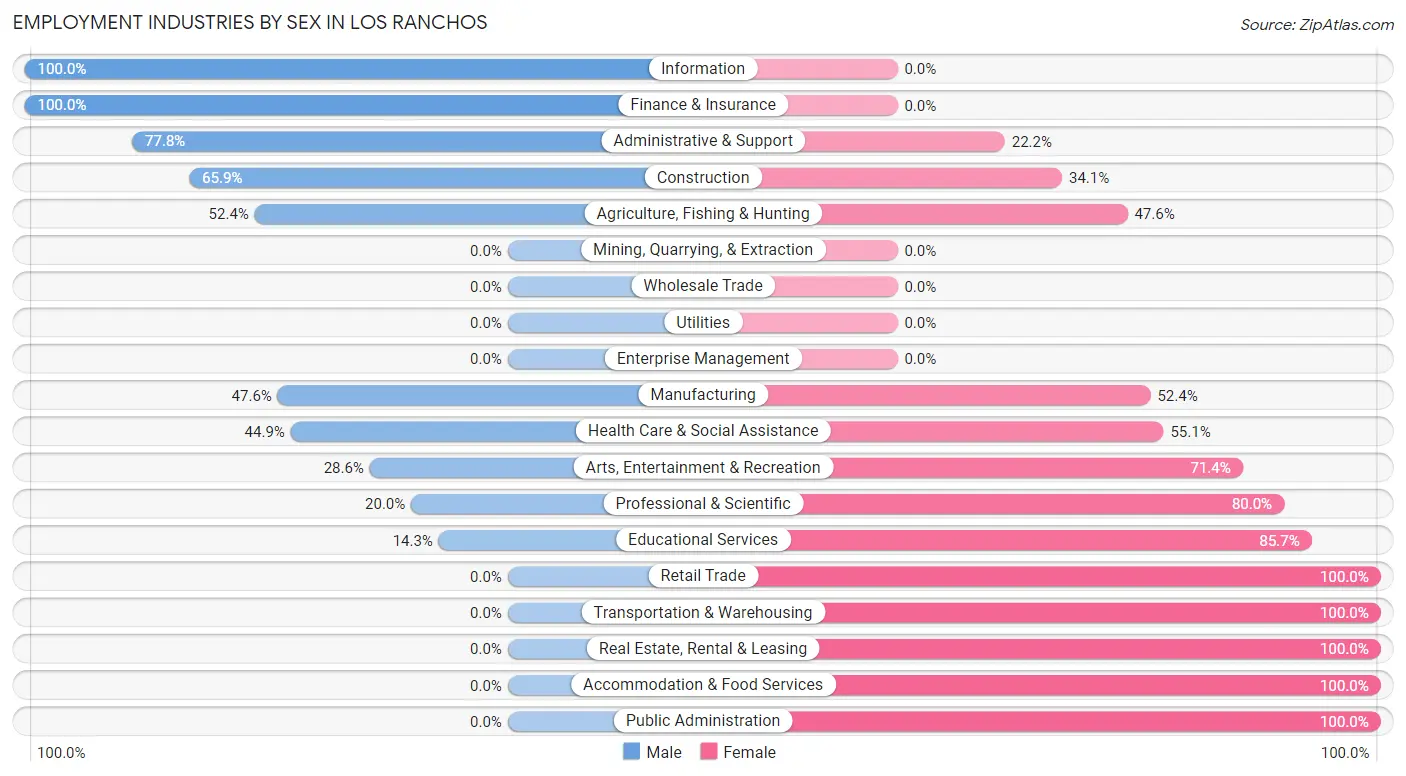
Employment Industries by Sex in Los Ranchos
The Los Ranchos industries that see more men than women are Information (100.0%), Finance & Insurance (100.0%), and Administrative & Support (77.8%), whereas the industries that tend to have a higher number of women are Retail Trade (100.0%), Transportation & Warehousing (100.0%), and Real Estate, Rental & Leasing (100.0%).
| Industry | Male | Female |
| Agriculture, Fishing & Hunting | 11 (52.4%) | 10 (47.6%) |
| Mining, Quarrying, & Extraction | 0 (0.0%) | 0 (0.0%) |
| Construction | 60 (65.9%) | 31 (34.1%) |
| Manufacturing | 10 (47.6%) | 11 (52.4%) |
| Wholesale Trade | 0 (0.0%) | 0 (0.0%) |
| Retail Trade | 0 (0.0%) | 5 (100.0%) |
| Transportation & Warehousing | 0 (0.0%) | 13 (100.0%) |
| Utilities | 0 (0.0%) | 0 (0.0%) |
| Information | 5 (100.0%) | 0 (0.0%) |
| Finance & Insurance | 21 (100.0%) | 0 (0.0%) |
| Real Estate, Rental & Leasing | 0 (0.0%) | 4 (100.0%) |
| Professional & Scientific | 7 (20.0%) | 28 (80.0%) |
| Enterprise Management | 0 (0.0%) | 0 (0.0%) |
| Administrative & Support | 28 (77.8%) | 8 (22.2%) |
| Educational Services | 10 (14.3%) | 60 (85.7%) |
| Health Care & Social Assistance | 93 (44.9%) | 114 (55.1%) |
| Arts, Entertainment & Recreation | 10 (28.6%) | 25 (71.4%) |
| Accommodation & Food Services | 0 (0.0%) | 16 (100.0%) |
| Public Administration | 0 (0.0%) | 8 (100.0%) |
| Total | 255 (42.6%) | 343 (57.4%) |
Education in Los Ranchos
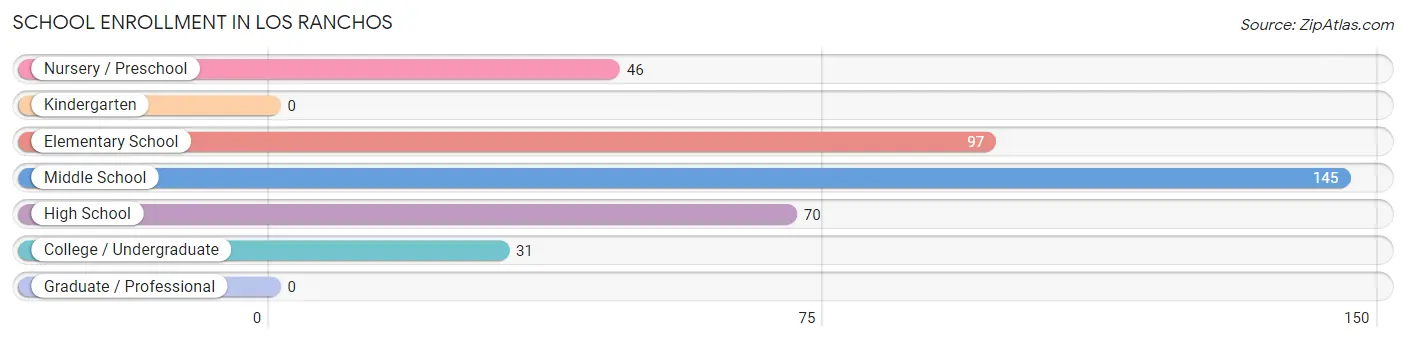
School Enrollment in Los Ranchos
The most common levels of schooling among the 389 students in Los Ranchos are middle school (145 | 37.3%), elementary school (97 | 24.9%), and high school (70 | 18.0%).
| School Level | # Students | % Students |
| Nursery / Preschool | 46 | 11.8% |
| Kindergarten | 0 | 0.0% |
| Elementary School | 97 | 24.9% |
| Middle School | 145 | 37.3% |
| High School | 70 | 18.0% |
| College / Undergraduate | 31 | 8.0% |
| Graduate / Professional | 0 | 0.0% |
| Total | 389 | 100.0% |
School Enrollment by Age by Funding Source in Los Ranchos
Out of a total of 389 students who are enrolled in schools in Los Ranchos, 77 (19.8%) attend a private institution, while the remaining 312 (80.2%) are enrolled in public schools. The age group of 15 to 17 year olds has the highest likelihood of being enrolled in private schools, with 70 (100.0% in the age bracket) enrolled. Conversely, the age group of 5 to 9 year old has the lowest likelihood of being enrolled in a private school, with 126 (100.0% in the age bracket) attending a public institution.
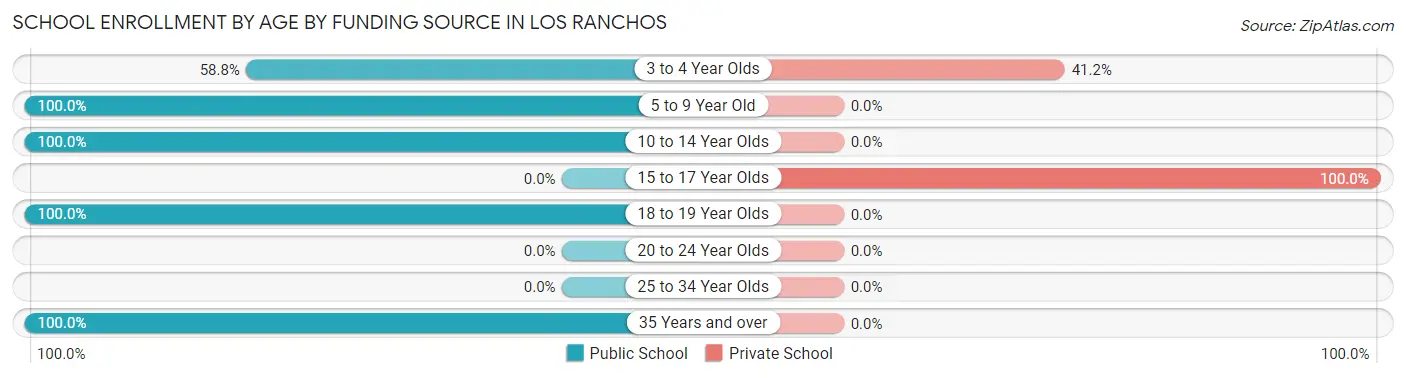
| Age Bracket | Public School | Private School |
| 3 to 4 Year Olds | 10 (58.8%) | 7 (41.2%) |
| 5 to 9 Year Old | 126 (100.0%) | 0 (0.0%) |
| 10 to 14 Year Olds | 145 (100.0%) | 0 (0.0%) |
| 15 to 17 Year Olds | 0 (0.0%) | 70 (100.0%) |
| 18 to 19 Year Olds | 11 (100.0%) | 0 (0.0%) |
| 20 to 24 Year Olds | 0 (0.0%) | 0 (0.0%) |
| 25 to 34 Year Olds | 0 (0.0%) | 0 (0.0%) |
| 35 Years and over | 20 (100.0%) | 0 (0.0%) |
| Total | 312 (80.2%) | 77 (19.8%) |
Educational Attainment by Field of Study in Los Ranchos
Business (145 | 17.8%), bio, nature & agricultural (125 | 15.3%), education (97 | 11.9%), liberal arts & history (97 | 11.9%), and visual & performing arts (78 | 9.6%) are the most common fields of study among 816 individuals in Los Ranchos who have obtained a bachelor's degree or higher.
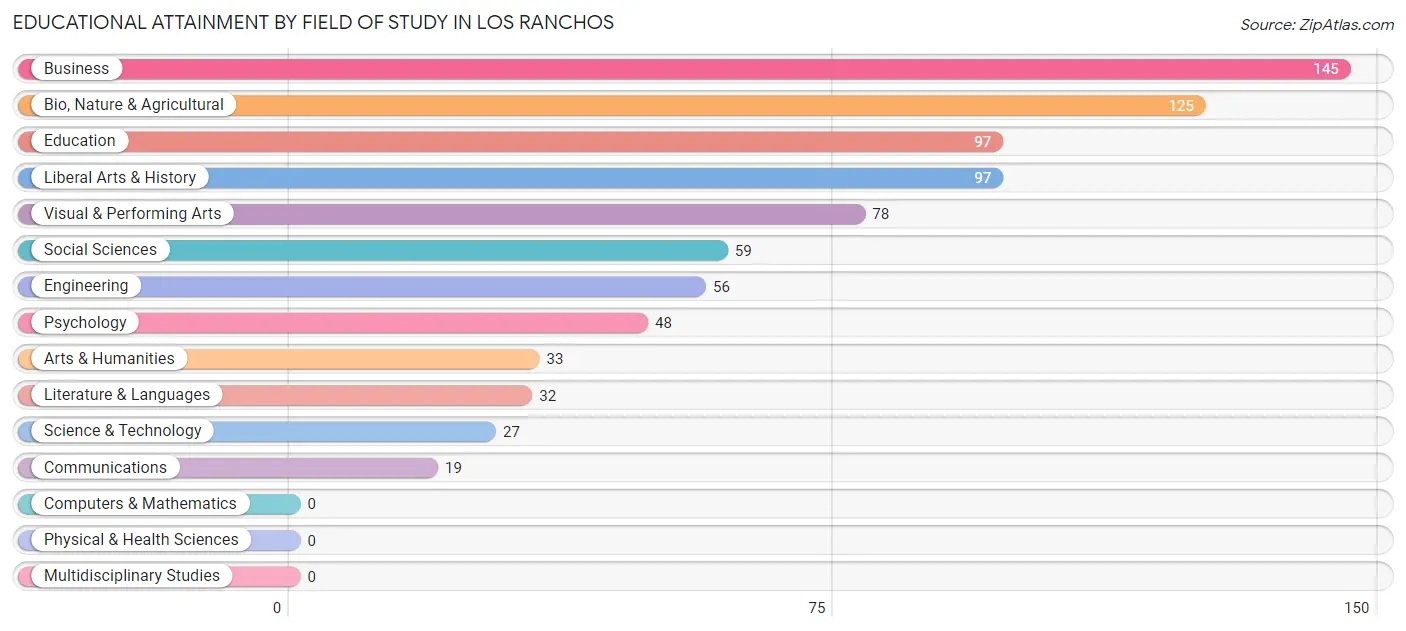
| Field of Study | # Graduates | % Graduates |
| Computers & Mathematics | 0 | 0.0% |
| Bio, Nature & Agricultural | 125 | 15.3% |
| Physical & Health Sciences | 0 | 0.0% |
| Psychology | 48 | 5.9% |
| Social Sciences | 59 | 7.2% |
| Engineering | 56 | 6.9% |
| Multidisciplinary Studies | 0 | 0.0% |
| Science & Technology | 27 | 3.3% |
| Business | 145 | 17.8% |
| Education | 97 | 11.9% |
| Literature & Languages | 32 | 3.9% |
| Liberal Arts & History | 97 | 11.9% |
| Visual & Performing Arts | 78 | 9.6% |
| Communications | 19 | 2.3% |
| Arts & Humanities | 33 | 4.0% |
| Total | 816 | 100.0% |
Transportation & Commute in Los Ranchos
Vehicle Availability by Sex in Los Ranchos
The most prevalent vehicle ownership categories in Los Ranchos are males with 3 vehicles (114, accounting for 44.7%) and females with 3 vehicles (144, making up 34.5%).
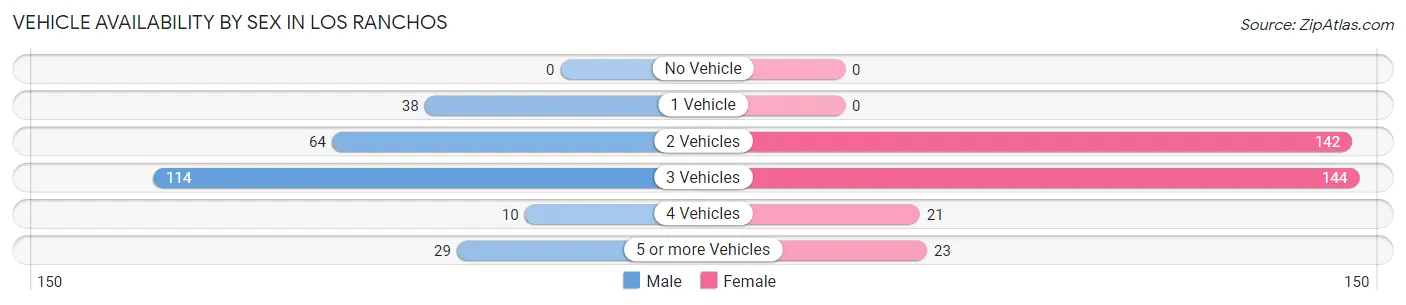
| Vehicles Available | Male | Female |
| No Vehicle | 0 (0.0%) | 0 (0.0%) |
| 1 Vehicle | 38 (14.9%) | 0 (0.0%) |
| 2 Vehicles | 64 (25.1%) | 142 (43.0%) |
| 3 Vehicles | 114 (44.7%) | 144 (43.6%) |
| 4 Vehicles | 10 (3.9%) | 21 (6.4%) |
| 5 or more Vehicles | 29 (11.4%) | 23 (7.0%) |
| Total | 255 (100.0%) | 330 (100.0%) |
Commute Time in Los Ranchos
The most frequently occuring commute durations in Los Ranchos are 10 to 14 minutes (166 commuters, 33.4%), 5 to 9 minutes (86 commuters, 17.3%), and 15 to 19 minutes (60 commuters, 12.1%).
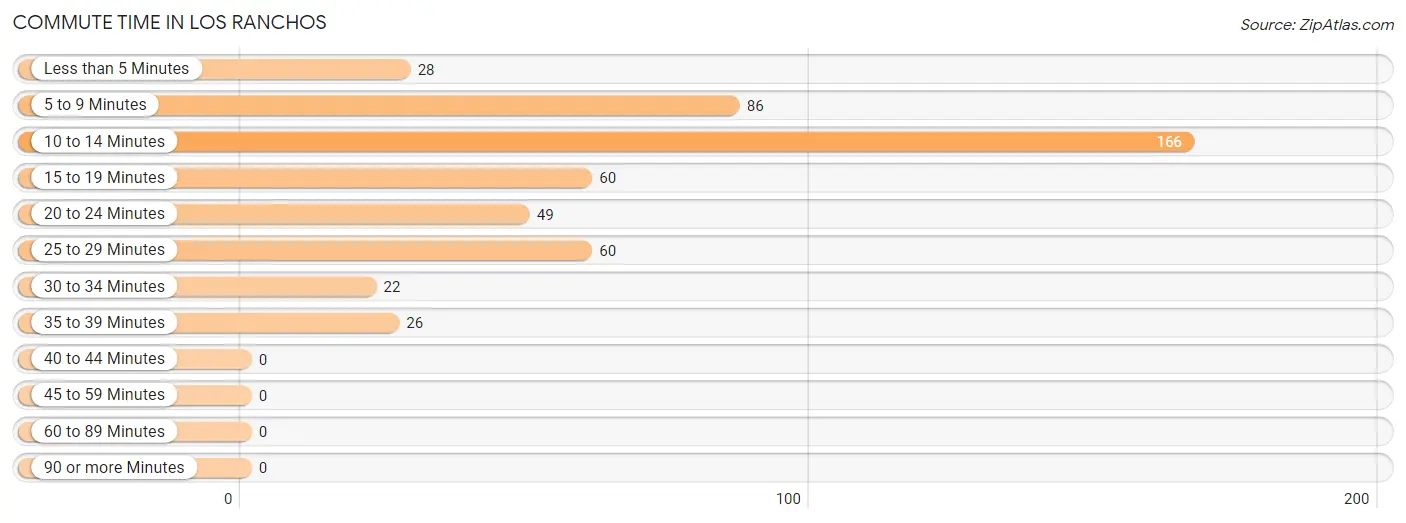
| Commute Time | # Commuters | % Commuters |
| Less than 5 Minutes | 28 | 5.6% |
| 5 to 9 Minutes | 86 | 17.3% |
| 10 to 14 Minutes | 166 | 33.4% |
| 15 to 19 Minutes | 60 | 12.1% |
| 20 to 24 Minutes | 49 | 9.9% |
| 25 to 29 Minutes | 60 | 12.1% |
| 30 to 34 Minutes | 22 | 4.4% |
| 35 to 39 Minutes | 26 | 5.2% |
| 40 to 44 Minutes | 0 | 0.0% |
| 45 to 59 Minutes | 0 | 0.0% |
| 60 to 89 Minutes | 0 | 0.0% |
| 90 or more Minutes | 0 | 0.0% |
Commute Time by Sex in Los Ranchos
The most common commute times in Los Ranchos are 5 to 9 minutes (64 commuters, 26.6%) for males and 10 to 14 minutes (106 commuters, 41.4%) for females.
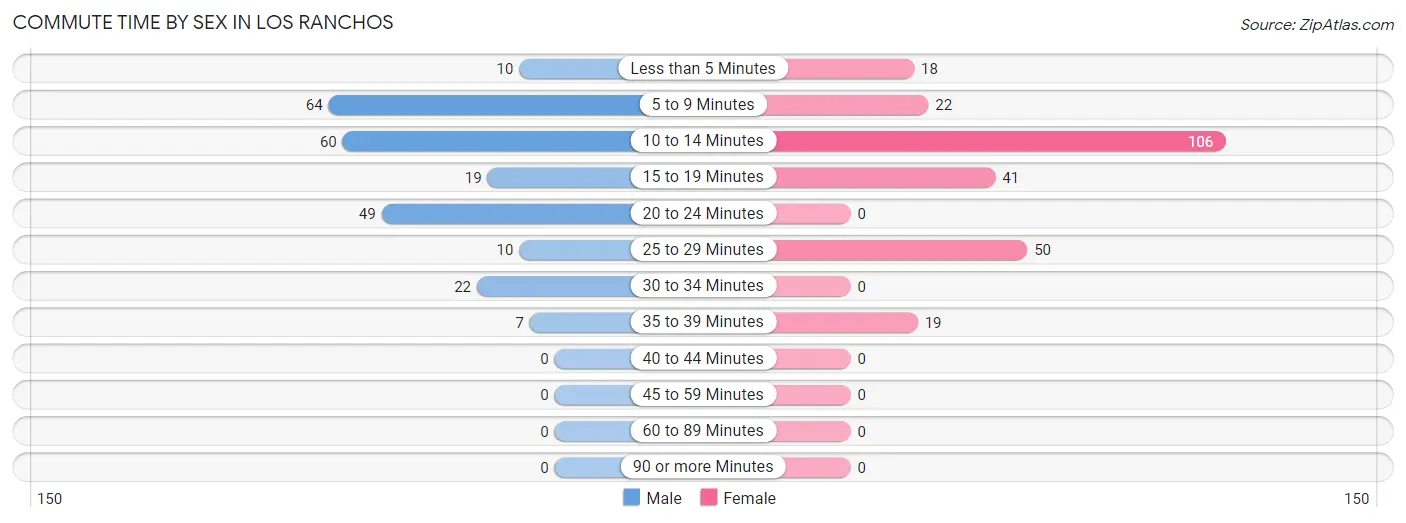
| Commute Time | Male | Female |
| Less than 5 Minutes | 10 (4.2%) | 18 (7.0%) |
| 5 to 9 Minutes | 64 (26.6%) | 22 (8.6%) |
| 10 to 14 Minutes | 60 (24.9%) | 106 (41.4%) |
| 15 to 19 Minutes | 19 (7.9%) | 41 (16.0%) |
| 20 to 24 Minutes | 49 (20.3%) | 0 (0.0%) |
| 25 to 29 Minutes | 10 (4.2%) | 50 (19.5%) |
| 30 to 34 Minutes | 22 (9.1%) | 0 (0.0%) |
| 35 to 39 Minutes | 7 (2.9%) | 19 (7.4%) |
| 40 to 44 Minutes | 0 (0.0%) | 0 (0.0%) |
| 45 to 59 Minutes | 0 (0.0%) | 0 (0.0%) |
| 60 to 89 Minutes | 0 (0.0%) | 0 (0.0%) |
| 90 or more Minutes | 0 (0.0%) | 0 (0.0%) |
Time of Departure to Work by Sex in Los Ranchos
The most frequent times of departure to work in Los Ranchos are 8:30 AM to 8:59 AM (84, 34.8%) for males and 8:00 AM to 8:29 AM (127, 49.6%) for females.
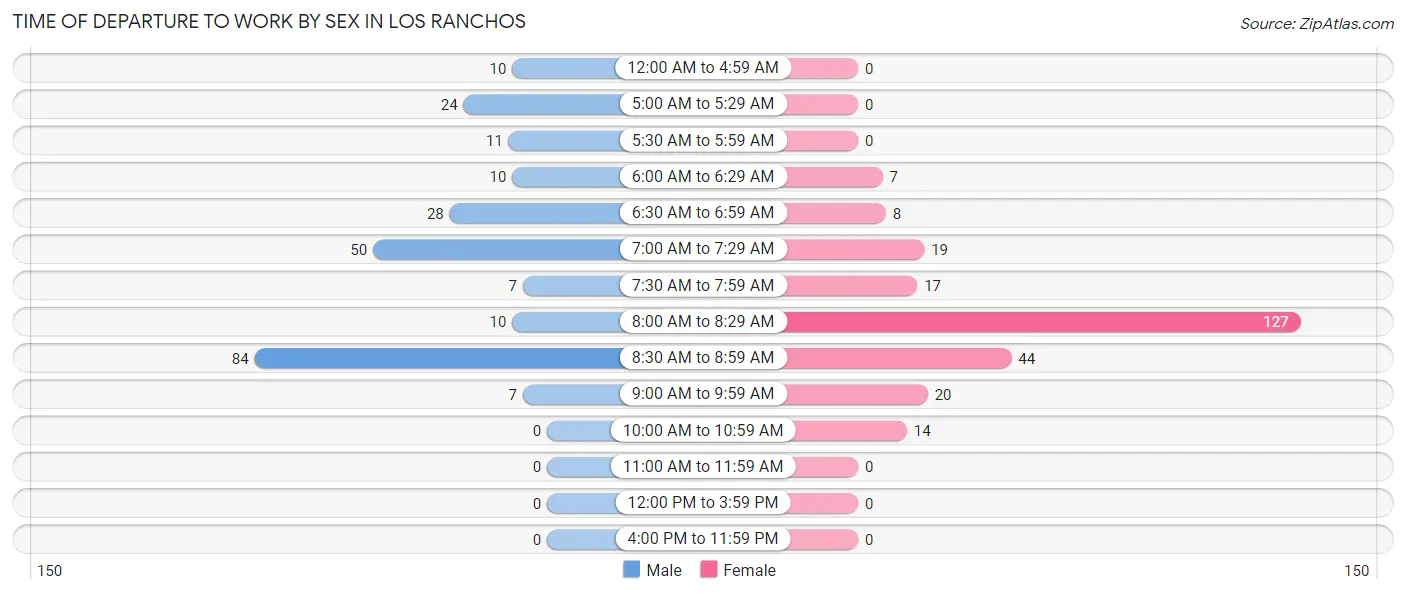
| Time of Departure | Male | Female |
| 12:00 AM to 4:59 AM | 10 (4.2%) | 0 (0.0%) |
| 5:00 AM to 5:29 AM | 24 (10.0%) | 0 (0.0%) |
| 5:30 AM to 5:59 AM | 11 (4.6%) | 0 (0.0%) |
| 6:00 AM to 6:29 AM | 10 (4.2%) | 7 (2.7%) |
| 6:30 AM to 6:59 AM | 28 (11.6%) | 8 (3.1%) |
| 7:00 AM to 7:29 AM | 50 (20.7%) | 19 (7.4%) |
| 7:30 AM to 7:59 AM | 7 (2.9%) | 17 (6.6%) |
| 8:00 AM to 8:29 AM | 10 (4.2%) | 127 (49.6%) |
| 8:30 AM to 8:59 AM | 84 (34.8%) | 44 (17.2%) |
| 9:00 AM to 9:59 AM | 7 (2.9%) | 20 (7.8%) |
| 10:00 AM to 10:59 AM | 0 (0.0%) | 14 (5.5%) |
| 11:00 AM to 11:59 AM | 0 (0.0%) | 0 (0.0%) |
| 12:00 PM to 3:59 PM | 0 (0.0%) | 0 (0.0%) |
| 4:00 PM to 11:59 PM | 0 (0.0%) | 0 (0.0%) |
| Total | 241 (100.0%) | 256 (100.0%) |
Housing Occupancy in Los Ranchos
Occupancy by Ownership in Los Ranchos
Of the total 614 dwellings in Los Ranchos, owner-occupied units account for 576 (93.8%), while renter-occupied units make up 38 (6.2%).
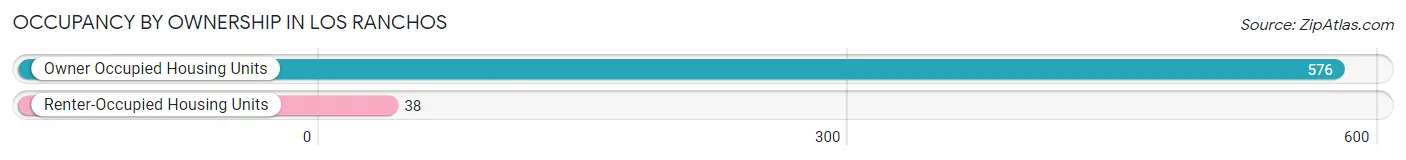
| Occupancy | # Housing Units | % Housing Units |
| Owner Occupied Housing Units | 576 | 93.8% |
| Renter-Occupied Housing Units | 38 | 6.2% |
| Total Occupied Housing Units | 614 | 100.0% |
Occupancy by Household Size in Los Ranchos
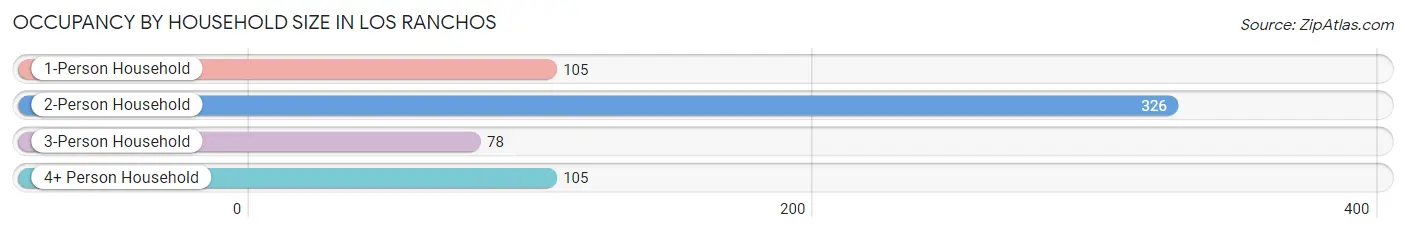
| Household Size | # Housing Units | % Housing Units |
| 1-Person Household | 105 | 17.1% |
| 2-Person Household | 326 | 53.1% |
| 3-Person Household | 78 | 12.7% |
| 4+ Person Household | 105 | 17.1% |
| Total Housing Units | 614 | 100.0% |
Occupancy by Ownership by Household Size in Los Ranchos
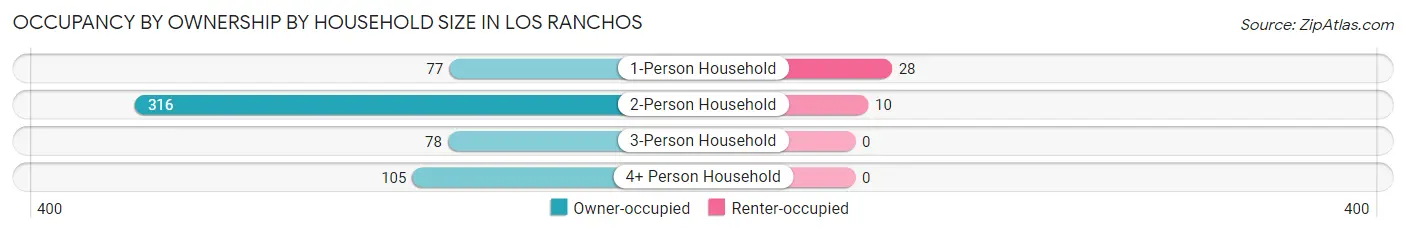
| Household Size | Owner-occupied | Renter-occupied |
| 1-Person Household | 77 (73.3%) | 28 (26.7%) |
| 2-Person Household | 316 (96.9%) | 10 (3.1%) |
| 3-Person Household | 78 (100.0%) | 0 (0.0%) |
| 4+ Person Household | 105 (100.0%) | 0 (0.0%) |
| Total Housing Units | 576 (93.8%) | 38 (6.2%) |
Occupancy by Educational Attainment in Los Ranchos
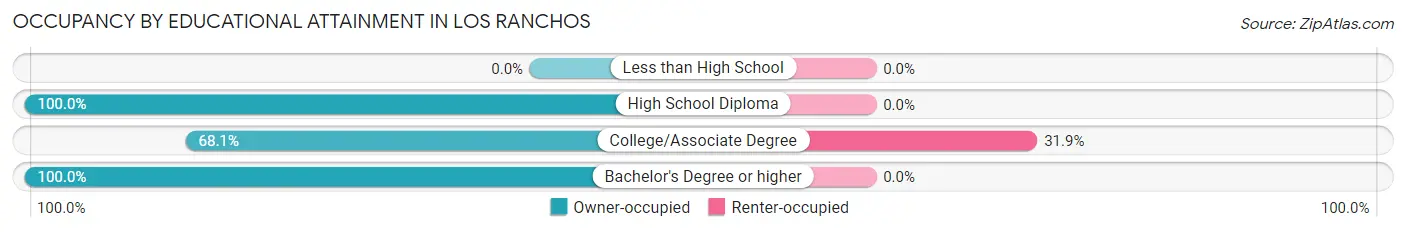
| Household Size | Owner-occupied | Renter-occupied |
| Less than High School | 0 (0.0%) | 0 (0.0%) |
| High School Diploma | 26 (100.0%) | 0 (0.0%) |
| College/Associate Degree | 81 (68.1%) | 38 (31.9%) |
| Bachelor's Degree or higher | 469 (100.0%) | 0 (0.0%) |
Occupancy by Age of Householder in Los Ranchos
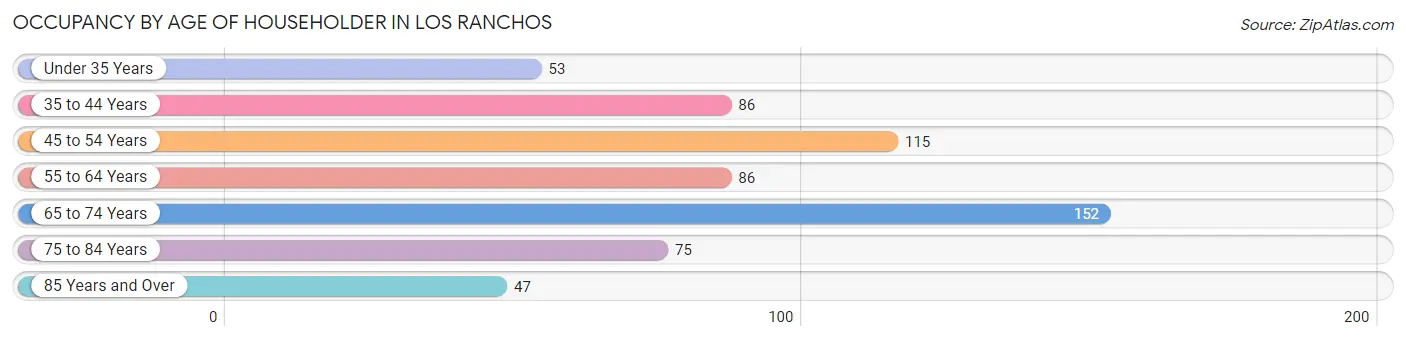
| Age Bracket | # Households | % Households |
| Under 35 Years | 53 | 8.6% |
| 35 to 44 Years | 86 | 14.0% |
| 45 to 54 Years | 115 | 18.7% |
| 55 to 64 Years | 86 | 14.0% |
| 65 to 74 Years | 152 | 24.8% |
| 75 to 84 Years | 75 | 12.2% |
| 85 Years and Over | 47 | 7.6% |
| Total | 614 | 100.0% |
Housing Finances in Los Ranchos
Median Income by Occupancy in Los Ranchos
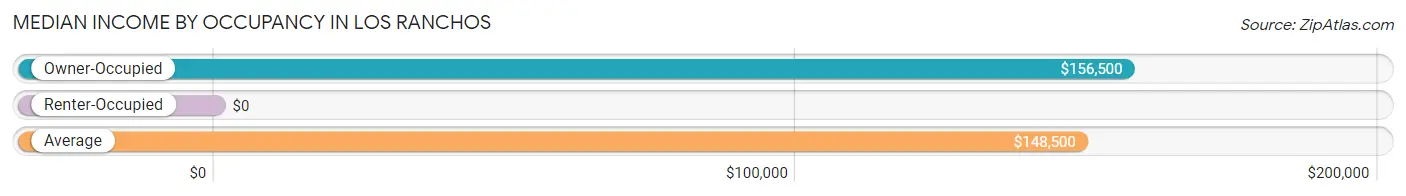
| Occupancy Type | # Households | Median Income |
| Owner-Occupied | 576 (93.8%) | $156,500 |
| Renter-Occupied | 38 (6.2%) | $0 |
| Average | 614 (100.0%) | $148,500 |
Occupancy by Householder Income Bracket in Los Ranchos
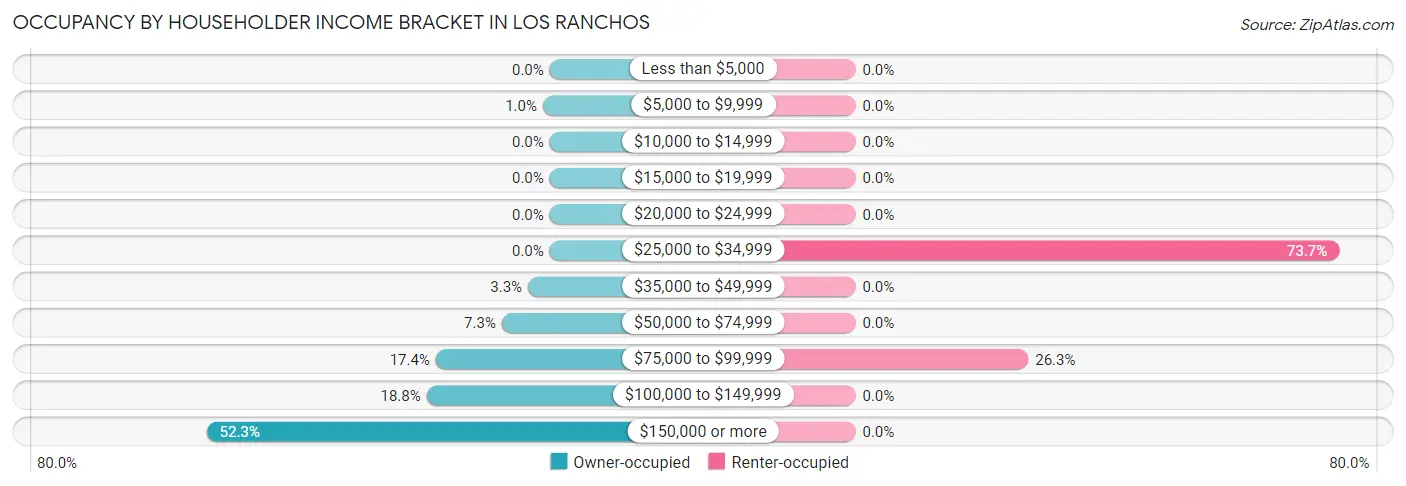
| Income Bracket | Owner-occupied | Renter-occupied |
| Less than $5,000 | 0 (0.0%) | 0 (0.0%) |
| $5,000 to $9,999 | 6 (1.0%) | 0 (0.0%) |
| $10,000 to $14,999 | 0 (0.0%) | 0 (0.0%) |
| $15,000 to $19,999 | 0 (0.0%) | 0 (0.0%) |
| $20,000 to $24,999 | 0 (0.0%) | 0 (0.0%) |
| $25,000 to $34,999 | 0 (0.0%) | 28 (73.7%) |
| $35,000 to $49,999 | 19 (3.3%) | 0 (0.0%) |
| $50,000 to $74,999 | 42 (7.3%) | 0 (0.0%) |
| $75,000 to $99,999 | 100 (17.4%) | 10 (26.3%) |
| $100,000 to $149,999 | 108 (18.8%) | 0 (0.0%) |
| $150,000 or more | 301 (52.3%) | 0 (0.0%) |
| Total | 576 (100.0%) | 38 (100.0%) |
Monthly Housing Cost Tiers in Los Ranchos
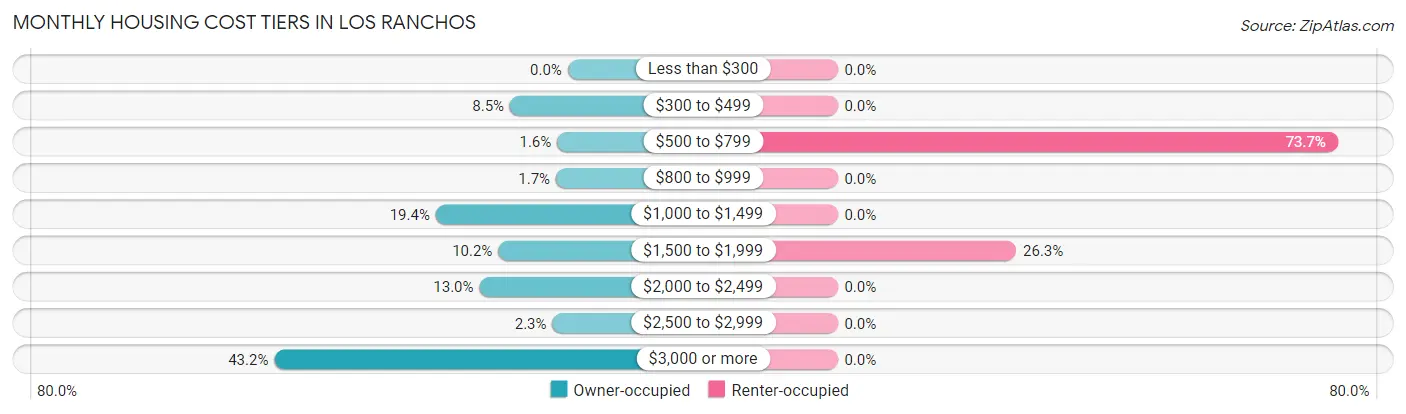
| Monthly Cost | Owner-occupied | Renter-occupied |
| Less than $300 | 0 (0.0%) | 0 (0.0%) |
| $300 to $499 | 49 (8.5%) | 0 (0.0%) |
| $500 to $799 | 9 (1.6%) | 28 (73.7%) |
| $800 to $999 | 10 (1.7%) | 0 (0.0%) |
| $1,000 to $1,499 | 112 (19.4%) | 0 (0.0%) |
| $1,500 to $1,999 | 59 (10.2%) | 10 (26.3%) |
| $2,000 to $2,499 | 75 (13.0%) | 0 (0.0%) |
| $2,500 to $2,999 | 13 (2.3%) | 0 (0.0%) |
| $3,000 or more | 249 (43.2%) | 0 (0.0%) |
| Total | 576 (100.0%) | 38 (100.0%) |
Physical Housing Characteristics in Los Ranchos
Housing Structures in Los Ranchos
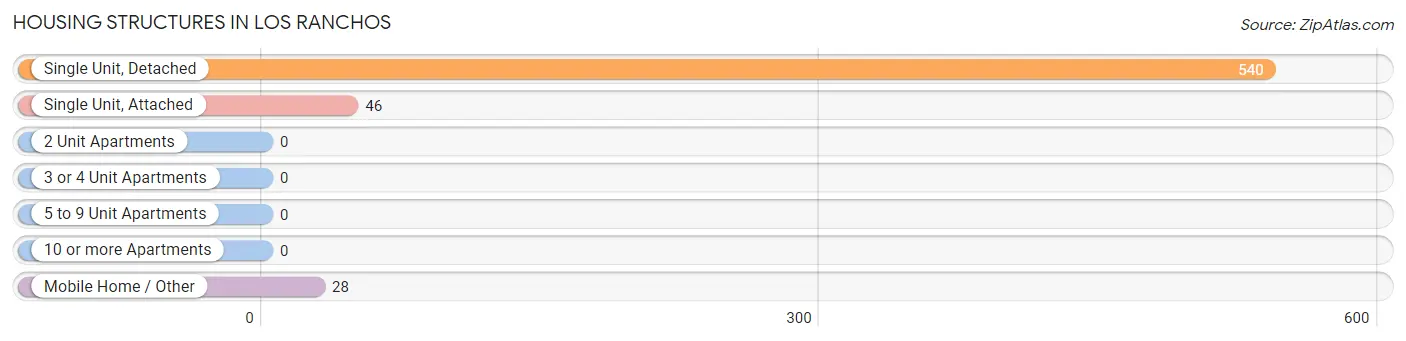
| Structure Type | # Housing Units | % Housing Units |
| Single Unit, Detached | 540 | 87.9% |
| Single Unit, Attached | 46 | 7.5% |
| 2 Unit Apartments | 0 | 0.0% |
| 3 or 4 Unit Apartments | 0 | 0.0% |
| 5 to 9 Unit Apartments | 0 | 0.0% |
| 10 or more Apartments | 0 | 0.0% |
| Mobile Home / Other | 28 | 4.6% |
| Total | 614 | 100.0% |
Housing Structures by Occupancy in Los Ranchos
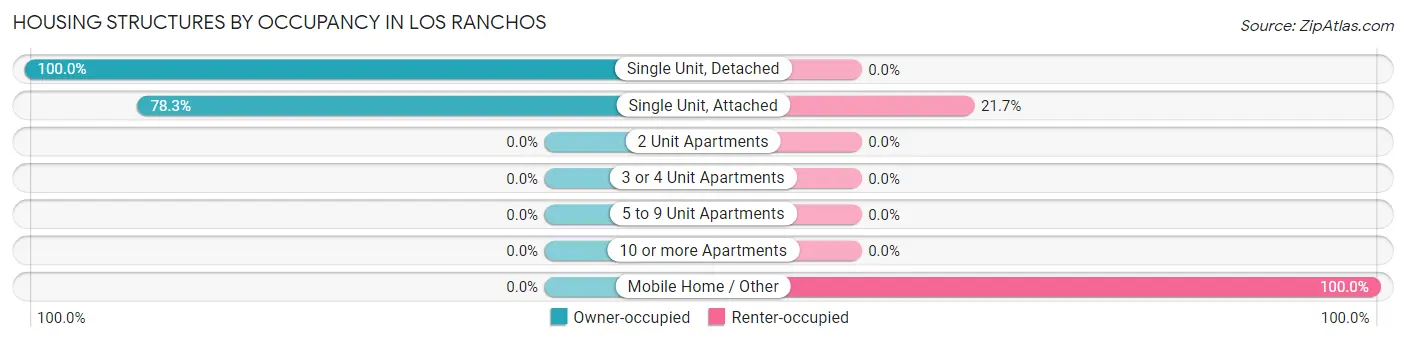
| Structure Type | Owner-occupied | Renter-occupied |
| Single Unit, Detached | 540 (100.0%) | 0 (0.0%) |
| Single Unit, Attached | 36 (78.3%) | 10 (21.7%) |
| 2 Unit Apartments | 0 (0.0%) | 0 (0.0%) |
| 3 or 4 Unit Apartments | 0 (0.0%) | 0 (0.0%) |
| 5 to 9 Unit Apartments | 0 (0.0%) | 0 (0.0%) |
| 10 or more Apartments | 0 (0.0%) | 0 (0.0%) |
| Mobile Home / Other | 0 (0.0%) | 28 (100.0%) |
| Total | 576 (93.8%) | 38 (6.2%) |
Housing Structures by Number of Rooms in Los Ranchos
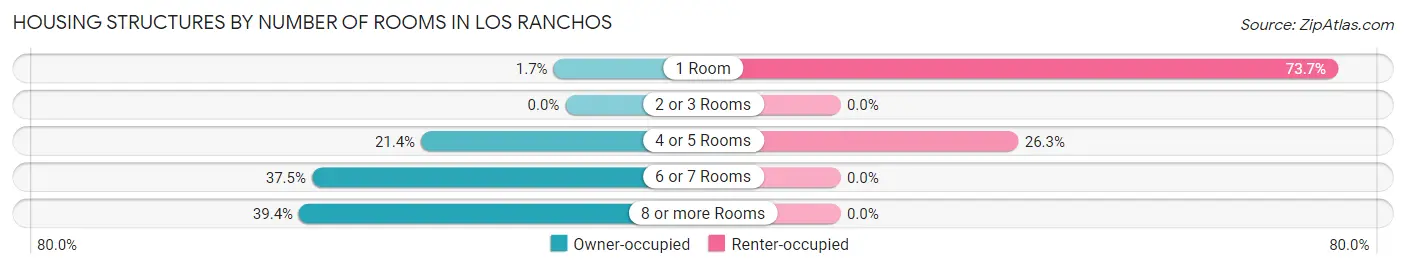
| Number of Rooms | Owner-occupied | Renter-occupied |
| 1 Room | 10 (1.7%) | 28 (73.7%) |
| 2 or 3 Rooms | 0 (0.0%) | 0 (0.0%) |
| 4 or 5 Rooms | 123 (21.3%) | 10 (26.3%) |
| 6 or 7 Rooms | 216 (37.5%) | 0 (0.0%) |
| 8 or more Rooms | 227 (39.4%) | 0 (0.0%) |
| Total | 576 (100.0%) | 38 (100.0%) |
Housing Structure by Heating Type in Los Ranchos
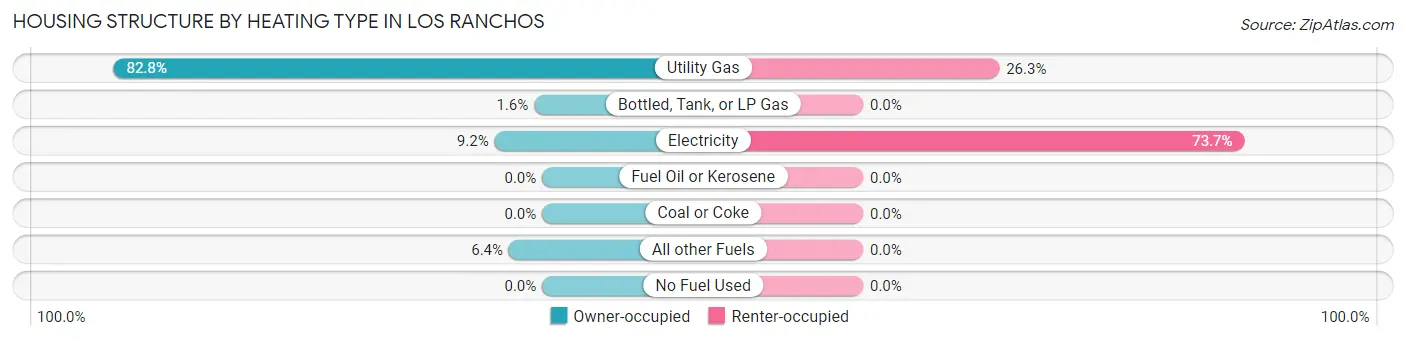
| Heating Type | Owner-occupied | Renter-occupied |
| Utility Gas | 477 (82.8%) | 10 (26.3%) |
| Bottled, Tank, or LP Gas | 9 (1.6%) | 0 (0.0%) |
| Electricity | 53 (9.2%) | 28 (73.7%) |
| Fuel Oil or Kerosene | 0 (0.0%) | 0 (0.0%) |
| Coal or Coke | 0 (0.0%) | 0 (0.0%) |
| All other Fuels | 37 (6.4%) | 0 (0.0%) |
| No Fuel Used | 0 (0.0%) | 0 (0.0%) |
| Total | 576 (100.0%) | 38 (100.0%) |
Household Vehicle Usage in Los Ranchos
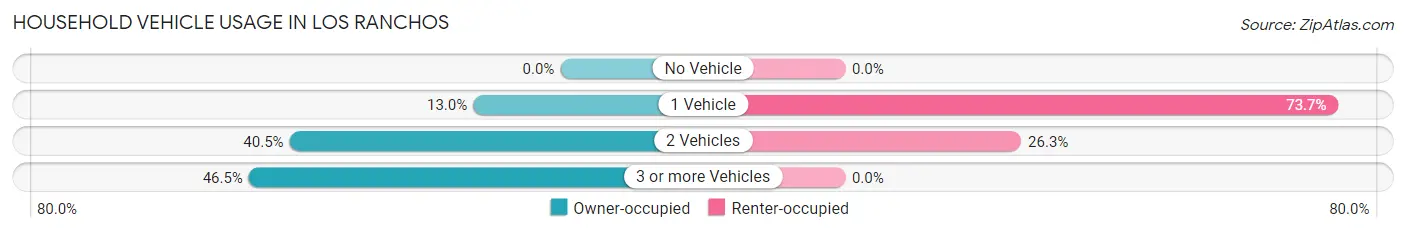
| Vehicles per Household | Owner-occupied | Renter-occupied |
| No Vehicle | 0 (0.0%) | 0 (0.0%) |
| 1 Vehicle | 75 (13.0%) | 28 (73.7%) |
| 2 Vehicles | 233 (40.5%) | 10 (26.3%) |
| 3 or more Vehicles | 268 (46.5%) | 0 (0.0%) |
| Total | 576 (100.0%) | 38 (100.0%) |
Real Estate & Mortgages in Los Ranchos
Real Estate and Mortgage Overview in Los Ranchos
| Characteristic | Without Mortgage | With Mortgage |
| Housing Units | 227 | 349 |
| Median Property Value | $1,067,500 | $1,258,300 |
| Median Household Income | $175,144 | $186 |
| Monthly Housing Costs | $1,417 | $237 |
| Real Estate Taxes | $10,001 | $9 |
Property Value by Mortgage Status in Los Ranchos
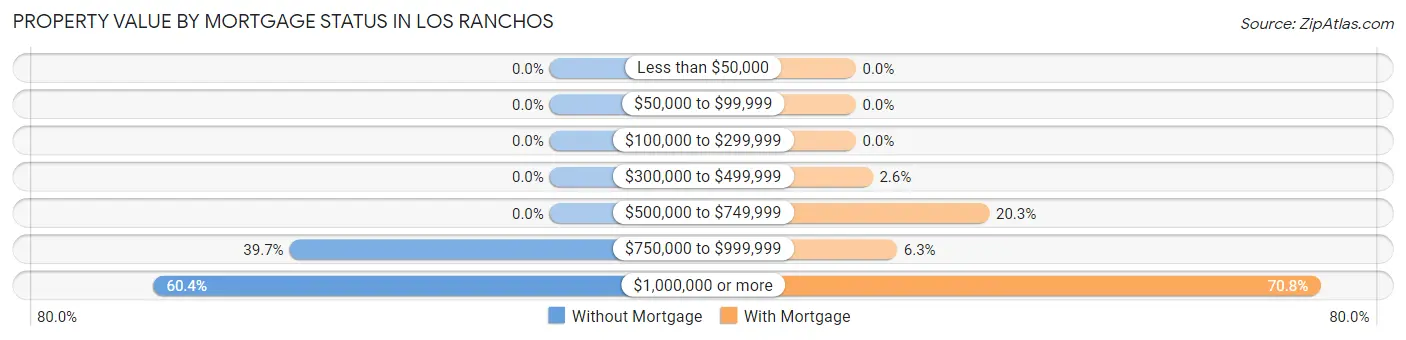
| Property Value | Without Mortgage | With Mortgage |
| Less than $50,000 | 0 (0.0%) | 0 (0.0%) |
| $50,000 to $99,999 | 0 (0.0%) | 0 (0.0%) |
| $100,000 to $299,999 | 0 (0.0%) | 0 (0.0%) |
| $300,000 to $499,999 | 0 (0.0%) | 9 (2.6%) |
| $500,000 to $749,999 | 0 (0.0%) | 71 (20.3%) |
| $750,000 to $999,999 | 90 (39.7%) | 22 (6.3%) |
| $1,000,000 or more | 137 (60.4%) | 247 (70.8%) |
| Total | 227 (100.0%) | 349 (100.0%) |
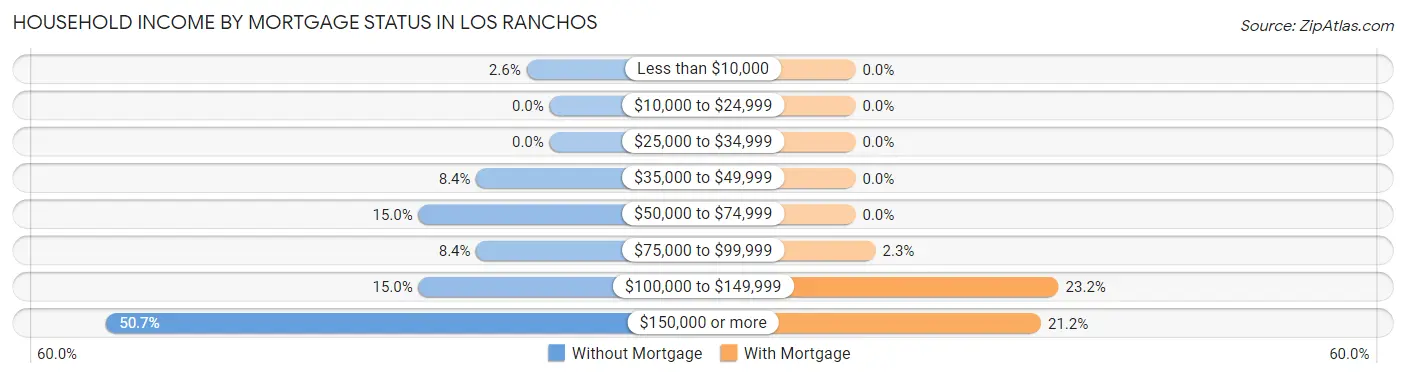
Household Income by Mortgage Status in Los Ranchos
| Household Income | Without Mortgage | With Mortgage |
| Less than $10,000 | 6 (2.6%) | 0 (0.0%) |
| $10,000 to $24,999 | 0 (0.0%) | 0 (0.0%) |
| $25,000 to $34,999 | 0 (0.0%) | 0 (0.0%) |
| $35,000 to $49,999 | 19 (8.4%) | 0 (0.0%) |
| $50,000 to $74,999 | 34 (15.0%) | 0 (0.0%) |
| $75,000 to $99,999 | 19 (8.4%) | 8 (2.3%) |
| $100,000 to $149,999 | 34 (15.0%) | 81 (23.2%) |
| $150,000 or more | 115 (50.7%) | 74 (21.2%) |
| Total | 227 (100.0%) | 349 (100.0%) |
Property Value to Household Income Ratio in Los Ranchos
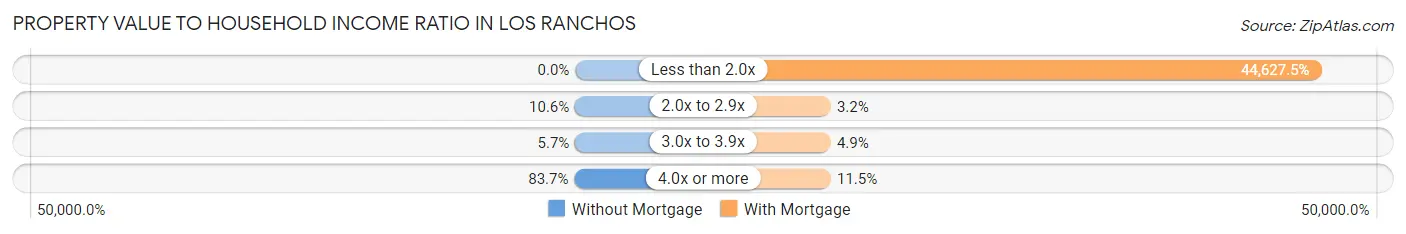
| Value-to-Income Ratio | Without Mortgage | With Mortgage |
| Less than 2.0x | 0 (0.0%) | 155,750 (44,627.5%) |
| 2.0x to 2.9x | 24 (10.6%) | 11 (3.2%) |
| 3.0x to 3.9x | 13 (5.7%) | 17 (4.9%) |
| 4.0x or more | 190 (83.7%) | 40 (11.5%) |
| Total | 227 (100.0%) | 349 (100.0%) |
Real Estate Taxes by Mortgage Status in Los Ranchos
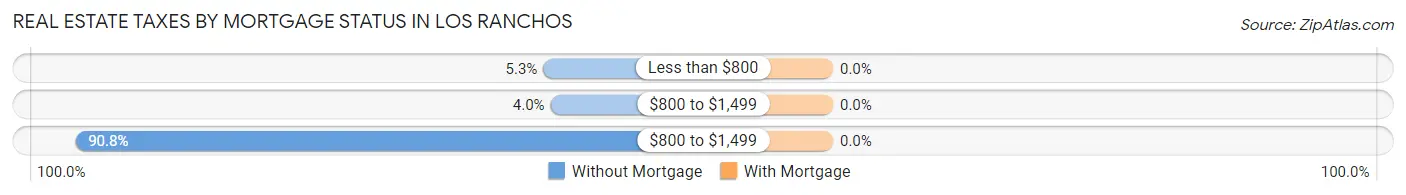
| Property Taxes | Without Mortgage | With Mortgage |
| Less than $800 | 12 (5.3%) | 0 (0.0%) |
| $800 to $1,499 | 9 (4.0%) | 0 (0.0%) |
| $800 to $1,499 | 206 (90.7%) | 0 (0.0%) |
| Total | 227 (100.0%) | 349 (100.0%) |
Health & Disability in Los Ranchos
Health Insurance Coverage by Age in Los Ranchos
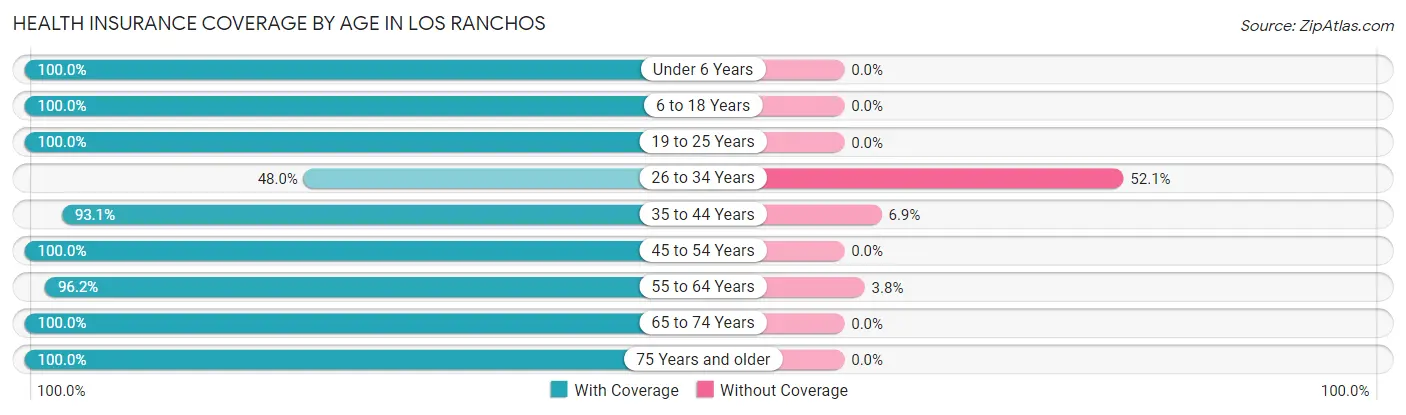
| Age Bracket | With Coverage | Without Coverage |
| Under 6 Years | 85 (100.0%) | 0 (0.0%) |
| 6 to 18 Years | 312 (100.0%) | 0 (0.0%) |
| 19 to 25 Years | 11 (100.0%) | 0 (0.0%) |
| 26 to 34 Years | 35 (47.9%) | 38 (52.0%) |
| 35 to 44 Years | 134 (93.1%) | 10 (6.9%) |
| 45 to 54 Years | 184 (100.0%) | 0 (0.0%) |
| 55 to 64 Years | 253 (96.2%) | 10 (3.8%) |
| 65 to 74 Years | 248 (100.0%) | 0 (0.0%) |
| 75 Years and older | 251 (100.0%) | 0 (0.0%) |
| Total | 1,513 (96.3%) | 58 (3.7%) |
Health Insurance Coverage by Citizenship Status in Los Ranchos
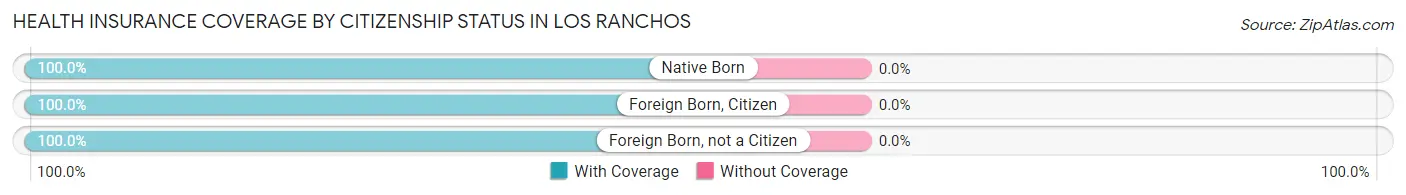
| Citizenship Status | With Coverage | Without Coverage |
| Native Born | 85 (100.0%) | 0 (0.0%) |
| Foreign Born, Citizen | 312 (100.0%) | 0 (0.0%) |
| Foreign Born, not a Citizen | 11 (100.0%) | 0 (0.0%) |
Health Insurance Coverage by Household Income in Los Ranchos
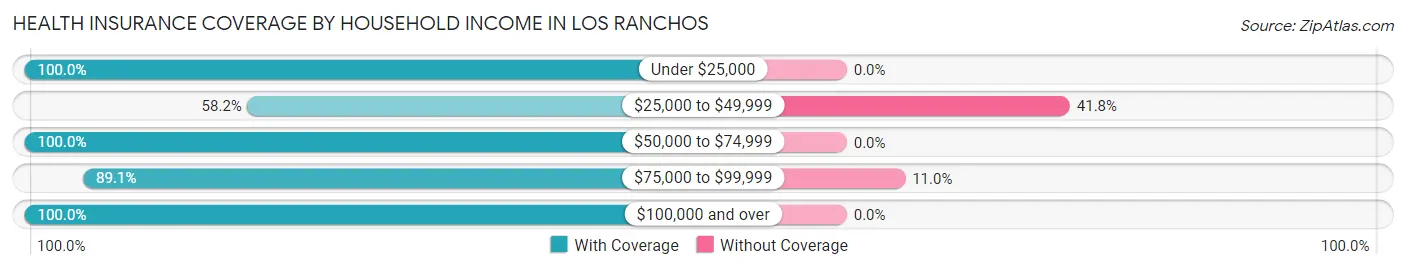
| Household Income | With Coverage | Without Coverage |
| Under $25,000 | 6 (100.0%) | 0 (0.0%) |
| $25,000 to $49,999 | 39 (58.2%) | 28 (41.8%) |
| $50,000 to $74,999 | 74 (100.0%) | 0 (0.0%) |
| $75,000 to $99,999 | 244 (89.0%) | 30 (11.0%) |
| $100,000 and over | 1,150 (100.0%) | 0 (0.0%) |
Public vs Private Health Insurance Coverage by Age in Los Ranchos
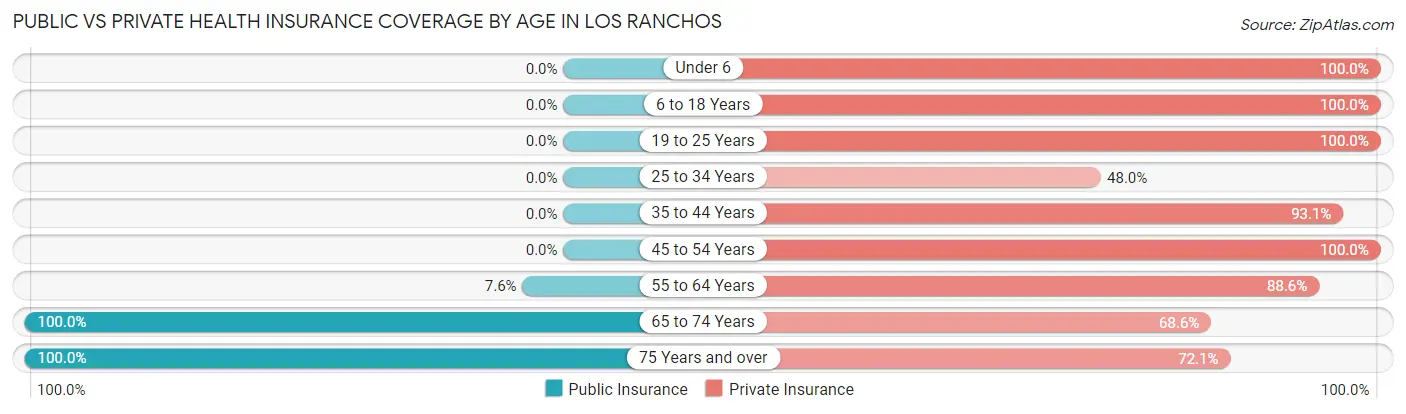
| Age Bracket | Public Insurance | Private Insurance |
| Under 6 | 0 (0.0%) | 85 (100.0%) |
| 6 to 18 Years | 0 (0.0%) | 312 (100.0%) |
| 19 to 25 Years | 0 (0.0%) | 11 (100.0%) |
| 25 to 34 Years | 0 (0.0%) | 35 (47.9%) |
| 35 to 44 Years | 0 (0.0%) | 134 (93.1%) |
| 45 to 54 Years | 0 (0.0%) | 184 (100.0%) |
| 55 to 64 Years | 20 (7.6%) | 233 (88.6%) |
| 65 to 74 Years | 248 (100.0%) | 170 (68.5%) |
| 75 Years and over | 251 (100.0%) | 181 (72.1%) |
| Total | 519 (33.0%) | 1,345 (85.6%) |
Disability Status by Sex by Age in Los Ranchos
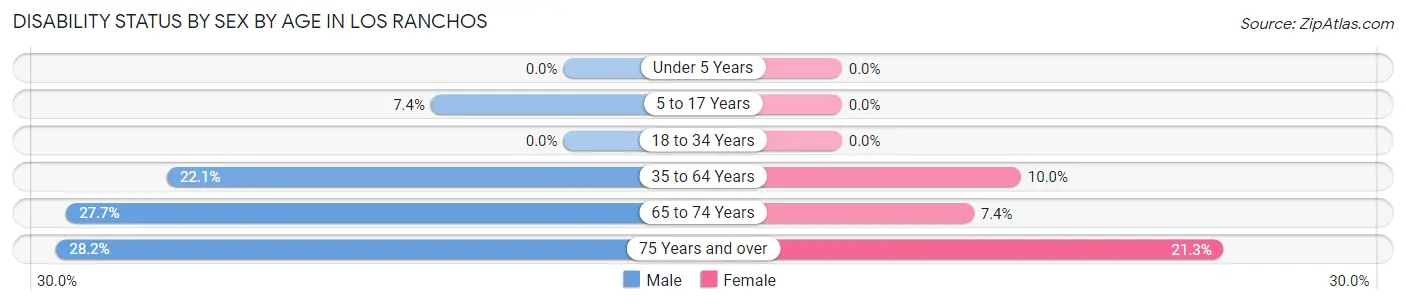
| Age Bracket | Male | Female |
| Under 5 Years | 0 (0.0%) | 0 (0.0%) |
| 5 to 17 Years | 11 (7.4%) | 0 (0.0%) |
| 18 to 34 Years | 0 (0.0%) | 0 (0.0%) |
| 35 to 64 Years | 64 (22.1%) | 30 (10.0%) |
| 65 to 74 Years | 31 (27.7%) | 10 (7.3%) |
| 75 Years and over | 35 (28.2%) | 27 (21.3%) |
Disability Class by Sex by Age in Los Ranchos
Disability Class: Hearing Difficulty
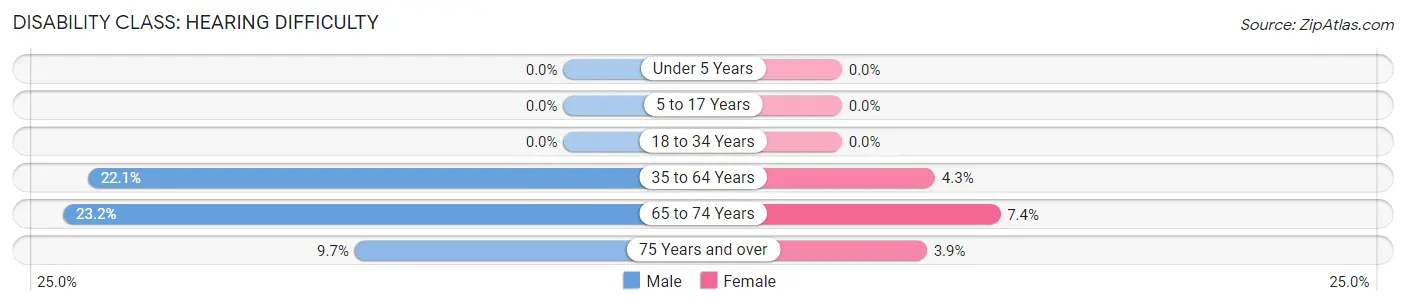
| Age Bracket | Male | Female |
| Under 5 Years | 0 (0.0%) | 0 (0.0%) |
| 5 to 17 Years | 0 (0.0%) | 0 (0.0%) |
| 18 to 34 Years | 0 (0.0%) | 0 (0.0%) |
| 35 to 64 Years | 64 (22.1%) | 13 (4.3%) |
| 65 to 74 Years | 26 (23.2%) | 10 (7.3%) |
| 75 Years and over | 12 (9.7%) | 5 (3.9%) |
Disability Class: Vision Difficulty
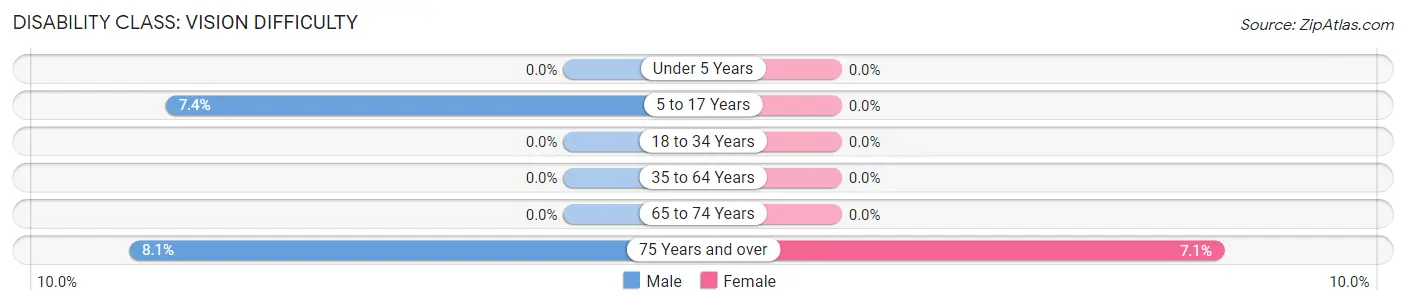
| Age Bracket | Male | Female |
| Under 5 Years | 0 (0.0%) | 0 (0.0%) |
| 5 to 17 Years | 11 (7.4%) | 0 (0.0%) |
| 18 to 34 Years | 0 (0.0%) | 0 (0.0%) |
| 35 to 64 Years | 0 (0.0%) | 0 (0.0%) |
| 65 to 74 Years | 0 (0.0%) | 0 (0.0%) |
| 75 Years and over | 10 (8.1%) | 9 (7.1%) |
Disability Class: Cognitive Difficulty
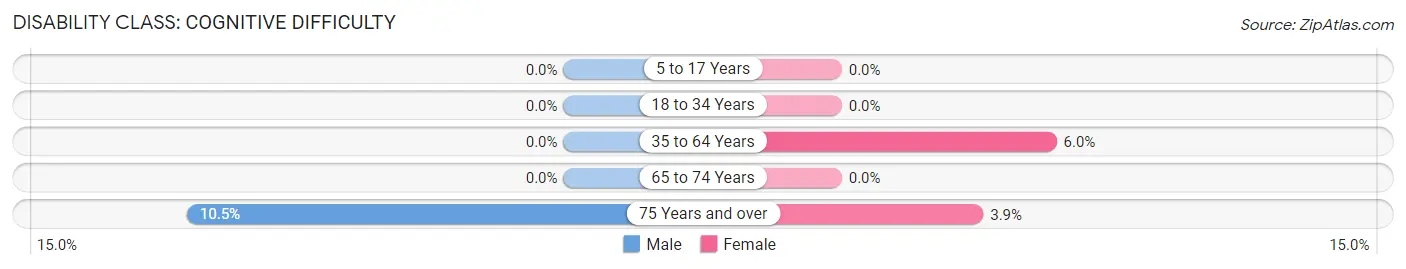
| Age Bracket | Male | Female |
| 5 to 17 Years | 0 (0.0%) | 0 (0.0%) |
| 18 to 34 Years | 0 (0.0%) | 0 (0.0%) |
| 35 to 64 Years | 0 (0.0%) | 18 (6.0%) |
| 65 to 74 Years | 0 (0.0%) | 0 (0.0%) |
| 75 Years and over | 13 (10.5%) | 5 (3.9%) |
Disability Class: Ambulatory Difficulty
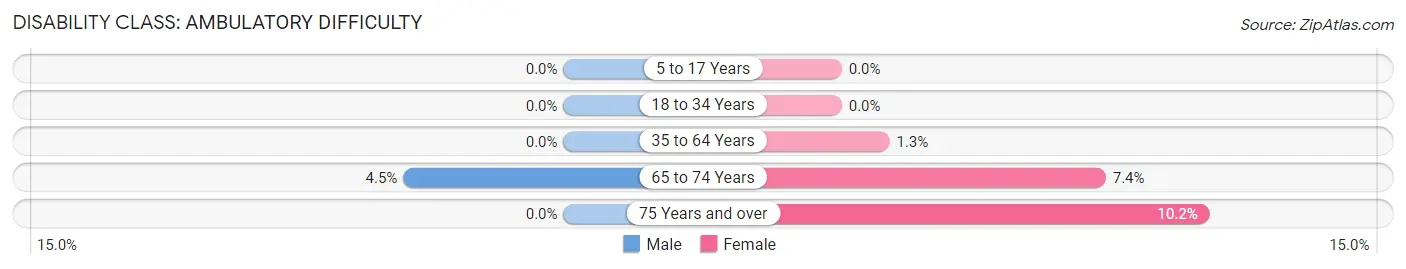
| Age Bracket | Male | Female |
| 5 to 17 Years | 0 (0.0%) | 0 (0.0%) |
| 18 to 34 Years | 0 (0.0%) | 0 (0.0%) |
| 35 to 64 Years | 0 (0.0%) | 4 (1.3%) |
| 65 to 74 Years | 5 (4.5%) | 10 (7.3%) |
| 75 Years and over | 0 (0.0%) | 13 (10.2%) |
Disability Class: Self-Care Difficulty
| Age Bracket | Male | Female |
| 5 to 17 Years | 0 (0.0%) | 0 (0.0%) |
| 18 to 34 Years | 0 (0.0%) | 0 (0.0%) |
| 35 to 64 Years | 0 (0.0%) | 0 (0.0%) |
| 65 to 74 Years | 0 (0.0%) | 0 (0.0%) |
| 75 Years and over | 0 (0.0%) | 0 (0.0%) |
Technology Access in Los Ranchos
Computing Device Access in Los Ranchos
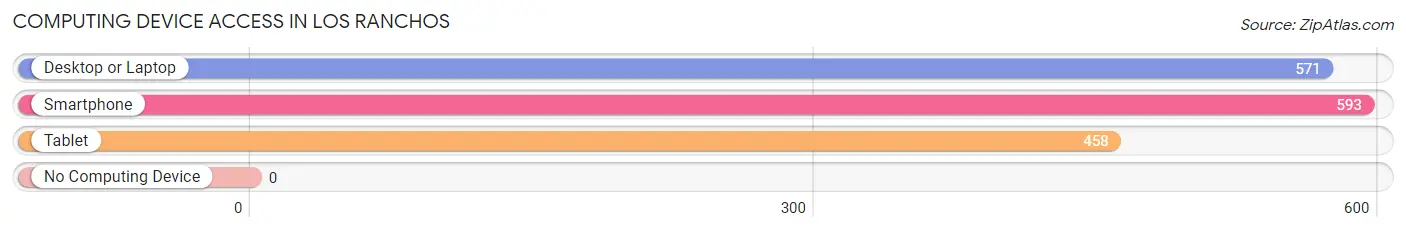
| Device Type | # Households | % Households |
| Desktop or Laptop | 571 | 93.0% |
| Smartphone | 593 | 96.6% |
| Tablet | 458 | 74.6% |
| No Computing Device | 0 | 0.0% |
| Total | 614 | 100.0% |
Internet Access in Los Ranchos
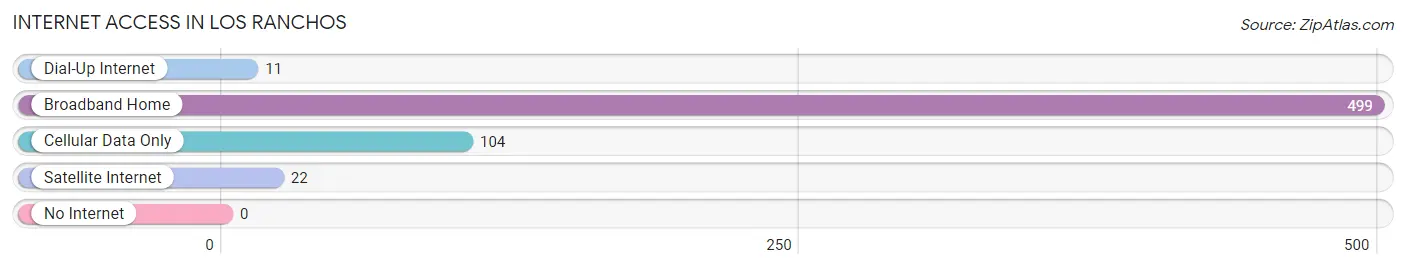
| Internet Type | # Households | % Households |
| Dial-Up Internet | 11 | 1.8% |
| Broadband Home | 499 | 81.3% |
| Cellular Data Only | 104 | 16.9% |
| Satellite Internet | 22 | 3.6% |
| No Internet | 0 | 0.0% |
| Total | 614 | 100.0% |
Los Ranchos Summary
History
Los Ranchos is a small unincorporated community located in the San Joaquin Valley of California. It is located in Fresno County, about 25 miles south of Fresno. The area was first settled in the late 1800s by Mexican settlers who were attracted to the fertile soil and abundant water sources. The area was originally known as Rancho de los Pinos, or “Ranch of the Pines”, and was home to a large number of Mexican families.
In the early 1900s, the area was developed by the Los Ranchos Land Company, which was owned by a group of investors from Los Angeles. The company purchased large tracts of land and began to subdivide it into smaller parcels. They also built a number of roads and irrigation systems to make the area more accessible and attractive to potential buyers.
The area was officially incorporated as the town of Los Ranchos in 1921. The town quickly grew in size and population, and by the 1950s it had become a thriving agricultural community. The town was home to a number of large farms, as well as a number of small businesses.
Geography
Los Ranchos is located in the San Joaquin Valley of California, about 25 miles south of Fresno. The area is characterized by flat terrain and is surrounded by rolling hills. The climate is semi-arid, with hot summers and mild winters. The average annual precipitation is about 10 inches.
The area is home to a number of small lakes and ponds, as well as several creeks and streams. The Los Ranchos River runs through the area, providing a source of water for the local farms and businesses.
Economy
The economy of Los Ranchos is largely based on agriculture. The area is home to a number of large farms, which produce a variety of crops including cotton, alfalfa, corn, and wheat. The area is also home to a number of small businesses, including restaurants, grocery stores, and gas stations.
Demographics
As of the 2010 census, the population of Los Ranchos was 1,845. The population is largely Hispanic, with over 90% of the population identifying as such. The median household income is $37,000, and the median home value is $150,000. The unemployment rate is 8.2%.
Common Questions
What is Per Capita Income in Los Ranchos?
Per Capita income in Los Ranchos is $83,221.
What is the Median Family Income in Los Ranchos?
Median Family Income in Los Ranchos is $154,000.
What is the Median Household income in Los Ranchos?
Median Household Income in Los Ranchos is $148,500.
What is Income or Wage Gap in Los Ranchos?
Income or Wage Gap in Los Ranchos is 45.5%.
Women in Los Ranchos earn 54.5 cents for every dollar earned by a man.
What is Inequality or Gini Index in Los Ranchos?
Inequality or Gini Index in Los Ranchos is 0.43.
What is the Total Population of Los Ranchos?
Total Population of Los Ranchos is 1,571.
What is the Total Male Population of Los Ranchos?
Total Male Population of Los Ranchos is 774.
What is the Total Female Population of Los Ranchos?
Total Female Population of Los Ranchos is 797.
What is the Ratio of Males per 100 Females in Los Ranchos?
There are 97.11 Males per 100 Females in Los Ranchos.
What is the Ratio of Females per 100 Males in Los Ranchos?
There are 102.97 Females per 100 Males in Los Ranchos.
What is the Median Population Age in Los Ranchos?
Median Population Age in Los Ranchos is 53.7 Years.
What is the Average Family Size in Los Ranchos
Average Family Size in Los Ranchos is 2.9 People.
What is the Average Household Size in Los Ranchos
Average Household Size in Los Ranchos is 2.6 People.
How Large is the Labor Force in Los Ranchos?
There are 615 People in the Labor Forcein in Los Ranchos.
What is the Percentage of People in the Labor Force in Los Ranchos?
49.4% of People are in the Labor Force in Los Ranchos.
What is the Unemployment Rate in Los Ranchos?
Unemployment Rate in Los Ranchos is 2.6%.