Cities with the Highest Percentage of Population Employed in Computer, Engineering & Science in Arizona
RELATED REPORTS & OPTIONS
Computer, Engineering & Science
Arizona
Compare Cities
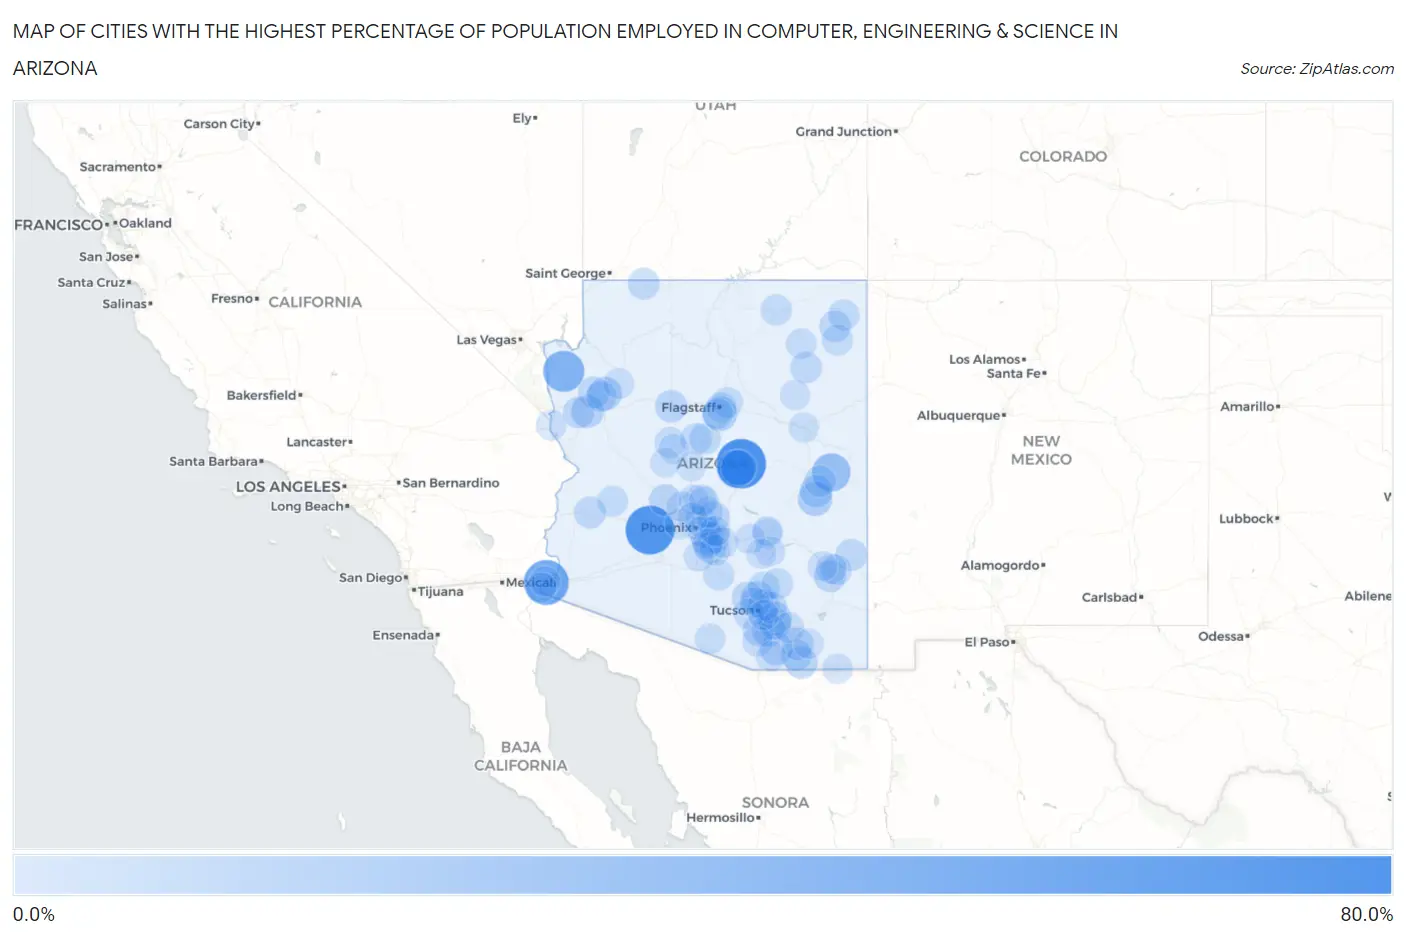
Map of Cities with the Highest Percentage of Population Employed in Computer, Engineering & Science in Arizona
0.0%
80.0%
Cities with the Highest Percentage of Population Employed in Computer, Engineering & Science in Arizona
| City | % Employed | vs State | vs National | |
| 1. | Whispering Pines | 60.9% | 6.8%(+54.1)#1 | 6.8%(+54.1)#39 |
| 2. | Wintersburg | 58.6% | 6.8%(+51.8)#2 | 6.8%(+51.8)#42 |
| 3. | Drysdale | 47.4% | 6.8%(+40.6)#3 | 6.8%(+40.6)#81 |
| 4. | White Hills | 36.6% | 6.8%(+29.8)#4 | 6.8%(+29.9)#139 |
| 5. | Vernon | 28.2% | 6.8%(+21.4)#5 | 6.8%(+21.4)#259 |
| 6. | East Verde Estates | 27.8% | 6.8%(+21.0)#6 | 6.8%(+21.0)#266 |
| 7. | Freedom Acres | 21.2% | 6.8%(+14.5)#7 | 6.8%(+14.5)#487 |
| 8. | Mormon Lake | 18.8% | 6.8%(+12.0)#8 | 6.8%(+12.0)#659 |
| 9. | Mountainaire | 18.0% | 6.8%(+11.2)#9 | 6.8%(+11.2)#728 |
| 10. | Rainbow City | 17.7% | 6.8%(+11.0)#10 | 6.8%(+11.0)#751 |
| 11. | Rincon Valley | 15.4% | 6.8%(+8.63)#11 | 6.8%(+8.65)#1,053 |
| 12. | Valentine | 15.4% | 6.8%(+8.60)#12 | 6.8%(+8.62)#1,068 |
| 13. | Corona De Tucson | 14.4% | 6.8%(+7.60)#13 | 6.8%(+7.61)#1,249 |
| 14. | Lazy Y U | 13.9% | 6.8%(+7.09)#14 | 6.8%(+7.11)#1,367 |
| 15. | Chandler | 13.7% | 6.8%(+6.90)#15 | 6.8%(+6.91)#1,429 |
| 16. | Oro Valley | 13.2% | 6.8%(+6.42)#16 | 6.8%(+6.44)#1,575 |
| 17. | Sonoita | 12.9% | 6.8%(+6.08)#17 | 6.8%(+6.10)#1,671 |
| 18. | North Fork | 12.9% | 6.8%(+6.08)#18 | 6.8%(+6.09)#1,674 |
| 19. | Sierra Vista Southeast | 12.2% | 6.8%(+5.41)#19 | 6.8%(+5.43)#1,894 |
| 20. | Tucson Mountains | 12.0% | 6.8%(+5.24)#20 | 6.8%(+5.25)#1,932 |
| 21. | Ash Fork | 12.0% | 6.8%(+5.22)#21 | 6.8%(+5.24)#1,936 |
| 22. | Vail | 11.4% | 6.8%(+4.61)#22 | 6.8%(+4.63)#2,169 |
| 23. | Blue Ridge | 11.4% | 6.8%(+4.58)#23 | 6.8%(+4.59)#2,197 |
| 24. | Whetstone | 11.3% | 6.8%(+4.51)#24 | 6.8%(+4.53)#2,220 |
| 25. | Swift Trail Junction | 11.2% | 6.8%(+4.41)#25 | 6.8%(+4.42)#2,272 |
| 26. | Tempe | 11.2% | 6.8%(+4.41)#26 | 6.8%(+4.42)#2,275 |
| 27. | Morristown | 11.1% | 6.8%(+4.33)#27 | 6.8%(+4.35)#2,313 |
| 28. | Sahuarita | 11.1% | 6.8%(+4.28)#28 | 6.8%(+4.29)#2,350 |
| 29. | Fountain Hills | 11.0% | 6.8%(+4.18)#29 | 6.8%(+4.20)#2,392 |
| 30. | Red Rock Cdp Pinal County | 10.8% | 6.8%(+3.99)#30 | 6.8%(+4.00)#2,483 |
| 31. | Brenda | 10.8% | 6.8%(+3.97)#31 | 6.8%(+3.99)#2,492 |
| 32. | Marana | 10.7% | 6.8%(+3.94)#32 | 6.8%(+3.96)#2,504 |
| 33. | Morenci | 10.7% | 6.8%(+3.93)#33 | 6.8%(+3.95)#2,517 |
| 34. | Catalina Foothills | 10.6% | 6.8%(+3.85)#34 | 6.8%(+3.87)#2,559 |
| 35. | Timberline-Fernwood | 10.6% | 6.8%(+3.81)#35 | 6.8%(+3.82)#2,588 |
| 36. | Valle Vista | 10.6% | 6.8%(+3.80)#36 | 6.8%(+3.82)#2,592 |
| 37. | Tanque Verde | 10.6% | 6.8%(+3.77)#37 | 6.8%(+3.79)#2,606 |
| 38. | Centennial Park | 10.5% | 6.8%(+3.76)#38 | 6.8%(+3.78)#2,612 |
| 39. | Gilbert | 10.5% | 6.8%(+3.68)#39 | 6.8%(+3.70)#2,655 |
| 40. | Walnut Creek | 10.2% | 6.8%(+3.42)#40 | 6.8%(+3.43)#2,816 |
| 41. | Many Farms | 10.0% | 6.8%(+3.22)#41 | 6.8%(+3.24)#2,942 |
| 42. | Jeddito | 10.0% | 6.8%(+3.22)#42 | 6.8%(+3.24)#2,948 |
| 43. | Paradise Valley | 9.9% | 6.8%(+3.14)#43 | 6.8%(+3.15)#2,999 |
| 44. | Saddlebrooke | 9.9% | 6.8%(+3.12)#44 | 6.8%(+3.13)#3,006 |
| 45. | Pinetop Country Club | 9.8% | 6.8%(+3.06)#45 | 6.8%(+3.08)#3,048 |
| 46. | Sierra Vista | 9.8% | 6.8%(+3.02)#46 | 6.8%(+3.04)#3,071 |
| 47. | Stotonic Village | 9.4% | 6.8%(+2.63)#47 | 6.8%(+2.64)#3,390 |
| 48. | Cornville | 9.3% | 6.8%(+2.52)#48 | 6.8%(+2.54)#3,462 |
| 49. | Round Rock | 9.1% | 6.8%(+2.31)#49 | 6.8%(+2.33)#3,627 |
| 50. | Clarkdale | 9.1% | 6.8%(+2.30)#50 | 6.8%(+2.31)#3,650 |
| 51. | Arizona City | 9.0% | 6.8%(+2.25)#51 | 6.8%(+2.26)#3,686 |
| 52. | Shonto | 8.9% | 6.8%(+2.12)#52 | 6.8%(+2.14)#3,805 |
| 53. | Hackberry | 8.9% | 6.8%(+2.09)#53 | 6.8%(+2.11)#3,834 |
| 54. | Scottsdale | 8.8% | 6.8%(+2.04)#54 | 6.8%(+2.06)#3,887 |
| 55. | Chinle | 8.8% | 6.8%(+1.99)#55 | 6.8%(+2.01)#3,923 |
| 56. | San Manuel | 8.7% | 6.8%(+1.90)#56 | 6.8%(+1.92)#3,992 |
| 57. | Cave Creek | 8.6% | 6.8%(+1.82)#57 | 6.8%(+1.83)#4,064 |
| 58. | San Jose | 8.5% | 6.8%(+1.73)#58 | 6.8%(+1.75)#4,163 |
| 59. | Williamson | 8.5% | 6.8%(+1.70)#59 | 6.8%(+1.72)#4,194 |
| 60. | Doney Park | 8.4% | 6.8%(+1.62)#60 | 6.8%(+1.64)#4,263 |
| 61. | Wenden | 8.4% | 6.8%(+1.62)#61 | 6.8%(+1.64)#4,266 |
| 62. | Red Lake | 8.3% | 6.8%(+1.52)#62 | 6.8%(+1.54)#4,370 |
| 63. | Tucson Estates | 8.0% | 6.8%(+1.20)#63 | 6.8%(+1.22)#4,730 |
| 64. | Pinon | 7.9% | 6.8%(+1.15)#64 | 6.8%(+1.17)#4,778 |
| 65. | Flagstaff | 7.9% | 6.8%(+1.11)#65 | 6.8%(+1.12)#4,841 |
| 66. | Casas Adobes | 7.8% | 6.8%(+0.979)#66 | 6.8%(+0.995)#4,991 |
| 67. | Upper Santan Village | 7.7% | 6.8%(+0.963)#67 | 6.8%(+0.979)#5,013 |
| 68. | Litchfield Park | 7.7% | 6.8%(+0.905)#68 | 6.8%(+0.921)#5,100 |
| 69. | Queen Creek | 7.6% | 6.8%(+0.834)#69 | 6.8%(+0.850)#5,175 |
| 70. | Kachina Village | 7.6% | 6.8%(+0.803)#70 | 6.8%(+0.820)#5,203 |
| 71. | Peach Springs | 7.5% | 6.8%(+0.743)#71 | 6.8%(+0.760)#5,273 |
| 72. | Topawa | 7.5% | 6.8%(+0.682)#72 | 6.8%(+0.698)#5,334 |
| 73. | Mescal | 7.5% | 6.8%(+0.675)#73 | 6.8%(+0.691)#5,342 |
| 74. | Safford | 7.4% | 6.8%(+0.624)#74 | 6.8%(+0.640)#5,407 |
| 75. | Willow Valley | 7.1% | 6.8%(+0.362)#75 | 6.8%(+0.378)#5,738 |
| 76. | Sun Lakes | 7.1% | 6.8%(+0.357)#76 | 6.8%(+0.373)#5,769 |
| 77. | Mesa | 7.0% | 6.8%(+0.252)#77 | 6.8%(+0.268)#5,917 |
| 78. | Pirtleville | 6.9% | 6.8%(+0.123)#78 | 6.8%(+0.139)#6,095 |
| 79. | Peoria | 6.8% | 6.8%(+0.004)#79 | 6.8%(+0.020)#6,288 |
| 80. | Maricopa | 6.6% | 6.8%(-0.157)#80 | 6.8%(-0.141)#6,507 |
| 81. | Dilkon | 6.6% | 6.8%(-0.163)#81 | 6.8%(-0.147)#6,522 |
| 82. | Elephant Head | 6.6% | 6.8%(-0.169)#82 | 6.8%(-0.153)#6,533 |
| 83. | Tucson | 6.6% | 6.8%(-0.196)#83 | 6.8%(-0.180)#6,572 |
| 84. | Anthem | 6.6% | 6.8%(-0.224)#84 | 6.8%(-0.208)#6,611 |
| 85. | Icehouse Canyon | 6.5% | 6.8%(-0.245)#85 | 6.8%(-0.229)#6,642 |
| 86. | Dripping Springs | 6.5% | 6.8%(-0.259)#86 | 6.8%(-0.243)#6,670 |
| 87. | Superior | 6.5% | 6.8%(-0.291)#87 | 6.8%(-0.275)#6,726 |
| 88. | Wall Lane | 6.5% | 6.8%(-0.299)#88 | 6.8%(-0.283)#6,736 |
| 89. | Phoenix | 6.5% | 6.8%(-0.331)#89 | 6.8%(-0.315)#6,784 |
| 90. | Holbrook | 6.4% | 6.8%(-0.335)#90 | 6.8%(-0.319)#6,790 |
| 91. | Central Heights Midland City | 6.4% | 6.8%(-0.405)#91 | 6.8%(-0.389)#6,895 |
| 92. | Patagonia | 6.3% | 6.8%(-0.452)#92 | 6.8%(-0.436)#6,996 |
| 93. | Prescott | 6.2% | 6.8%(-0.542)#93 | 6.8%(-0.526)#7,146 |
| 94. | Gadsden | 6.2% | 6.8%(-0.570)#94 | 6.8%(-0.554)#7,187 |
| 95. | Spring Valley | 6.2% | 6.8%(-0.572)#95 | 6.8%(-0.556)#7,194 |
| 96. | Kearny | 6.1% | 6.8%(-0.673)#96 | 6.8%(-0.657)#7,377 |
| 97. | Carefree | 6.0% | 6.8%(-0.801)#97 | 6.8%(-0.785)#7,626 |
| 98. | Tombstone | 5.9% | 6.8%(-0.855)#98 | 6.8%(-0.839)#7,735 |
| 99. | Wilhoit | 5.8% | 6.8%(-0.947)#99 | 6.8%(-0.931)#7,930 |
| 100. | Pima | 5.8% | 6.8%(-0.961)#100 | 6.8%(-0.945)#7,955 |
Common Questions
What are the Top 10 Cities with the Highest Percentage of Population Employed in Computer, Engineering & Science in Arizona?
Top 10 Cities with the Highest Percentage of Population Employed in Computer, Engineering & Science in Arizona are:
#1
60.9%
#2
58.6%
#3
47.4%
#4
36.6%
#5
28.2%
#6
27.8%
#7
21.2%
#8
18.0%
#9
17.7%
#10
15.4%
What city has the Highest Percentage of Population Employed in Computer, Engineering & Science in Arizona?
Whispering Pines has the Highest Percentage of Population Employed in Computer, Engineering & Science in Arizona with 60.9%.
What is the Percentage of Population Employed in Computer, Engineering & Science in the State of Arizona?
Percentage of Population Employed in Computer, Engineering & Science in Arizona is 6.8%.
What is the Percentage of Population Employed in Computer, Engineering & Science in the United States?
Percentage of Population Employed in Computer, Engineering & Science in the United States is 6.8%.