Lexington Hills, CA Map & Demographics
Lexington Hills Map
Lexington Hills Overview
$113,089
PER CAPITA INCOME
$250,001
AVG FAMILY INCOME
$245,536
AVG HOUSEHOLD INCOME
67.5%
WAGE / INCOME GAP [ % ]
32.5¢/ $1
WAGE / INCOME GAP [ $ ]
0.41
INEQUALITY / GINI INDEX
2,587
TOTAL POPULATION
1,422
MALE POPULATION
1,165
FEMALE POPULATION
122.06
MALES / 100 FEMALES
81.93
FEMALES / 100 MALES
43.4
MEDIAN AGE
3.0
AVG FAMILY SIZE
2.9
AVG HOUSEHOLD SIZE
1,529
LABOR FORCE [ PEOPLE ]
74.1%
PERCENT IN LABOR FORCE
1.0%
UNEMPLOYMENT RATE
Income in Lexington Hills
Income Overview in Lexington Hills
Per Capita Income in Lexington Hills is $113,089, while median incomes of families and households are $250,001 and $245,536 respectively.
| Characteristic | Number | Measure |
| Per Capita Income | 2,587 | $113,089 |
| Median Family Income | 748 | $250,001 |
| Mean Family Income | 748 | $319,743 |
| Median Household Income | 890 | $245,536 |
| Mean Household Income | 890 | $320,644 |
| Income Deficit | 748 | $0 |
| Wage / Income Gap (%) | 2,587 | 67.52% |
| Wage / Income Gap ($) | 2,587 | 32.48¢ per $1 |
| Gini / Inequality Index | 2,587 | 0.41 |
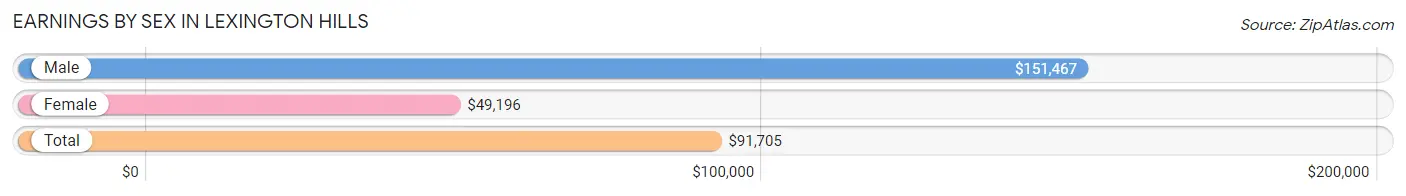
Earnings by Sex in Lexington Hills
Average Earnings in Lexington Hills are $91,705, $151,467 for men and $49,196 for women, a difference of 67.5%.
| Sex | Number | Average Earnings |
| Male | 865 (54.6%) | $151,467 |
| Female | 718 (45.4%) | $49,196 |
| Total | 1,583 (100.0%) | $91,705 |
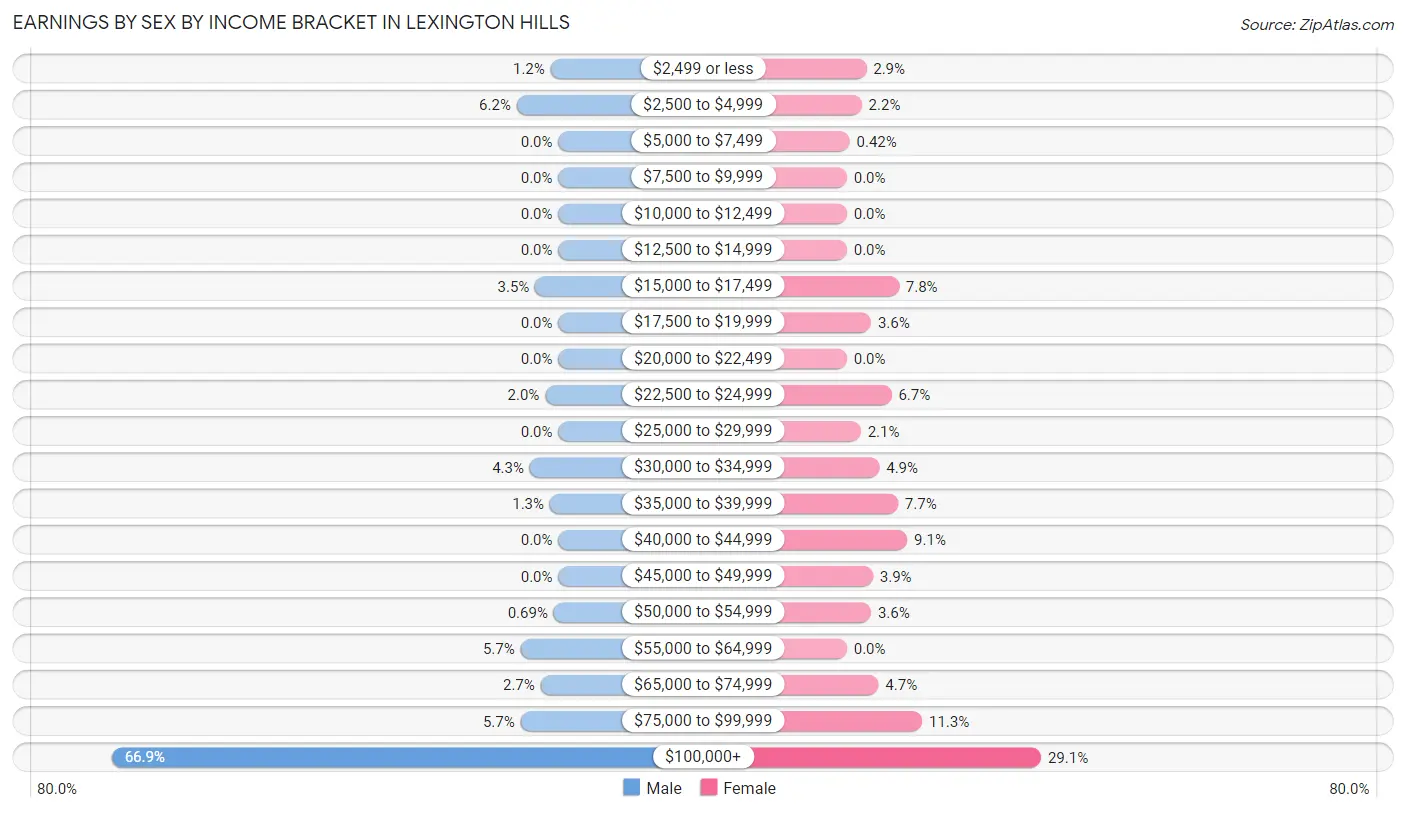
Earnings by Sex by Income Bracket in Lexington Hills
The most common earnings brackets in Lexington Hills are $100,000+ for men (579 | 66.9%) and $100,000+ for women (209 | 29.1%).
| Income | Male | Female |
| $2,499 or less | 10 (1.2%) | 21 (2.9%) |
| $2,500 to $4,999 | 54 (6.2%) | 16 (2.2%) |
| $5,000 to $7,499 | 0 (0.0%) | 3 (0.4%) |
| $7,500 to $9,999 | 0 (0.0%) | 0 (0.0%) |
| $10,000 to $12,499 | 0 (0.0%) | 0 (0.0%) |
| $12,500 to $14,999 | 0 (0.0%) | 0 (0.0%) |
| $15,000 to $17,499 | 30 (3.5%) | 56 (7.8%) |
| $17,500 to $19,999 | 0 (0.0%) | 26 (3.6%) |
| $20,000 to $22,499 | 0 (0.0%) | 0 (0.0%) |
| $22,500 to $24,999 | 17 (2.0%) | 48 (6.7%) |
| $25,000 to $29,999 | 0 (0.0%) | 15 (2.1%) |
| $30,000 to $34,999 | 37 (4.3%) | 35 (4.9%) |
| $35,000 to $39,999 | 11 (1.3%) | 55 (7.7%) |
| $40,000 to $44,999 | 0 (0.0%) | 65 (9.0%) |
| $45,000 to $49,999 | 0 (0.0%) | 28 (3.9%) |
| $50,000 to $54,999 | 6 (0.7%) | 26 (3.6%) |
| $55,000 to $64,999 | 49 (5.7%) | 0 (0.0%) |
| $65,000 to $74,999 | 23 (2.7%) | 34 (4.7%) |
| $75,000 to $99,999 | 49 (5.7%) | 81 (11.3%) |
| $100,000+ | 579 (66.9%) | 209 (29.1%) |
| Total | 865 (100.0%) | 718 (100.0%) |
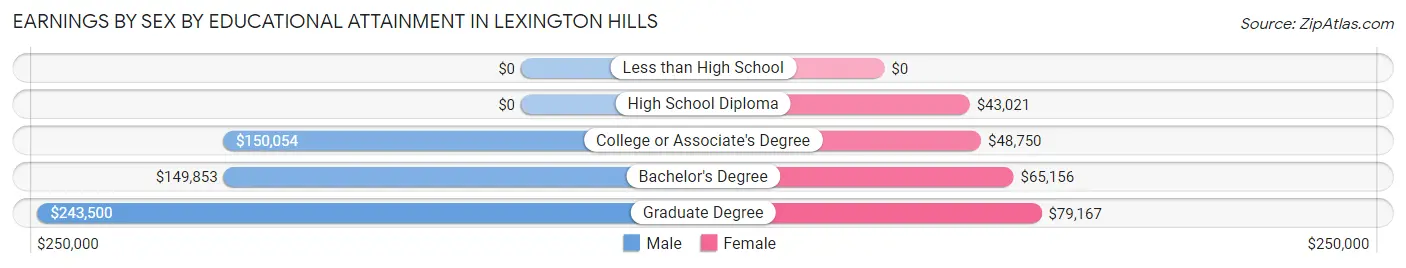
Earnings by Sex by Educational Attainment in Lexington Hills
Average earnings in Lexington Hills are $159,792 for men and $49,821 for women, a difference of 68.8%. Men with an educational attainment of graduate degree enjoy the highest average annual earnings of $243,500, while those with bachelor's degree education earn the least with $149,853. Women with an educational attainment of graduate degree earn the most with the average annual earnings of $79,167, while those with high school diploma education have the smallest earnings of $43,021.
| Educational Attainment | Male Income | Female Income |
| Less than High School | - | - |
| High School Diploma | - | - |
| College or Associate's Degree | $150,054 | $48,750 |
| Bachelor's Degree | $149,853 | $65,156 |
| Graduate Degree | $243,500 | $79,167 |
| Total | $159,792 | $49,821 |
Family Income in Lexington Hills
Family Income Brackets in Lexington Hills
According to the Lexington Hills family income data, there are 487 families falling into the $200,000+ income range, which is the most common income bracket and makes up 65.1% of all families.
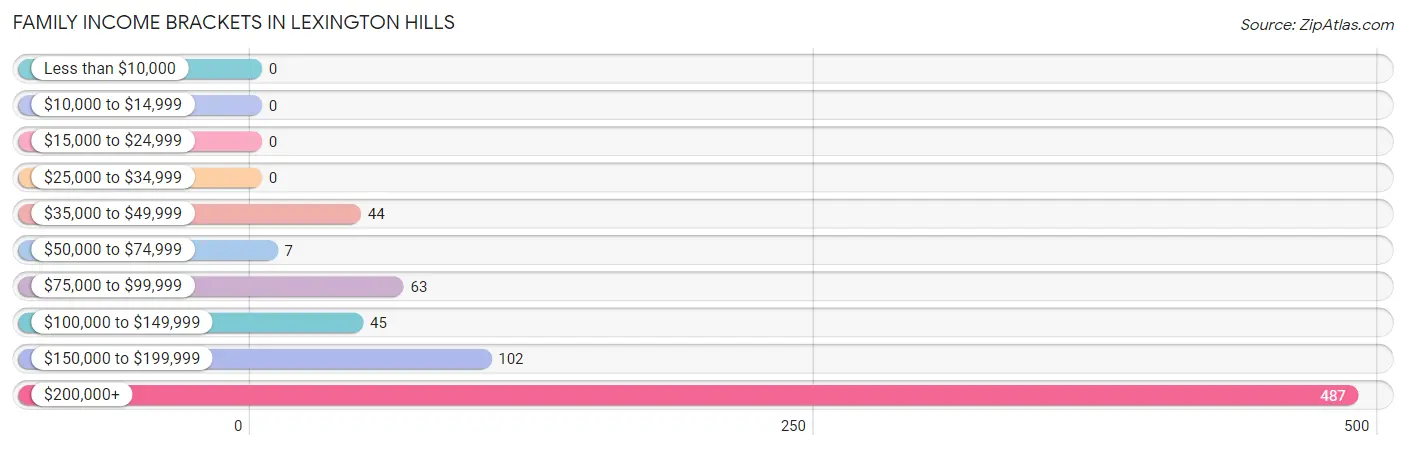
| Income Bracket | # Families | % Families |
| Less than $10,000 | 0 | 0.0% |
| $10,000 to $14,999 | 0 | 0.0% |
| $15,000 to $24,999 | 0 | 0.0% |
| $25,000 to $34,999 | 0 | 0.0% |
| $35,000 to $49,999 | 44 | 5.9% |
| $50,000 to $74,999 | 7 | 0.9% |
| $75,000 to $99,999 | 63 | 8.4% |
| $100,000 to $149,999 | 45 | 6.0% |
| $150,000 to $199,999 | 102 | 13.6% |
| $200,000+ | 487 | 65.1% |
Family Income by Famaliy Size in Lexington Hills
4-person families (148 | 19.8%) account for the highest median family income in Lexington Hills with $250,001 per family, while 2-person families (292 | 39.0%) have the highest median income of $104,910 per family member.
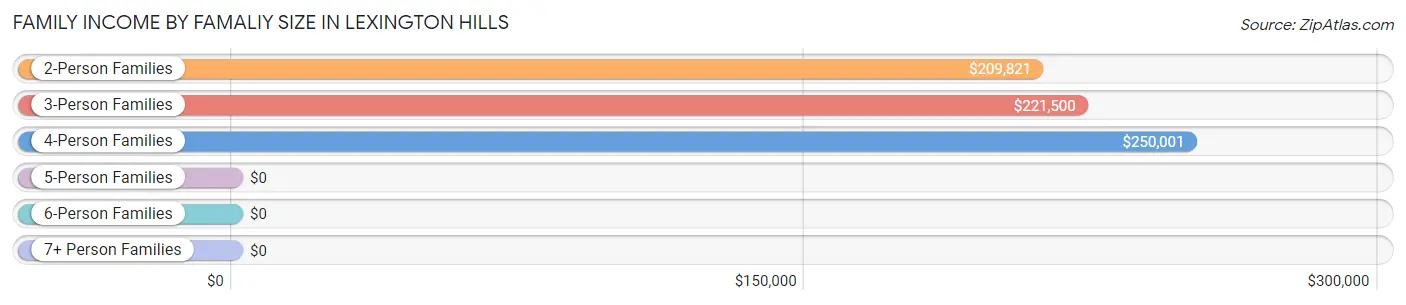
| Income Bracket | # Families | Median Income |
| 2-Person Families | 292 (39.0%) | $209,821 |
| 3-Person Families | 264 (35.3%) | $221,500 |
| 4-Person Families | 148 (19.8%) | $250,001 |
| 5-Person Families | 44 (5.9%) | $0 |
| 6-Person Families | 0 (0.0%) | $0 |
| 7+ Person Families | 0 (0.0%) | $0 |
| Total | 748 (100.0%) | $250,001 |
Family Income by Number of Earners in Lexington Hills
The median family income in Lexington Hills is $250,001, with families comprising 2 earners (473) having the highest median family income of $250,001, while families with no earners (59) have the lowest median family income of $189,659, accounting for 63.2% and 7.9% of families, respectively.
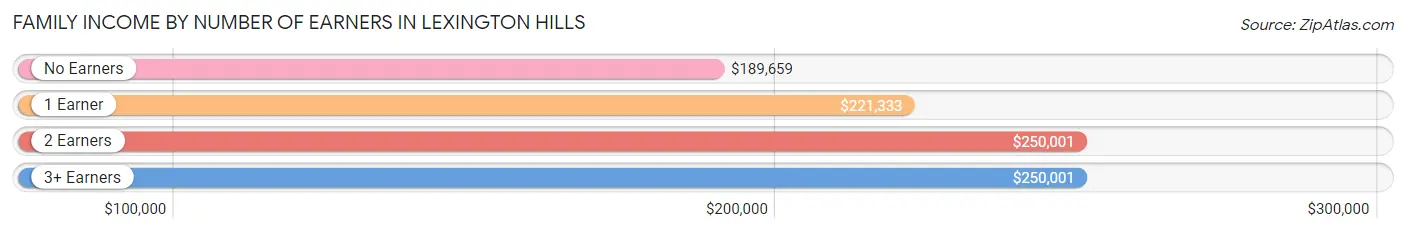
| Number of Earners | # Families | Median Income |
| No Earners | 59 (7.9%) | $189,659 |
| 1 Earner | 160 (21.4%) | $221,333 |
| 2 Earners | 473 (63.2%) | $250,001 |
| 3+ Earners | 56 (7.5%) | $250,001 |
| Total | 748 (100.0%) | $250,001 |
Household Income in Lexington Hills
Household Income Brackets in Lexington Hills
With 578 households falling in the category, the $200,000+ income range is the most frequent in Lexington Hills, accounting for 64.9% of all households.
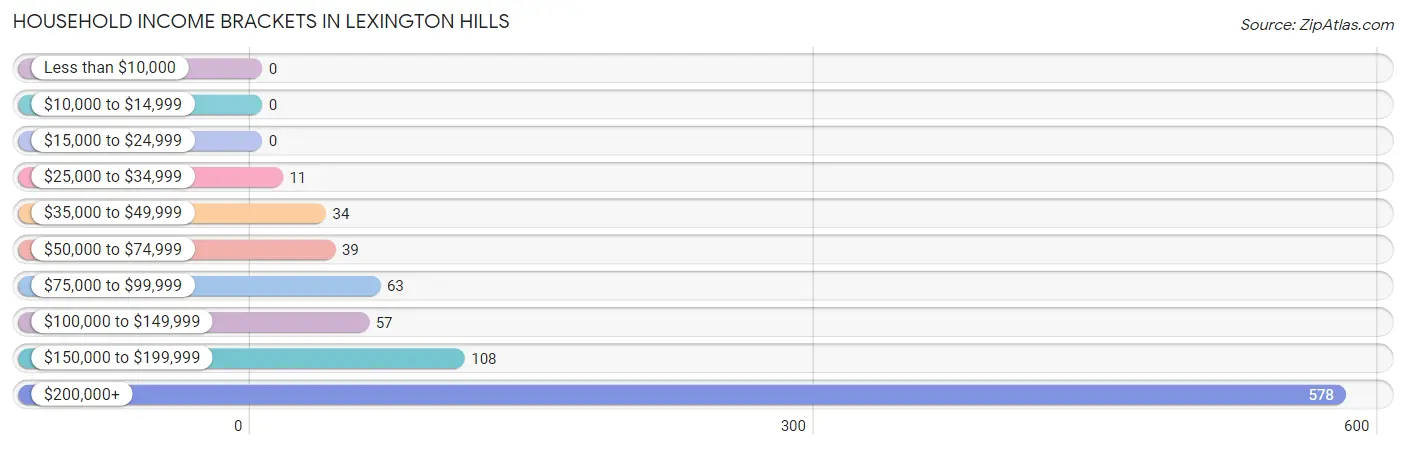
| Income Bracket | # Households | % Households |
| Less than $10,000 | 0 | 0.0% |
| $10,000 to $14,999 | 0 | 0.0% |
| $15,000 to $24,999 | 0 | 0.0% |
| $25,000 to $34,999 | 11 | 1.2% |
| $35,000 to $49,999 | 34 | 3.8% |
| $50,000 to $74,999 | 39 | 4.4% |
| $75,000 to $99,999 | 63 | 7.1% |
| $100,000 to $149,999 | 57 | 6.4% |
| $150,000 to $199,999 | 108 | 12.1% |
| $200,000+ | 578 | 64.9% |
Household Income by Householder Age in Lexington Hills
The median household income in Lexington Hills is $245,536, with the highest median household income of $250,001 found in the 25 to 44 years age bracket for the primary householder. A total of 294 households (33.0%) fall into this category.
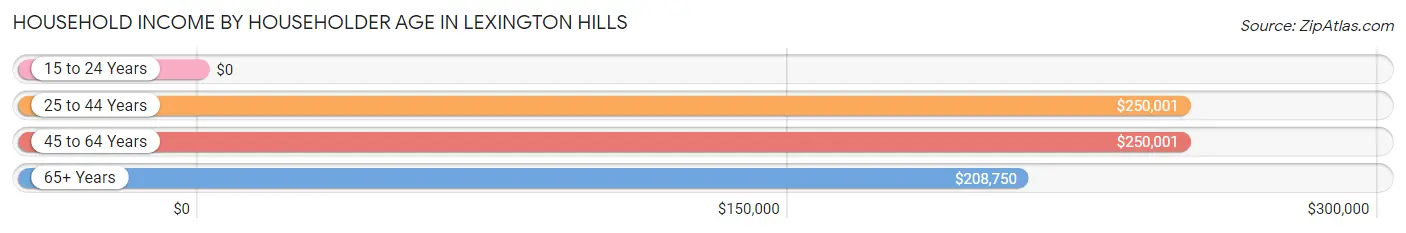
| Income Bracket | # Households | Median Income |
| 15 to 24 Years | 0 (0.0%) | $0 |
| 25 to 44 Years | 294 (33.0%) | $250,001 |
| 45 to 64 Years | 474 (53.3%) | $250,001 |
| 65+ Years | 122 (13.7%) | $208,750 |
| Total | 890 (100.0%) | $245,536 |
Poverty in Lexington Hills
Income Below Poverty by Sex and Age in Lexington Hills
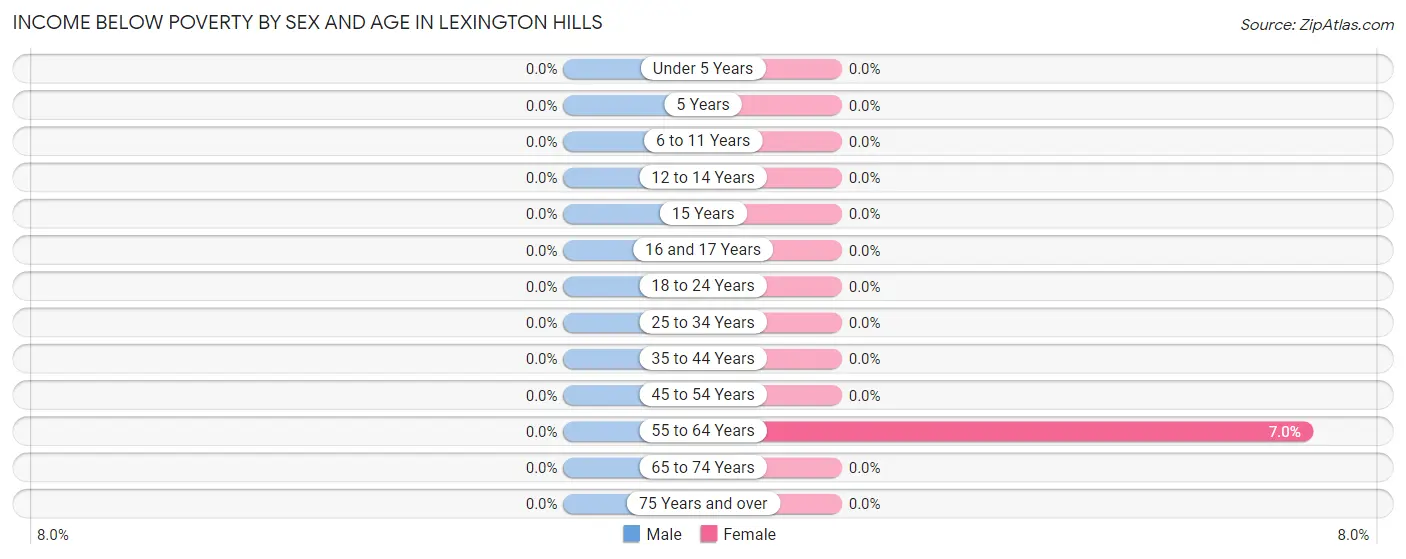
| Age Bracket | Male | Female |
| Under 5 Years | 0 (0.0%) | 0 (0.0%) |
| 5 Years | 0 (0.0%) | 0 (0.0%) |
| 6 to 11 Years | 0 (0.0%) | 0 (0.0%) |
| 12 to 14 Years | 0 (0.0%) | 0 (0.0%) |
| 15 Years | 0 (0.0%) | 0 (0.0%) |
| 16 and 17 Years | 0 (0.0%) | 0 (0.0%) |
| 18 to 24 Years | 0 (0.0%) | 0 (0.0%) |
| 25 to 34 Years | 0 (0.0%) | 0 (0.0%) |
| 35 to 44 Years | 0 (0.0%) | 0 (0.0%) |
| 45 to 54 Years | 0 (0.0%) | 0 (0.0%) |
| 55 to 64 Years | 0 (0.0%) | 13 (7.0%) |
| 65 to 74 Years | 0 (0.0%) | 0 (0.0%) |
| 75 Years and over | 0 (0.0%) | 0 (0.0%) |
| Total | 0 (0.0%) | 13 (1.1%) |
Income Above Poverty by Sex and Age in Lexington Hills
According to the poverty statistics in Lexington Hills, males aged under 5 years and females aged under 5 years are the age groups that are most secure financially, with 100.0% of males and 100.0% of females in these age groups living above the poverty line.
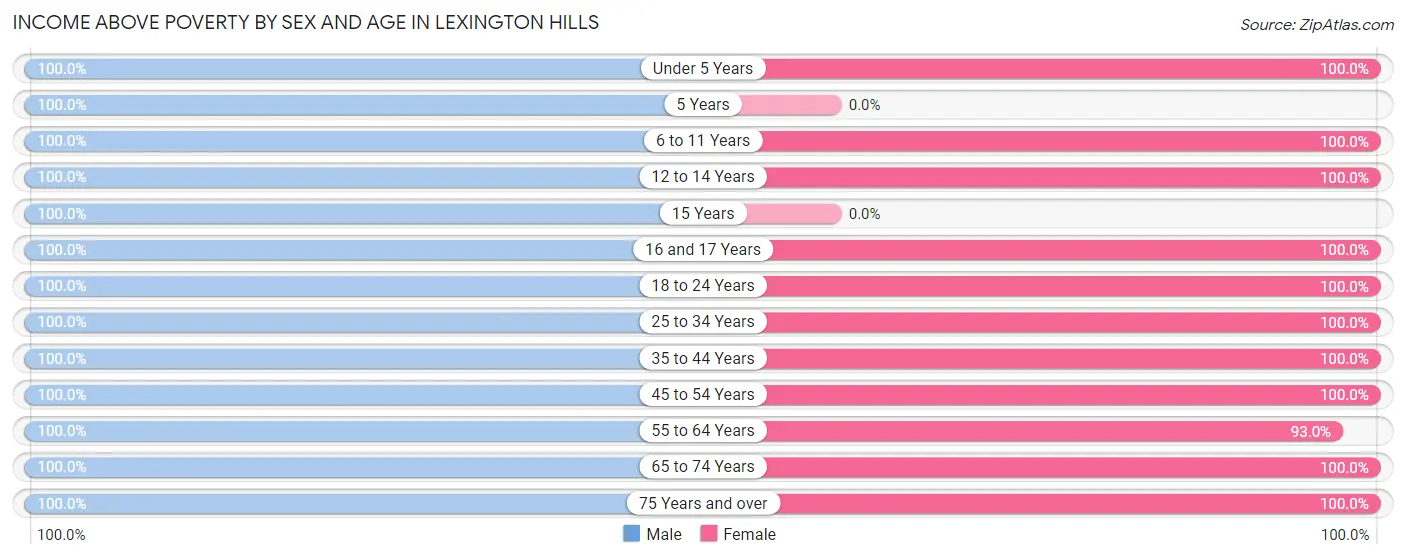
| Age Bracket | Male | Female |
| Under 5 Years | 62 (100.0%) | 35 (100.0%) |
| 5 Years | 16 (100.0%) | 0 (0.0%) |
| 6 to 11 Years | 117 (100.0%) | 105 (100.0%) |
| 12 to 14 Years | 75 (100.0%) | 76 (100.0%) |
| 15 Years | 29 (100.0%) | 0 (0.0%) |
| 16 and 17 Years | 58 (100.0%) | 14 (100.0%) |
| 18 to 24 Years | 128 (100.0%) | 14 (100.0%) |
| 25 to 34 Years | 106 (100.0%) | 116 (100.0%) |
| 35 to 44 Years | 212 (100.0%) | 201 (100.0%) |
| 45 to 54 Years | 200 (100.0%) | 290 (100.0%) |
| 55 to 64 Years | 275 (100.0%) | 173 (93.0%) |
| 65 to 74 Years | 66 (100.0%) | 52 (100.0%) |
| 75 Years and over | 70 (100.0%) | 76 (100.0%) |
| Total | 1,414 (100.0%) | 1,152 (98.9%) |
Income Below Poverty Among Married-Couple Families in Lexington Hills
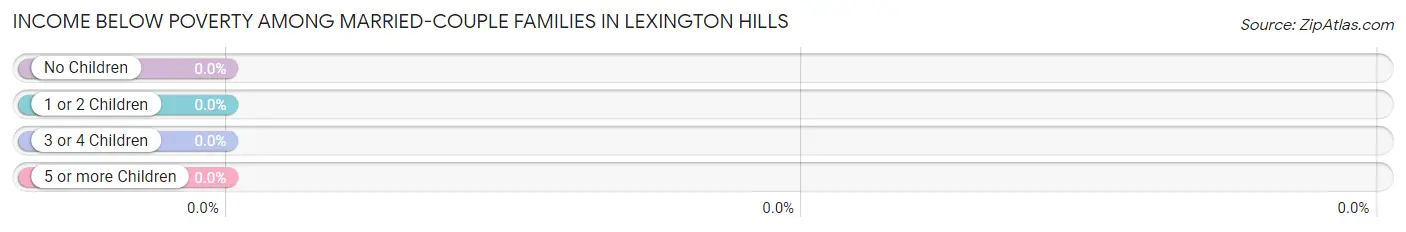
| Children | Above Poverty | Below Poverty |
| No Children | 376 (100.0%) | 0 (0.0%) |
| 1 or 2 Children | 249 (100.0%) | 0 (0.0%) |
| 3 or 4 Children | 44 (100.0%) | 0 (0.0%) |
| 5 or more Children | 0 (0.0%) | 0 (0.0%) |
| Total | 669 (100.0%) | 0 (0.0%) |
Income Below Poverty Among Single-Parent Households in Lexington Hills
| Children | Single Father | Single Mother |
| No Children | 0 (0.0%) | 0 (0.0%) |
| 1 or 2 Children | 0 (0.0%) | 0 (0.0%) |
| 3 or 4 Children | 0 (0.0%) | 0 (0.0%) |
| 5 or more Children | 0 (0.0%) | 0 (0.0%) |
| Total | 0 (0.0%) | 0 (0.0%) |
Income Below Poverty Among Married-Couple vs Single-Parent Households in Lexington Hills
| Children | Married-Couple Families | Single-Parent Households |
| No Children | 0 (0.0%) | 0 (0.0%) |
| 1 or 2 Children | 0 (0.0%) | 0 (0.0%) |
| 3 or 4 Children | 0 (0.0%) | 0 (0.0%) |
| 5 or more Children | 0 (0.0%) | 0 (0.0%) |
| Total | 0 (0.0%) | 0 (0.0%) |
Race in Lexington Hills
The most populous races in Lexington Hills are White / Caucasian (2,163 | 83.6%), Two or more Races (228 | 8.8%), and Hispanic or Latino (172 | 6.7%).
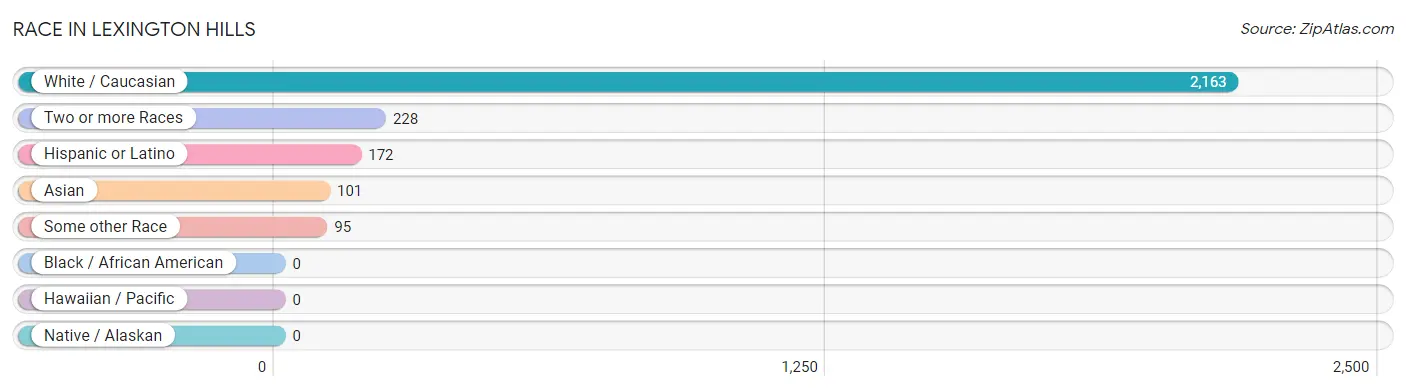
| Race | # Population | % Population |
| Asian | 101 | 3.9% |
| Black / African American | 0 | 0.0% |
| Hawaiian / Pacific | 0 | 0.0% |
| Hispanic or Latino | 172 | 6.7% |
| Native / Alaskan | 0 | 0.0% |
| White / Caucasian | 2,163 | 83.6% |
| Two or more Races | 228 | 8.8% |
| Some other Race | 95 | 3.7% |
| Total | 2,587 | 100.0% |
Ancestry in Lexington Hills
The most populous ancestries reported in Lexington Hills are German (553 | 21.4%), English (364 | 14.1%), Irish (258 | 10.0%), Italian (207 | 8.0%), and Mexican (140 | 5.4%), together accounting for 58.8% of all Lexington Hills residents.
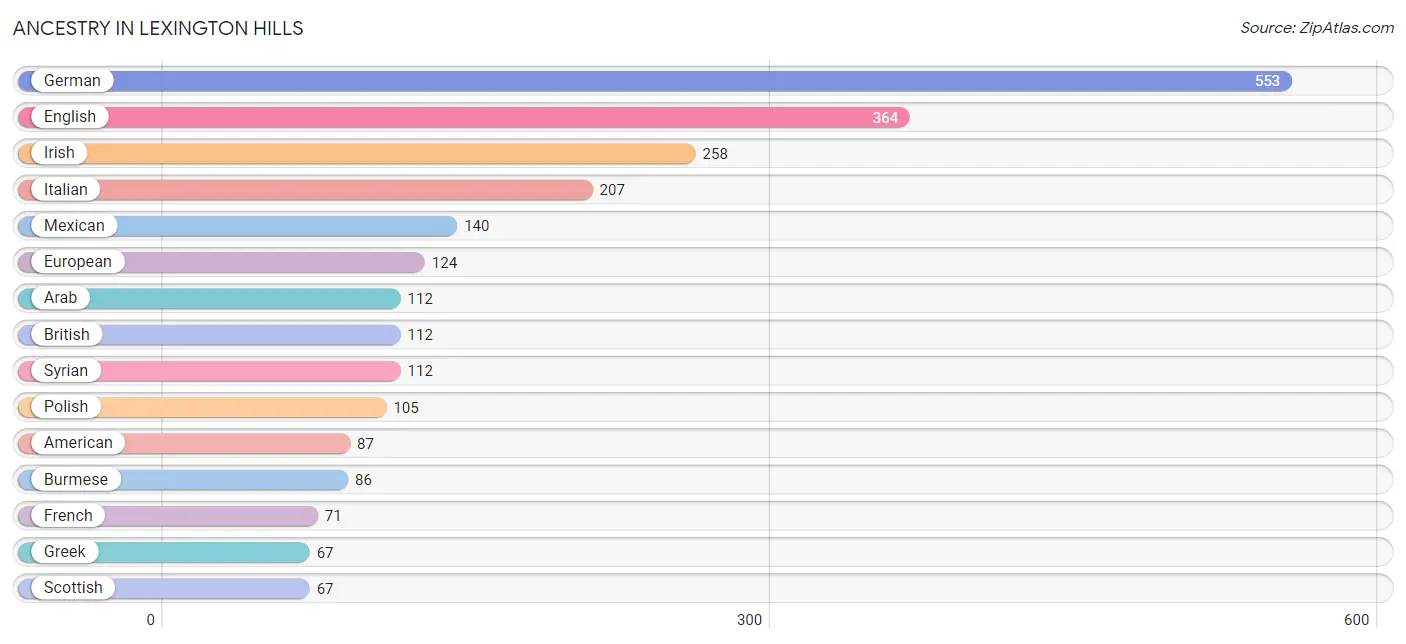
| Ancestry | # Population | % Population |
| American | 87 | 3.4% |
| Apache | 5 | 0.2% |
| Arab | 112 | 4.3% |
| Austrian | 12 | 0.5% |
| Barbadian | 18 | 0.7% |
| Bhutanese | 6 | 0.2% |
| British | 112 | 4.3% |
| Bulgarian | 12 | 0.5% |
| Burmese | 86 | 3.3% |
| Canadian | 12 | 0.5% |
| Croatian | 41 | 1.6% |
| Cuban | 22 | 0.9% |
| Dutch | 31 | 1.2% |
| Eastern European | 25 | 1.0% |
| English | 364 | 14.1% |
| European | 124 | 4.8% |
| French | 71 | 2.7% |
| French Canadian | 14 | 0.5% |
| German | 553 | 21.4% |
| Greek | 67 | 2.6% |
| Indian (Asian) | 17 | 0.7% |
| Irish | 258 | 10.0% |
| Italian | 207 | 8.0% |
| Korean | 57 | 2.2% |
| Lithuanian | 20 | 0.8% |
| Mexican | 140 | 5.4% |
| Mexican American Indian | 1 | 0.0% |
| Native Hawaiian | 10 | 0.4% |
| Northern European | 34 | 1.3% |
| Norwegian | 56 | 2.2% |
| Pennsylvania German | 10 | 0.4% |
| Polish | 105 | 4.1% |
| Portuguese | 60 | 2.3% |
| Romanian | 20 | 0.8% |
| Russian | 41 | 1.6% |
| Samoan | 22 | 0.9% |
| Scandinavian | 20 | 0.8% |
| Scotch-Irish | 51 | 2.0% |
| Scottish | 67 | 2.6% |
| Spaniard | 10 | 0.4% |
| Swedish | 29 | 1.1% |
| Swiss | 3 | 0.1% |
| Syrian | 112 | 4.3% |
| Thai | 41 | 1.6% |
| Welsh | 36 | 1.4% | View All 45 Rows |
Immigrants in Lexington Hills
The most numerous immigrant groups reported in Lexington Hills came from Europe (168 | 6.5%), Asia (112 | 4.3%), Northern Europe (99 | 3.8%), Western Europe (69 | 2.7%), and Eastern Asia (64 | 2.5%), together accounting for 19.8% of all Lexington Hills residents.
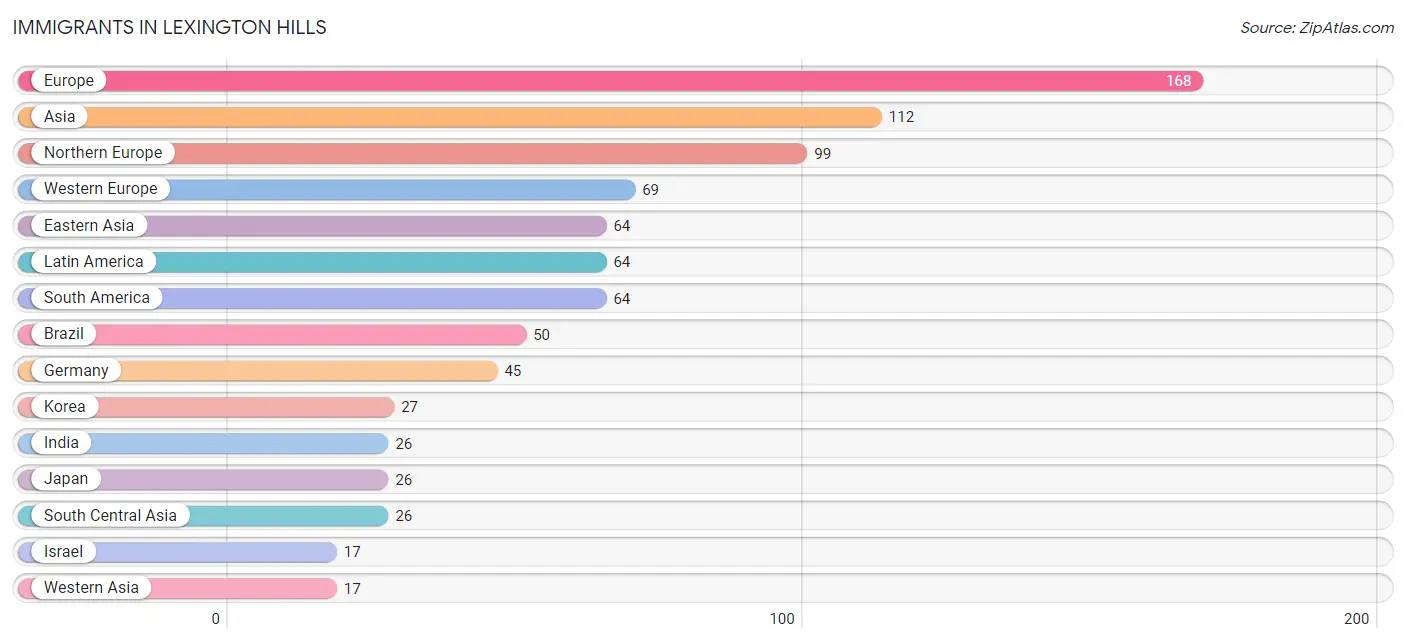
| Immigration Origin | # Population | % Population |
| Asia | 112 | 4.3% |
| Brazil | 50 | 1.9% |
| Canada | 16 | 0.6% |
| China | 11 | 0.4% |
| Colombia | 14 | 0.5% |
| Eastern Asia | 64 | 2.5% |
| Europe | 168 | 6.5% |
| France | 14 | 0.5% |
| Germany | 45 | 1.7% |
| India | 26 | 1.0% |
| Israel | 17 | 0.7% |
| Japan | 26 | 1.0% |
| Korea | 27 | 1.0% |
| Latin America | 64 | 2.5% |
| Malaysia | 5 | 0.2% |
| Netherlands | 7 | 0.3% |
| Northern Europe | 99 | 3.8% |
| South America | 64 | 2.5% |
| South Central Asia | 26 | 1.0% |
| South Eastern Asia | 5 | 0.2% |
| Sweden | 6 | 0.2% |
| Switzerland | 3 | 0.1% |
| Western Asia | 17 | 0.7% |
| Western Europe | 69 | 2.7% | View All 24 Rows |
Sex and Age in Lexington Hills
Sex and Age in Lexington Hills
The most populous age groups in Lexington Hills are 50 to 54 Years (189 | 13.3%) for men and 50 to 54 Years (186 | 16.0%) for women.
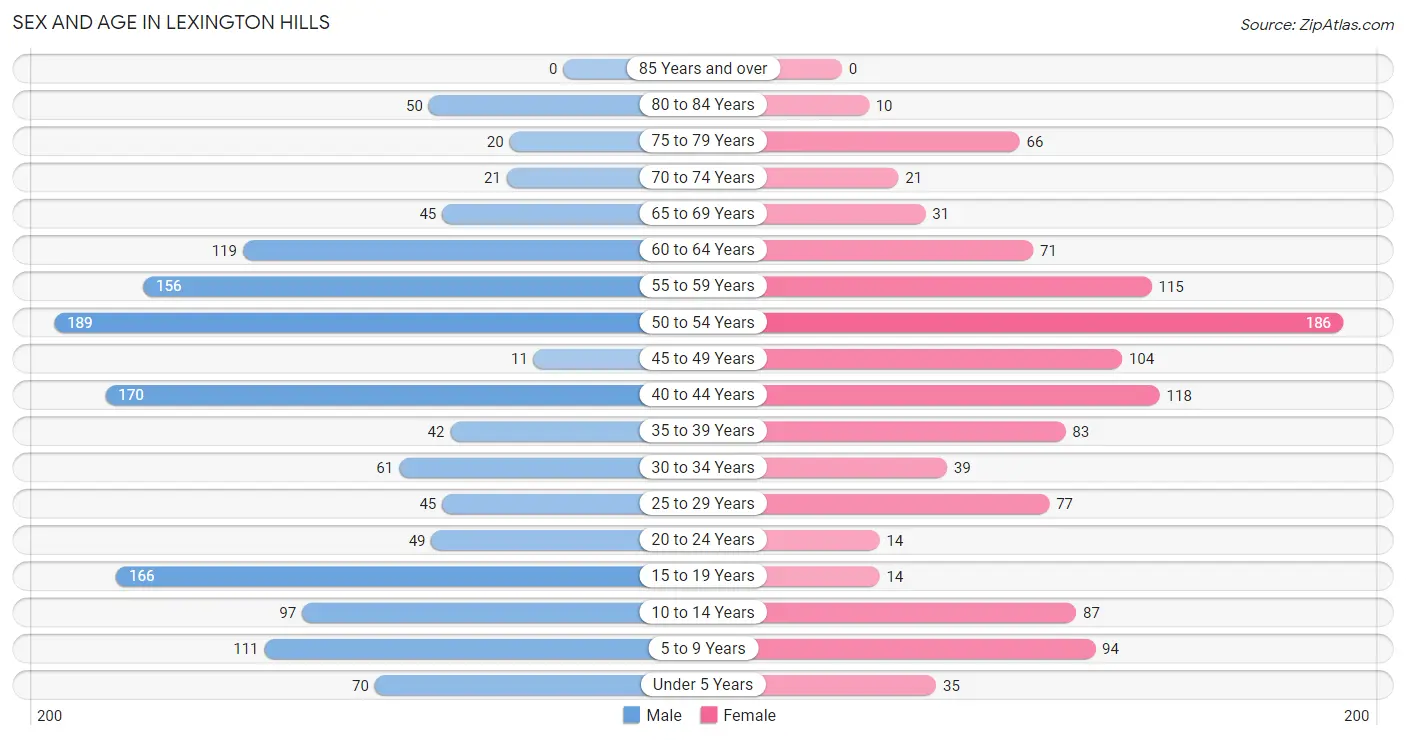
| Age Bracket | Male | Female |
| Under 5 Years | 70 (4.9%) | 35 (3.0%) |
| 5 to 9 Years | 111 (7.8%) | 94 (8.1%) |
| 10 to 14 Years | 97 (6.8%) | 87 (7.5%) |
| 15 to 19 Years | 166 (11.7%) | 14 (1.2%) |
| 20 to 24 Years | 49 (3.5%) | 14 (1.2%) |
| 25 to 29 Years | 45 (3.2%) | 77 (6.6%) |
| 30 to 34 Years | 61 (4.3%) | 39 (3.4%) |
| 35 to 39 Years | 42 (2.9%) | 83 (7.1%) |
| 40 to 44 Years | 170 (11.9%) | 118 (10.1%) |
| 45 to 49 Years | 11 (0.8%) | 104 (8.9%) |
| 50 to 54 Years | 189 (13.3%) | 186 (16.0%) |
| 55 to 59 Years | 156 (11.0%) | 115 (9.9%) |
| 60 to 64 Years | 119 (8.4%) | 71 (6.1%) |
| 65 to 69 Years | 45 (3.2%) | 31 (2.7%) |
| 70 to 74 Years | 21 (1.5%) | 21 (1.8%) |
| 75 to 79 Years | 20 (1.4%) | 66 (5.7%) |
| 80 to 84 Years | 50 (3.5%) | 10 (0.9%) |
| 85 Years and over | 0 (0.0%) | 0 (0.0%) |
| Total | 1,422 (100.0%) | 1,165 (100.0%) |
Families and Households in Lexington Hills
Median Family Size in Lexington Hills
The median family size in Lexington Hills is 3.05 persons per family, with single female/mother families (27 | 3.6%) accounting for the largest median family size of 3.3 persons per family. On the other hand, single male/father families (52 | 7.0%) represent the smallest median family size with 2.21 persons per family.
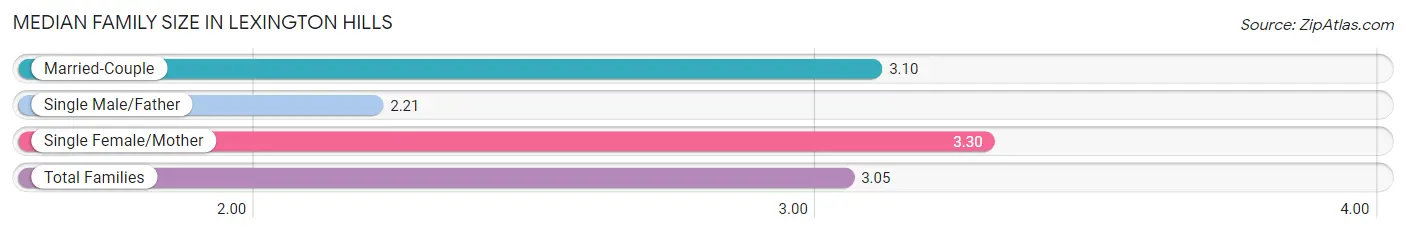
| Family Type | # Families | Family Size |
| Married-Couple | 669 (89.4%) | 3.10 |
| Single Male/Father | 52 (7.0%) | 2.21 |
| Single Female/Mother | 27 (3.6%) | 3.30 |
| Total Families | 748 (100.0%) | 3.05 |
Median Household Size in Lexington Hills
The median household size in Lexington Hills is 2.89 persons per household, with single female/mother households (27 | 3.0%) accounting for the largest median household size of 4.15 persons per household. non-family households (142 | 16.0%) represent the smallest median household size with 1.69 persons per household.
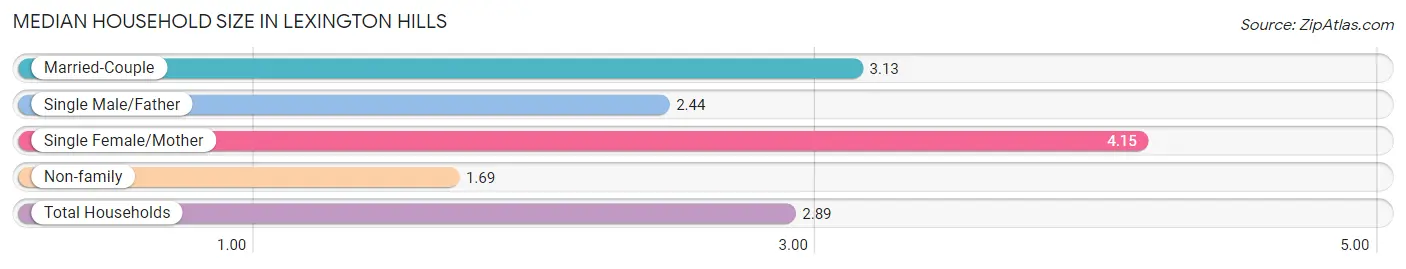
| Household Type | # Households | Household Size |
| Married-Couple | 669 (75.2%) | 3.13 |
| Single Male/Father | 52 (5.8%) | 2.44 |
| Single Female/Mother | 27 (3.0%) | 4.15 |
| Non-family | 142 (16.0%) | 1.69 |
| Total Households | 890 (100.0%) | 2.89 |
Household Size by Marriage Status in Lexington Hills
Out of a total of 890 households in Lexington Hills, 748 (84.0%) are family households, while 142 (16.0%) are nonfamily households. The most numerous type of family households are 3-person households, comprising 283, and the most common type of nonfamily households are 1-person households, comprising 85.
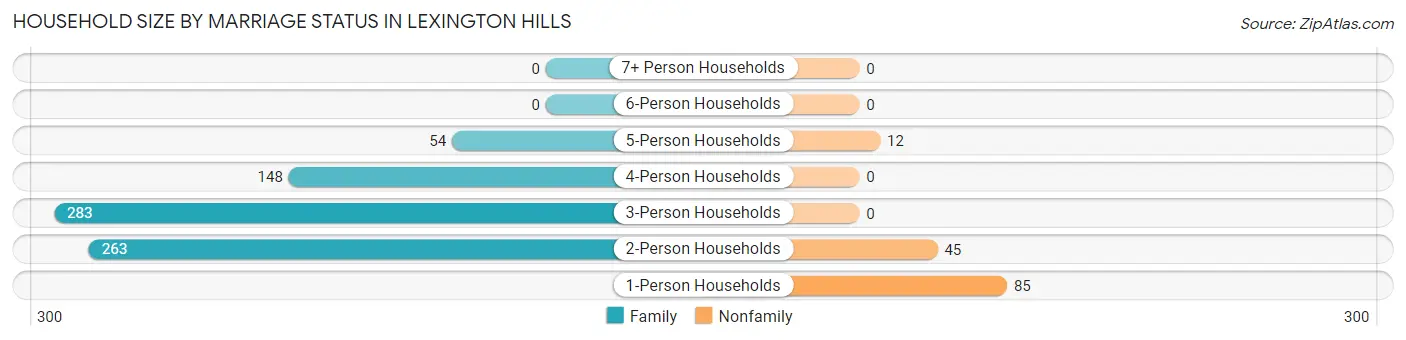
| Household Size | Family Households | Nonfamily Households |
| 1-Person Households | - | 85 (9.6%) |
| 2-Person Households | 263 (29.5%) | 45 (5.1%) |
| 3-Person Households | 283 (31.8%) | 0 (0.0%) |
| 4-Person Households | 148 (16.6%) | 0 (0.0%) |
| 5-Person Households | 54 (6.1%) | 12 (1.3%) |
| 6-Person Households | 0 (0.0%) | 0 (0.0%) |
| 7+ Person Households | 0 (0.0%) | 0 (0.0%) |
| Total | 748 (84.0%) | 142 (16.0%) |
Female Fertility in Lexington Hills
Fertility by Age in Lexington Hills
Average fertility rate in Lexington Hills is 35.0 births per 1,000 women. Women in the age bracket of 35 to 50 years have the highest fertility rate with 50.0 births per 1,000 women. Women in the age bracket of 35 to 50 years acount for 100.0% of all women with births.
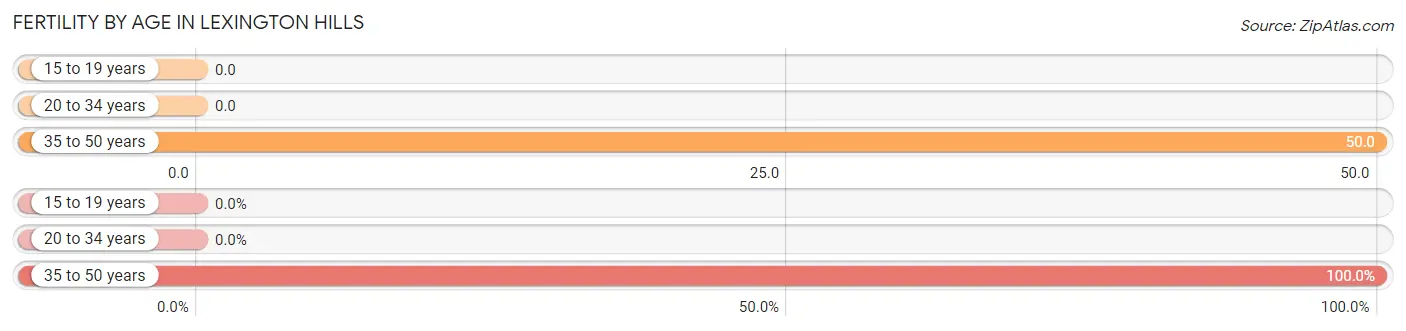
| Age Bracket | Women with Births | Births / 1,000 Women |
| 15 to 19 years | 0 (0.0%) | 0.0 |
| 20 to 34 years | 0 (0.0%) | 0.0 |
| 35 to 50 years | 16 (100.0%) | 50.0 |
| Total | 16 (100.0%) | 35.0 |
Fertility by Age by Marriage Status in Lexington Hills
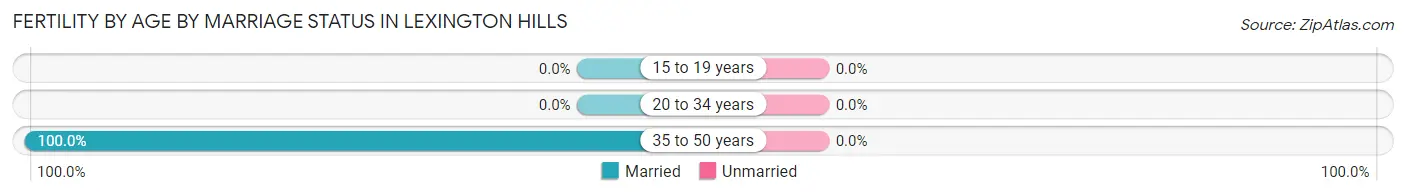
| Age Bracket | Married | Unmarried |
| 15 to 19 years | 0 (0.0%) | 0 (0.0%) |
| 20 to 34 years | 0 (0.0%) | 0 (0.0%) |
| 35 to 50 years | 16 (100.0%) | 0 (0.0%) |
| Total | 16 (100.0%) | 0 (0.0%) |
Fertility by Education in Lexington Hills
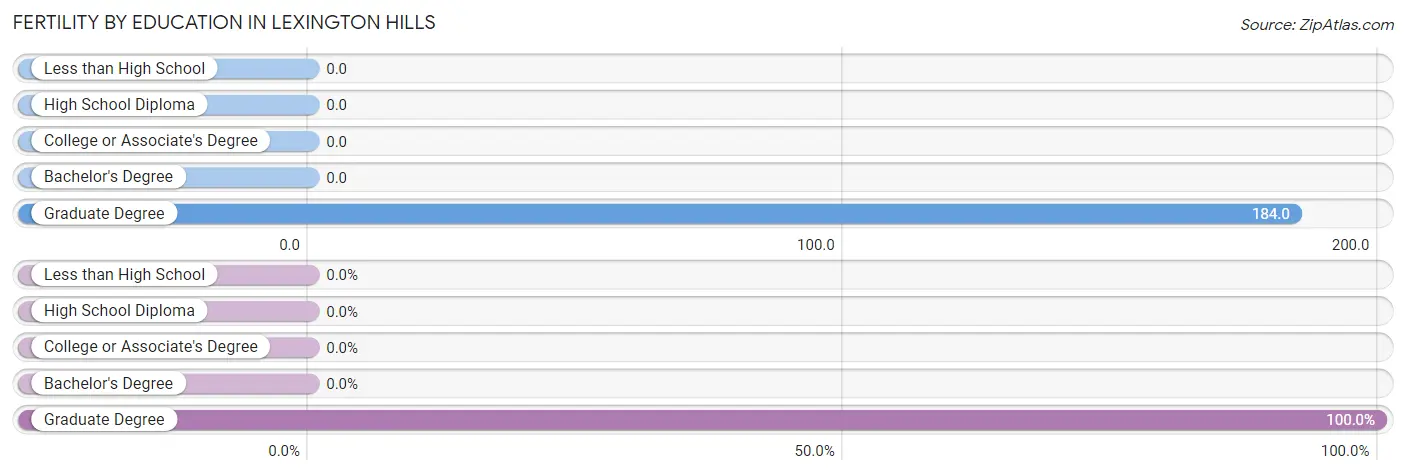
| Educational Attainment | Women with Births | Births / 1,000 Women |
| Less than High School | 0 (0.0%) | 0.0 |
| High School Diploma | 0 (0.0%) | 0.0 |
| College or Associate's Degree | 0 (0.0%) | 0.0 |
| Bachelor's Degree | 0 (0.0%) | 0.0 |
| Graduate Degree | 16 (100.0%) | 184.0 |
| Total | 16 (100.0%) | 35.0 |
Fertility by Education by Marriage Status in Lexington Hills
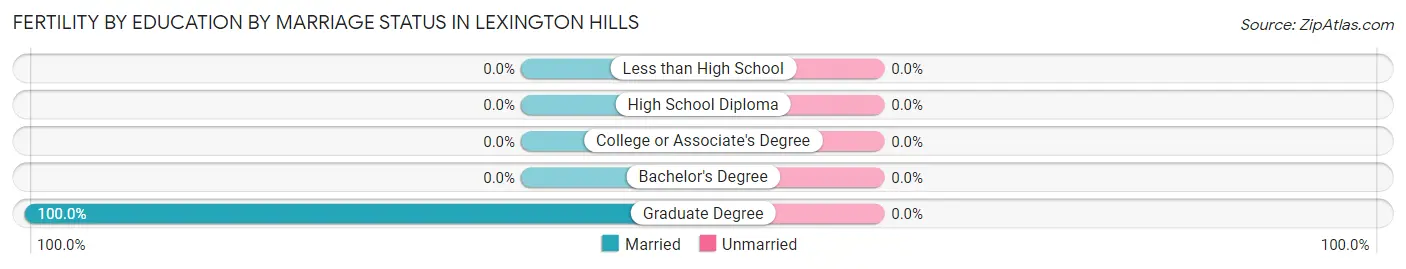
| Educational Attainment | Married | Unmarried |
| Less than High School | 0 (0.0%) | 0 (0.0%) |
| High School Diploma | 0 (0.0%) | 0 (0.0%) |
| College or Associate's Degree | 0 (0.0%) | 0 (0.0%) |
| Bachelor's Degree | 0 (0.0%) | 0 (0.0%) |
| Graduate Degree | 16 (100.0%) | 0 (0.0%) |
| Total | 16 (100.0%) | 0 (0.0%) |
Employment Characteristics in Lexington Hills
Employment by Class of Employer in Lexington Hills
Among the 1,498 employed individuals in Lexington Hills, private company employees (1,038 | 69.3%), local government employees (178 | 11.9%), and self-employed (not incorporated) (93 | 6.2%) make up the most common classes of employment.
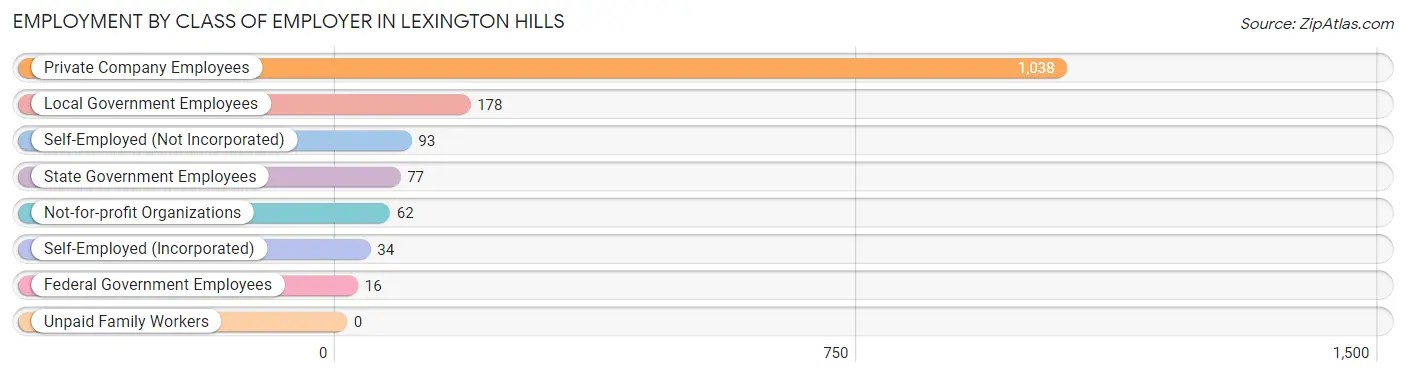
| Employer Class | # Employees | % Employees |
| Private Company Employees | 1,038 | 69.3% |
| Self-Employed (Incorporated) | 34 | 2.3% |
| Self-Employed (Not Incorporated) | 93 | 6.2% |
| Not-for-profit Organizations | 62 | 4.1% |
| Local Government Employees | 178 | 11.9% |
| State Government Employees | 77 | 5.1% |
| Federal Government Employees | 16 | 1.1% |
| Unpaid Family Workers | 0 | 0.0% |
| Total | 1,498 | 100.0% |
Employment Status by Age in Lexington Hills
According to the labor force statistics for Lexington Hills, out of the total population over 16 years of age (2,064), 74.1% or 1,529 individuals are in the labor force, with 1.0% or 15 of them unemployed. The age group with the highest labor force participation rate is 55 to 59 years, with 98.2% or 266 individuals in the labor force. Within the labor force, the 35 to 44 years age range has the highest percentage of unemployed individuals, with 4.0% or 15 of them being unemployed.
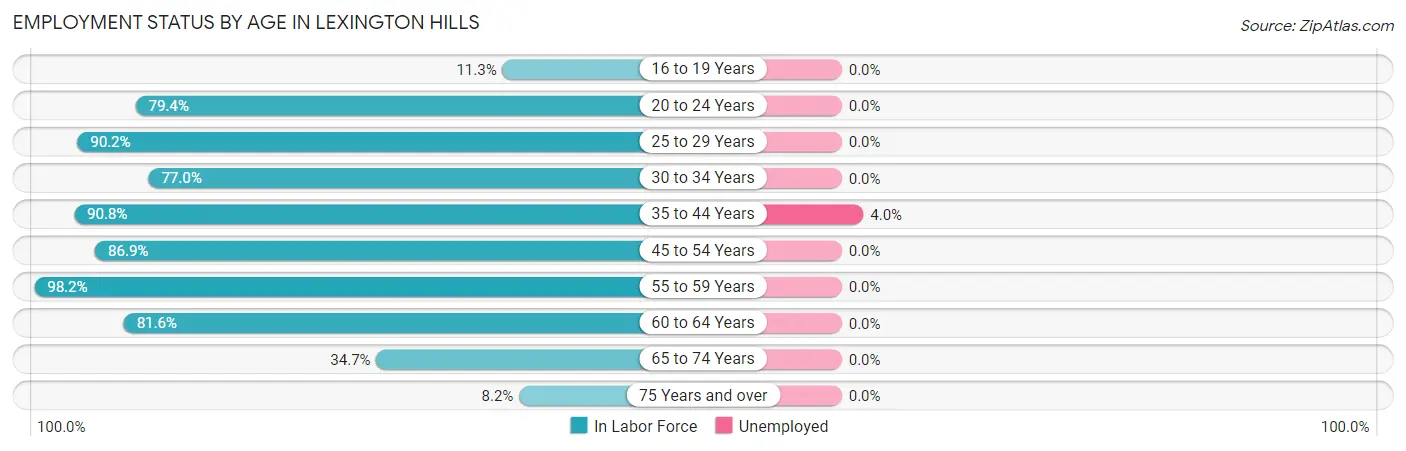
| Age Bracket | In Labor Force | Unemployed |
| 16 to 19 Years | 17 (11.3%) | 0 (0.0%) |
| 20 to 24 Years | 50 (79.4%) | 0 (0.0%) |
| 25 to 29 Years | 110 (90.2%) | 0 (0.0%) |
| 30 to 34 Years | 77 (77.0%) | 0 (0.0%) |
| 35 to 44 Years | 375 (90.8%) | 15 (4.0%) |
| 45 to 54 Years | 426 (86.9%) | 0 (0.0%) |
| 55 to 59 Years | 266 (98.2%) | 0 (0.0%) |
| 60 to 64 Years | 155 (81.6%) | 0 (0.0%) |
| 65 to 74 Years | 41 (34.7%) | 0 (0.0%) |
| 75 Years and over | 12 (8.2%) | 0 (0.0%) |
| Total | 1,529 (74.1%) | 15 (1.0%) |
Employment Status by Educational Attainment in Lexington Hills
According to labor force statistics for Lexington Hills, 88.8% of individuals (1,408) out of the total population between 25 and 64 years of age (1,586) are in the labor force, with 1.1% or 15 of them being unemployed. The group with the highest labor force participation rate are those with the educational attainment of less than high school, with 100.0% or 14 individuals in the labor force. Within the labor force, individuals with bachelor's degree or higher education have the highest percentage of unemployment, with 1.5% or 15 of them being unemployed.
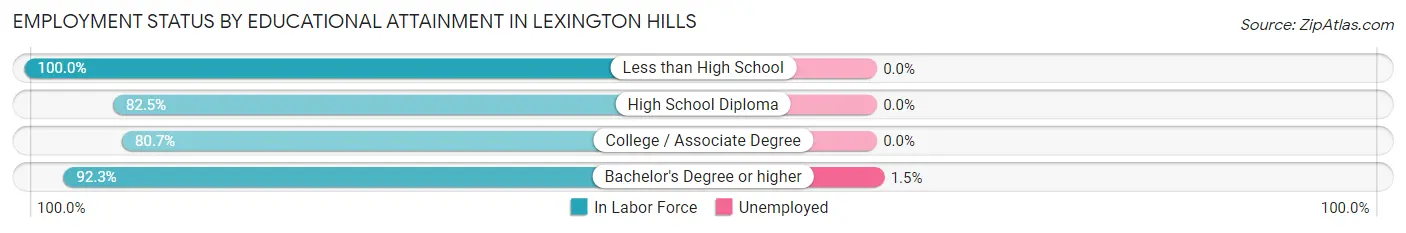
| Educational Attainment | In Labor Force | Unemployed |
| Less than High School | 14 (100.0%) | 0 (0.0%) |
| High School Diploma | 179 (82.5%) | 0 (0.0%) |
| College / Associate Degree | 243 (80.7%) | 0 (0.0%) |
| Bachelor's Degree or higher | 973 (92.3%) | 16 (1.5%) |
| Total | 1,408 (88.8%) | 17 (1.1%) |
Employment Occupations by Sex in Lexington Hills
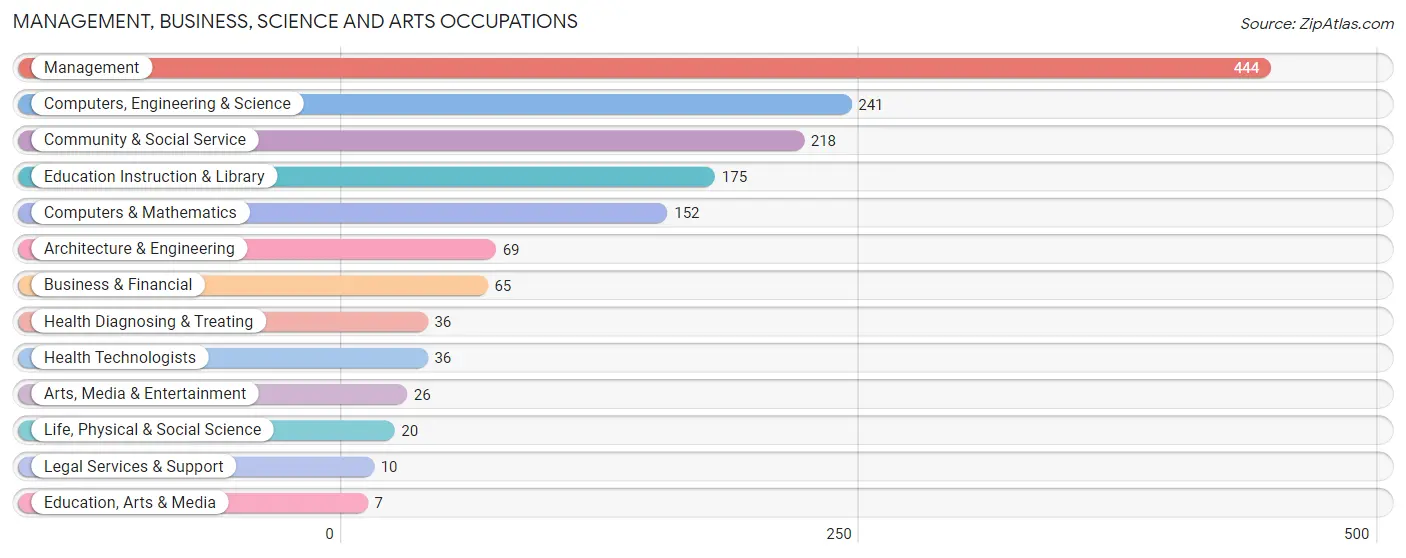
Management, Business, Science and Arts Occupations
The most common Management, Business, Science and Arts occupations in Lexington Hills are Management (444 | 29.3%), Computers, Engineering & Science (241 | 15.9%), Community & Social Service (218 | 14.4%), Education Instruction & Library (175 | 11.6%), and Computers & Mathematics (152 | 10.0%).
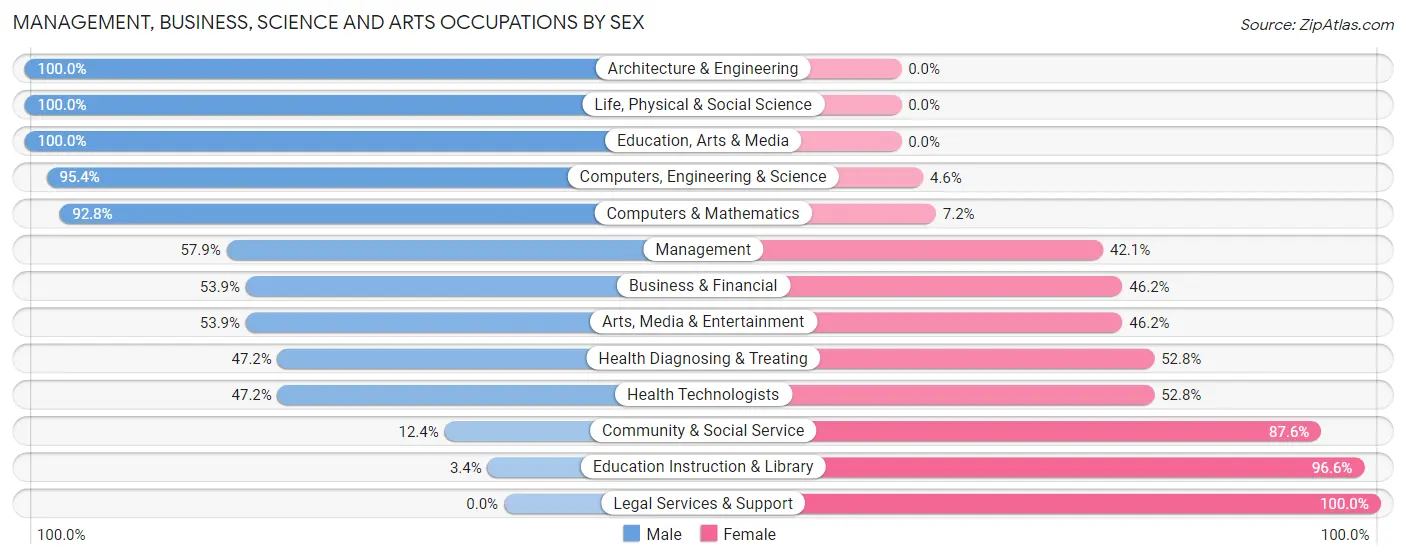
Management, Business, Science and Arts Occupations by Sex
Within the Management, Business, Science and Arts occupations in Lexington Hills, the most male-oriented occupations are Architecture & Engineering (100.0%), Life, Physical & Social Science (100.0%), and Education, Arts & Media (100.0%), while the most female-oriented occupations are Legal Services & Support (100.0%), Education Instruction & Library (96.6%), and Community & Social Service (87.6%).
| Occupation | Male | Female |
| Management | 257 (57.9%) | 187 (42.1%) |
| Business & Financial | 35 (53.8%) | 30 (46.2%) |
| Computers, Engineering & Science | 230 (95.4%) | 11 (4.6%) |
| Computers & Mathematics | 141 (92.8%) | 11 (7.2%) |
| Architecture & Engineering | 69 (100.0%) | 0 (0.0%) |
| Life, Physical & Social Science | 20 (100.0%) | 0 (0.0%) |
| Community & Social Service | 27 (12.4%) | 191 (87.6%) |
| Education, Arts & Media | 7 (100.0%) | 0 (0.0%) |
| Legal Services & Support | 0 (0.0%) | 10 (100.0%) |
| Education Instruction & Library | 6 (3.4%) | 169 (96.6%) |
| Arts, Media & Entertainment | 14 (53.8%) | 12 (46.2%) |
| Health Diagnosing & Treating | 17 (47.2%) | 19 (52.8%) |
| Health Technologists | 17 (47.2%) | 19 (52.8%) |
| Total (Category) | 566 (56.4%) | 438 (43.6%) |
| Total (Overall) | 837 (55.3%) | 677 (44.7%) |
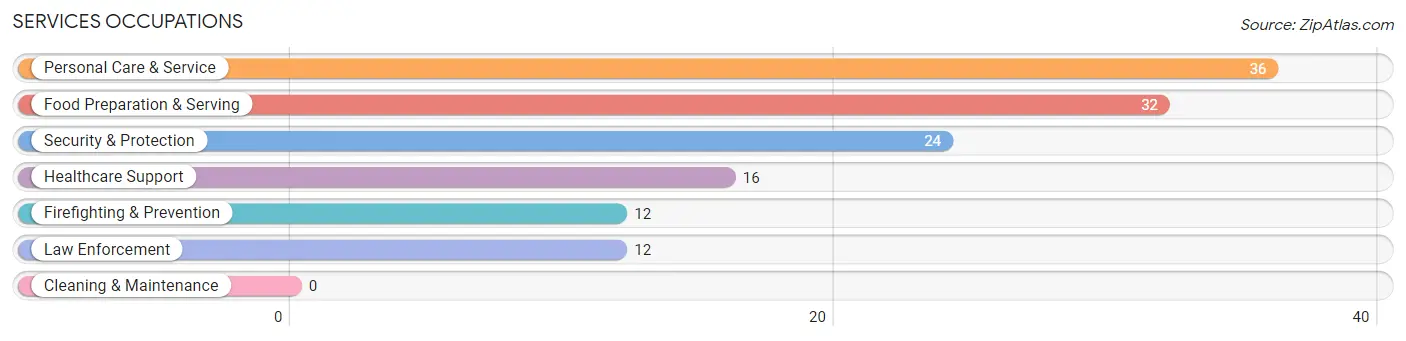
Services Occupations
The most common Services occupations in Lexington Hills are Personal Care & Service (36 | 2.4%), Food Preparation & Serving (32 | 2.1%), Security & Protection (24 | 1.6%), Healthcare Support (16 | 1.1%), and Firefighting & Prevention (12 | 0.8%).
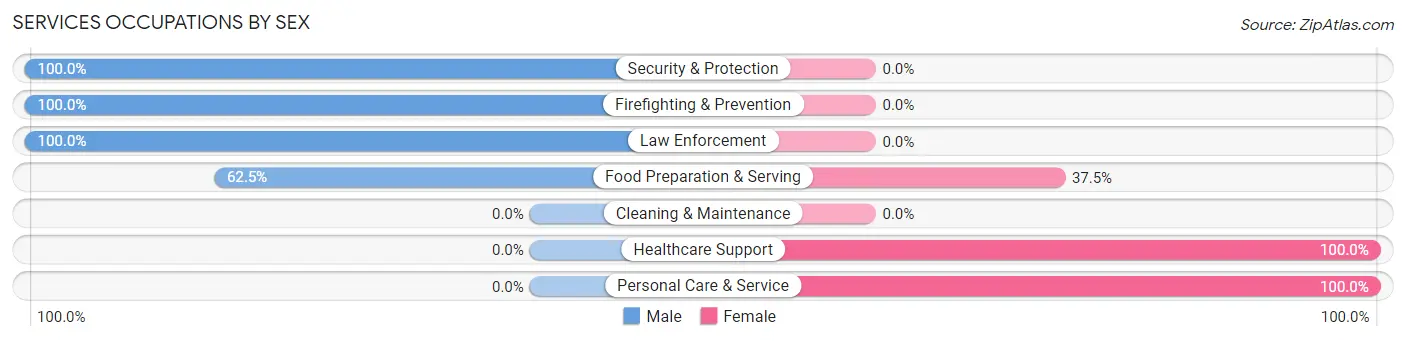
Services Occupations by Sex
Within the Services occupations in Lexington Hills, the most male-oriented occupations are Security & Protection (100.0%), Firefighting & Prevention (100.0%), and Law Enforcement (100.0%), while the most female-oriented occupations are Healthcare Support (100.0%), Personal Care & Service (100.0%), and Food Preparation & Serving (37.5%).
| Occupation | Male | Female |
| Healthcare Support | 0 (0.0%) | 16 (100.0%) |
| Security & Protection | 24 (100.0%) | 0 (0.0%) |
| Firefighting & Prevention | 12 (100.0%) | 0 (0.0%) |
| Law Enforcement | 12 (100.0%) | 0 (0.0%) |
| Food Preparation & Serving | 20 (62.5%) | 12 (37.5%) |
| Cleaning & Maintenance | 0 (0.0%) | 0 (0.0%) |
| Personal Care & Service | 0 (0.0%) | 36 (100.0%) |
| Total (Category) | 44 (40.7%) | 64 (59.3%) |
| Total (Overall) | 837 (55.3%) | 677 (44.7%) |
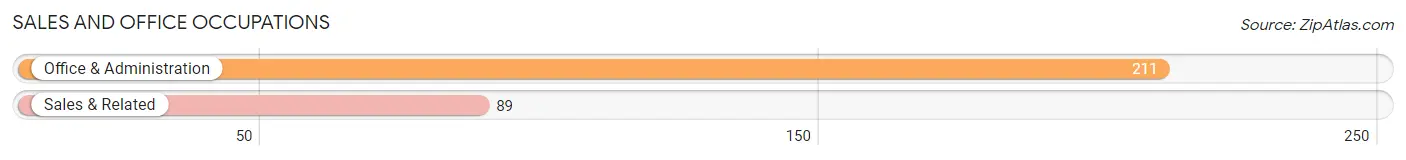
Sales and Office Occupations
The most common Sales and Office occupations in Lexington Hills are Office & Administration (211 | 13.9%), and Sales & Related (89 | 5.9%).
Sales and Office Occupations by Sex
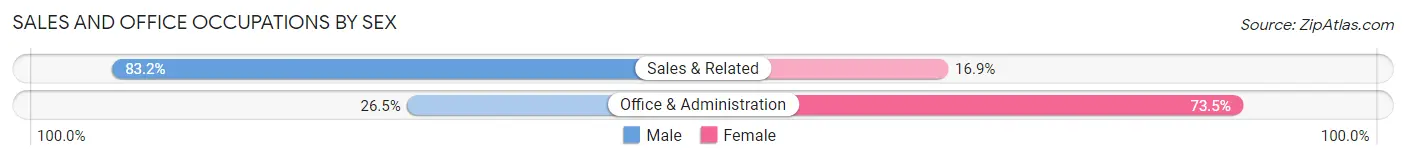
| Occupation | Male | Female |
| Sales & Related | 74 (83.2%) | 15 (16.9%) |
| Office & Administration | 56 (26.5%) | 155 (73.5%) |
| Total (Category) | 130 (43.3%) | 170 (56.7%) |
| Total (Overall) | 837 (55.3%) | 677 (44.7%) |
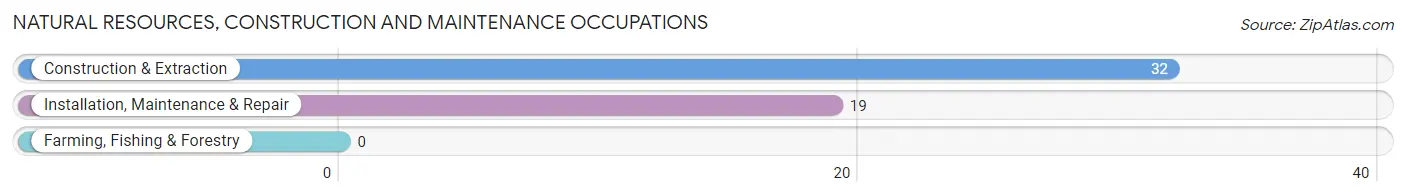
Natural Resources, Construction and Maintenance Occupations
The most common Natural Resources, Construction and Maintenance occupations in Lexington Hills are Construction & Extraction (32 | 2.1%), and Installation, Maintenance & Repair (19 | 1.3%).
Natural Resources, Construction and Maintenance Occupations by Sex
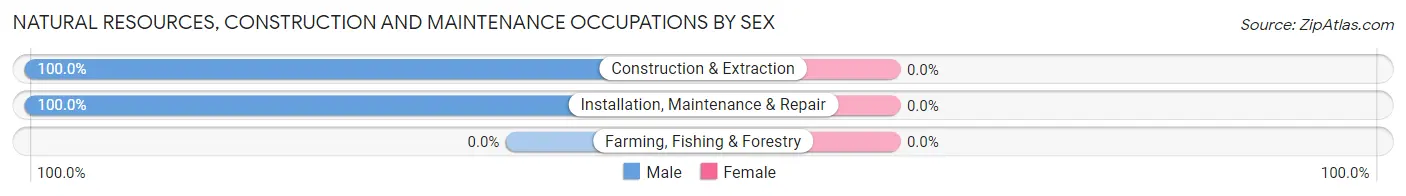
| Occupation | Male | Female |
| Farming, Fishing & Forestry | 0 (0.0%) | 0 (0.0%) |
| Construction & Extraction | 32 (100.0%) | 0 (0.0%) |
| Installation, Maintenance & Repair | 19 (100.0%) | 0 (0.0%) |
| Total (Category) | 51 (100.0%) | 0 (0.0%) |
| Total (Overall) | 837 (55.3%) | 677 (44.7%) |
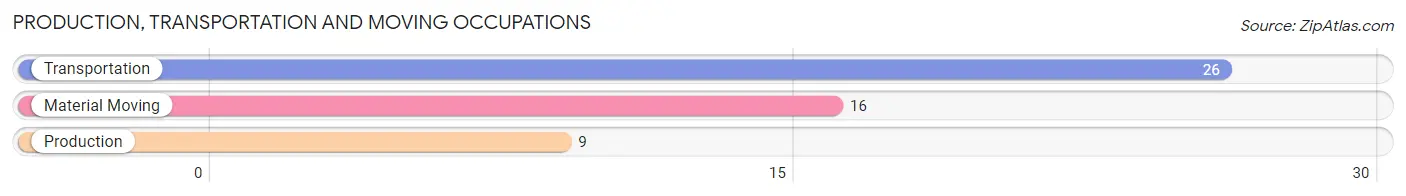
Production, Transportation and Moving Occupations
The most common Production, Transportation and Moving occupations in Lexington Hills are Transportation (26 | 1.7%), Material Moving (16 | 1.1%), and Production (9 | 0.6%).
Production, Transportation and Moving Occupations by Sex
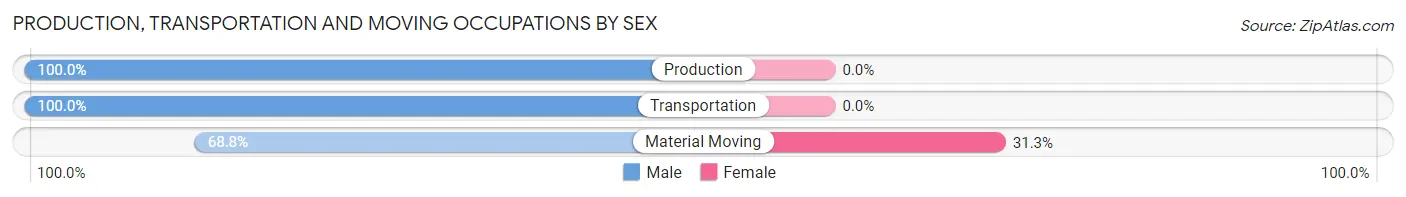
| Occupation | Male | Female |
| Production | 9 (100.0%) | 0 (0.0%) |
| Transportation | 26 (100.0%) | 0 (0.0%) |
| Material Moving | 11 (68.8%) | 5 (31.2%) |
| Total (Category) | 46 (90.2%) | 5 (9.8%) |
| Total (Overall) | 837 (55.3%) | 677 (44.7%) |
Employment Industries by Sex in Lexington Hills
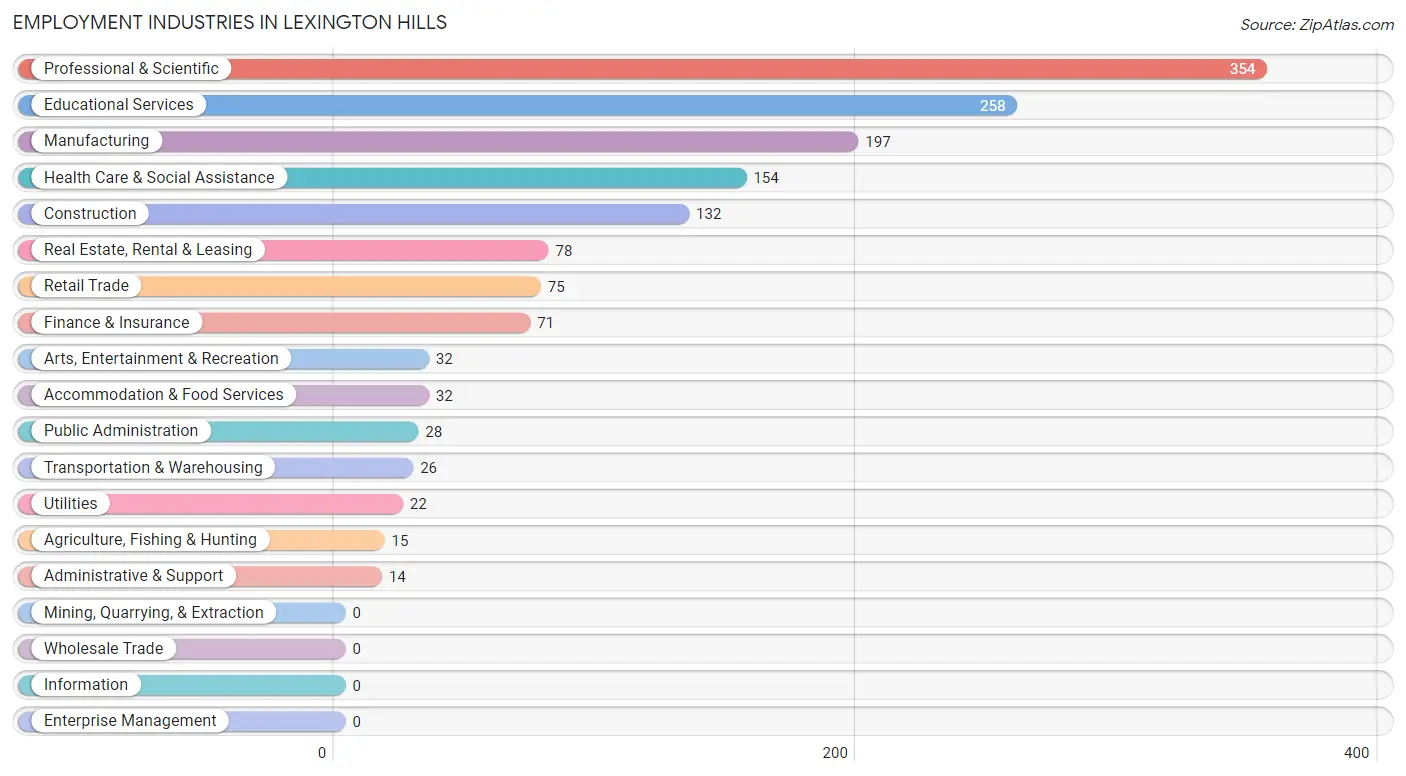
Employment Industries in Lexington Hills
The major employment industries in Lexington Hills include Professional & Scientific (354 | 23.4%), Educational Services (258 | 17.0%), Manufacturing (197 | 13.0%), Health Care & Social Assistance (154 | 10.2%), and Construction (132 | 8.7%).
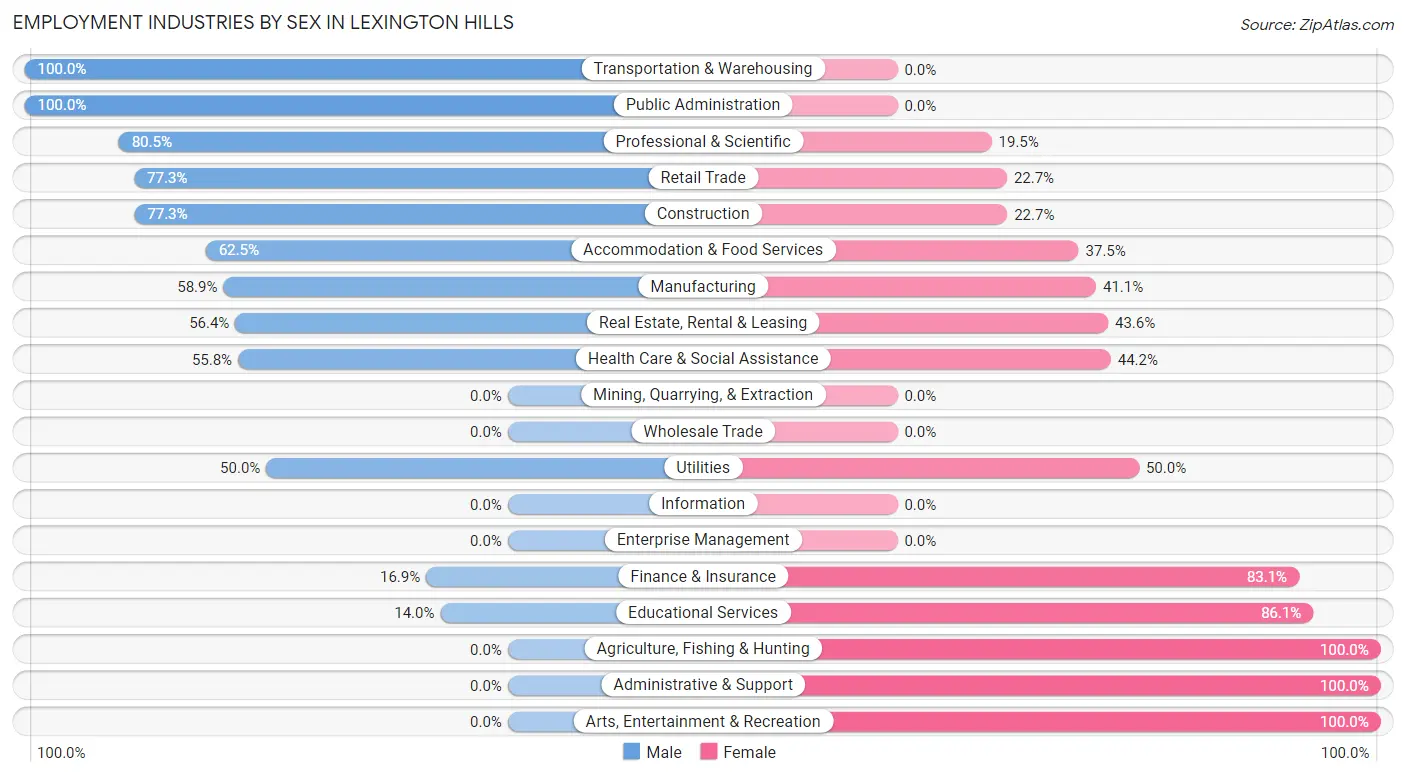
Employment Industries by Sex in Lexington Hills
The Lexington Hills industries that see more men than women are Transportation & Warehousing (100.0%), Public Administration (100.0%), and Professional & Scientific (80.5%), whereas the industries that tend to have a higher number of women are Agriculture, Fishing & Hunting (100.0%), Administrative & Support (100.0%), and Arts, Entertainment & Recreation (100.0%).
| Industry | Male | Female |
| Agriculture, Fishing & Hunting | 0 (0.0%) | 15 (100.0%) |
| Mining, Quarrying, & Extraction | 0 (0.0%) | 0 (0.0%) |
| Construction | 102 (77.3%) | 30 (22.7%) |
| Manufacturing | 116 (58.9%) | 81 (41.1%) |
| Wholesale Trade | 0 (0.0%) | 0 (0.0%) |
| Retail Trade | 58 (77.3%) | 17 (22.7%) |
| Transportation & Warehousing | 26 (100.0%) | 0 (0.0%) |
| Utilities | 11 (50.0%) | 11 (50.0%) |
| Information | 0 (0.0%) | 0 (0.0%) |
| Finance & Insurance | 12 (16.9%) | 59 (83.1%) |
| Real Estate, Rental & Leasing | 44 (56.4%) | 34 (43.6%) |
| Professional & Scientific | 285 (80.5%) | 69 (19.5%) |
| Enterprise Management | 0 (0.0%) | 0 (0.0%) |
| Administrative & Support | 0 (0.0%) | 14 (100.0%) |
| Educational Services | 36 (14.0%) | 222 (86.1%) |
| Health Care & Social Assistance | 86 (55.8%) | 68 (44.2%) |
| Arts, Entertainment & Recreation | 0 (0.0%) | 32 (100.0%) |
| Accommodation & Food Services | 20 (62.5%) | 12 (37.5%) |
| Public Administration | 28 (100.0%) | 0 (0.0%) |
| Total | 837 (55.3%) | 677 (44.7%) |
Education in Lexington Hills
School Enrollment in Lexington Hills
The most common levels of schooling among the 692 students in Lexington Hills are elementary school (189 | 27.3%), college / undergraduate (159 | 23.0%), and high school (150 | 21.7%).
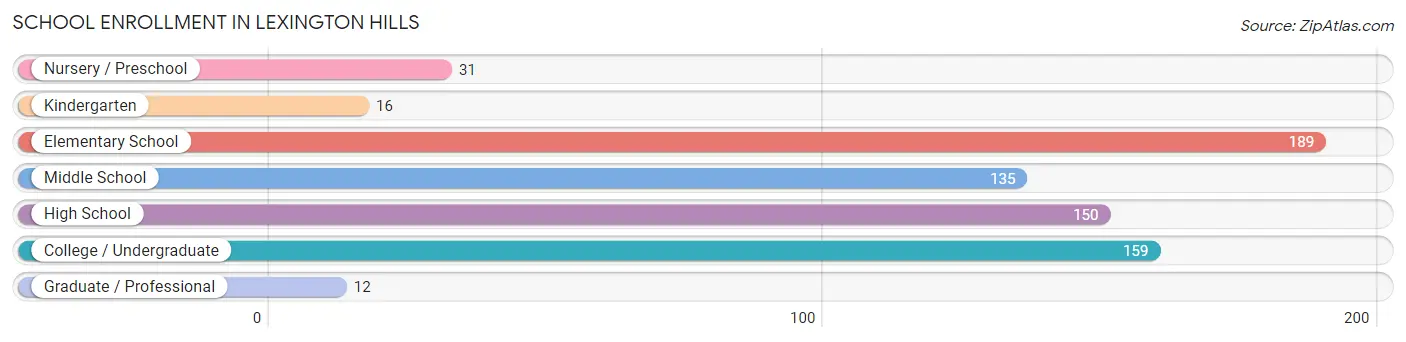
| School Level | # Students | % Students |
| Nursery / Preschool | 31 | 4.5% |
| Kindergarten | 16 | 2.3% |
| Elementary School | 189 | 27.3% |
| Middle School | 135 | 19.5% |
| High School | 150 | 21.7% |
| College / Undergraduate | 159 | 23.0% |
| Graduate / Professional | 12 | 1.7% |
| Total | 692 | 100.0% |
School Enrollment by Age by Funding Source in Lexington Hills
Out of a total of 692 students who are enrolled in schools in Lexington Hills, 114 (16.5%) attend a private institution, while the remaining 578 (83.5%) are enrolled in public schools. The age group of 3 to 4 year olds has the highest likelihood of being enrolled in private schools, with 31 (100.0% in the age bracket) enrolled. Conversely, the age group of 15 to 17 year olds has the lowest likelihood of being enrolled in a private school, with 101 (100.0% in the age bracket) attending a public institution.
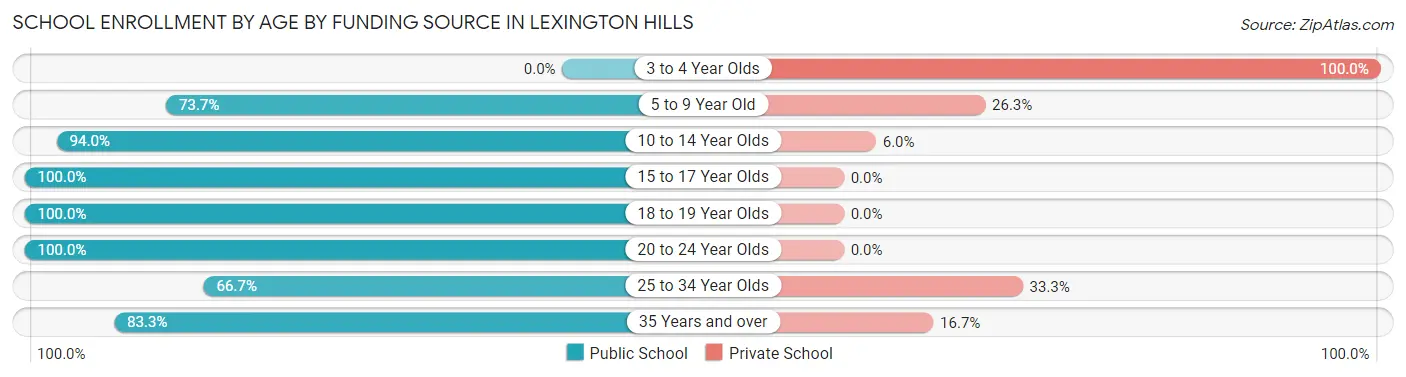
| Age Bracket | Public School | Private School |
| 3 to 4 Year Olds | 0 (0.0%) | 31 (100.0%) |
| 5 to 9 Year Old | 151 (73.7%) | 54 (26.3%) |
| 10 to 14 Year Olds | 173 (94.0%) | 11 (6.0%) |
| 15 to 17 Year Olds | 101 (100.0%) | 0 (0.0%) |
| 18 to 19 Year Olds | 79 (100.0%) | 0 (0.0%) |
| 20 to 24 Year Olds | 20 (100.0%) | 0 (0.0%) |
| 25 to 34 Year Olds | 24 (66.7%) | 12 (33.3%) |
| 35 Years and over | 30 (83.3%) | 6 (16.7%) |
| Total | 578 (83.5%) | 114 (16.5%) |
Educational Attainment by Field of Study in Lexington Hills
Engineering (237 | 17.5%), business (236 | 17.5%), computers & mathematics (147 | 10.9%), liberal arts & history (112 | 8.3%), and psychology (96 | 7.1%) are the most common fields of study among 1,352 individuals in Lexington Hills who have obtained a bachelor's degree or higher.
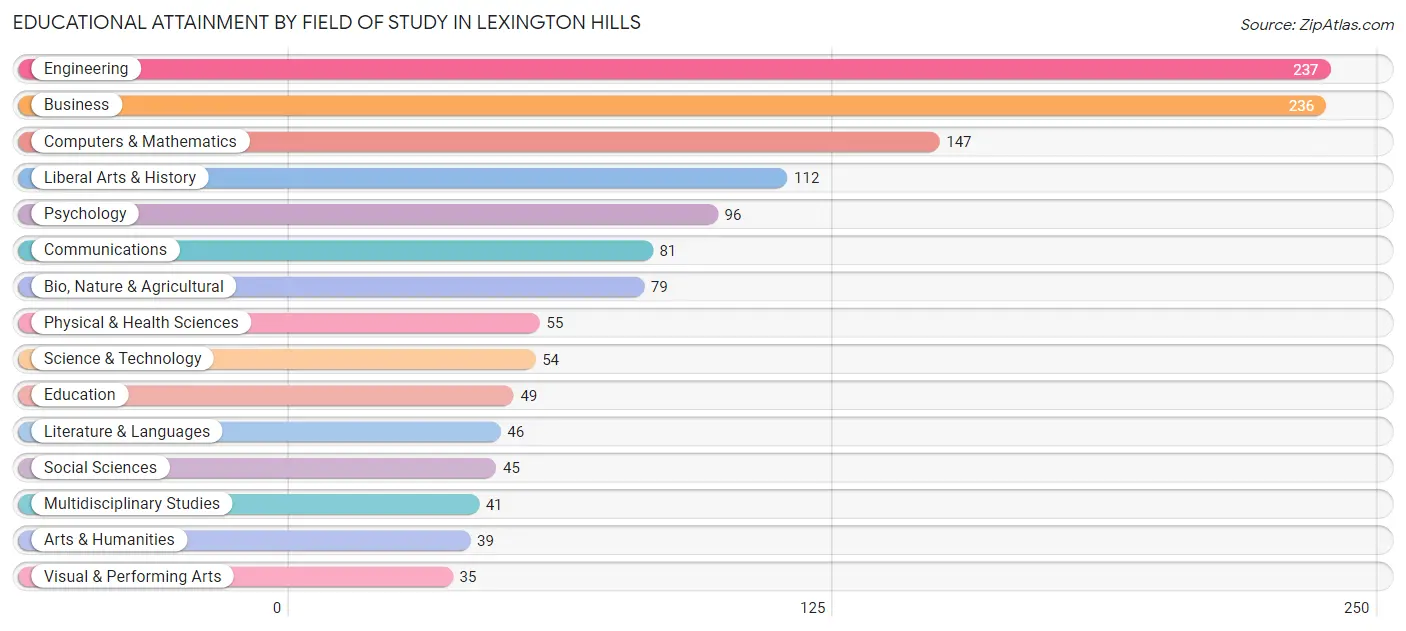
| Field of Study | # Graduates | % Graduates |
| Computers & Mathematics | 147 | 10.9% |
| Bio, Nature & Agricultural | 79 | 5.8% |
| Physical & Health Sciences | 55 | 4.1% |
| Psychology | 96 | 7.1% |
| Social Sciences | 45 | 3.3% |
| Engineering | 237 | 17.5% |
| Multidisciplinary Studies | 41 | 3.0% |
| Science & Technology | 54 | 4.0% |
| Business | 236 | 17.5% |
| Education | 49 | 3.6% |
| Literature & Languages | 46 | 3.4% |
| Liberal Arts & History | 112 | 8.3% |
| Visual & Performing Arts | 35 | 2.6% |
| Communications | 81 | 6.0% |
| Arts & Humanities | 39 | 2.9% |
| Total | 1,352 | 100.0% |
Transportation & Commute in Lexington Hills
Vehicle Availability by Sex in Lexington Hills
The most prevalent vehicle ownership categories in Lexington Hills are males with 3 vehicles (350, accounting for 41.8%) and females with 3 vehicles (310, making up 53.6%).
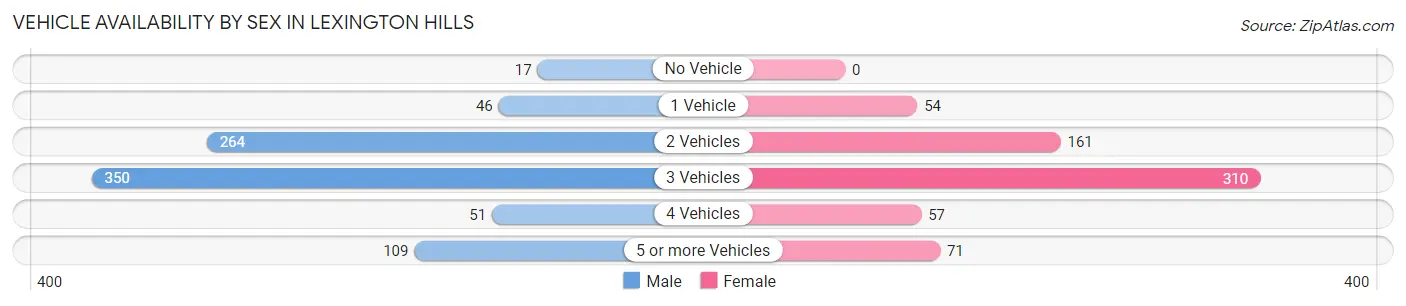
| Vehicles Available | Male | Female |
| No Vehicle | 17 (2.0%) | 0 (0.0%) |
| 1 Vehicle | 46 (5.5%) | 54 (8.3%) |
| 2 Vehicles | 264 (31.5%) | 161 (24.7%) |
| 3 Vehicles | 350 (41.8%) | 310 (47.5%) |
| 4 Vehicles | 51 (6.1%) | 57 (8.7%) |
| 5 or more Vehicles | 109 (13.0%) | 71 (10.9%) |
| Total | 837 (100.0%) | 653 (100.0%) |
Commute Time in Lexington Hills
The most frequently occuring commute durations in Lexington Hills are 30 to 34 minutes (205 commuters, 16.2%), 45 to 59 minutes (201 commuters, 15.9%), and 15 to 19 minutes (154 commuters, 12.2%).
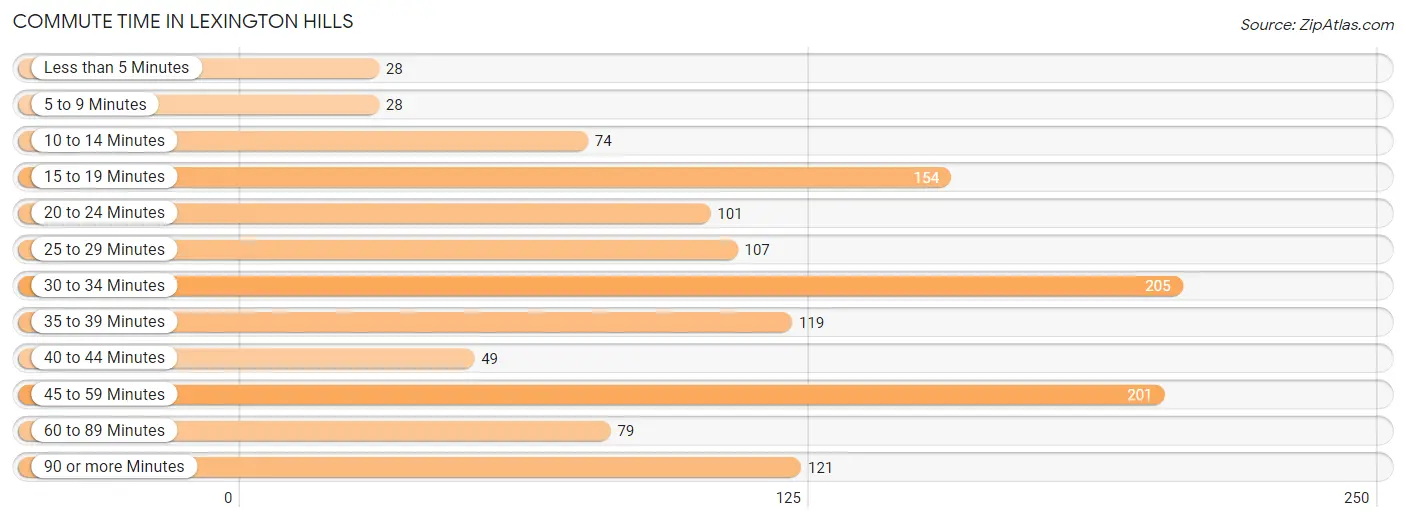
| Commute Time | # Commuters | % Commuters |
| Less than 5 Minutes | 28 | 2.2% |
| 5 to 9 Minutes | 28 | 2.2% |
| 10 to 14 Minutes | 74 | 5.9% |
| 15 to 19 Minutes | 154 | 12.2% |
| 20 to 24 Minutes | 101 | 8.0% |
| 25 to 29 Minutes | 107 | 8.5% |
| 30 to 34 Minutes | 205 | 16.2% |
| 35 to 39 Minutes | 119 | 9.4% |
| 40 to 44 Minutes | 49 | 3.9% |
| 45 to 59 Minutes | 201 | 15.9% |
| 60 to 89 Minutes | 79 | 6.2% |
| 90 or more Minutes | 121 | 9.6% |
Commute Time by Sex in Lexington Hills
The most common commute times in Lexington Hills are 30 to 34 minutes (146 commuters, 20.7%) for males and 45 to 59 minutes (180 commuters, 32.1%) for females.
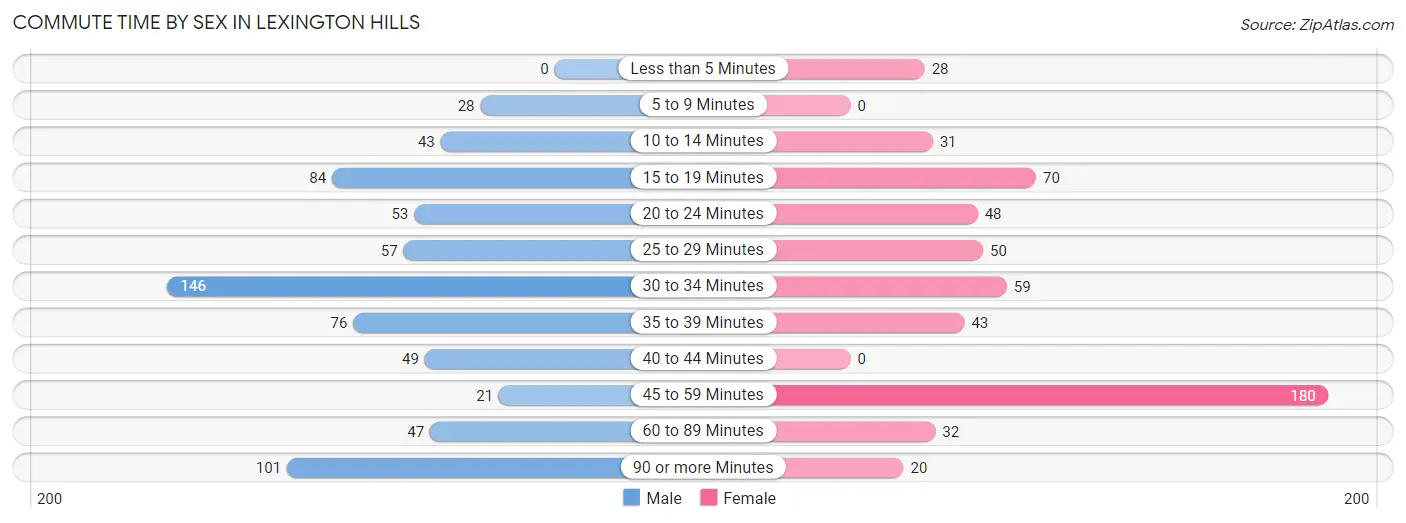
| Commute Time | Male | Female |
| Less than 5 Minutes | 0 (0.0%) | 28 (5.0%) |
| 5 to 9 Minutes | 28 (4.0%) | 0 (0.0%) |
| 10 to 14 Minutes | 43 (6.1%) | 31 (5.5%) |
| 15 to 19 Minutes | 84 (11.9%) | 70 (12.5%) |
| 20 to 24 Minutes | 53 (7.5%) | 48 (8.6%) |
| 25 to 29 Minutes | 57 (8.1%) | 50 (8.9%) |
| 30 to 34 Minutes | 146 (20.7%) | 59 (10.5%) |
| 35 to 39 Minutes | 76 (10.8%) | 43 (7.7%) |
| 40 to 44 Minutes | 49 (7.0%) | 0 (0.0%) |
| 45 to 59 Minutes | 21 (3.0%) | 180 (32.1%) |
| 60 to 89 Minutes | 47 (6.7%) | 32 (5.7%) |
| 90 or more Minutes | 101 (14.3%) | 20 (3.6%) |
Time of Departure to Work by Sex in Lexington Hills
The most frequent times of departure to work in Lexington Hills are 6:30 AM to 6:59 AM (128, 18.2%) for males and 7:30 AM to 7:59 AM (135, 24.1%) for females.
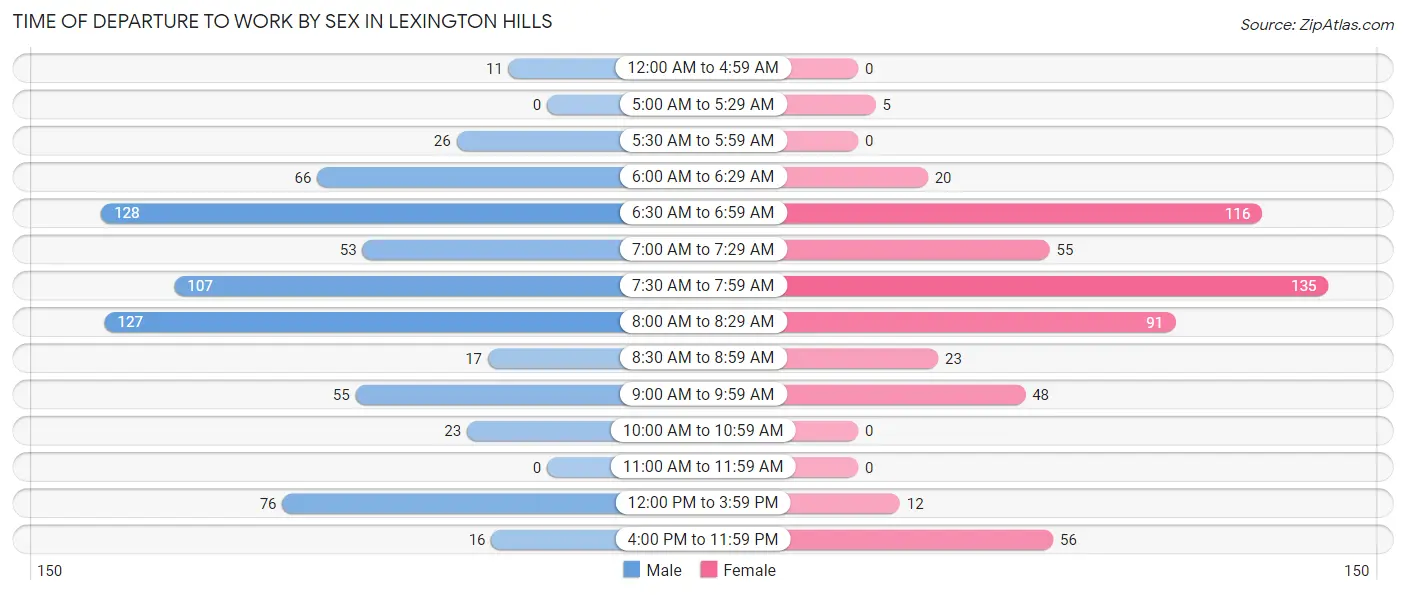
| Time of Departure | Male | Female |
| 12:00 AM to 4:59 AM | 11 (1.6%) | 0 (0.0%) |
| 5:00 AM to 5:29 AM | 0 (0.0%) | 5 (0.9%) |
| 5:30 AM to 5:59 AM | 26 (3.7%) | 0 (0.0%) |
| 6:00 AM to 6:29 AM | 66 (9.4%) | 20 (3.6%) |
| 6:30 AM to 6:59 AM | 128 (18.2%) | 116 (20.7%) |
| 7:00 AM to 7:29 AM | 53 (7.5%) | 55 (9.8%) |
| 7:30 AM to 7:59 AM | 107 (15.2%) | 135 (24.1%) |
| 8:00 AM to 8:29 AM | 127 (18.0%) | 91 (16.2%) |
| 8:30 AM to 8:59 AM | 17 (2.4%) | 23 (4.1%) |
| 9:00 AM to 9:59 AM | 55 (7.8%) | 48 (8.6%) |
| 10:00 AM to 10:59 AM | 23 (3.3%) | 0 (0.0%) |
| 11:00 AM to 11:59 AM | 0 (0.0%) | 0 (0.0%) |
| 12:00 PM to 3:59 PM | 76 (10.8%) | 12 (2.1%) |
| 4:00 PM to 11:59 PM | 16 (2.3%) | 56 (10.0%) |
| Total | 705 (100.0%) | 561 (100.0%) |
Housing Occupancy in Lexington Hills
Occupancy by Ownership in Lexington Hills
Of the total 890 dwellings in Lexington Hills, owner-occupied units account for 753 (84.6%), while renter-occupied units make up 137 (15.4%).
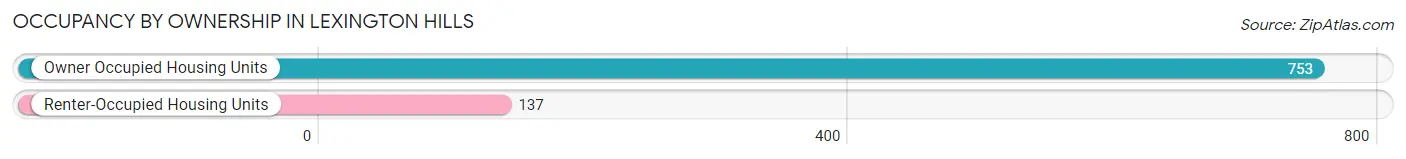
| Occupancy | # Housing Units | % Housing Units |
| Owner Occupied Housing Units | 753 | 84.6% |
| Renter-Occupied Housing Units | 137 | 15.4% |
| Total Occupied Housing Units | 890 | 100.0% |
Occupancy by Household Size in Lexington Hills
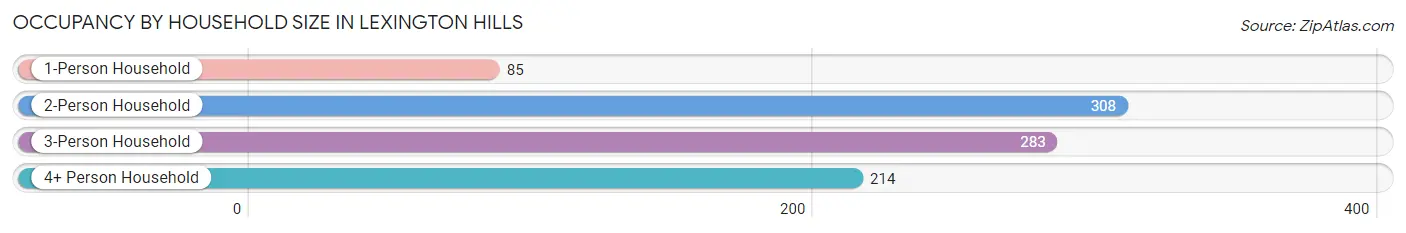
| Household Size | # Housing Units | % Housing Units |
| 1-Person Household | 85 | 9.6% |
| 2-Person Household | 308 | 34.6% |
| 3-Person Household | 283 | 31.8% |
| 4+ Person Household | 214 | 24.0% |
| Total Housing Units | 890 | 100.0% |
Occupancy by Ownership by Household Size in Lexington Hills
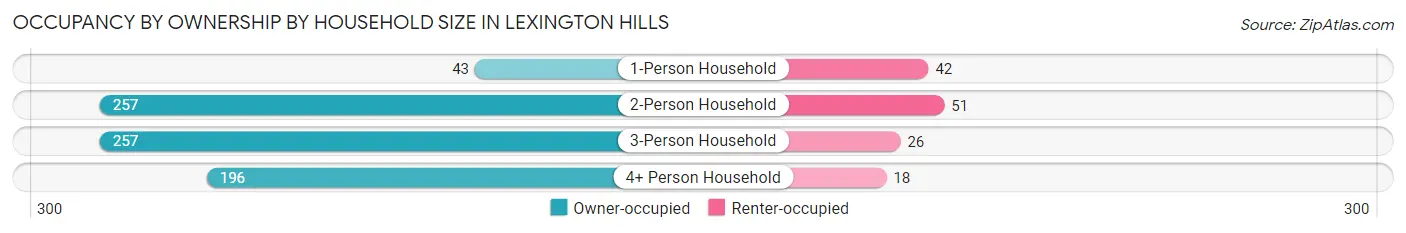
| Household Size | Owner-occupied | Renter-occupied |
| 1-Person Household | 43 (50.6%) | 42 (49.4%) |
| 2-Person Household | 257 (83.4%) | 51 (16.6%) |
| 3-Person Household | 257 (90.8%) | 26 (9.2%) |
| 4+ Person Household | 196 (91.6%) | 18 (8.4%) |
| Total Housing Units | 753 (84.6%) | 137 (15.4%) |
Occupancy by Educational Attainment in Lexington Hills
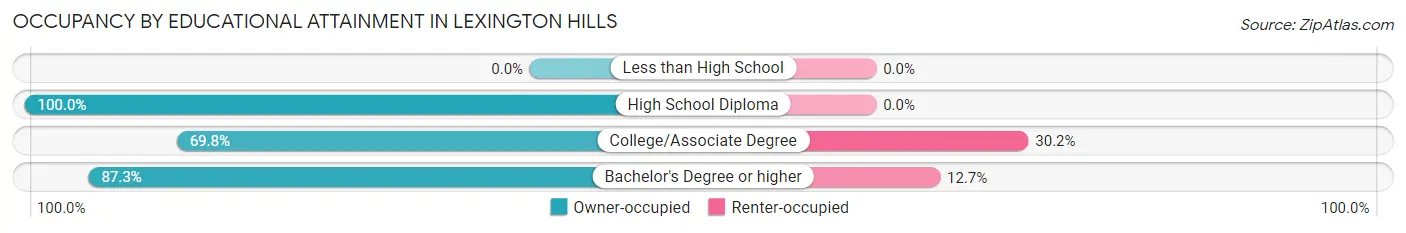
| Household Size | Owner-occupied | Renter-occupied |
| Less than High School | 0 (0.0%) | 0 (0.0%) |
| High School Diploma | 56 (100.0%) | 0 (0.0%) |
| College/Associate Degree | 125 (69.8%) | 54 (30.2%) |
| Bachelor's Degree or higher | 572 (87.3%) | 83 (12.7%) |
Occupancy by Age of Householder in Lexington Hills
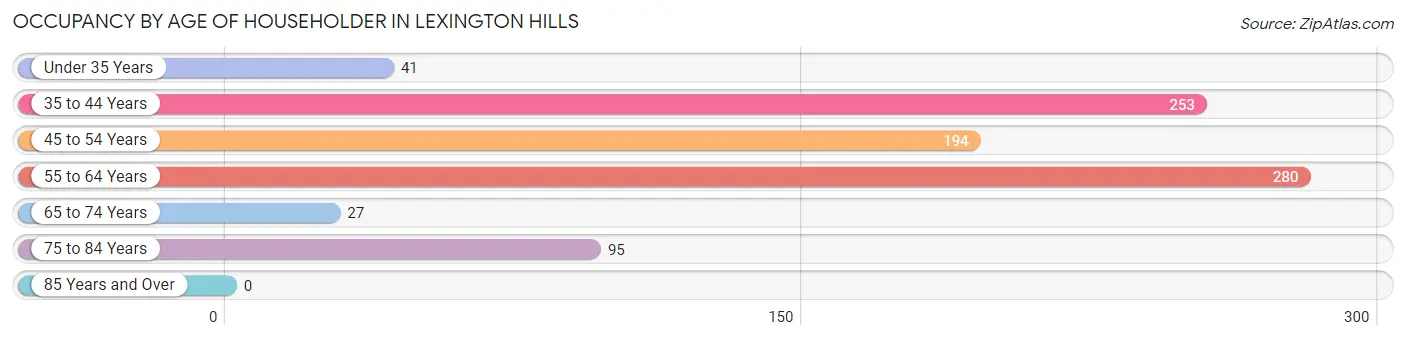
| Age Bracket | # Households | % Households |
| Under 35 Years | 41 | 4.6% |
| 35 to 44 Years | 253 | 28.4% |
| 45 to 54 Years | 194 | 21.8% |
| 55 to 64 Years | 280 | 31.5% |
| 65 to 74 Years | 27 | 3.0% |
| 75 to 84 Years | 95 | 10.7% |
| 85 Years and Over | 0 | 0.0% |
| Total | 890 | 100.0% |
Housing Finances in Lexington Hills
Median Income by Occupancy in Lexington Hills
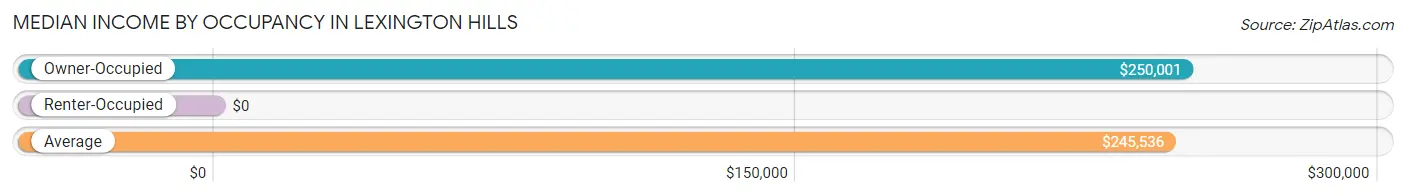
| Occupancy Type | # Households | Median Income |
| Owner-Occupied | 753 (84.6%) | $250,001 |
| Renter-Occupied | 137 (15.4%) | $0 |
| Average | 890 (100.0%) | $245,536 |
Occupancy by Householder Income Bracket in Lexington Hills
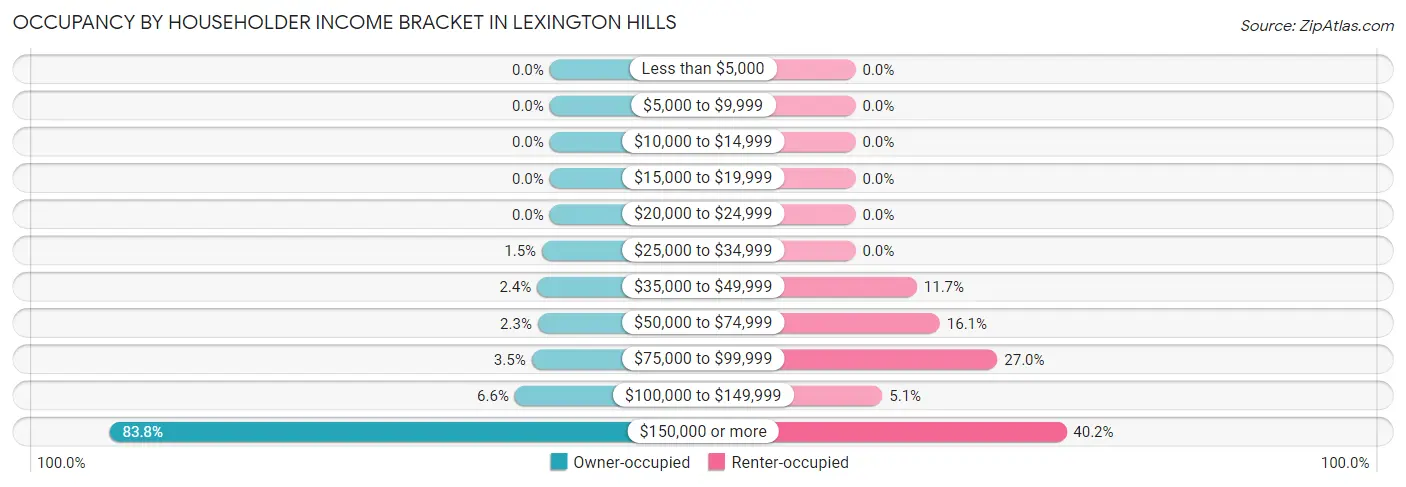
| Income Bracket | Owner-occupied | Renter-occupied |
| Less than $5,000 | 0 (0.0%) | 0 (0.0%) |
| $5,000 to $9,999 | 0 (0.0%) | 0 (0.0%) |
| $10,000 to $14,999 | 0 (0.0%) | 0 (0.0%) |
| $15,000 to $19,999 | 0 (0.0%) | 0 (0.0%) |
| $20,000 to $24,999 | 0 (0.0%) | 0 (0.0%) |
| $25,000 to $34,999 | 11 (1.5%) | 0 (0.0%) |
| $35,000 to $49,999 | 18 (2.4%) | 16 (11.7%) |
| $50,000 to $74,999 | 17 (2.3%) | 22 (16.1%) |
| $75,000 to $99,999 | 26 (3.5%) | 37 (27.0%) |
| $100,000 to $149,999 | 50 (6.6%) | 7 (5.1%) |
| $150,000 or more | 631 (83.8%) | 55 (40.2%) |
| Total | 753 (100.0%) | 137 (100.0%) |
Monthly Housing Cost Tiers in Lexington Hills
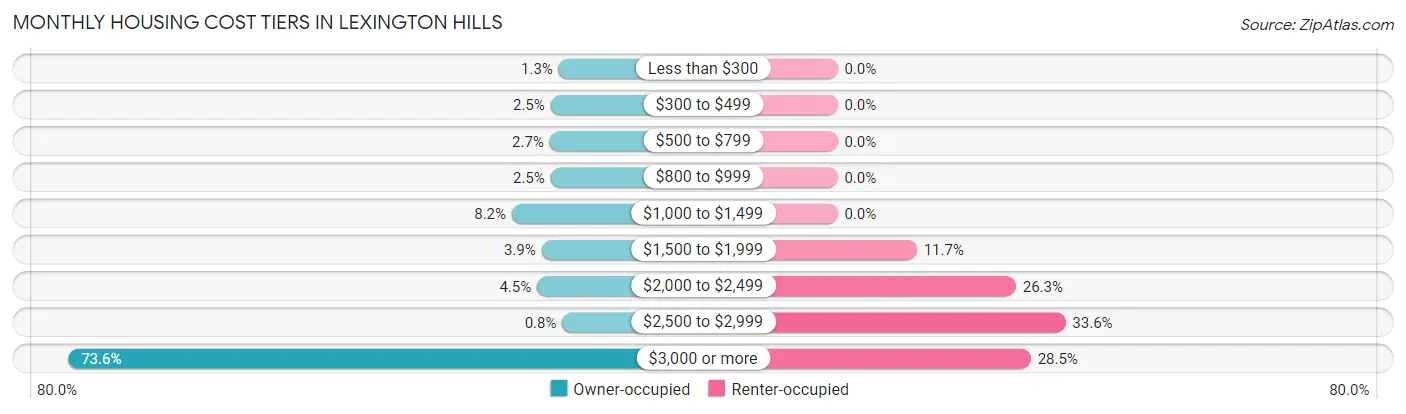
| Monthly Cost | Owner-occupied | Renter-occupied |
| Less than $300 | 10 (1.3%) | 0 (0.0%) |
| $300 to $499 | 19 (2.5%) | 0 (0.0%) |
| $500 to $799 | 20 (2.7%) | 0 (0.0%) |
| $800 to $999 | 19 (2.5%) | 0 (0.0%) |
| $1,000 to $1,499 | 62 (8.2%) | 0 (0.0%) |
| $1,500 to $1,999 | 29 (3.8%) | 16 (11.7%) |
| $2,000 to $2,499 | 34 (4.5%) | 36 (26.3%) |
| $2,500 to $2,999 | 6 (0.8%) | 46 (33.6%) |
| $3,000 or more | 554 (73.6%) | 39 (28.5%) |
| Total | 753 (100.0%) | 137 (100.0%) |
Physical Housing Characteristics in Lexington Hills
Housing Structures in Lexington Hills
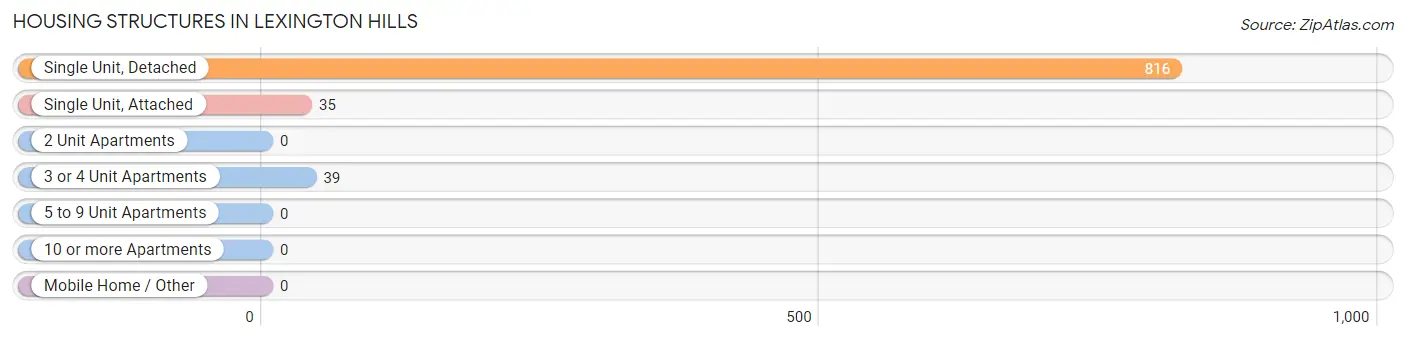
| Structure Type | # Housing Units | % Housing Units |
| Single Unit, Detached | 816 | 91.7% |
| Single Unit, Attached | 35 | 3.9% |
| 2 Unit Apartments | 0 | 0.0% |
| 3 or 4 Unit Apartments | 39 | 4.4% |
| 5 to 9 Unit Apartments | 0 | 0.0% |
| 10 or more Apartments | 0 | 0.0% |
| Mobile Home / Other | 0 | 0.0% |
| Total | 890 | 100.0% |
Housing Structures by Occupancy in Lexington Hills
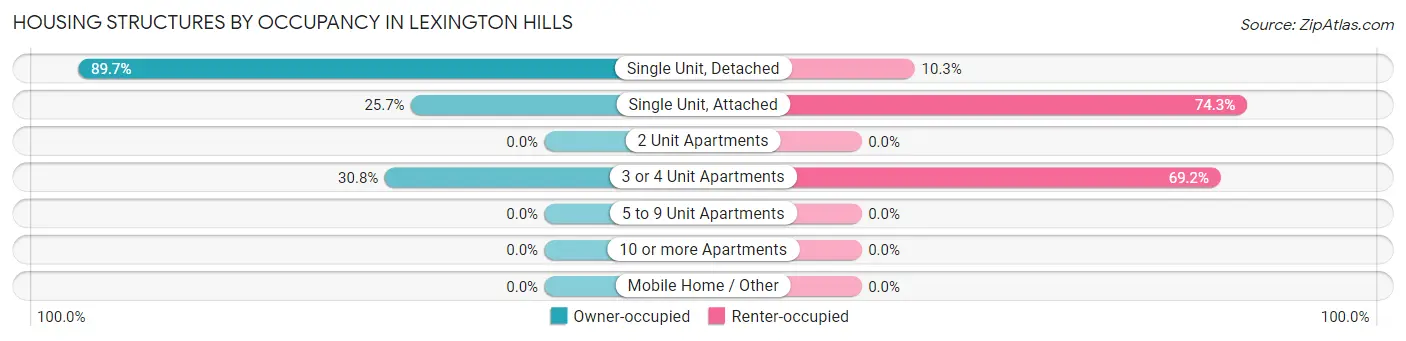
| Structure Type | Owner-occupied | Renter-occupied |
| Single Unit, Detached | 732 (89.7%) | 84 (10.3%) |
| Single Unit, Attached | 9 (25.7%) | 26 (74.3%) |
| 2 Unit Apartments | 0 (0.0%) | 0 (0.0%) |
| 3 or 4 Unit Apartments | 12 (30.8%) | 27 (69.2%) |
| 5 to 9 Unit Apartments | 0 (0.0%) | 0 (0.0%) |
| 10 or more Apartments | 0 (0.0%) | 0 (0.0%) |
| Mobile Home / Other | 0 (0.0%) | 0 (0.0%) |
| Total | 753 (84.6%) | 137 (15.4%) |
Housing Structures by Number of Rooms in Lexington Hills
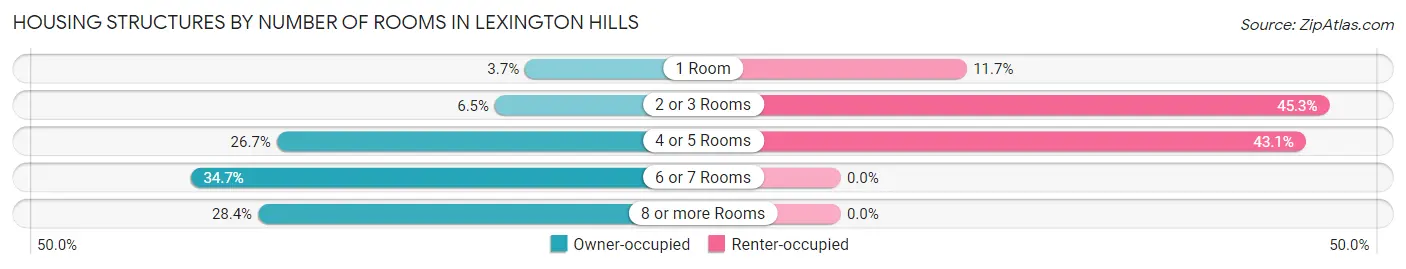
| Number of Rooms | Owner-occupied | Renter-occupied |
| 1 Room | 28 (3.7%) | 16 (11.7%) |
| 2 or 3 Rooms | 49 (6.5%) | 62 (45.3%) |
| 4 or 5 Rooms | 201 (26.7%) | 59 (43.1%) |
| 6 or 7 Rooms | 261 (34.7%) | 0 (0.0%) |
| 8 or more Rooms | 214 (28.4%) | 0 (0.0%) |
| Total | 753 (100.0%) | 137 (100.0%) |
Housing Structure by Heating Type in Lexington Hills
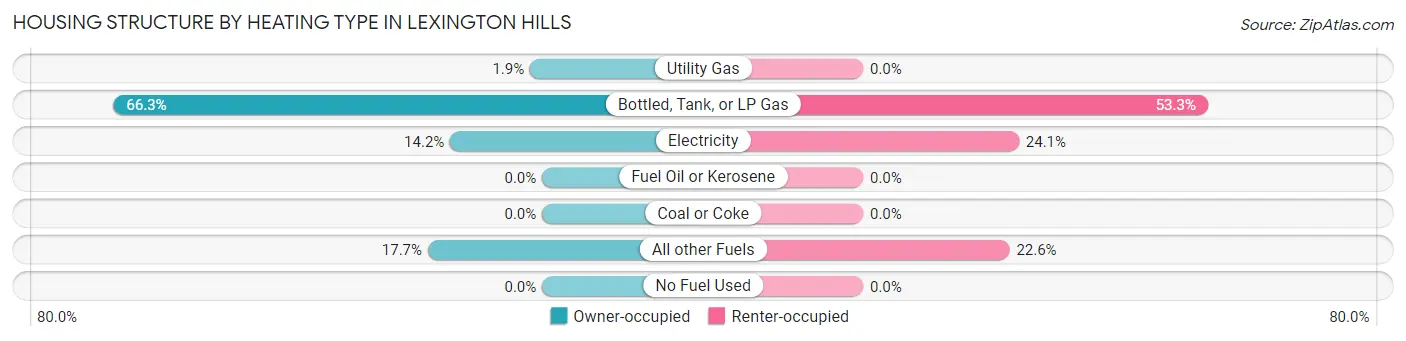
| Heating Type | Owner-occupied | Renter-occupied |
| Utility Gas | 14 (1.9%) | 0 (0.0%) |
| Bottled, Tank, or LP Gas | 499 (66.3%) | 73 (53.3%) |
| Electricity | 107 (14.2%) | 33 (24.1%) |
| Fuel Oil or Kerosene | 0 (0.0%) | 0 (0.0%) |
| Coal or Coke | 0 (0.0%) | 0 (0.0%) |
| All other Fuels | 133 (17.7%) | 31 (22.6%) |
| No Fuel Used | 0 (0.0%) | 0 (0.0%) |
| Total | 753 (100.0%) | 137 (100.0%) |
Household Vehicle Usage in Lexington Hills
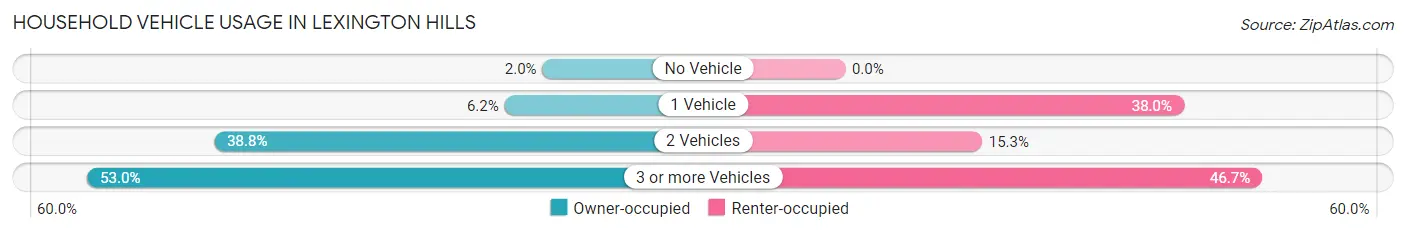
| Vehicles per Household | Owner-occupied | Renter-occupied |
| No Vehicle | 15 (2.0%) | 0 (0.0%) |
| 1 Vehicle | 47 (6.2%) | 52 (38.0%) |
| 2 Vehicles | 292 (38.8%) | 21 (15.3%) |
| 3 or more Vehicles | 399 (53.0%) | 64 (46.7%) |
| Total | 753 (100.0%) | 137 (100.0%) |
Real Estate & Mortgages in Lexington Hills
Real Estate and Mortgage Overview in Lexington Hills
| Characteristic | Without Mortgage | With Mortgage |
| Housing Units | 134 | 619 |
| Median Property Value | $1,150,000 | $1,176,900 |
| Median Household Income | $155,833 | $545 |
| Monthly Housing Costs | $1,030 | $554 |
| Real Estate Taxes | $7,833 | $9 |
Property Value by Mortgage Status in Lexington Hills
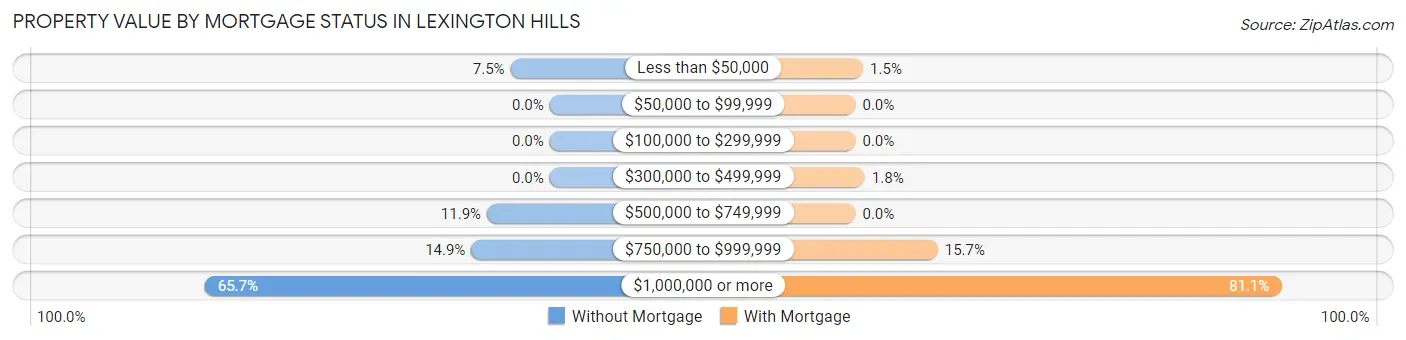
| Property Value | Without Mortgage | With Mortgage |
| Less than $50,000 | 10 (7.5%) | 9 (1.5%) |
| $50,000 to $99,999 | 0 (0.0%) | 0 (0.0%) |
| $100,000 to $299,999 | 0 (0.0%) | 0 (0.0%) |
| $300,000 to $499,999 | 0 (0.0%) | 11 (1.8%) |
| $500,000 to $749,999 | 16 (11.9%) | 0 (0.0%) |
| $750,000 to $999,999 | 20 (14.9%) | 97 (15.7%) |
| $1,000,000 or more | 88 (65.7%) | 502 (81.1%) |
| Total | 134 (100.0%) | 619 (100.0%) |
Household Income by Mortgage Status in Lexington Hills
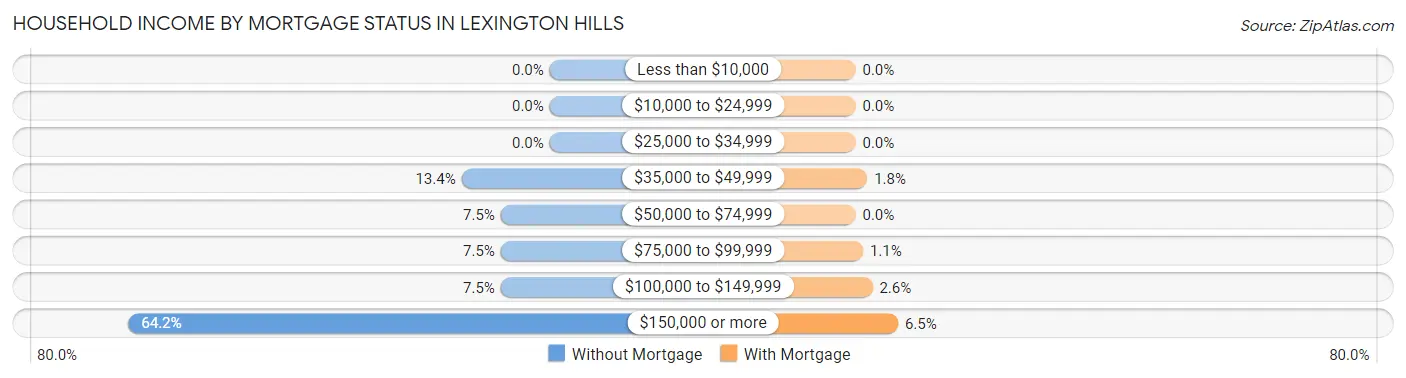
| Household Income | Without Mortgage | With Mortgage |
| Less than $10,000 | 0 (0.0%) | 0 (0.0%) |
| $10,000 to $24,999 | 0 (0.0%) | 0 (0.0%) |
| $25,000 to $34,999 | 0 (0.0%) | 0 (0.0%) |
| $35,000 to $49,999 | 18 (13.4%) | 11 (1.8%) |
| $50,000 to $74,999 | 10 (7.5%) | 0 (0.0%) |
| $75,000 to $99,999 | 10 (7.5%) | 7 (1.1%) |
| $100,000 to $149,999 | 10 (7.5%) | 16 (2.6%) |
| $150,000 or more | 86 (64.2%) | 40 (6.5%) |
| Total | 134 (100.0%) | 619 (100.0%) |
Property Value to Household Income Ratio in Lexington Hills
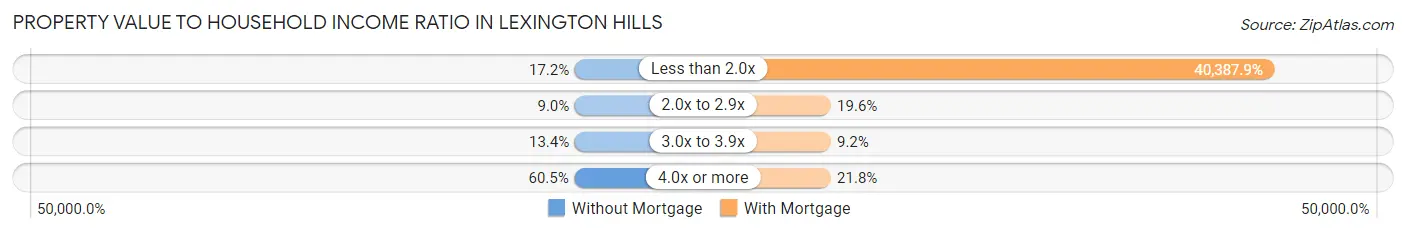
| Value-to-Income Ratio | Without Mortgage | With Mortgage |
| Less than 2.0x | 23 (17.2%) | 250,001 (40,387.9%) |
| 2.0x to 2.9x | 12 (9.0%) | 121 (19.6%) |
| 3.0x to 3.9x | 18 (13.4%) | 57 (9.2%) |
| 4.0x or more | 81 (60.5%) | 135 (21.8%) |
| Total | 134 (100.0%) | 619 (100.0%) |
Real Estate Taxes by Mortgage Status in Lexington Hills
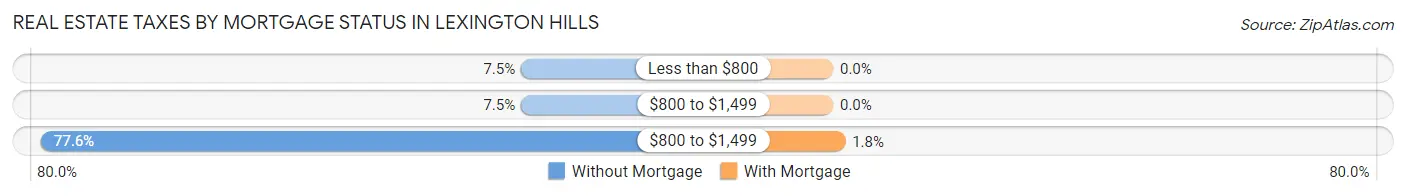
| Property Taxes | Without Mortgage | With Mortgage |
| Less than $800 | 10 (7.5%) | 0 (0.0%) |
| $800 to $1,499 | 10 (7.5%) | 0 (0.0%) |
| $800 to $1,499 | 104 (77.6%) | 11 (1.8%) |
| Total | 134 (100.0%) | 619 (100.0%) |
Health & Disability in Lexington Hills
Health Insurance Coverage by Age in Lexington Hills
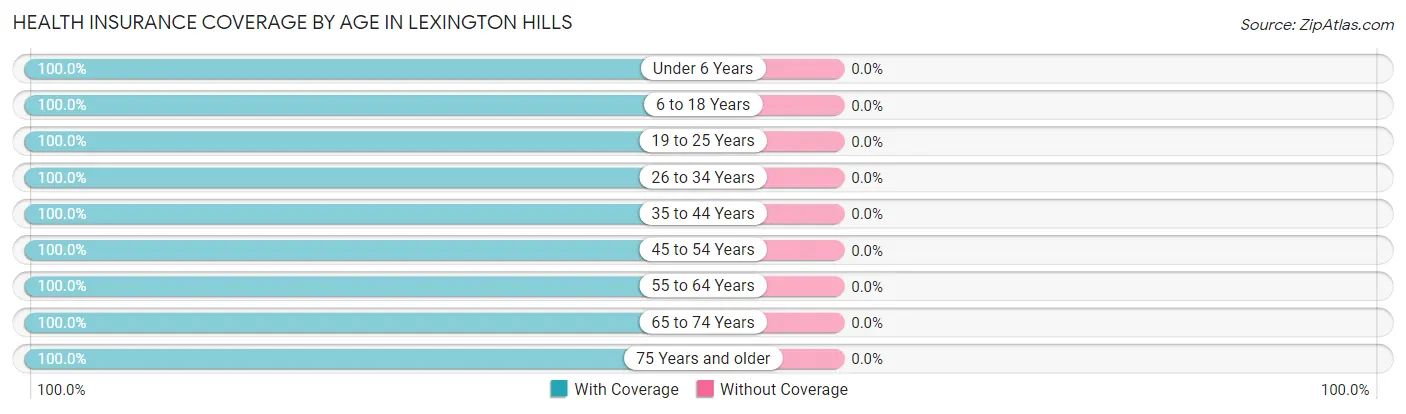
| Age Bracket | With Coverage | Without Coverage |
| Under 6 Years | 121 (100.0%) | 0 (0.0%) |
| 6 to 18 Years | 536 (100.0%) | 0 (0.0%) |
| 19 to 25 Years | 80 (100.0%) | 0 (0.0%) |
| 26 to 34 Years | 222 (100.0%) | 0 (0.0%) |
| 35 to 44 Years | 413 (100.0%) | 0 (0.0%) |
| 45 to 54 Years | 490 (100.0%) | 0 (0.0%) |
| 55 to 64 Years | 461 (100.0%) | 0 (0.0%) |
| 65 to 74 Years | 118 (100.0%) | 0 (0.0%) |
| 75 Years and older | 146 (100.0%) | 0 (0.0%) |
| Total | 2,587 (100.0%) | 0 (0.0%) |
Health Insurance Coverage by Citizenship Status in Lexington Hills
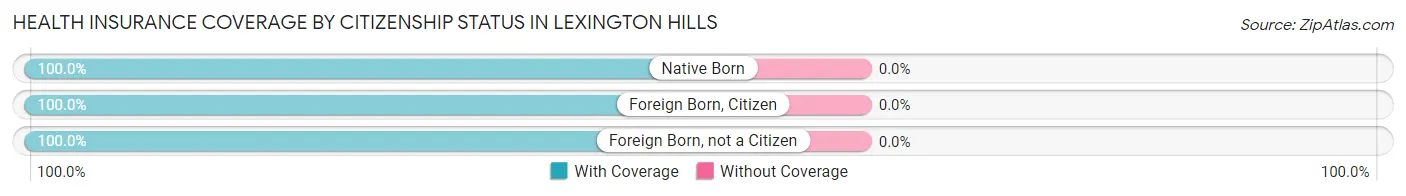
| Citizenship Status | With Coverage | Without Coverage |
| Native Born | 121 (100.0%) | 0 (0.0%) |
| Foreign Born, Citizen | 536 (100.0%) | 0 (0.0%) |
| Foreign Born, not a Citizen | 80 (100.0%) | 0 (0.0%) |
Health Insurance Coverage by Household Income in Lexington Hills
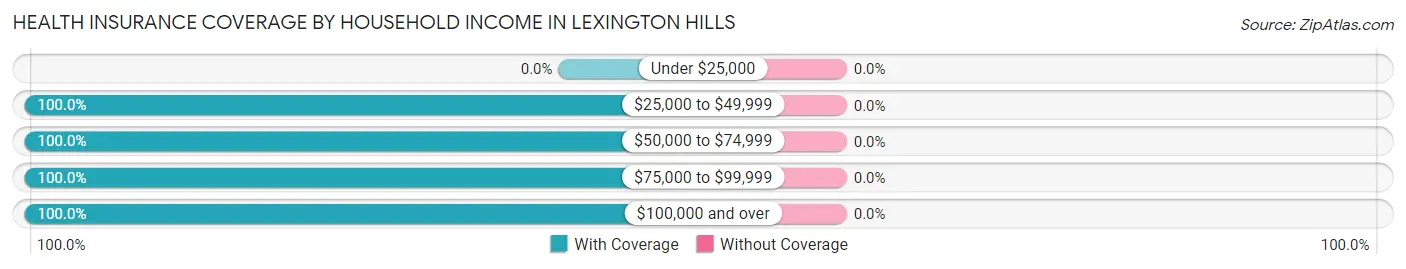
| Household Income | With Coverage | Without Coverage |
| Under $25,000 | 0 (0.0%) | 0 (0.0%) |
| $25,000 to $49,999 | 78 (100.0%) | 0 (0.0%) |
| $50,000 to $74,999 | 53 (100.0%) | 0 (0.0%) |
| $75,000 to $99,999 | 190 (100.0%) | 0 (0.0%) |
| $100,000 and over | 2,253 (100.0%) | 0 (0.0%) |
Public vs Private Health Insurance Coverage by Age in Lexington Hills
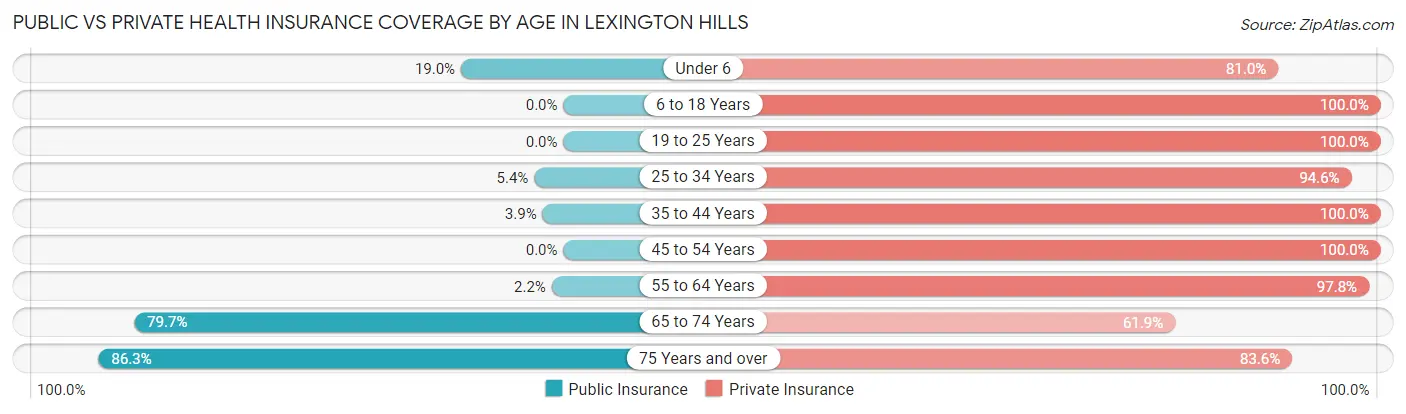
| Age Bracket | Public Insurance | Private Insurance |
| Under 6 | 23 (19.0%) | 98 (81.0%) |
| 6 to 18 Years | 0 (0.0%) | 536 (100.0%) |
| 19 to 25 Years | 0 (0.0%) | 80 (100.0%) |
| 25 to 34 Years | 12 (5.4%) | 210 (94.6%) |
| 35 to 44 Years | 16 (3.9%) | 413 (100.0%) |
| 45 to 54 Years | 0 (0.0%) | 490 (100.0%) |
| 55 to 64 Years | 10 (2.2%) | 451 (97.8%) |
| 65 to 74 Years | 94 (79.7%) | 73 (61.9%) |
| 75 Years and over | 126 (86.3%) | 122 (83.6%) |
| Total | 281 (10.9%) | 2,473 (95.6%) |
Disability Status by Sex by Age in Lexington Hills
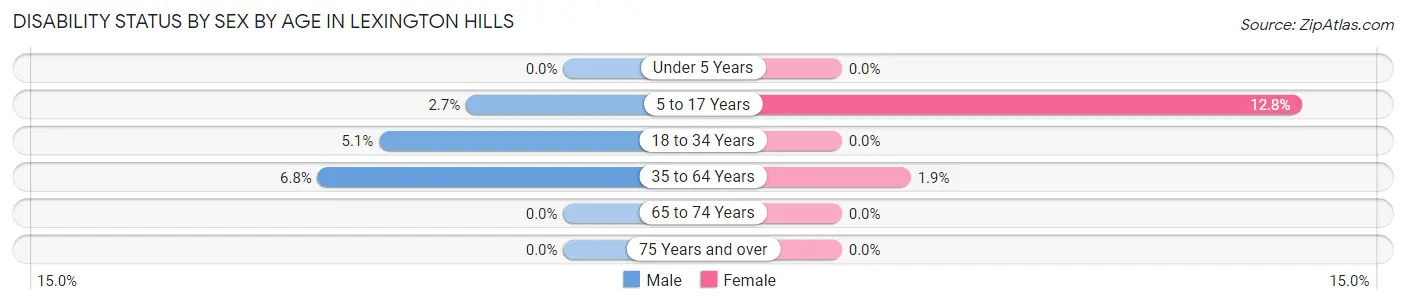
| Age Bracket | Male | Female |
| Under 5 Years | 0 (0.0%) | 0 (0.0%) |
| 5 to 17 Years | 8 (2.7%) | 25 (12.8%) |
| 18 to 34 Years | 12 (5.1%) | 0 (0.0%) |
| 35 to 64 Years | 47 (6.8%) | 13 (1.9%) |
| 65 to 74 Years | 0 (0.0%) | 0 (0.0%) |
| 75 Years and over | 0 (0.0%) | 0 (0.0%) |
Disability Class by Sex by Age in Lexington Hills
Disability Class: Hearing Difficulty
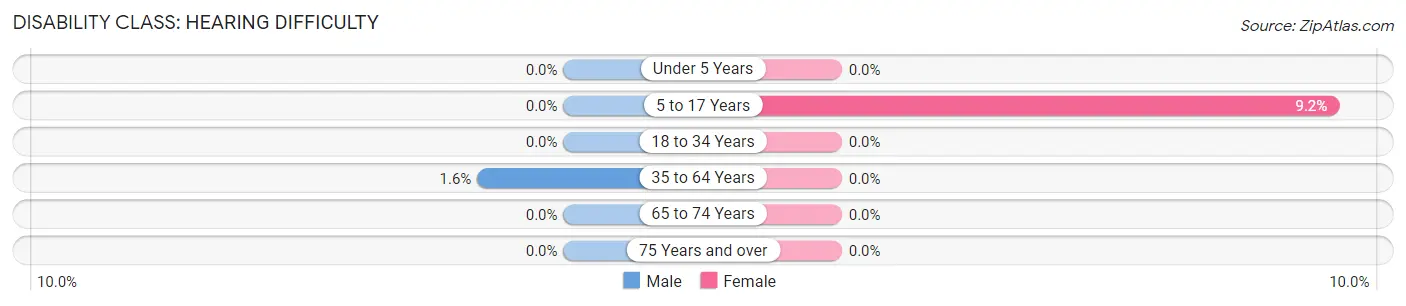
| Age Bracket | Male | Female |
| Under 5 Years | 0 (0.0%) | 0 (0.0%) |
| 5 to 17 Years | 0 (0.0%) | 18 (9.2%) |
| 18 to 34 Years | 0 (0.0%) | 0 (0.0%) |
| 35 to 64 Years | 11 (1.6%) | 0 (0.0%) |
| 65 to 74 Years | 0 (0.0%) | 0 (0.0%) |
| 75 Years and over | 0 (0.0%) | 0 (0.0%) |
Disability Class: Vision Difficulty
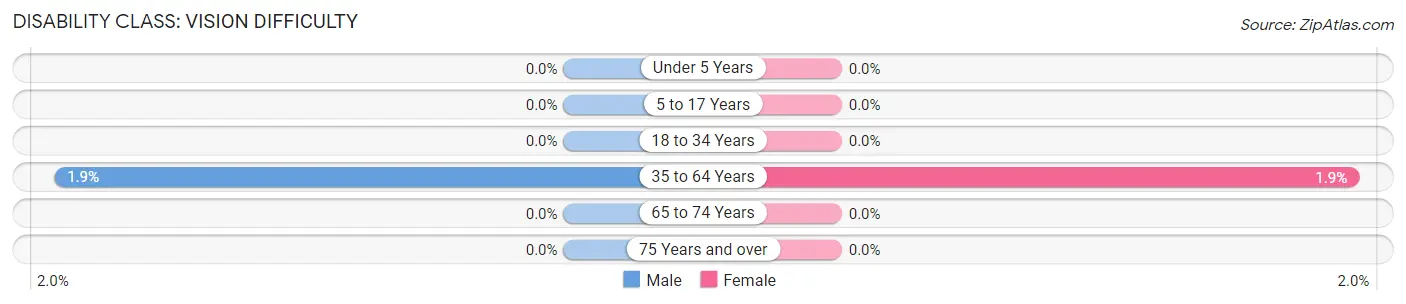
| Age Bracket | Male | Female |
| Under 5 Years | 0 (0.0%) | 0 (0.0%) |
| 5 to 17 Years | 0 (0.0%) | 0 (0.0%) |
| 18 to 34 Years | 0 (0.0%) | 0 (0.0%) |
| 35 to 64 Years | 13 (1.9%) | 13 (1.9%) |
| 65 to 74 Years | 0 (0.0%) | 0 (0.0%) |
| 75 Years and over | 0 (0.0%) | 0 (0.0%) |
Disability Class: Cognitive Difficulty
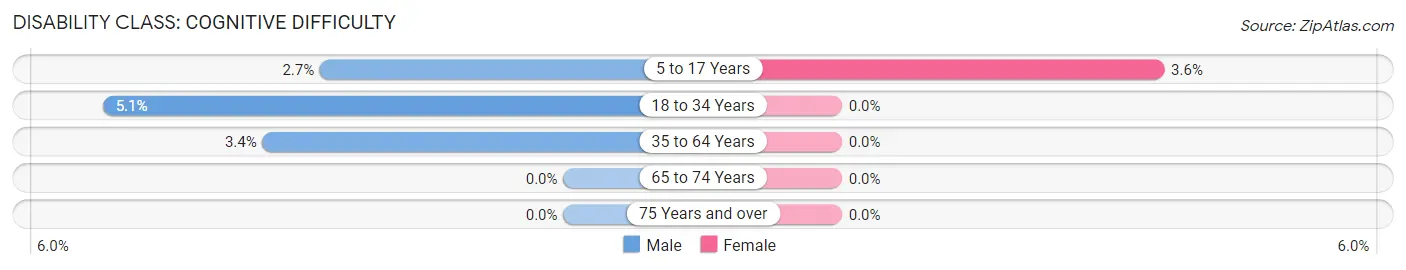
| Age Bracket | Male | Female |
| 5 to 17 Years | 8 (2.7%) | 7 (3.6%) |
| 18 to 34 Years | 12 (5.1%) | 0 (0.0%) |
| 35 to 64 Years | 23 (3.4%) | 0 (0.0%) |
| 65 to 74 Years | 0 (0.0%) | 0 (0.0%) |
| 75 Years and over | 0 (0.0%) | 0 (0.0%) |
Disability Class: Ambulatory Difficulty
| Age Bracket | Male | Female |
| 5 to 17 Years | 0 (0.0%) | 0 (0.0%) |
| 18 to 34 Years | 0 (0.0%) | 0 (0.0%) |
| 35 to 64 Years | 0 (0.0%) | 0 (0.0%) |
| 65 to 74 Years | 0 (0.0%) | 0 (0.0%) |
| 75 Years and over | 0 (0.0%) | 0 (0.0%) |
Disability Class: Self-Care Difficulty
| Age Bracket | Male | Female |
| 5 to 17 Years | 0 (0.0%) | 0 (0.0%) |
| 18 to 34 Years | 0 (0.0%) | 0 (0.0%) |
| 35 to 64 Years | 0 (0.0%) | 0 (0.0%) |
| 65 to 74 Years | 0 (0.0%) | 0 (0.0%) |
| 75 Years and over | 0 (0.0%) | 0 (0.0%) |
Technology Access in Lexington Hills
Computing Device Access in Lexington Hills
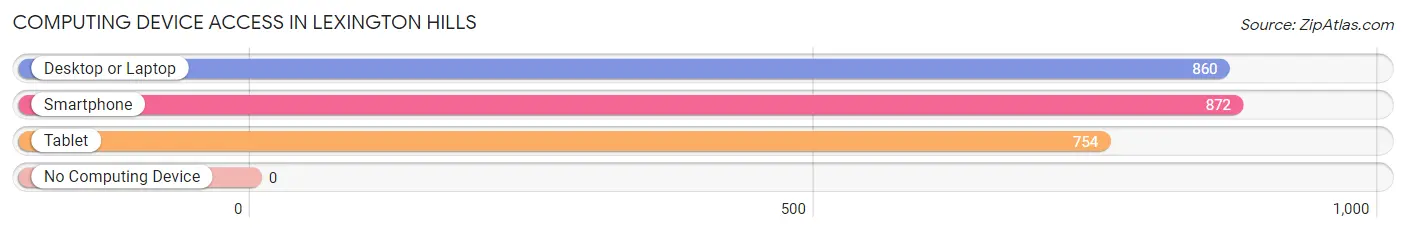
| Device Type | # Households | % Households |
| Desktop or Laptop | 860 | 96.6% |
| Smartphone | 872 | 98.0% |
| Tablet | 754 | 84.7% |
| No Computing Device | 0 | 0.0% |
| Total | 890 | 100.0% |
Internet Access in Lexington Hills
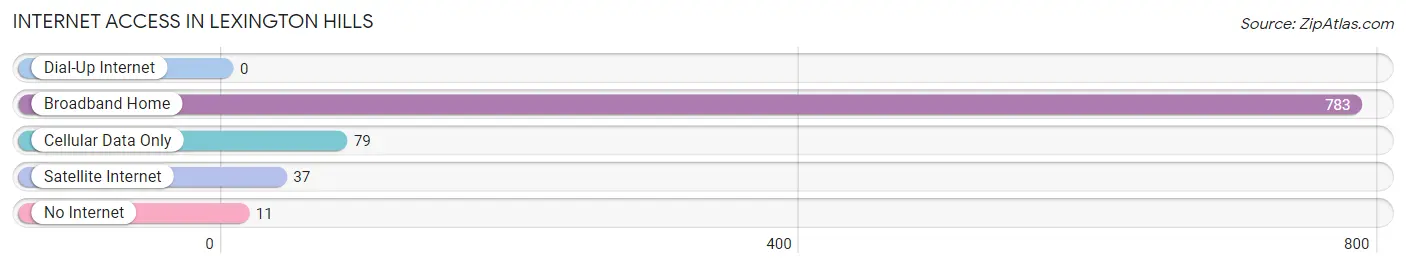
| Internet Type | # Households | % Households |
| Dial-Up Internet | 0 | 0.0% |
| Broadband Home | 783 | 88.0% |
| Cellular Data Only | 79 | 8.9% |
| Satellite Internet | 37 | 4.2% |
| No Internet | 11 | 1.2% |
| Total | 890 | 100.0% |
Lexington Hills Summary
Lexington Hills is a census-designated place located in Santa Clara County, California. It is situated in the Santa Cruz Mountains, approximately 8 miles south of Los Gatos and 8 miles northwest of Morgan Hill. The population was 2,845 at the 2010 census.
History
The area now known as Lexington Hills was originally inhabited by the Ohlone people. The first European settlers arrived in the area in the late 1700s, and the area was eventually incorporated into the Rancho San Ysidro Mexican land grant in 1839. The area was later purchased by the Lexington Hills Land Company in 1887, and the company began to develop the area for residential use. The area was officially named Lexington Hills in the early 1900s, and the first post office was established in the area in 1910.
Geography
Lexington Hills is located at 37°12'17"N 121°48'45"W (37.204722, -121.8125). It is situated in the Santa Cruz Mountains, approximately 8 miles south of Los Gatos and 8 miles northwest of Morgan Hill. The area is characterized by rolling hills and valleys, with elevations ranging from 500 to 1,500 feet. The area is mostly rural, with some residential development.
Economy
The economy of Lexington Hills is largely based on agriculture and tourism. The area is home to several wineries, including the Lexington Hills Winery, which produces a variety of wines. The area is also home to several small businesses, including restaurants, shops, and other services.
Demographics
As of the 2010 census, there were 2,845 people, 1,072 households, and 790 families residing in the CDP. The population density was 545.3 people per square mile (210.9/km2). The racial makeup of the CDP was 79.2% White, 0.7% African American, 0.3% Native American, 11.2% Asian, 0.1% Pacific Islander, 5.2% from other races, and 3.3% from two or more races. Hispanic or Latino of any race were 16.2% of the population.
The median income for a household in the CDP was $90,917, and the median income for a family was $103,917. Males had a median income of $71,250 versus $50,000 for females. The per capita income for the CDP was $41,917. About 4.2% of families and 6.2% of the population were below the poverty line, including 8.2% of those under age 18 and none of those age 65 or over.
Common Questions
What is Per Capita Income in Lexington Hills?
Per Capita income in Lexington Hills is $113,089.
What is the Median Family Income in Lexington Hills?
Median Family Income in Lexington Hills is $250,001.
What is the Median Household income in Lexington Hills?
Median Household Income in Lexington Hills is $245,536.
What is Income or Wage Gap in Lexington Hills?
Income or Wage Gap in Lexington Hills is 67.5%.
Women in Lexington Hills earn 32.5 cents for every dollar earned by a man.
What is Inequality or Gini Index in Lexington Hills?
Inequality or Gini Index in Lexington Hills is 0.41.
What is the Total Population of Lexington Hills?
Total Population of Lexington Hills is 2,587.
What is the Total Male Population of Lexington Hills?
Total Male Population of Lexington Hills is 1,422.
What is the Total Female Population of Lexington Hills?
Total Female Population of Lexington Hills is 1,165.
What is the Ratio of Males per 100 Females in Lexington Hills?
There are 122.06 Males per 100 Females in Lexington Hills.
What is the Ratio of Females per 100 Males in Lexington Hills?
There are 81.93 Females per 100 Males in Lexington Hills.
What is the Median Population Age in Lexington Hills?
Median Population Age in Lexington Hills is 43.4 Years.
What is the Average Family Size in Lexington Hills
Average Family Size in Lexington Hills is 3.0 People.
What is the Average Household Size in Lexington Hills
Average Household Size in Lexington Hills is 2.9 People.
How Large is the Labor Force in Lexington Hills?
There are 1,529 People in the Labor Forcein in Lexington Hills.
What is the Percentage of People in the Labor Force in Lexington Hills?
74.1% of People are in the Labor Force in Lexington Hills.
What is the Unemployment Rate in Lexington Hills?
Unemployment Rate in Lexington Hills is 1.0%.