Cities with the Highest Percentage of Population Employed in Computer, Engineering & Science in New Hampshire
RELATED REPORTS & OPTIONS
Computer, Engineering & Science
New Hampshire
Compare Cities
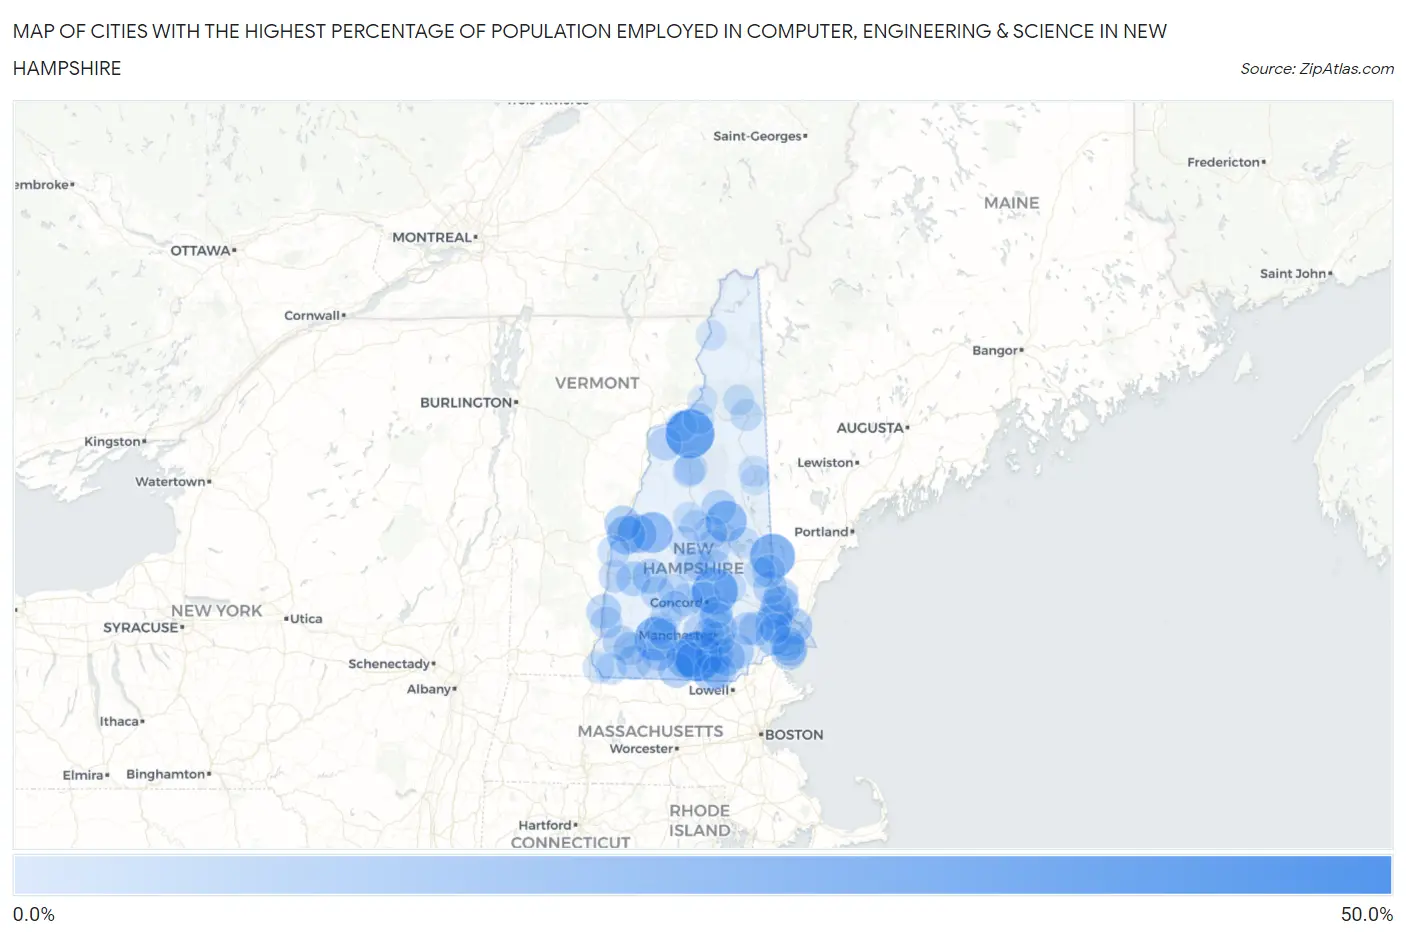
Map of Cities with the Highest Percentage of Population Employed in Computer, Engineering & Science in New Hampshire
0.0%
50.0%
Cities with the Highest Percentage of Population Employed in Computer, Engineering & Science in New Hampshire
| City | % Employed | vs State | vs National | |
| 1. | New Boston | 42.9% | 8.3%(+34.6)#1 | 6.8%(+36.1)#98 |
| 2. | Amherst | 33.9% | 8.3%(+25.6)#2 | 6.8%(+27.2)#161 |
| 3. | Bethlehem | 32.6% | 8.3%(+24.3)#3 | 6.8%(+25.8)#176 |
| 4. | Loudon | 27.4% | 8.3%(+19.1)#4 | 6.8%(+20.6)#276 |
| 5. | Milton Mills | 25.8% | 8.3%(+17.5)#5 | 6.8%(+19.0)#313 |
| 6. | Hancock | 23.5% | 8.3%(+15.2)#6 | 6.8%(+16.8)#376 |
| 7. | Suissevale | 19.0% | 8.3%(+10.7)#7 | 6.8%(+12.2)#635 |
| 8. | Canaan | 18.6% | 8.3%(+10.3)#8 | 6.8%(+11.9)#669 |
| 9. | Klondike Corner | 16.9% | 8.3%(+8.62)#9 | 6.8%(+10.2)#842 |
| 10. | Enfield | 14.5% | 8.3%(+6.23)#10 | 6.8%(+7.77)#1,230 |
| 11. | Lebanon | 14.5% | 8.3%(+6.22)#11 | 6.8%(+7.76)#1,231 |
| 12. | Wilton | 14.0% | 8.3%(+5.74)#12 | 6.8%(+7.28)#1,323 |
| 13. | Dover | 13.4% | 8.3%(+5.15)#13 | 6.8%(+6.68)#1,501 |
| 14. | East Merrimack | 12.4% | 8.3%(+4.06)#14 | 6.8%(+5.60)#1,820 |
| 15. | Nashua | 11.9% | 8.3%(+3.65)#15 | 6.8%(+5.19)#1,956 |
| 16. | Londonderry | 11.8% | 8.3%(+3.47)#16 | 6.8%(+5.00)#2,018 |
| 17. | Newmarket | 11.7% | 8.3%(+3.39)#17 | 6.8%(+4.93)#2,047 |
| 18. | Portsmouth | 11.6% | 8.3%(+3.26)#18 | 6.8%(+4.80)#2,083 |
| 19. | Exeter | 10.2% | 8.3%(+1.92)#19 | 6.8%(+3.46)#2,801 |
| 20. | Hanover | 10.2% | 8.3%(+1.85)#20 | 6.8%(+3.39)#2,851 |
| 21. | Derry | 9.4% | 8.3%(+1.08)#21 | 6.8%(+2.62)#3,404 |
| 22. | Greenville | 9.2% | 8.3%(+0.924)#22 | 6.8%(+2.46)#3,529 |
| 23. | Seabrook Beach | 9.1% | 8.3%(+0.809)#23 | 6.8%(+2.35)#3,608 |
| 24. | Milford | 8.6% | 8.3%(+0.272)#24 | 6.8%(+1.81)#4,092 |
| 25. | Durham | 8.5% | 8.3%(+0.232)#25 | 6.8%(+1.77)#4,135 |
| 26. | Blodgett Landing | 8.3% | 8.3%(+0.029)#26 | 6.8%(+1.57)#4,337 |
| 27. | Newport | 8.3% | 8.3%(+0.020)#27 | 6.8%(+1.56)#4,350 |
| 28. | Center Sandwich | 8.2% | 8.3%(-0.122)#28 | 6.8%(+1.42)#4,495 |
| 29. | Hooksett | 8.2% | 8.3%(-0.134)#29 | 6.8%(+1.41)#4,506 |
| 30. | Hudson | 8.1% | 8.3%(-0.237)#30 | 6.8%(+1.30)#4,613 |
| 31. | Hampton Beach | 8.0% | 8.3%(-0.272)#31 | 6.8%(+1.27)#4,661 |
| 32. | Hampton | 8.0% | 8.3%(-0.302)#32 | 6.8%(+1.24)#4,694 |
| 33. | South Hooksett | 7.9% | 8.3%(-0.373)#33 | 6.8%(+1.17)#4,779 |
| 34. | North Walpole | 7.9% | 8.3%(-0.409)#34 | 6.8%(+1.13)#4,827 |
| 35. | Epping | 7.7% | 8.3%(-0.650)#35 | 6.8%(+0.889)#5,125 |
| 36. | Keene | 7.6% | 8.3%(-0.672)#36 | 6.8%(+0.868)#5,157 |
| 37. | Somersworth | 7.5% | 8.3%(-0.776)#37 | 6.8%(+0.764)#5,267 |
| 38. | Troy | 7.5% | 8.3%(-0.847)#38 | 6.8%(+0.692)#5,341 |
| 39. | Manchester | 7.2% | 8.3%(-1.12)#39 | 6.8%(+0.417)#5,678 |
| 40. | Peterborough | 6.9% | 8.3%(-1.39)#40 | 6.8%(+0.145)#6,082 |
| 41. | Concord | 6.7% | 8.3%(-1.56)#41 | 6.8%(-0.023)#6,343 |
| 42. | Rochester | 6.4% | 8.3%(-1.90)#42 | 6.8%(-0.359)#6,852 |
| 43. | Franklin | 6.2% | 8.3%(-2.08)#43 | 6.8%(-0.542)#7,169 |
| 44. | Goffstown | 5.9% | 8.3%(-2.41)#44 | 6.8%(-0.873)#7,795 |
| 45. | Lisbon | 5.9% | 8.3%(-2.45)#45 | 6.8%(-0.911)#7,888 |
| 46. | Laconia | 5.8% | 8.3%(-2.49)#46 | 6.8%(-0.956)#7,974 |
| 47. | Marlborough | 5.8% | 8.3%(-2.50)#47 | 6.8%(-0.959)#7,984 |
| 48. | Raymond | 5.7% | 8.3%(-2.63)#48 | 6.8%(-1.09)#8,215 |
| 49. | Contoocook | 5.3% | 8.3%(-3.05)#49 | 6.8%(-1.51)#9,033 |
| 50. | Milton | 5.2% | 8.3%(-3.06)#50 | 6.8%(-1.52)#9,054 |
| 51. | Bradford | 5.1% | 8.3%(-3.20)#51 | 6.8%(-1.66)#9,325 |
| 52. | Suncook | 4.5% | 8.3%(-3.79)#52 | 6.8%(-2.25)#10,669 |
| 53. | Claremont | 4.5% | 8.3%(-3.81)#53 | 6.8%(-2.27)#10,716 |
| 54. | Meredith | 4.4% | 8.3%(-3.86)#54 | 6.8%(-2.32)#10,818 |
| 55. | Lincoln | 4.2% | 8.3%(-4.09)#55 | 6.8%(-2.55)#11,410 |
| 56. | North Woodstock | 3.9% | 8.3%(-4.40)#56 | 6.8%(-2.86)#12,248 |
| 57. | Plainfield | 3.9% | 8.3%(-4.42)#57 | 6.8%(-2.88)#12,297 |
| 58. | Pittsfield | 3.8% | 8.3%(-4.54)#58 | 6.8%(-3.00)#12,642 |
| 59. | Walpole | 3.7% | 8.3%(-4.60)#59 | 6.8%(-3.06)#12,804 |
| 60. | Francestown | 3.6% | 8.3%(-4.67)#60 | 6.8%(-3.13)#12,993 |
| 61. | Belmont | 3.6% | 8.3%(-4.75)#61 | 6.8%(-3.21)#13,230 |
| 62. | Warner | 3.5% | 8.3%(-4.77)#62 | 6.8%(-3.24)#13,303 |
| 63. | Antrim | 3.5% | 8.3%(-4.84)#63 | 6.8%(-3.30)#13,498 |
| 64. | Hillsborough | 3.3% | 8.3%(-4.96)#64 | 6.8%(-3.42)#13,885 |
| 65. | Winchester | 3.3% | 8.3%(-4.97)#65 | 6.8%(-3.43)#13,913 |
| 66. | Gorham | 3.3% | 8.3%(-5.01)#66 | 6.8%(-3.47)#14,026 |
| 67. | Ashland | 3.0% | 8.3%(-5.31)#67 | 6.8%(-3.77)#14,936 |
| 68. | Hinsdale | 2.9% | 8.3%(-5.36)#68 | 6.8%(-3.82)#15,061 |
| 69. | Farmington | 2.8% | 8.3%(-5.46)#69 | 6.8%(-3.92)#15,377 |
| 70. | Littleton | 2.5% | 8.3%(-5.84)#70 | 6.8%(-4.30)#16,598 |
| 71. | Bennington | 2.5% | 8.3%(-5.84)#71 | 6.8%(-4.31)#16,616 |
| 72. | Wolfeboro | 2.4% | 8.3%(-5.91)#72 | 6.8%(-4.37)#16,806 |
| 73. | Tilton Northfield | 2.4% | 8.3%(-5.92)#73 | 6.8%(-4.38)#16,821 |
| 74. | Plymouth | 2.3% | 8.3%(-5.99)#74 | 6.8%(-4.45)#17,040 |
| 75. | Whitefield | 2.3% | 8.3%(-6.05)#75 | 6.8%(-4.51)#17,226 |
| 76. | Pinardville | 2.1% | 8.3%(-6.23)#76 | 6.8%(-4.69)#17,816 |
| 77. | North Conway | 2.1% | 8.3%(-6.23)#77 | 6.8%(-4.69)#17,822 |
| 78. | Berlin | 2.1% | 8.3%(-6.25)#78 | 6.8%(-4.71)#17,880 |
| 79. | Henniker | 1.9% | 8.3%(-6.43)#79 | 6.8%(-4.89)#18,365 |
| 80. | Newfields | 1.8% | 8.3%(-6.55)#80 | 6.8%(-5.01)#18,743 |
| 81. | Jaffrey | 1.6% | 8.3%(-6.75)#81 | 6.8%(-5.21)#19,309 |
| 82. | Bristol | 1.1% | 8.3%(-7.23)#82 | 6.8%(-5.69)#20,722 |
| 83. | Colebrook | 0.82% | 8.3%(-7.49)#83 | 6.8%(-5.95)#21,363 |
| 84. | Lancaster | 0.45% | 8.3%(-7.85)#84 | 6.8%(-6.31)#22,120 |
| 85. | Conway | 0.34% | 8.3%(-7.96)#85 | 6.8%(-6.43)#22,294 |
1
Common Questions
What are the Top 10 Cities with the Highest Percentage of Population Employed in Computer, Engineering & Science in New Hampshire?
Top 10 Cities with the Highest Percentage of Population Employed in Computer, Engineering & Science in New Hampshire are:
#1
33.9%
#2
32.6%
#3
27.4%
#4
25.8%
#5
23.5%
#6
19.0%
#7
18.6%
#8
14.5%
#9
14.5%
#10
14.0%
What city has the Highest Percentage of Population Employed in Computer, Engineering & Science in New Hampshire?
Amherst has the Highest Percentage of Population Employed in Computer, Engineering & Science in New Hampshire with 33.9%.
What is the Percentage of Population Employed in Computer, Engineering & Science in the State of New Hampshire?
Percentage of Population Employed in Computer, Engineering & Science in New Hampshire is 8.3%.
What is the Percentage of Population Employed in Computer, Engineering & Science in the United States?
Percentage of Population Employed in Computer, Engineering & Science in the United States is 6.8%.