Redwood City, CA Map & Demographics
Redwood City Map
Redwood City Overview
$77,982
PER CAPITA INCOME
$164,255
AVG FAMILY INCOME
$145,620
AVG HOUSEHOLD INCOME
19.3%
WAGE / INCOME GAP [ % ]
80.7¢/ $1
WAGE / INCOME GAP [ $ ]
$10,379
FAMILY INCOME DEFICIT
0.49
INEQUALITY / GINI INDEX
83,077
TOTAL POPULATION
41,443
MALE POPULATION
41,634
FEMALE POPULATION
99.54
MALES / 100 FEMALES
100.46
FEMALES / 100 MALES
37.1
MEDIAN AGE
3.3
AVG FAMILY SIZE
2.7
AVG HOUSEHOLD SIZE
47,025
LABOR FORCE [ PEOPLE ]
70.0%
PERCENT IN LABOR FORCE
3.9%
UNEMPLOYMENT RATE
Redwood City Area Codes
Income in Redwood City
Income Overview in Redwood City
Per Capita Income in Redwood City is $77,982, while median incomes of families and households are $164,255 and $145,620 respectively.
| Characteristic | Number | Measure |
| Per Capita Income | 83,077 | $77,982 |
| Median Family Income | 19,953 | $164,255 |
| Mean Family Income | 19,953 | $239,535 |
| Median Household Income | 29,993 | $145,620 |
| Mean Household Income | 29,993 | $211,981 |
| Income Deficit | 19,953 | $10,379 |
| Wage / Income Gap (%) | 83,077 | 19.28% |
| Wage / Income Gap ($) | 83,077 | 80.72¢ per $1 |
| Gini / Inequality Index | 83,077 | 0.49 |
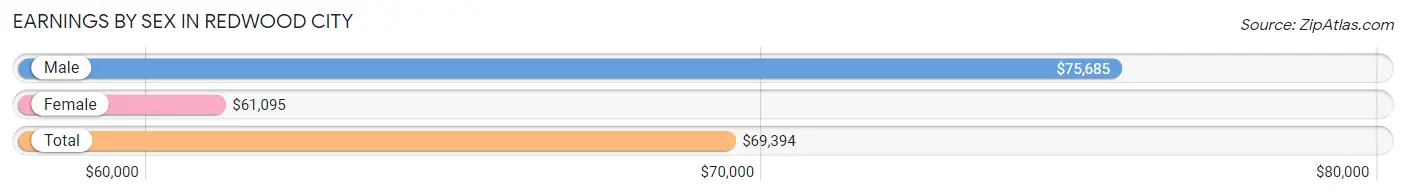
Earnings by Sex in Redwood City
Average Earnings in Redwood City are $69,394, $75,685 for men and $61,095 for women, a difference of 19.3%.
| Sex | Number | Average Earnings |
| Male | 26,432 (53.7%) | $75,685 |
| Female | 22,761 (46.3%) | $61,095 |
| Total | 49,193 (100.0%) | $69,394 |
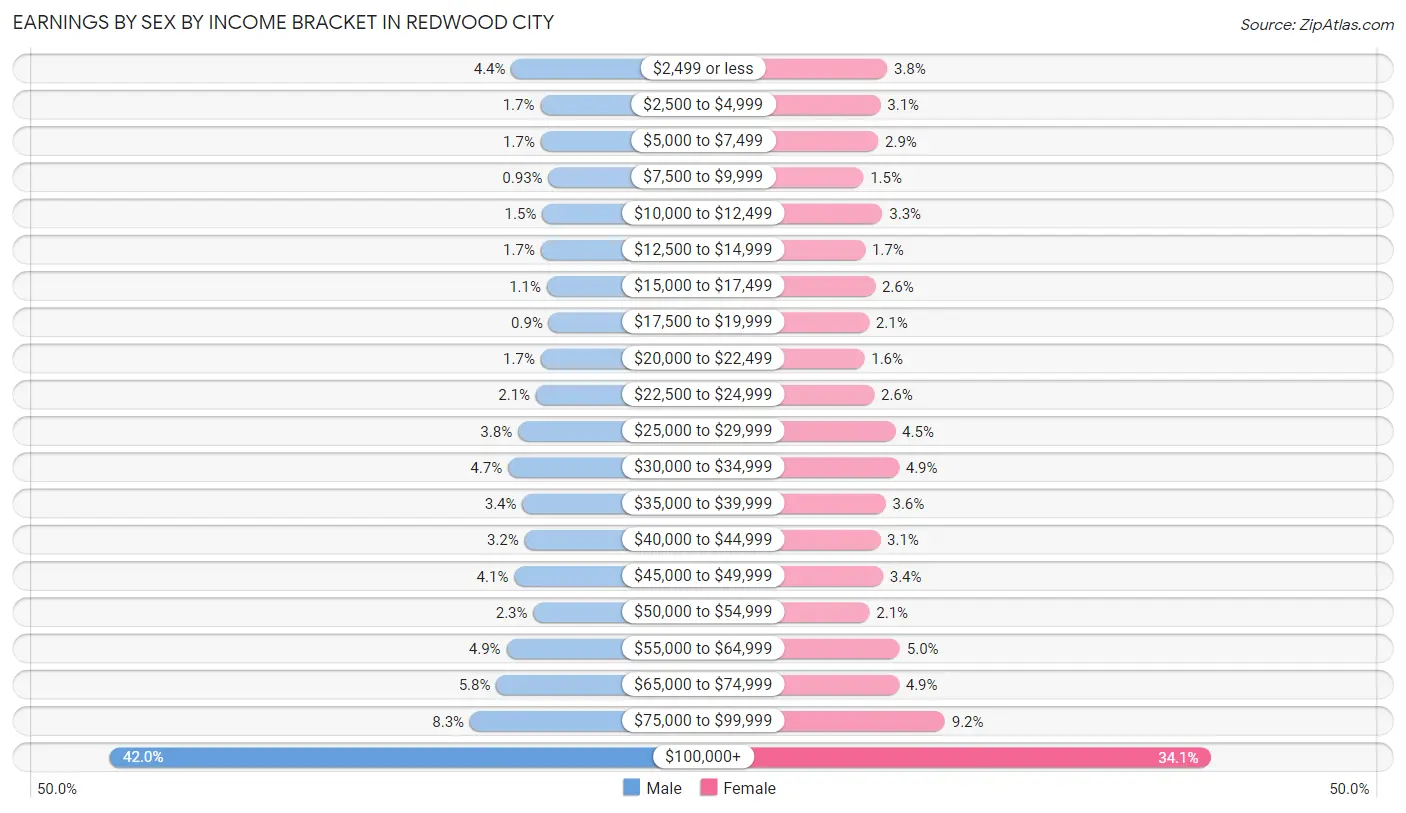
Earnings by Sex by Income Bracket in Redwood City
The most common earnings brackets in Redwood City are $100,000+ for men (11,099 | 42.0%) and $100,000+ for women (7,750 | 34.1%).
| Income | Male | Female |
| $2,499 or less | 1,163 (4.4%) | 857 (3.8%) |
| $2,500 to $4,999 | 448 (1.7%) | 714 (3.1%) |
| $5,000 to $7,499 | 435 (1.7%) | 666 (2.9%) |
| $7,500 to $9,999 | 246 (0.9%) | 350 (1.5%) |
| $10,000 to $12,499 | 400 (1.5%) | 758 (3.3%) |
| $12,500 to $14,999 | 436 (1.7%) | 386 (1.7%) |
| $15,000 to $17,499 | 286 (1.1%) | 601 (2.6%) |
| $17,500 to $19,999 | 237 (0.9%) | 472 (2.1%) |
| $20,000 to $22,499 | 437 (1.7%) | 373 (1.6%) |
| $22,500 to $24,999 | 554 (2.1%) | 580 (2.5%) |
| $25,000 to $29,999 | 998 (3.8%) | 1,030 (4.5%) |
| $30,000 to $34,999 | 1,247 (4.7%) | 1,108 (4.9%) |
| $35,000 to $39,999 | 892 (3.4%) | 827 (3.6%) |
| $40,000 to $44,999 | 835 (3.2%) | 710 (3.1%) |
| $45,000 to $49,999 | 1,091 (4.1%) | 767 (3.4%) |
| $50,000 to $54,999 | 619 (2.3%) | 481 (2.1%) |
| $55,000 to $64,999 | 1,285 (4.9%) | 1,132 (5.0%) |
| $65,000 to $74,999 | 1,536 (5.8%) | 1,109 (4.9%) |
| $75,000 to $99,999 | 2,188 (8.3%) | 2,090 (9.2%) |
| $100,000+ | 11,099 (42.0%) | 7,750 (34.1%) |
| Total | 26,432 (100.0%) | 22,761 (100.0%) |
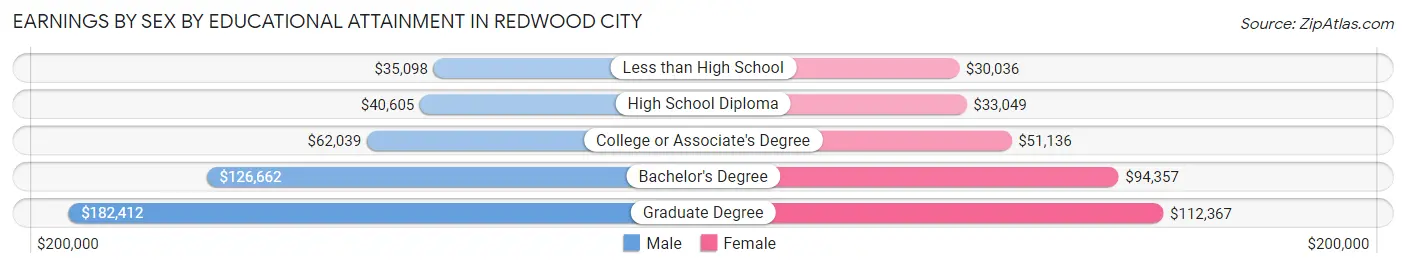
Earnings by Sex by Educational Attainment in Redwood City
Average earnings in Redwood City are $83,852 for men and $68,997 for women, a difference of 17.7%. Men with an educational attainment of graduate degree enjoy the highest average annual earnings of $182,412, while those with less than high school education earn the least with $35,098. Women with an educational attainment of graduate degree earn the most with the average annual earnings of $112,367, while those with less than high school education have the smallest earnings of $30,036.
| Educational Attainment | Male Income | Female Income |
| Less than High School | $35,098 | $30,036 |
| High School Diploma | $40,605 | $33,049 |
| College or Associate's Degree | $62,039 | $51,136 |
| Bachelor's Degree | $126,662 | $94,357 |
| Graduate Degree | $182,412 | $112,367 |
| Total | $83,852 | $68,997 |
Family Income in Redwood City
Family Income Brackets in Redwood City
According to the Redwood City family income data, there are 8,440 families falling into the $200,000+ income range, which is the most common income bracket and makes up 42.3% of all families. Conversely, the $10,000 to $14,999 income bracket is the least frequent group with only 140 families (0.7%) belonging to this category.
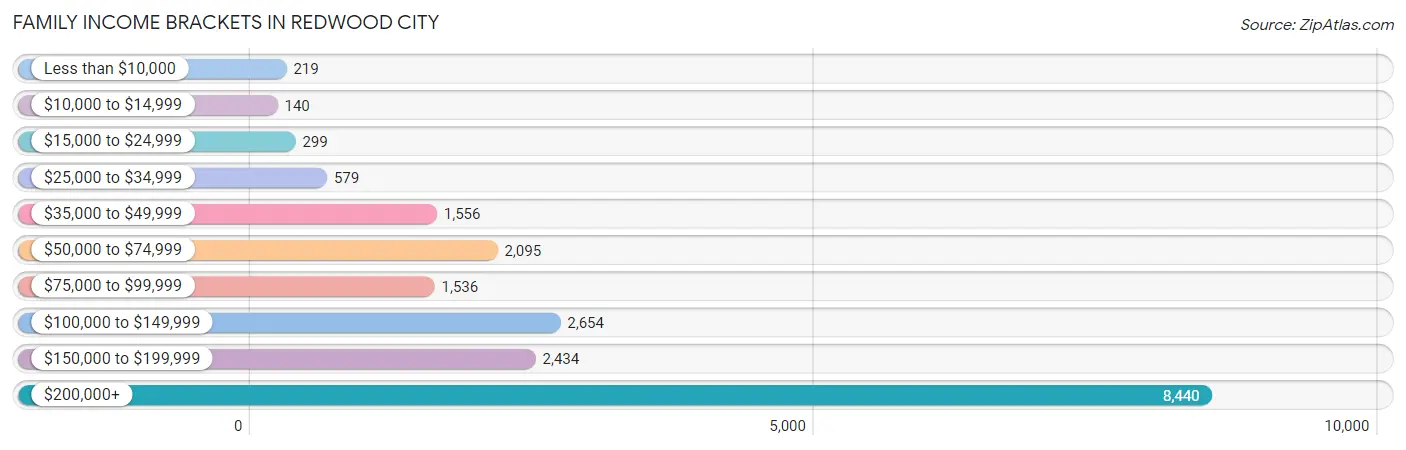
| Income Bracket | # Families | % Families |
| Less than $10,000 | 219 | 1.1% |
| $10,000 to $14,999 | 140 | 0.7% |
| $15,000 to $24,999 | 299 | 1.5% |
| $25,000 to $34,999 | 579 | 2.9% |
| $35,000 to $49,999 | 1,556 | 7.8% |
| $50,000 to $74,999 | 2,095 | 10.5% |
| $75,000 to $99,999 | 1,536 | 7.7% |
| $100,000 to $149,999 | 2,654 | 13.3% |
| $150,000 to $199,999 | 2,434 | 12.2% |
| $200,000+ | 8,440 | 42.3% |
Family Income by Famaliy Size in Redwood City
4-person families (3,891 | 19.5%) account for the highest median family income in Redwood City with $201,507 per family, while 2-person families (8,499 | 42.6%) have the highest median income of $80,700 per family member.
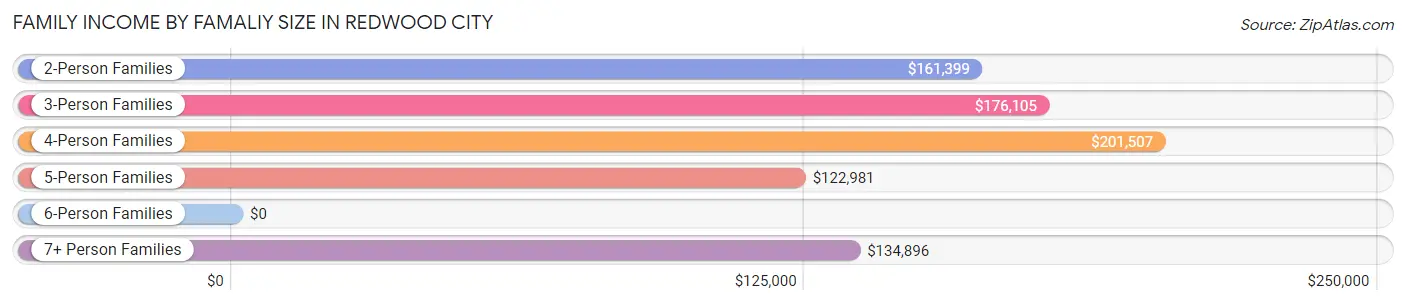
| Income Bracket | # Families | Median Income |
| 2-Person Families | 8,499 (42.6%) | $161,399 |
| 3-Person Families | 4,958 (24.8%) | $176,105 |
| 4-Person Families | 3,891 (19.5%) | $201,507 |
| 5-Person Families | 1,663 (8.3%) | $122,981 |
| 6-Person Families | 529 (2.6%) | $0 |
| 7+ Person Families | 413 (2.1%) | $134,896 |
| Total | 19,953 (100.0%) | $164,255 |
Family Income by Number of Earners in Redwood City
The median family income in Redwood City is $164,255, with families comprising 2 earners (10,477) having the highest median family income of $224,152, while families with no earners (1,503) have the lowest median family income of $82,957, accounting for 52.5% and 7.5% of families, respectively.
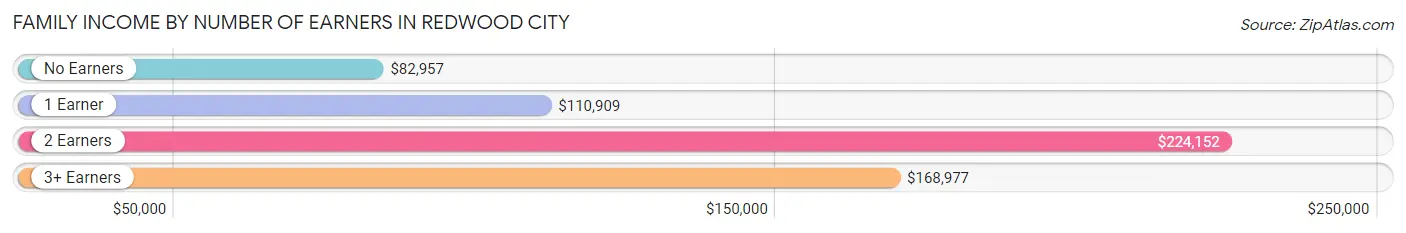
| Number of Earners | # Families | Median Income |
| No Earners | 1,503 (7.5%) | $82,957 |
| 1 Earner | 5,430 (27.2%) | $110,909 |
| 2 Earners | 10,477 (52.5%) | $224,152 |
| 3+ Earners | 2,543 (12.7%) | $168,977 |
| Total | 19,953 (100.0%) | $164,255 |
Household Income in Redwood City
Household Income Brackets in Redwood City
With 10,977 households falling in the category, the $200,000+ income range is the most frequent in Redwood City, accounting for 36.6% of all households. In contrast, only 540 households (1.8%) fall into the $10,000 to $14,999 income bracket, making it the least populous group.
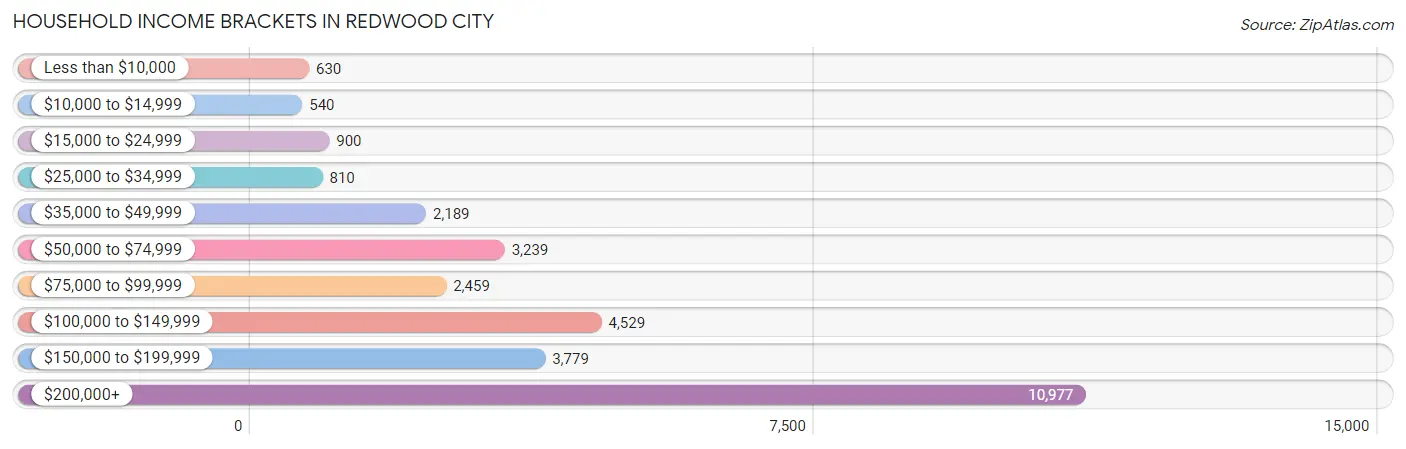
| Income Bracket | # Households | % Households |
| Less than $10,000 | 630 | 2.1% |
| $10,000 to $14,999 | 540 | 1.8% |
| $15,000 to $24,999 | 900 | 3.0% |
| $25,000 to $34,999 | 810 | 2.7% |
| $35,000 to $49,999 | 2,189 | 7.3% |
| $50,000 to $74,999 | 3,239 | 10.8% |
| $75,000 to $99,999 | 2,459 | 8.2% |
| $100,000 to $149,999 | 4,529 | 15.1% |
| $150,000 to $199,999 | 3,779 | 12.6% |
| $200,000+ | 10,977 | 36.6% |
Household Income by Householder Age in Redwood City
The median household income in Redwood City is $145,620, with the highest median household income of $170,357 found in the 45 to 64 years age bracket for the primary householder. A total of 10,734 households (35.8%) fall into this category. Meanwhile, the 15 to 24 years age bracket for the primary householder has the lowest median household income of $80,066, with 911 households (3.0%) in this group.
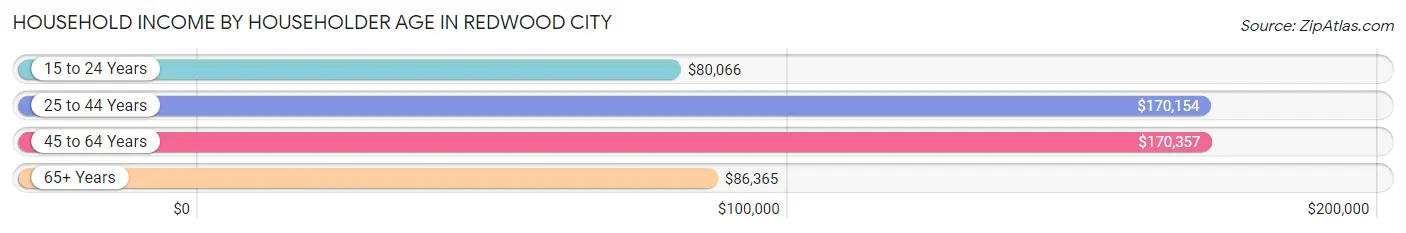
| Income Bracket | # Households | Median Income |
| 15 to 24 Years | 911 (3.0%) | $80,066 |
| 25 to 44 Years | 12,283 (40.9%) | $170,154 |
| 45 to 64 Years | 10,734 (35.8%) | $170,357 |
| 65+ Years | 6,065 (20.2%) | $86,365 |
| Total | 29,993 (100.0%) | $145,620 |
Poverty in Redwood City
Income Below Poverty by Sex and Age in Redwood City
With 5.4% poverty level for males and 7.4% for females among the residents of Redwood City, 5 year old males and 18 to 24 year old females are the most vulnerable to poverty, with 67 males (14.1%) and 479 females (16.6%) in their respective age groups living below the poverty level.
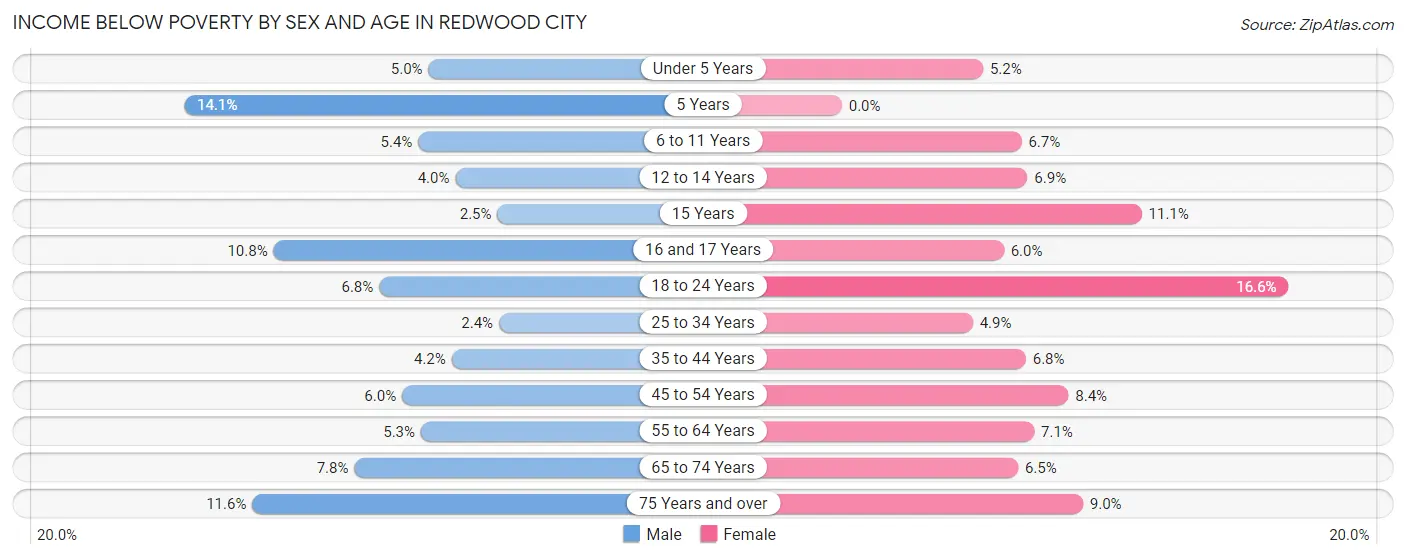
| Age Bracket | Male | Female |
| Under 5 Years | 101 (5.0%) | 125 (5.2%) |
| 5 Years | 67 (14.1%) | 0 (0.0%) |
| 6 to 11 Years | 170 (5.4%) | 193 (6.7%) |
| 12 to 14 Years | 71 (4.0%) | 107 (6.9%) |
| 15 Years | 13 (2.5%) | 64 (11.1%) |
| 16 and 17 Years | 132 (10.8%) | 47 (6.0%) |
| 18 to 24 Years | 200 (6.8%) | 479 (16.6%) |
| 25 to 34 Years | 179 (2.4%) | 327 (4.9%) |
| 35 to 44 Years | 249 (4.2%) | 469 (6.8%) |
| 45 to 54 Years | 355 (6.0%) | 459 (8.4%) |
| 55 to 64 Years | 236 (5.3%) | 354 (7.1%) |
| 65 to 74 Years | 239 (7.8%) | 215 (6.5%) |
| 75 Years and over | 201 (11.6%) | 231 (8.9%) |
| Total | 2,213 (5.4%) | 3,070 (7.4%) |
Income Above Poverty by Sex and Age in Redwood City
According to the poverty statistics in Redwood City, males aged 25 to 34 years and females aged 5 years are the age groups that are most secure financially, with 97.6% of males and 100.0% of females in these age groups living above the poverty line.
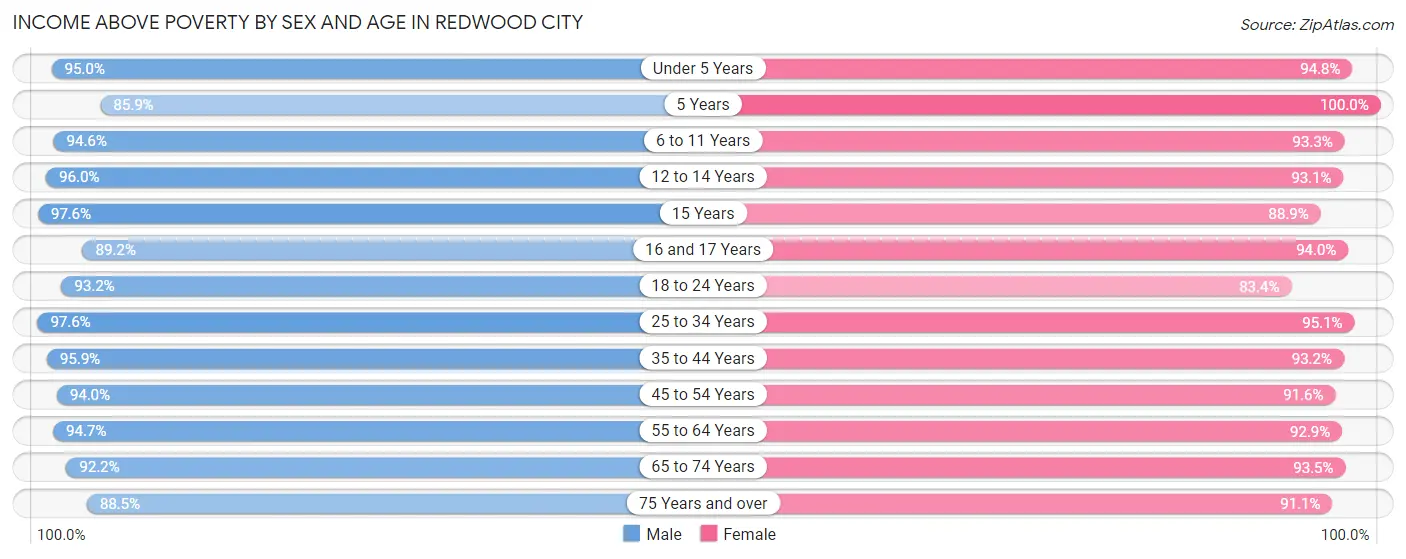
| Age Bracket | Male | Female |
| Under 5 Years | 1,915 (95.0%) | 2,260 (94.8%) |
| 5 Years | 409 (85.9%) | 446 (100.0%) |
| 6 to 11 Years | 2,986 (94.6%) | 2,699 (93.3%) |
| 12 to 14 Years | 1,701 (96.0%) | 1,447 (93.1%) |
| 15 Years | 518 (97.6%) | 511 (88.9%) |
| 16 and 17 Years | 1,095 (89.2%) | 735 (94.0%) |
| 18 to 24 Years | 2,723 (93.2%) | 2,410 (83.4%) |
| 25 to 34 Years | 7,313 (97.6%) | 6,406 (95.1%) |
| 35 to 44 Years | 5,745 (95.9%) | 6,394 (93.2%) |
| 45 to 54 Years | 5,574 (94.0%) | 5,000 (91.6%) |
| 55 to 64 Years | 4,227 (94.7%) | 4,605 (92.9%) |
| 65 to 74 Years | 2,839 (92.2%) | 3,071 (93.5%) |
| 75 Years and over | 1,540 (88.4%) | 2,350 (91.0%) |
| Total | 38,585 (94.6%) | 38,334 (92.6%) |
Income Below Poverty Among Married-Couple Families in Redwood City
The poverty statistics for married-couple families in Redwood City show that 1.7% or 273 of the total 16,066 families live below the poverty line. Families with 3 or 4 children have the highest poverty rate of 3.1%, comprising of 30 families. On the other hand, families with 5 or more children have the lowest poverty rate of 0.0%, which includes 0 families.
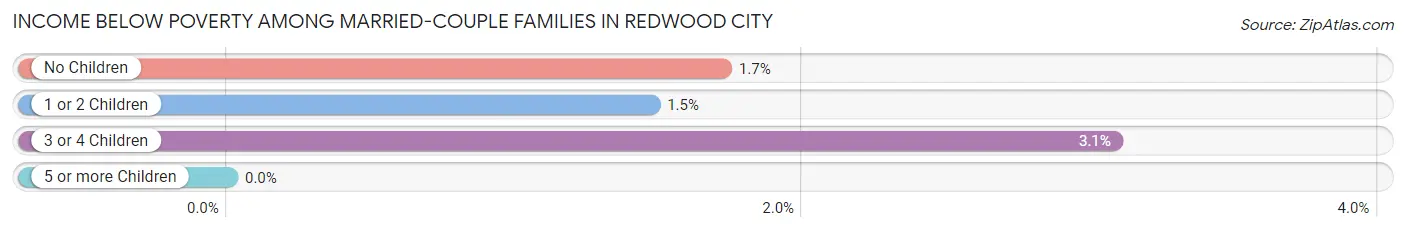
| Children | Above Poverty | Below Poverty |
| No Children | 8,399 (98.3%) | 147 (1.7%) |
| 1 or 2 Children | 6,438 (98.5%) | 96 (1.5%) |
| 3 or 4 Children | 944 (96.9%) | 30 (3.1%) |
| 5 or more Children | 12 (100.0%) | 0 (0.0%) |
| Total | 15,793 (98.3%) | 273 (1.7%) |
Income Below Poverty Among Single-Parent Households in Redwood City
According to the poverty data in Redwood City, 3.7% or 46 single-father households and 13.9% or 367 single-mother households are living below the poverty line. Among single-father households, those with 1 or 2 children have the highest poverty rate, with 46 households (8.3%) experiencing poverty. Likewise, among single-mother households, those with 5 or more children have the highest poverty rate, with 23 households (100.0%) falling below the poverty line.
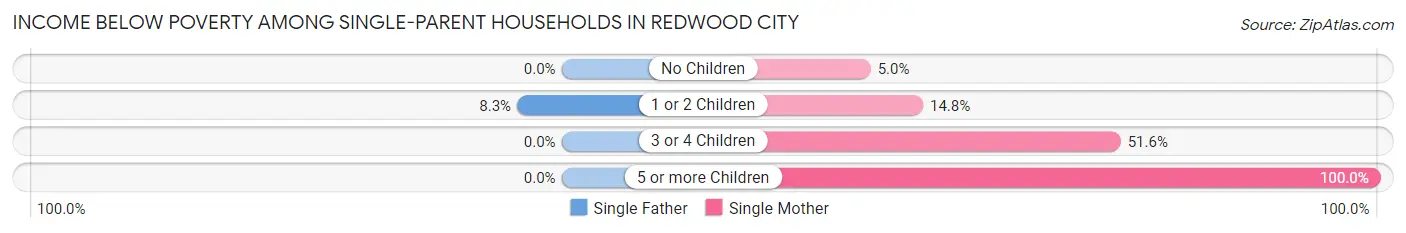
| Children | Single Father | Single Mother |
| No Children | 0 (0.0%) | 57 (5.0%) |
| 1 or 2 Children | 46 (8.3%) | 191 (14.8%) |
| 3 or 4 Children | 0 (0.0%) | 96 (51.6%) |
| 5 or more Children | 0 (0.0%) | 23 (100.0%) |
| Total | 46 (3.7%) | 367 (13.9%) |
Income Below Poverty Among Married-Couple vs Single-Parent Households in Redwood City
The poverty data for Redwood City shows that 273 of the married-couple family households (1.7%) and 413 of the single-parent households (10.6%) are living below the poverty level. Within the married-couple family households, those with 3 or 4 children have the highest poverty rate, with 30 households (3.1%) falling below the poverty line. Among the single-parent households, those with 5 or more children have the highest poverty rate, with 23 household (100.0%) living below poverty.
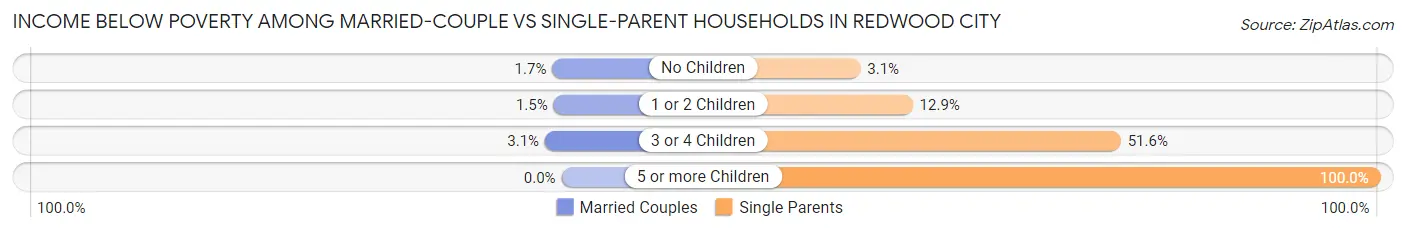
| Children | Married-Couple Families | Single-Parent Households |
| No Children | 147 (1.7%) | 57 (3.1%) |
| 1 or 2 Children | 96 (1.5%) | 237 (12.9%) |
| 3 or 4 Children | 30 (3.1%) | 96 (51.6%) |
| 5 or more Children | 0 (0.0%) | 23 (100.0%) |
| Total | 273 (1.7%) | 413 (10.6%) |
Race in Redwood City
The most populous races in Redwood City are White / Caucasian (39,103 | 47.1%), Hispanic or Latino (30,026 | 36.1%), and Some other Race (14,401 | 17.3%).
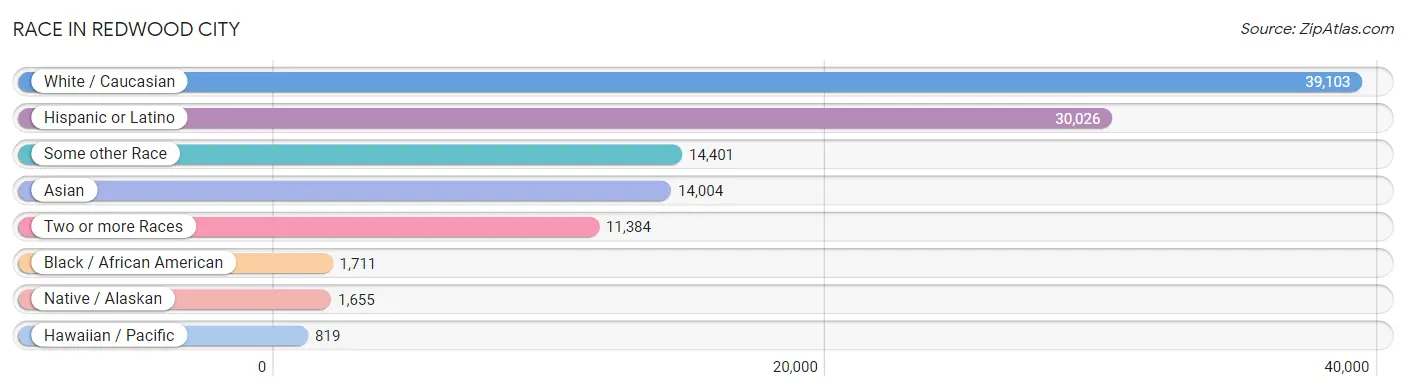
| Race | # Population | % Population |
| Asian | 14,004 | 16.9% |
| Black / African American | 1,711 | 2.1% |
| Hawaiian / Pacific | 819 | 1.0% |
| Hispanic or Latino | 30,026 | 36.1% |
| Native / Alaskan | 1,655 | 2.0% |
| White / Caucasian | 39,103 | 47.1% |
| Two or more Races | 11,384 | 13.7% |
| Some other Race | 14,401 | 17.3% |
| Total | 83,077 | 100.0% |
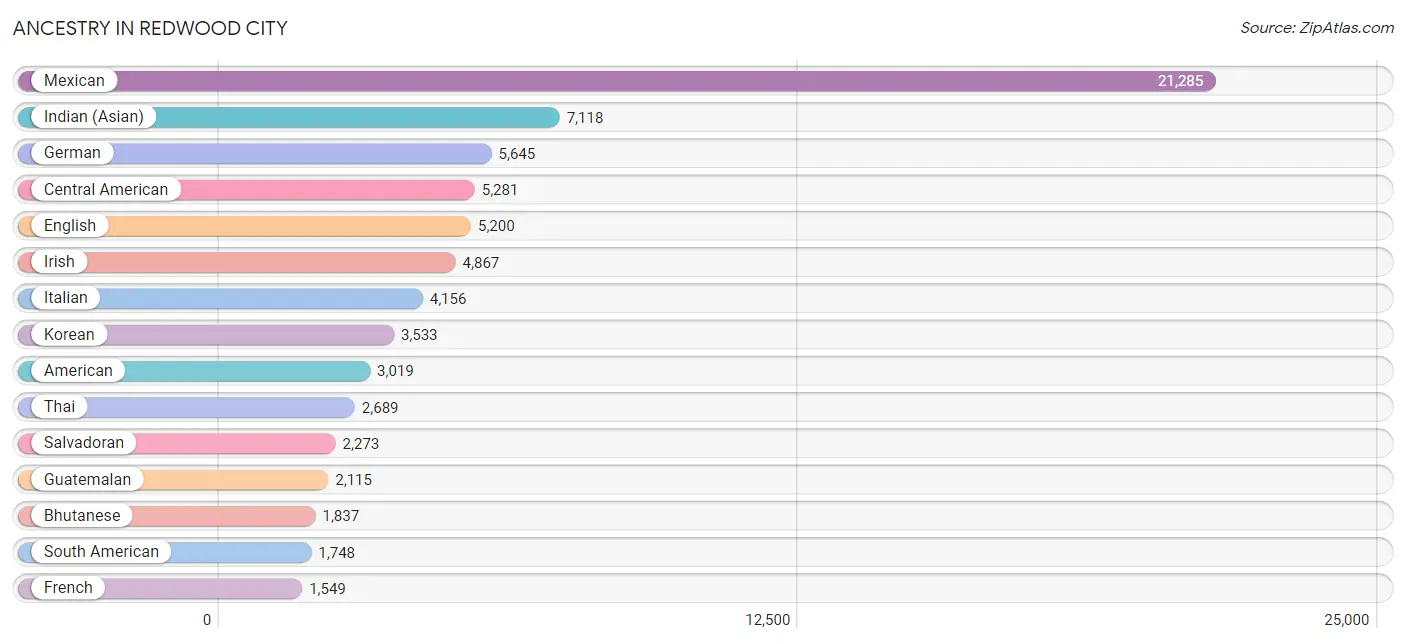
Ancestry in Redwood City
The most populous ancestries reported in Redwood City are Mexican (21,285 | 25.6%), Indian (Asian) (7,118 | 8.6%), German (5,645 | 6.8%), Central American (5,281 | 6.4%), and English (5,200 | 6.3%), together accounting for 53.6% of all Redwood City residents.
| Ancestry | # Population | % Population |
| Afghan | 32 | 0.0% |
| African | 52 | 0.1% |
| Albanian | 2 | 0.0% |
| American | 3,019 | 3.6% |
| Apache | 14 | 0.0% |
| Arab | 764 | 0.9% |
| Argentinean | 187 | 0.2% |
| Armenian | 308 | 0.4% |
| Assyrian / Chaldean / Syriac | 19 | 0.0% |
| Australian | 76 | 0.1% |
| Austrian | 239 | 0.3% |
| Bahamian | 11 | 0.0% |
| Bangladeshi | 15 | 0.0% |
| Barbadian | 17 | 0.0% |
| Basque | 26 | 0.0% |
| Belgian | 32 | 0.0% |
| Bhutanese | 1,837 | 2.2% |
| Blackfeet | 13 | 0.0% |
| Bolivian | 255 | 0.3% |
| Brazilian | 136 | 0.2% |
| British | 757 | 0.9% |
| British West Indian | 18 | 0.0% |
| Burmese | 1,276 | 1.5% |
| Cajun | 7 | 0.0% |
| Canadian | 296 | 0.4% |
| Carpatho Rusyn | 14 | 0.0% |
| Central American | 5,281 | 6.4% |
| Central American Indian | 795 | 1.0% |
| Cherokee | 103 | 0.1% |
| Chilean | 39 | 0.1% |
| Chippewa | 8 | 0.0% |
| Choctaw | 47 | 0.1% |
| Colombian | 484 | 0.6% |
| Colville | 8 | 0.0% |
| Comanche | 18 | 0.0% |
| Costa Rican | 26 | 0.0% |
| Creek | 36 | 0.0% |
| Croatian | 217 | 0.3% |
| Cuban | 146 | 0.2% |
| Czech | 224 | 0.3% |
| Czechoslovakian | 32 | 0.0% |
| Danish | 343 | 0.4% |
| Dominican | 24 | 0.0% |
| Dutch | 685 | 0.8% |
| Eastern European | 422 | 0.5% |
| Ecuadorian | 52 | 0.1% |
| Egyptian | 181 | 0.2% |
| English | 5,200 | 6.3% |
| Ethiopian | 39 | 0.1% |
| European | 1,366 | 1.6% |
| Filipino | 208 | 0.3% |
| Finnish | 174 | 0.2% |
| French | 1,549 | 1.9% |
| French American Indian | 16 | 0.0% |
| French Canadian | 196 | 0.2% |
| German | 5,645 | 6.8% |
| Ghanaian | 38 | 0.1% |
| Greek | 423 | 0.5% |
| Guamanian / Chamorro | 190 | 0.2% |
| Guatemalan | 2,115 | 2.5% |
| Haitian | 32 | 0.0% |
| Honduran | 28 | 0.0% |
| Houma | 3 | 0.0% |
| Hungarian | 192 | 0.2% |
| Indian (Asian) | 7,118 | 8.6% |
| Iranian | 491 | 0.6% |
| Iraqi | 35 | 0.0% |
| Irish | 4,867 | 5.9% |
| Israeli | 44 | 0.1% |
| Italian | 4,156 | 5.0% |
| Jamaican | 154 | 0.2% |
| Japanese | 86 | 0.1% |
| Jordanian | 43 | 0.1% |
| Korean | 3,533 | 4.3% |
| Laotian | 61 | 0.1% |
| Latvian | 49 | 0.1% |
| Lebanese | 258 | 0.3% |
| Lithuanian | 206 | 0.3% |
| Macedonian | 7 | 0.0% |
| Malaysian | 21 | 0.0% |
| Maltese | 185 | 0.2% |
| Mexican | 21,285 | 25.6% |
| Mexican American Indian | 1,129 | 1.4% |
| Mongolian | 64 | 0.1% |
| Moroccan | 14 | 0.0% |
| Native Hawaiian | 145 | 0.2% |
| Navajo | 84 | 0.1% |
| New Zealander | 20 | 0.0% |
| Nicaraguan | 807 | 1.0% |
| Nigerian | 141 | 0.2% |
| Northern European | 345 | 0.4% |
| Norwegian | 708 | 0.9% |
| Okinawan | 33 | 0.0% |
| Ottawa | 5 | 0.0% |
| Paiute | 25 | 0.0% |
| Pakistani | 42 | 0.1% |
| Palestinian | 108 | 0.1% |
| Pennsylvania German | 17 | 0.0% |
| Peruvian | 661 | 0.8% |
| Polish | 1,176 | 1.4% |
| Portuguese | 594 | 0.7% |
| Pueblo | 17 | 0.0% |
| Puerto Rican | 477 | 0.6% |
| Romanian | 213 | 0.3% |
| Russian | 1,258 | 1.5% |
| Salvadoran | 2,273 | 2.7% |
| Samoan | 336 | 0.4% |
| Scandinavian | 165 | 0.2% |
| Scotch-Irish | 263 | 0.3% |
| Scottish | 1,274 | 1.5% |
| Serbian | 84 | 0.1% |
| Sioux | 94 | 0.1% |
| Slovak | 130 | 0.2% |
| Slovene | 53 | 0.1% |
| South American | 1,748 | 2.1% |
| Spaniard | 459 | 0.5% |
| Spanish | 95 | 0.1% |
| Sri Lankan | 450 | 0.5% |
| Subsaharan African | 279 | 0.3% |
| Swedish | 759 | 0.9% |
| Swiss | 190 | 0.2% |
| Syrian | 18 | 0.0% |
| Thai | 2,689 | 3.2% |
| Tlingit-Haida | 43 | 0.1% |
| Tohono O'Odham | 5 | 0.0% |
| Tongan | 220 | 0.3% |
| Trinidadian and Tobagonian | 22 | 0.0% |
| Turkish | 178 | 0.2% |
| Ukrainian | 513 | 0.6% |
| Venezuelan | 70 | 0.1% |
| Welsh | 313 | 0.4% |
| West Indian | 149 | 0.2% |
| Yaqui | 83 | 0.1% |
| Yugoslavian | 38 | 0.1% | View All 134 Rows |
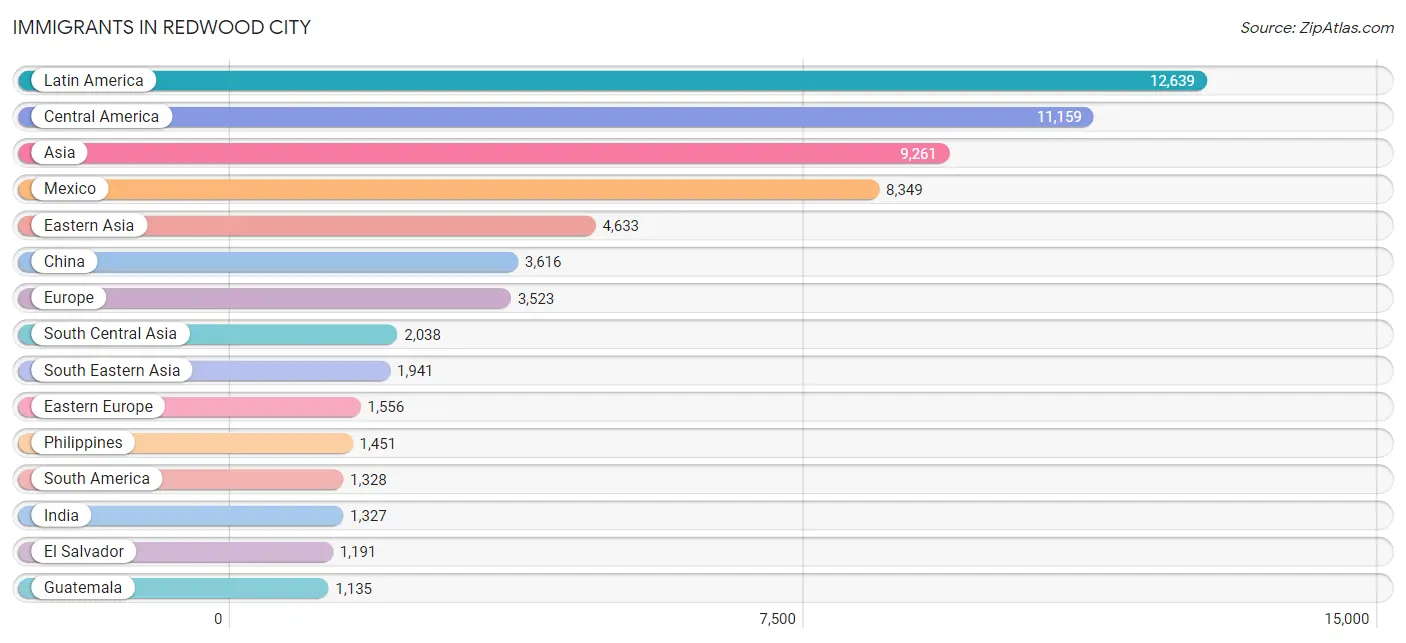
Immigrants in Redwood City
The most numerous immigrant groups reported in Redwood City came from Latin America (12,639 | 15.2%), Central America (11,159 | 13.4%), Asia (9,261 | 11.2%), Mexico (8,349 | 10.1%), and Eastern Asia (4,633 | 5.6%), together accounting for 55.4% of all Redwood City residents.
| Immigration Origin | # Population | % Population |
| Afghanistan | 47 | 0.1% |
| Africa | 366 | 0.4% |
| Albania | 2 | 0.0% |
| Argentina | 107 | 0.1% |
| Asia | 9,261 | 11.2% |
| Australia | 68 | 0.1% |
| Austria | 25 | 0.0% |
| Bahamas | 11 | 0.0% |
| Bangladesh | 53 | 0.1% |
| Barbados | 17 | 0.0% |
| Belarus | 12 | 0.0% |
| Belgium | 34 | 0.0% |
| Bolivia | 109 | 0.1% |
| Bosnia and Herzegovina | 17 | 0.0% |
| Brazil | 259 | 0.3% |
| Bulgaria | 43 | 0.1% |
| Cambodia | 25 | 0.0% |
| Canada | 494 | 0.6% |
| Caribbean | 152 | 0.2% |
| Central America | 11,159 | 13.4% |
| Chile | 15 | 0.0% |
| China | 3,616 | 4.3% |
| Colombia | 171 | 0.2% |
| Costa Rica | 80 | 0.1% |
| Croatia | 9 | 0.0% |
| Cuba | 34 | 0.0% |
| Czechoslovakia | 23 | 0.0% |
| Denmark | 26 | 0.0% |
| Dominican Republic | 24 | 0.0% |
| Eastern Africa | 103 | 0.1% |
| Eastern Asia | 4,633 | 5.6% |
| Eastern Europe | 1,556 | 1.9% |
| Ecuador | 126 | 0.2% |
| Egypt | 99 | 0.1% |
| El Salvador | 1,191 | 1.4% |
| England | 227 | 0.3% |
| Ethiopia | 48 | 0.1% |
| Europe | 3,523 | 4.2% |
| Fiji | 85 | 0.1% |
| France | 216 | 0.3% |
| Germany | 348 | 0.4% |
| Greece | 72 | 0.1% |
| Guatemala | 1,135 | 1.4% |
| Hong Kong | 384 | 0.5% |
| Hungary | 56 | 0.1% |
| India | 1,327 | 1.6% |
| Indonesia | 15 | 0.0% |
| Iran | 485 | 0.6% |
| Ireland | 19 | 0.0% |
| Israel | 88 | 0.1% |
| Italy | 308 | 0.4% |
| Jamaica | 34 | 0.0% |
| Japan | 457 | 0.5% |
| Jordan | 74 | 0.1% |
| Kazakhstan | 33 | 0.0% |
| Kenya | 11 | 0.0% |
| Korea | 560 | 0.7% |
| Kuwait | 7 | 0.0% |
| Laos | 10 | 0.0% |
| Latin America | 12,639 | 15.2% |
| Latvia | 9 | 0.0% |
| Lebanon | 71 | 0.1% |
| Liberia | 17 | 0.0% |
| Malaysia | 88 | 0.1% |
| Mexico | 8,349 | 10.1% |
| Moldova | 10 | 0.0% |
| Morocco | 22 | 0.0% |
| Netherlands | 83 | 0.1% |
| Nicaragua | 404 | 0.5% |
| Nigeria | 7 | 0.0% |
| Northern Africa | 152 | 0.2% |
| Northern Europe | 686 | 0.8% |
| Oceania | 401 | 0.5% |
| Pakistan | 66 | 0.1% |
| Peru | 494 | 0.6% |
| Philippines | 1,451 | 1.8% |
| Poland | 133 | 0.2% |
| Portugal | 25 | 0.0% |
| Romania | 131 | 0.2% |
| Russia | 397 | 0.5% |
| Saudi Arabia | 43 | 0.1% |
| Serbia | 68 | 0.1% |
| Singapore | 124 | 0.2% |
| South Africa | 87 | 0.1% |
| South America | 1,328 | 1.6% |
| South Central Asia | 2,038 | 2.5% |
| South Eastern Asia | 1,941 | 2.3% |
| Southern Europe | 504 | 0.6% |
| Spain | 75 | 0.1% |
| Sri Lanka | 27 | 0.0% |
| Sweden | 65 | 0.1% |
| Switzerland | 62 | 0.1% |
| Syria | 29 | 0.0% |
| Taiwan | 430 | 0.5% |
| Thailand | 63 | 0.1% |
| Trinidad and Tobago | 32 | 0.0% |
| Turkey | 176 | 0.2% |
| Ukraine | 371 | 0.4% |
| Venezuela | 47 | 0.1% |
| Vietnam | 152 | 0.2% |
| Western Africa | 24 | 0.0% |
| Western Asia | 610 | 0.7% |
| Western Europe | 768 | 0.9% | View All 103 Rows |
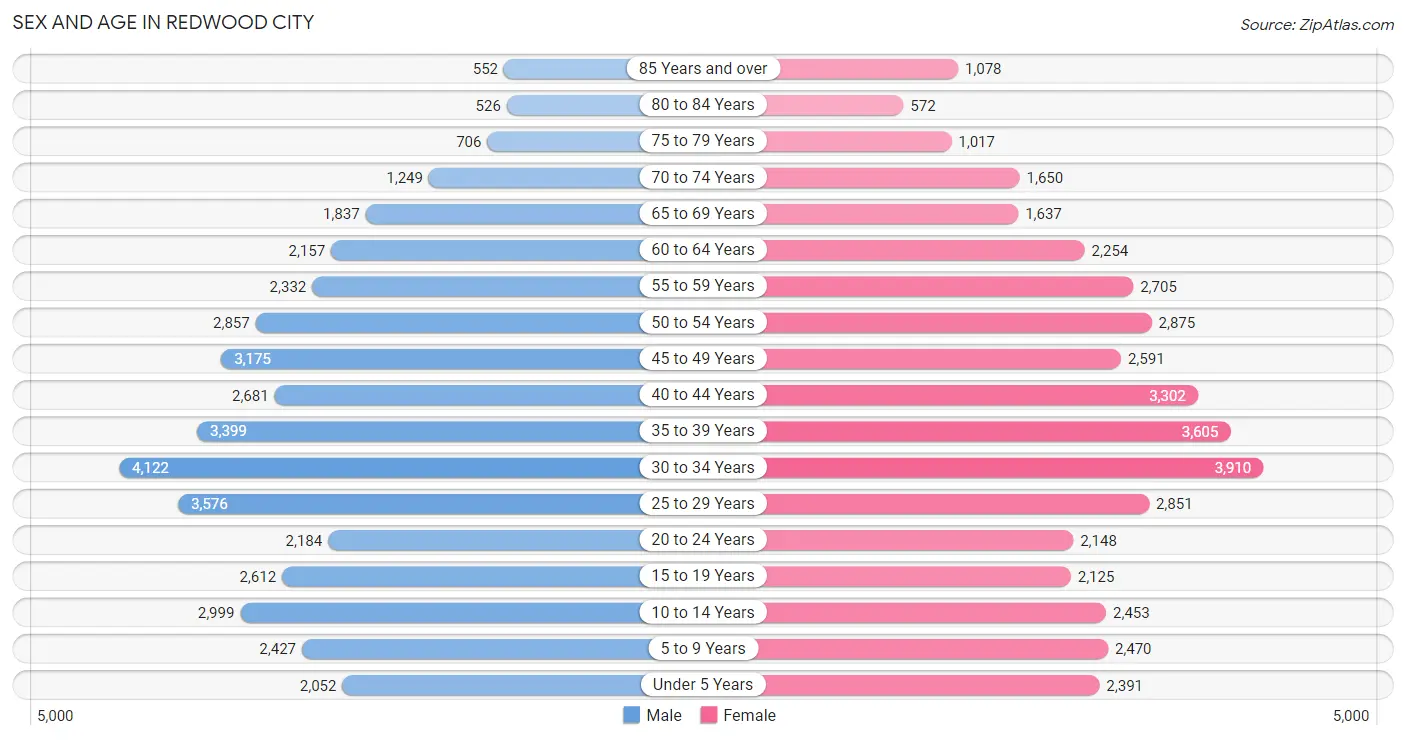
Sex and Age in Redwood City
Sex and Age in Redwood City
The most populous age groups in Redwood City are 30 to 34 Years (4,122 | 10.0%) for men and 30 to 34 Years (3,910 | 9.4%) for women.
| Age Bracket | Male | Female |
| Under 5 Years | 2,052 (5.0%) | 2,391 (5.7%) |
| 5 to 9 Years | 2,427 (5.9%) | 2,470 (5.9%) |
| 10 to 14 Years | 2,999 (7.2%) | 2,453 (5.9%) |
| 15 to 19 Years | 2,612 (6.3%) | 2,125 (5.1%) |
| 20 to 24 Years | 2,184 (5.3%) | 2,148 (5.2%) |
| 25 to 29 Years | 3,576 (8.6%) | 2,851 (6.9%) |
| 30 to 34 Years | 4,122 (10.0%) | 3,910 (9.4%) |
| 35 to 39 Years | 3,399 (8.2%) | 3,605 (8.7%) |
| 40 to 44 Years | 2,681 (6.5%) | 3,302 (7.9%) |
| 45 to 49 Years | 3,175 (7.7%) | 2,591 (6.2%) |
| 50 to 54 Years | 2,857 (6.9%) | 2,875 (6.9%) |
| 55 to 59 Years | 2,332 (5.6%) | 2,705 (6.5%) |
| 60 to 64 Years | 2,157 (5.2%) | 2,254 (5.4%) |
| 65 to 69 Years | 1,837 (4.4%) | 1,637 (3.9%) |
| 70 to 74 Years | 1,249 (3.0%) | 1,650 (4.0%) |
| 75 to 79 Years | 706 (1.7%) | 1,017 (2.4%) |
| 80 to 84 Years | 526 (1.3%) | 572 (1.4%) |
| 85 Years and over | 552 (1.3%) | 1,078 (2.6%) |
| Total | 41,443 (100.0%) | 41,634 (100.0%) |
Families and Households in Redwood City
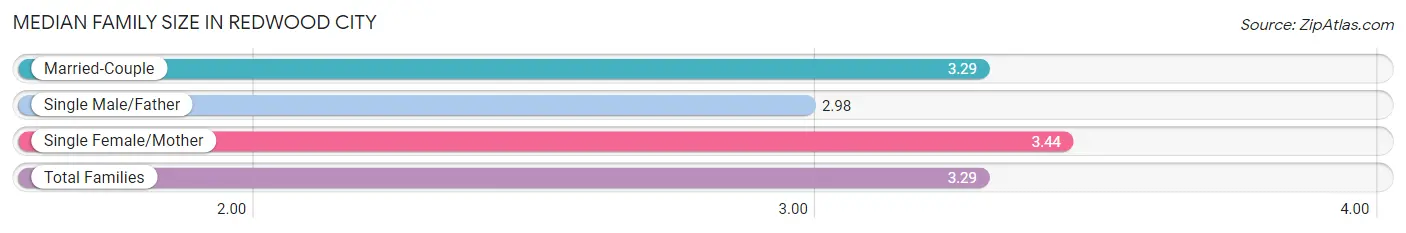
Median Family Size in Redwood City
The median family size in Redwood City is 3.29 persons per family, with single female/mother families (2,632 | 13.2%) accounting for the largest median family size of 3.44 persons per family. On the other hand, single male/father families (1,255 | 6.3%) represent the smallest median family size with 2.98 persons per family.
| Family Type | # Families | Family Size |
| Married-Couple | 16,066 (80.5%) | 3.29 |
| Single Male/Father | 1,255 (6.3%) | 2.98 |
| Single Female/Mother | 2,632 (13.2%) | 3.44 |
| Total Families | 19,953 (100.0%) | 3.29 |
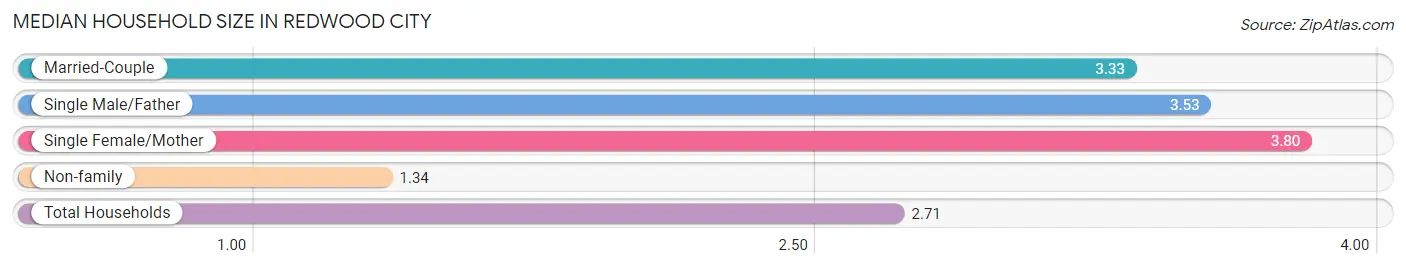
Median Household Size in Redwood City
The median household size in Redwood City is 2.71 persons per household, with single female/mother households (2,632 | 8.8%) accounting for the largest median household size of 3.8 persons per household. non-family households (10,040 | 33.5%) represent the smallest median household size with 1.34 persons per household.
| Household Type | # Households | Household Size |
| Married-Couple | 16,066 (53.6%) | 3.33 |
| Single Male/Father | 1,255 (4.2%) | 3.53 |
| Single Female/Mother | 2,632 (8.8%) | 3.80 |
| Non-family | 10,040 (33.5%) | 1.34 |
| Total Households | 29,993 (100.0%) | 2.71 |
Household Size by Marriage Status in Redwood City
Out of a total of 29,993 households in Redwood City, 19,953 (66.5%) are family households, while 10,040 (33.5%) are nonfamily households. The most numerous type of family households are 2-person households, comprising 7,847, and the most common type of nonfamily households are 1-person households, comprising 7,355.
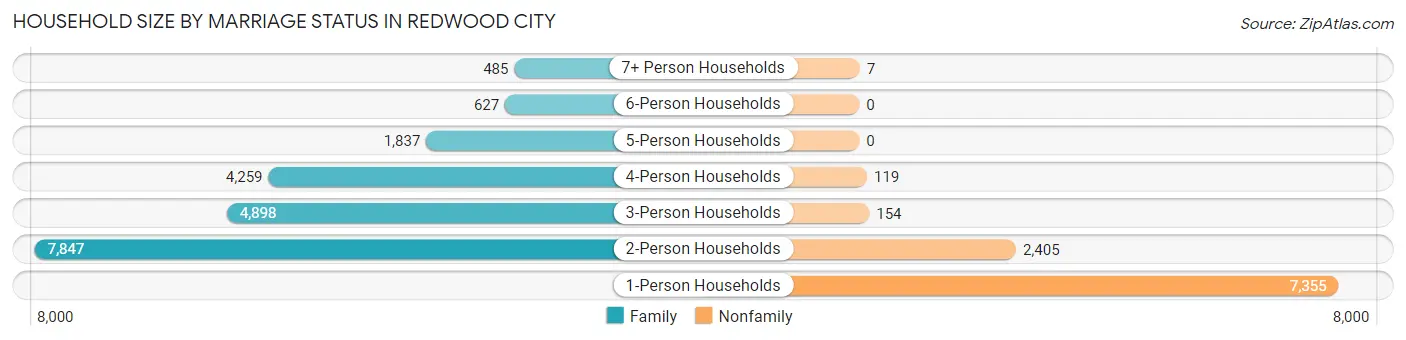
| Household Size | Family Households | Nonfamily Households |
| 1-Person Households | - | 7,355 (24.5%) |
| 2-Person Households | 7,847 (26.2%) | 2,405 (8.0%) |
| 3-Person Households | 4,898 (16.3%) | 154 (0.5%) |
| 4-Person Households | 4,259 (14.2%) | 119 (0.4%) |
| 5-Person Households | 1,837 (6.1%) | 0 (0.0%) |
| 6-Person Households | 627 (2.1%) | 0 (0.0%) |
| 7+ Person Households | 485 (1.6%) | 7 (0.0%) |
| Total | 19,953 (66.5%) | 10,040 (33.5%) |
Female Fertility in Redwood City
Fertility by Age in Redwood City
Average fertility rate in Redwood City is 54.0 births per 1,000 women. Women in the age bracket of 20 to 34 years have the highest fertility rate with 65.0 births per 1,000 women. Women in the age bracket of 20 to 34 years acount for 51.2% of all women with births.
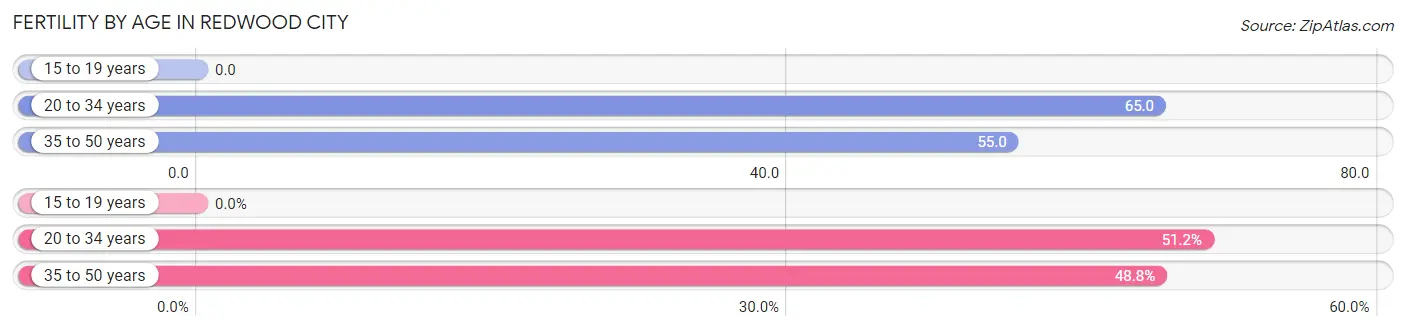
| Age Bracket | Women with Births | Births / 1,000 Women |
| 15 to 19 years | 0 (0.0%) | 0.0 |
| 20 to 34 years | 582 (51.2%) | 65.0 |
| 35 to 50 years | 555 (48.8%) | 55.0 |
| Total | 1,137 (100.0%) | 54.0 |
Fertility by Age by Marriage Status in Redwood City
93.8% of women with births (1,137) in Redwood City are married. The highest percentage of unmarried women with births falls into 35 to 50 years age bracket with 8.1% of them unmarried at the time of birth, while the lowest percentage of unmarried women with births belong to 20 to 34 years age bracket with 4.3% of them unmarried.
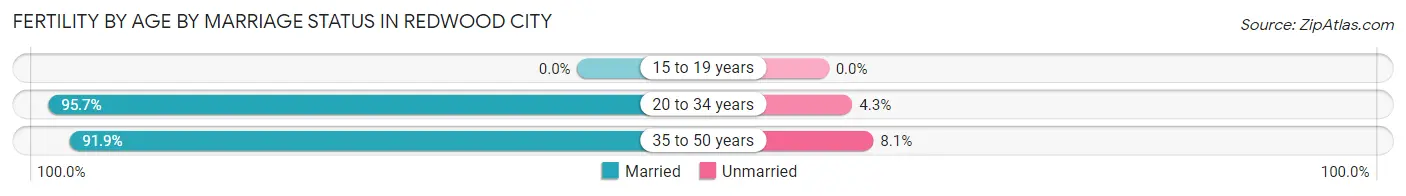
| Age Bracket | Married | Unmarried |
| 15 to 19 years | 0 (0.0%) | 0 (0.0%) |
| 20 to 34 years | 557 (95.7%) | 25 (4.3%) |
| 35 to 50 years | 510 (91.9%) | 45 (8.1%) |
| Total | 1,067 (93.8%) | 70 (6.2%) |
Fertility by Education in Redwood City
Average fertility rate in Redwood City is 54.0 births per 1,000 women. Women with the education attainment of high school diploma have the highest fertility rate of 87.0 births per 1,000 women, while women with the education attainment of less than high school have the lowest fertility at 10.0 births per 1,000 women. Women with the education attainment of graduate degree represent 37.7% of all women with births.
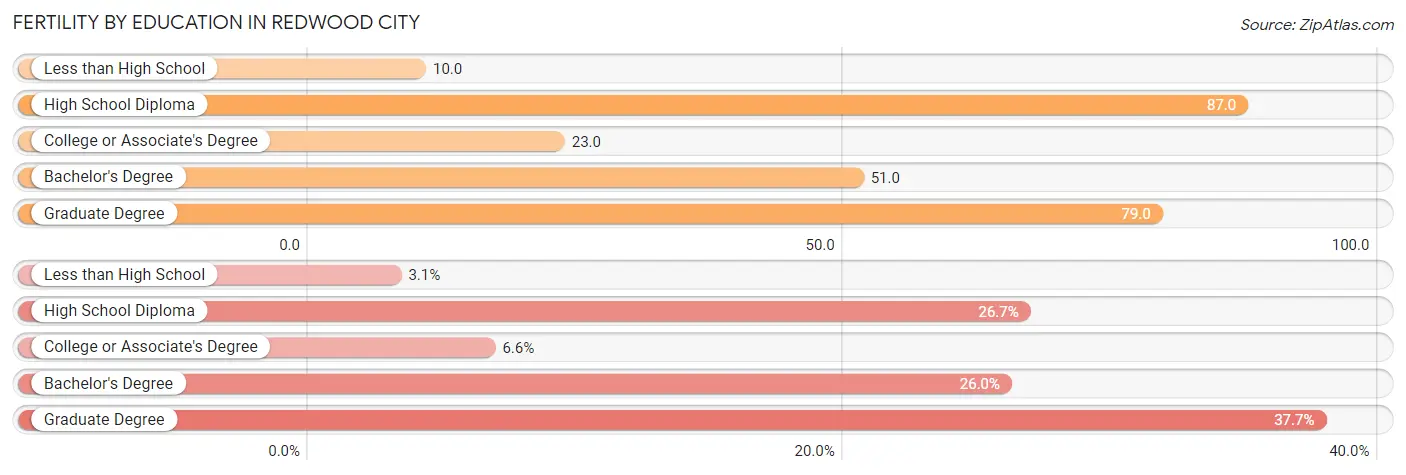
| Educational Attainment | Women with Births | Births / 1,000 Women |
| Less than High School | 35 (3.1%) | 10.0 |
| High School Diploma | 303 (26.7%) | 87.0 |
| College or Associate's Degree | 75 (6.6%) | 23.0 |
| Bachelor's Degree | 295 (26.0%) | 51.0 |
| Graduate Degree | 429 (37.7%) | 79.0 |
| Total | 1,137 (100.0%) | 54.0 |
Fertility by Education by Marriage Status in Redwood City
6.2% of women with births in Redwood City are unmarried. Women with the educational attainment of bachelor's degree are most likely to be married with 97.3% of them married at childbirth, while women with the educational attainment of college or associate's degree are least likely to be married with 38.7% of them unmarried at childbirth.
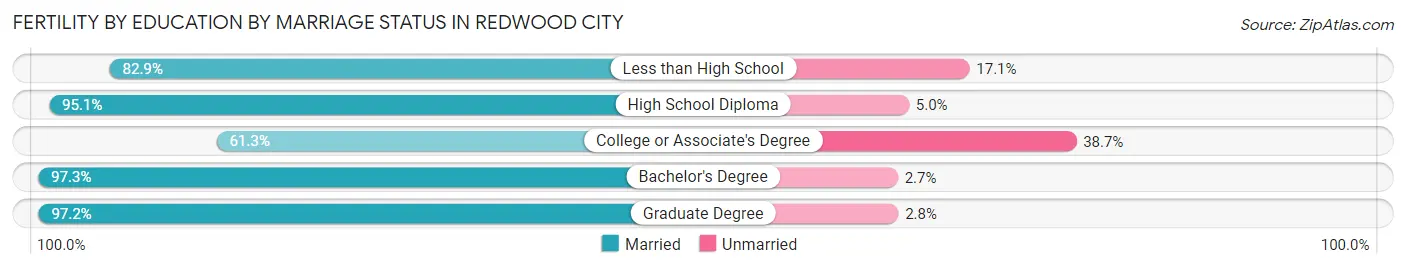
| Educational Attainment | Married | Unmarried |
| Less than High School | 29 (82.9%) | 6 (17.1%) |
| High School Diploma | 288 (95.1%) | 15 (5.0%) |
| College or Associate's Degree | 46 (61.3%) | 29 (38.7%) |
| Bachelor's Degree | 287 (97.3%) | 8 (2.7%) |
| Graduate Degree | 417 (97.2%) | 12 (2.8%) |
| Total | 1,067 (93.8%) | 70 (6.2%) |
Employment Characteristics in Redwood City
Employment by Class of Employer in Redwood City
Among the 44,285 employed individuals in Redwood City, private company employees (31,438 | 71.0%), not-for-profit organizations (4,364 | 9.9%), and local government employees (2,920 | 6.6%) make up the most common classes of employment.
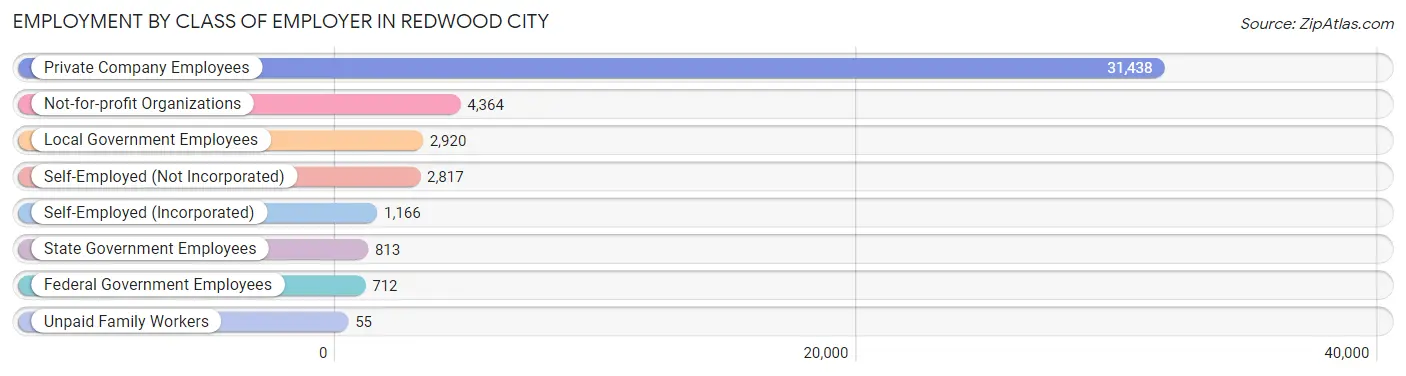
| Employer Class | # Employees | % Employees |
| Private Company Employees | 31,438 | 71.0% |
| Self-Employed (Incorporated) | 1,166 | 2.6% |
| Self-Employed (Not Incorporated) | 2,817 | 6.4% |
| Not-for-profit Organizations | 4,364 | 9.9% |
| Local Government Employees | 2,920 | 6.6% |
| State Government Employees | 813 | 1.8% |
| Federal Government Employees | 712 | 1.6% |
| Unpaid Family Workers | 55 | 0.1% |
| Total | 44,285 | 100.0% |
Employment Status by Age in Redwood City
According to the labor force statistics for Redwood City, out of the total population over 16 years of age (67,179), 70.0% or 47,025 individuals are in the labor force, with 3.9% or 1,834 of them unemployed. The age group with the highest labor force participation rate is 30 to 34 years, with 87.3% or 7,012 individuals in the labor force. Within the labor force, the 16 to 19 years age range has the highest percentage of unemployed individuals, with 14.6% or 155 of them being unemployed.
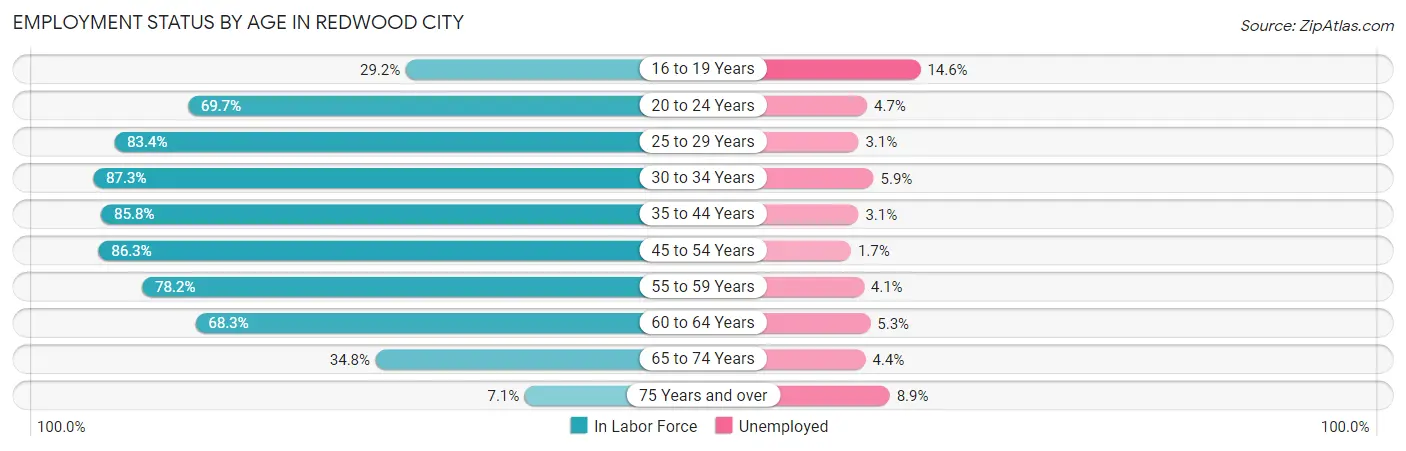
| Age Bracket | In Labor Force | Unemployed |
| 16 to 19 Years | 1,060 (29.2%) | 155 (14.6%) |
| 20 to 24 Years | 3,019 (69.7%) | 142 (4.7%) |
| 25 to 29 Years | 5,360 (83.4%) | 166 (3.1%) |
| 30 to 34 Years | 7,012 (87.3%) | 414 (5.9%) |
| 35 to 44 Years | 11,143 (85.8%) | 345 (3.1%) |
| 45 to 54 Years | 9,923 (86.3%) | 169 (1.7%) |
| 55 to 59 Years | 3,939 (78.2%) | 161 (4.1%) |
| 60 to 64 Years | 3,013 (68.3%) | 160 (5.3%) |
| 65 to 74 Years | 2,218 (34.8%) | 98 (4.4%) |
| 75 Years and over | 316 (7.1%) | 28 (8.9%) |
| Total | 47,025 (70.0%) | 1,834 (3.9%) |
Employment Status by Educational Attainment in Redwood City
According to labor force statistics for Redwood City, 83.5% of individuals (40,407) out of the total population between 25 and 64 years of age (48,392) are in the labor force, with 3.5% or 1,414 of them being unemployed. The group with the highest labor force participation rate are those with the educational attainment of bachelor's degree or higher, with 88.3% or 24,337 individuals in the labor force. Within the labor force, individuals with high school diploma education have the highest percentage of unemployment, with 5.4% or 312 of them being unemployed.
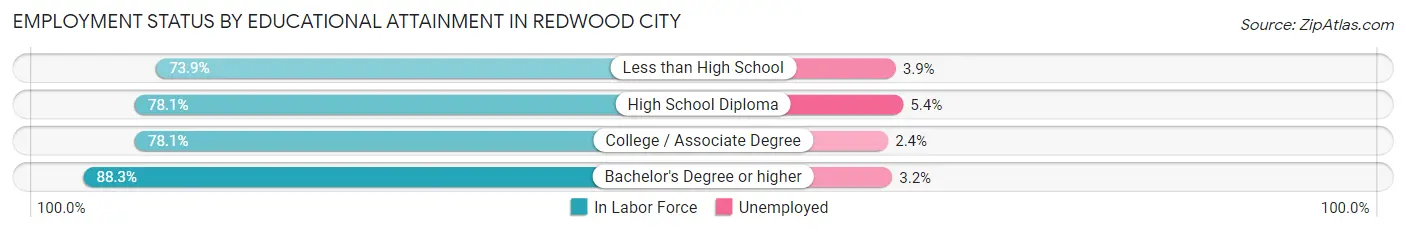
| Educational Attainment | In Labor Force | Unemployed |
| Less than High School | 3,926 (73.9%) | 207 (3.9%) |
| High School Diploma | 5,783 (78.1%) | 400 (5.4%) |
| College / Associate Degree | 6,335 (78.1%) | 195 (2.4%) |
| Bachelor's Degree or higher | 24,337 (88.3%) | 882 (3.2%) |
| Total | 40,407 (83.5%) | 1,694 (3.5%) |
Employment Occupations by Sex in Redwood City
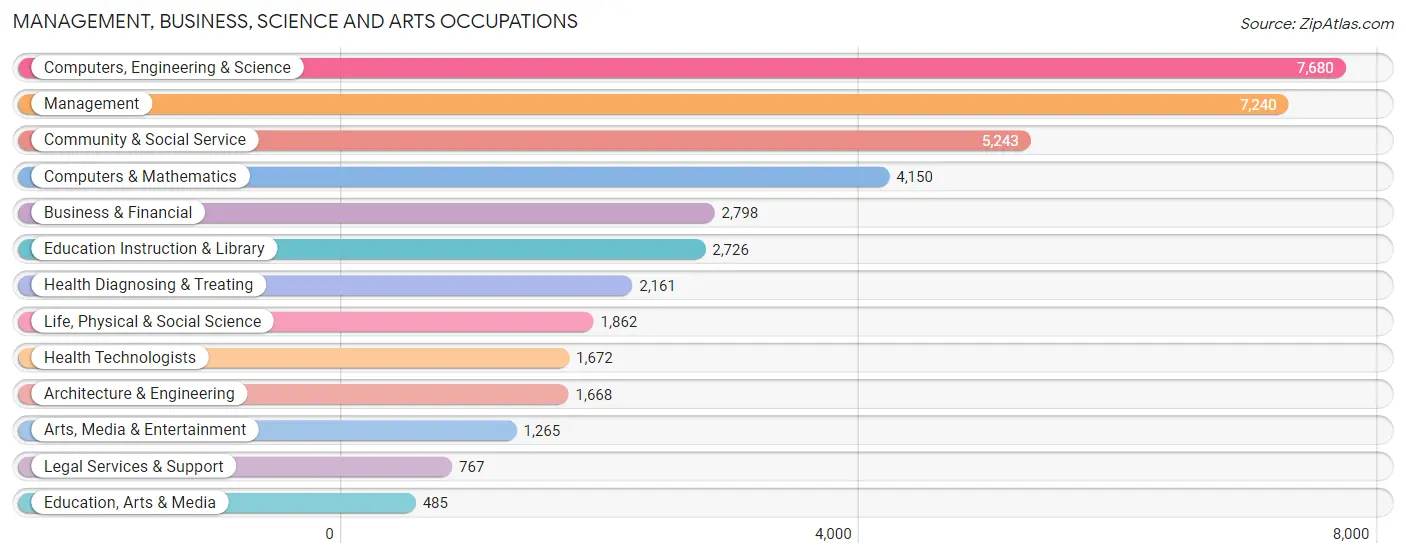
Management, Business, Science and Arts Occupations
The most common Management, Business, Science and Arts occupations in Redwood City are Computers, Engineering & Science (7,680 | 17.0%), Management (7,240 | 16.1%), Community & Social Service (5,243 | 11.6%), Computers & Mathematics (4,150 | 9.2%), and Business & Financial (2,798 | 6.2%).
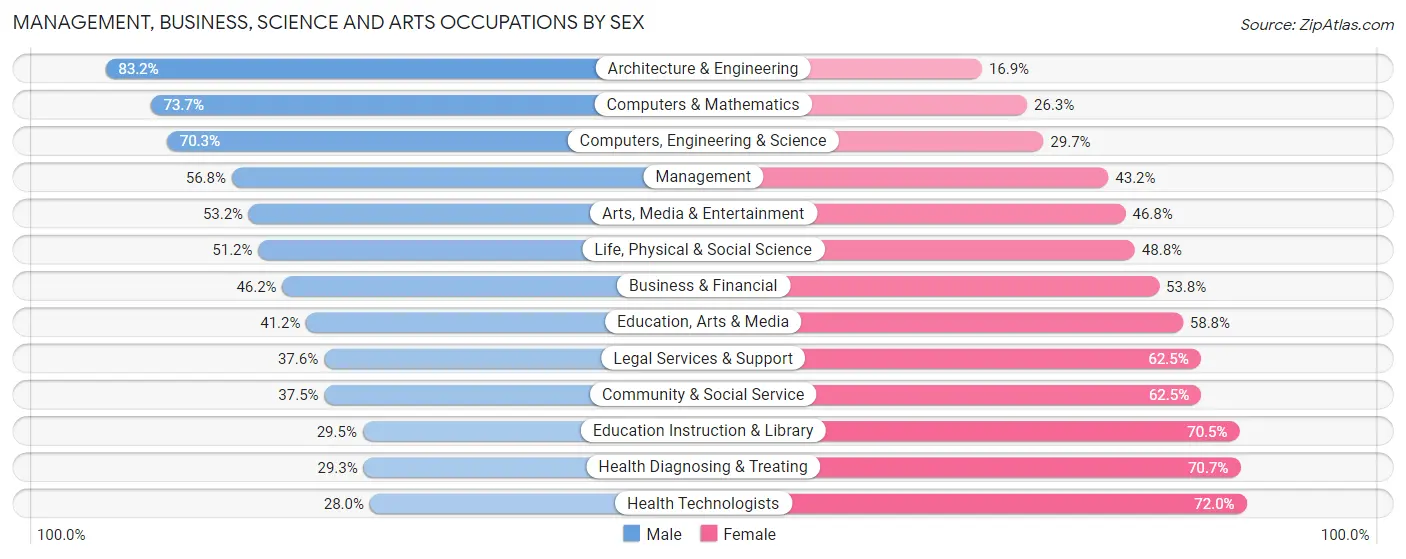
Management, Business, Science and Arts Occupations by Sex
Within the Management, Business, Science and Arts occupations in Redwood City, the most male-oriented occupations are Architecture & Engineering (83.2%), Computers & Mathematics (73.7%), and Computers, Engineering & Science (70.3%), while the most female-oriented occupations are Health Technologists (72.0%), Health Diagnosing & Treating (70.7%), and Education Instruction & Library (70.5%).
| Occupation | Male | Female |
| Management | 4,111 (56.8%) | 3,129 (43.2%) |
| Business & Financial | 1,293 (46.2%) | 1,505 (53.8%) |
| Computers, Engineering & Science | 5,401 (70.3%) | 2,279 (29.7%) |
| Computers & Mathematics | 3,060 (73.7%) | 1,090 (26.3%) |
| Architecture & Engineering | 1,387 (83.2%) | 281 (16.9%) |
| Life, Physical & Social Science | 954 (51.2%) | 908 (48.8%) |
| Community & Social Service | 1,964 (37.5%) | 3,279 (62.5%) |
| Education, Arts & Media | 200 (41.2%) | 285 (58.8%) |
| Legal Services & Support | 288 (37.6%) | 479 (62.5%) |
| Education Instruction & Library | 803 (29.5%) | 1,923 (70.5%) |
| Arts, Media & Entertainment | 673 (53.2%) | 592 (46.8%) |
| Health Diagnosing & Treating | 633 (29.3%) | 1,528 (70.7%) |
| Health Technologists | 468 (28.0%) | 1,204 (72.0%) |
| Total (Category) | 13,402 (53.3%) | 11,720 (46.7%) |
| Total (Overall) | 24,494 (54.3%) | 20,626 (45.7%) |
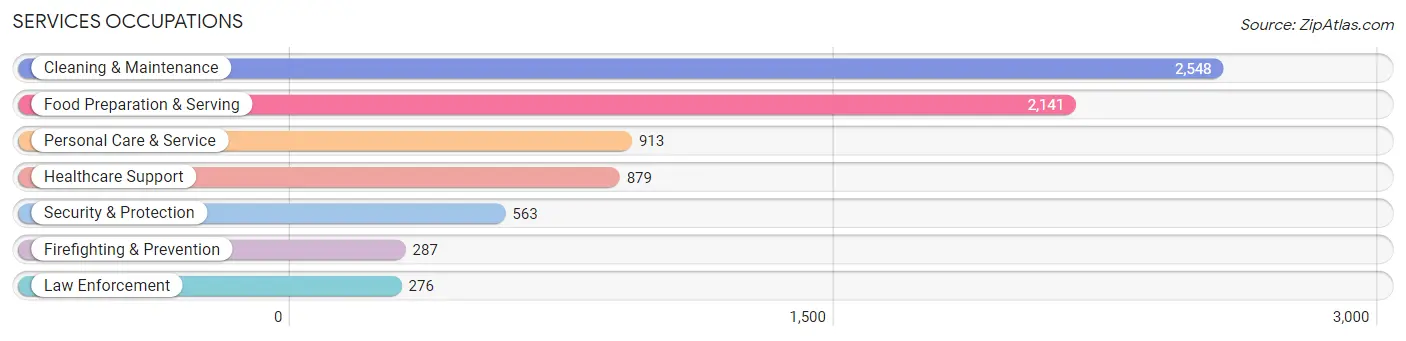
Services Occupations
The most common Services occupations in Redwood City are Cleaning & Maintenance (2,548 | 5.7%), Food Preparation & Serving (2,141 | 4.8%), Personal Care & Service (913 | 2.0%), Healthcare Support (879 | 1.9%), and Security & Protection (563 | 1.3%).
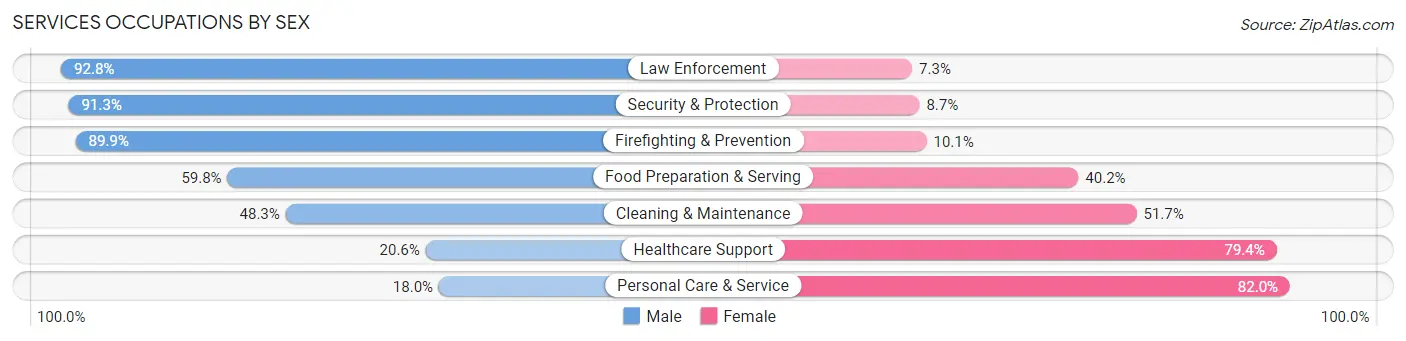
Services Occupations by Sex
Within the Services occupations in Redwood City, the most male-oriented occupations are Law Enforcement (92.7%), Security & Protection (91.3%), and Firefighting & Prevention (89.9%), while the most female-oriented occupations are Personal Care & Service (82.0%), Healthcare Support (79.4%), and Cleaning & Maintenance (51.7%).
| Occupation | Male | Female |
| Healthcare Support | 181 (20.6%) | 698 (79.4%) |
| Security & Protection | 514 (91.3%) | 49 (8.7%) |
| Firefighting & Prevention | 258 (89.9%) | 29 (10.1%) |
| Law Enforcement | 256 (92.7%) | 20 (7.2%) |
| Food Preparation & Serving | 1,281 (59.8%) | 860 (40.2%) |
| Cleaning & Maintenance | 1,231 (48.3%) | 1,317 (51.7%) |
| Personal Care & Service | 164 (18.0%) | 749 (82.0%) |
| Total (Category) | 3,371 (47.9%) | 3,673 (52.1%) |
| Total (Overall) | 24,494 (54.3%) | 20,626 (45.7%) |
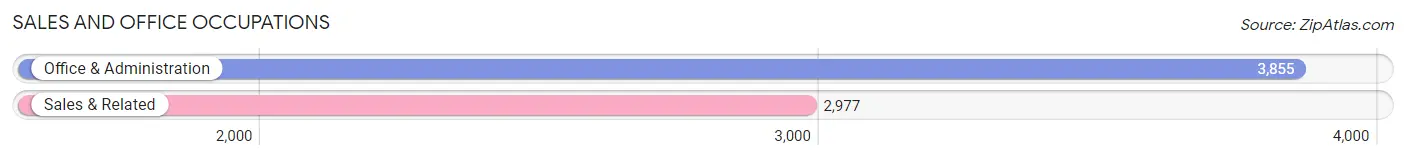
Sales and Office Occupations
The most common Sales and Office occupations in Redwood City are Office & Administration (3,855 | 8.5%), and Sales & Related (2,977 | 6.6%).
Sales and Office Occupations by Sex
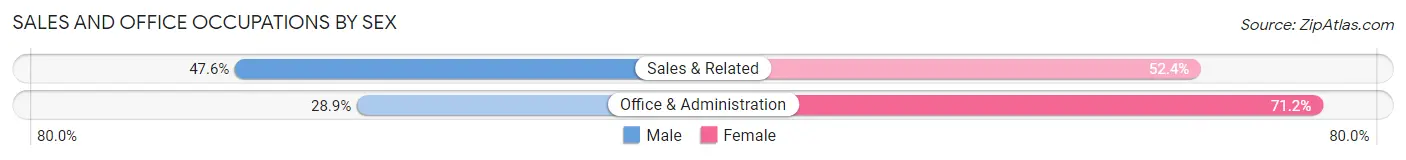
| Occupation | Male | Female |
| Sales & Related | 1,417 (47.6%) | 1,560 (52.4%) |
| Office & Administration | 1,112 (28.8%) | 2,743 (71.2%) |
| Total (Category) | 2,529 (37.0%) | 4,303 (63.0%) |
| Total (Overall) | 24,494 (54.3%) | 20,626 (45.7%) |
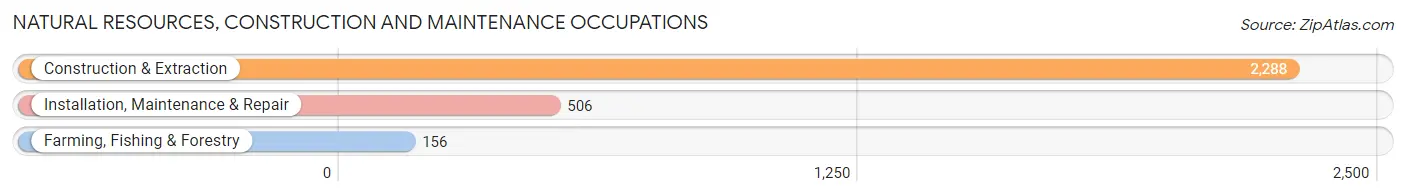
Natural Resources, Construction and Maintenance Occupations
The most common Natural Resources, Construction and Maintenance occupations in Redwood City are Construction & Extraction (2,288 | 5.1%), Installation, Maintenance & Repair (506 | 1.1%), and Farming, Fishing & Forestry (156 | 0.4%).
Natural Resources, Construction and Maintenance Occupations by Sex
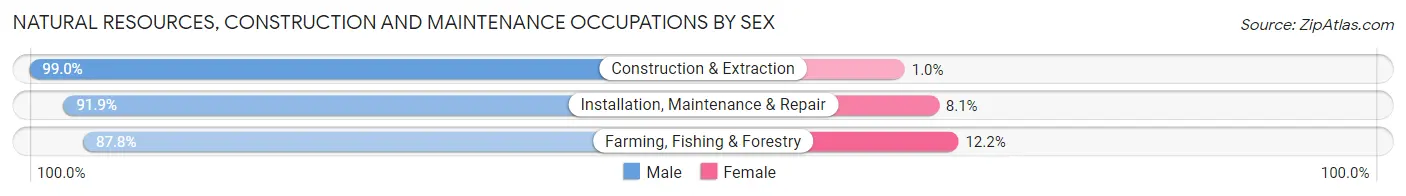
| Occupation | Male | Female |
| Farming, Fishing & Forestry | 137 (87.8%) | 19 (12.2%) |
| Construction & Extraction | 2,265 (99.0%) | 23 (1.0%) |
| Installation, Maintenance & Repair | 465 (91.9%) | 41 (8.1%) |
| Total (Category) | 2,867 (97.2%) | 83 (2.8%) |
| Total (Overall) | 24,494 (54.3%) | 20,626 (45.7%) |
Production, Transportation and Moving Occupations
The most common Production, Transportation and Moving occupations in Redwood City are Production (1,109 | 2.5%), Transportation (1,039 | 2.3%), and Material Moving (1,024 | 2.3%).
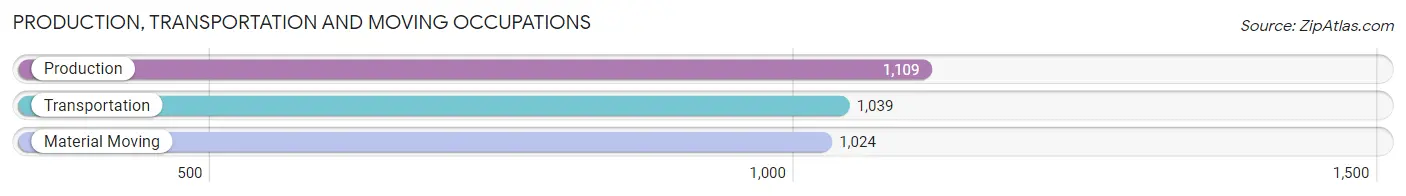
Production, Transportation and Moving Occupations by Sex
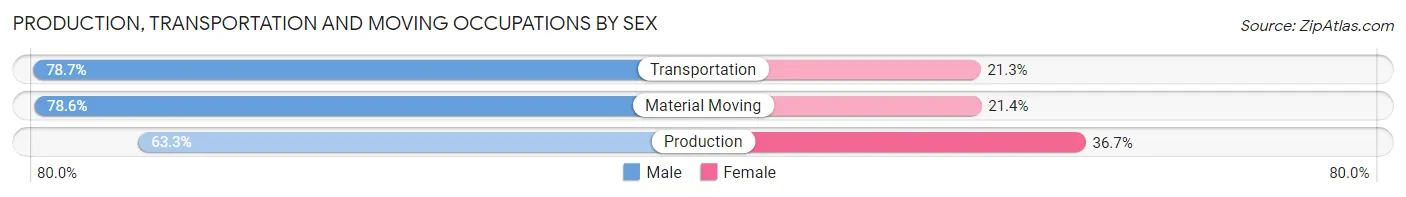
| Occupation | Male | Female |
| Production | 702 (63.3%) | 407 (36.7%) |
| Transportation | 818 (78.7%) | 221 (21.3%) |
| Material Moving | 805 (78.6%) | 219 (21.4%) |
| Total (Category) | 2,325 (73.3%) | 847 (26.7%) |
| Total (Overall) | 24,494 (54.3%) | 20,626 (45.7%) |
Employment Industries by Sex in Redwood City
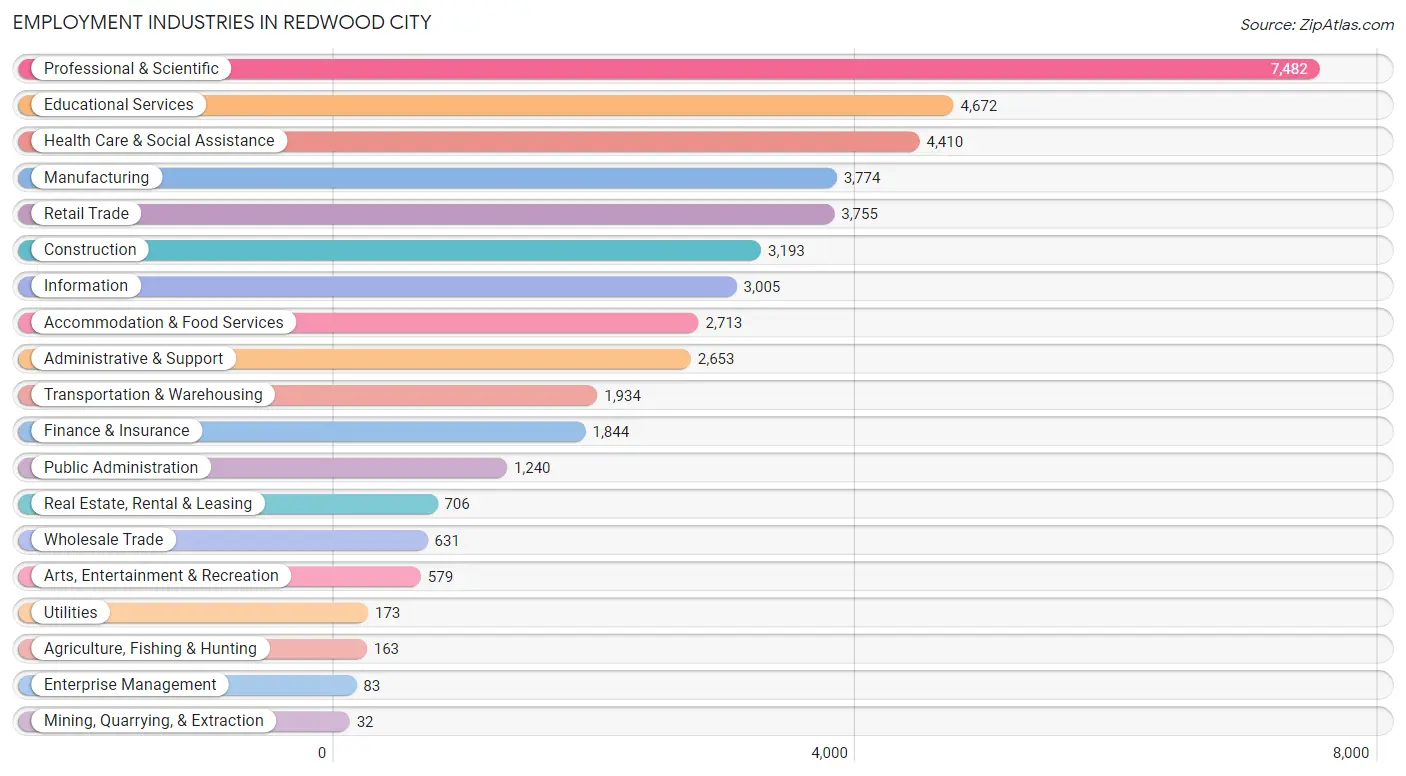
Employment Industries in Redwood City
The major employment industries in Redwood City include Professional & Scientific (7,482 | 16.6%), Educational Services (4,672 | 10.3%), Health Care & Social Assistance (4,410 | 9.8%), Manufacturing (3,774 | 8.4%), and Retail Trade (3,755 | 8.3%).
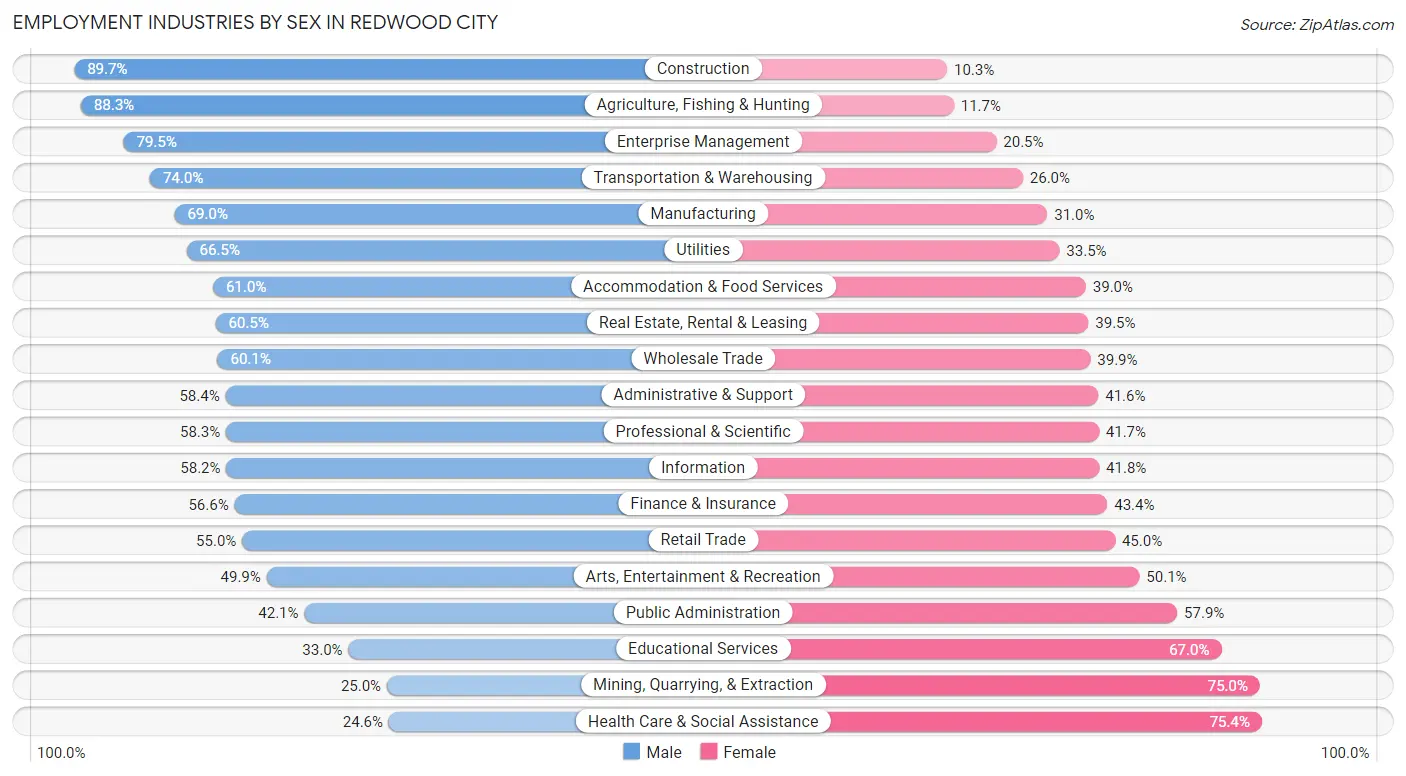
Employment Industries by Sex in Redwood City
The Redwood City industries that see more men than women are Construction (89.7%), Agriculture, Fishing & Hunting (88.3%), and Enterprise Management (79.5%), whereas the industries that tend to have a higher number of women are Health Care & Social Assistance (75.4%), Mining, Quarrying, & Extraction (75.0%), and Educational Services (67.0%).
| Industry | Male | Female |
| Agriculture, Fishing & Hunting | 144 (88.3%) | 19 (11.7%) |
| Mining, Quarrying, & Extraction | 8 (25.0%) | 24 (75.0%) |
| Construction | 2,865 (89.7%) | 328 (10.3%) |
| Manufacturing | 2,603 (69.0%) | 1,171 (31.0%) |
| Wholesale Trade | 379 (60.1%) | 252 (39.9%) |
| Retail Trade | 2,064 (55.0%) | 1,691 (45.0%) |
| Transportation & Warehousing | 1,432 (74.0%) | 502 (26.0%) |
| Utilities | 115 (66.5%) | 58 (33.5%) |
| Information | 1,750 (58.2%) | 1,255 (41.8%) |
| Finance & Insurance | 1,043 (56.6%) | 801 (43.4%) |
| Real Estate, Rental & Leasing | 427 (60.5%) | 279 (39.5%) |
| Professional & Scientific | 4,363 (58.3%) | 3,119 (41.7%) |
| Enterprise Management | 66 (79.5%) | 17 (20.5%) |
| Administrative & Support | 1,550 (58.4%) | 1,103 (41.6%) |
| Educational Services | 1,541 (33.0%) | 3,131 (67.0%) |
| Health Care & Social Assistance | 1,085 (24.6%) | 3,325 (75.4%) |
| Arts, Entertainment & Recreation | 289 (49.9%) | 290 (50.1%) |
| Accommodation & Food Services | 1,655 (61.0%) | 1,058 (39.0%) |
| Public Administration | 522 (42.1%) | 718 (57.9%) |
| Total | 24,494 (54.3%) | 20,626 (45.7%) |
Education in Redwood City
School Enrollment in Redwood City
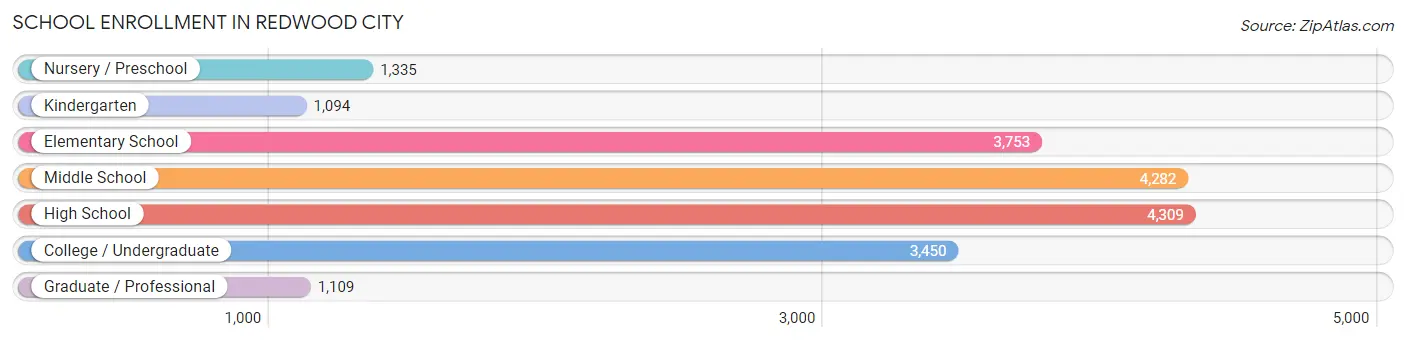
The most common levels of schooling among the 19,332 students in Redwood City are high school (4,309 | 22.3%), middle school (4,282 | 22.2%), and elementary school (3,753 | 19.4%).
| School Level | # Students | % Students |
| Nursery / Preschool | 1,335 | 6.9% |
| Kindergarten | 1,094 | 5.7% |
| Elementary School | 3,753 | 19.4% |
| Middle School | 4,282 | 22.2% |
| High School | 4,309 | 22.3% |
| College / Undergraduate | 3,450 | 17.8% |
| Graduate / Professional | 1,109 | 5.7% |
| Total | 19,332 | 100.0% |
School Enrollment by Age by Funding Source in Redwood City
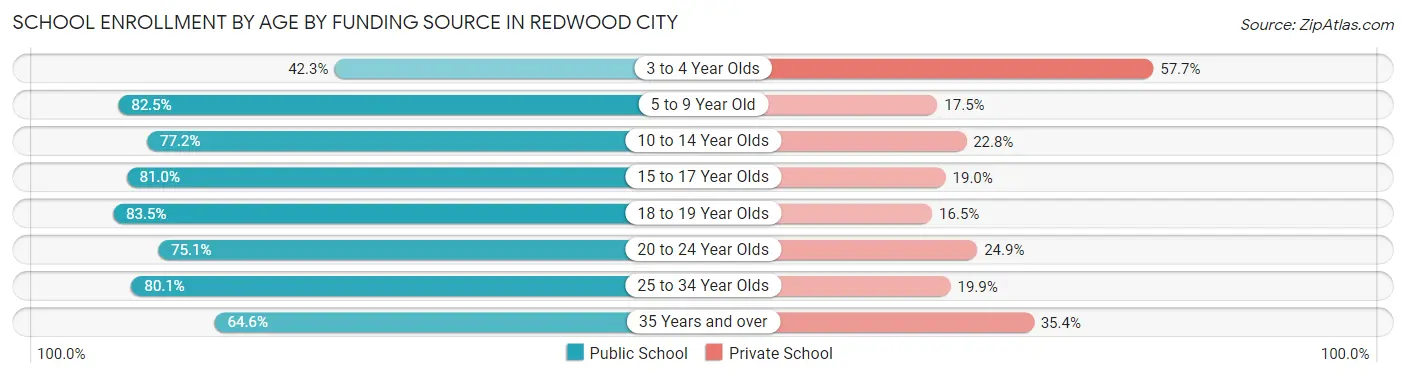
Out of a total of 19,332 students who are enrolled in schools in Redwood City, 4,408 (22.8%) attend a private institution, while the remaining 14,924 (77.2%) are enrolled in public schools. The age group of 3 to 4 year olds has the highest likelihood of being enrolled in private schools, with 628 (57.7% in the age bracket) enrolled. Conversely, the age group of 18 to 19 year olds has the lowest likelihood of being enrolled in a private school, with 1,100 (83.5% in the age bracket) attending a public institution.
| Age Bracket | Public School | Private School |
| 3 to 4 Year Olds | 461 (42.3%) | 628 (57.7%) |
| 5 to 9 Year Old | 3,920 (82.5%) | 829 (17.5%) |
| 10 to 14 Year Olds | 4,066 (77.2%) | 1,202 (22.8%) |
| 15 to 17 Year Olds | 2,478 (81.0%) | 581 (19.0%) |
| 18 to 19 Year Olds | 1,100 (83.5%) | 217 (16.5%) |
| 20 to 24 Year Olds | 1,099 (75.1%) | 364 (24.9%) |
| 25 to 34 Year Olds | 1,292 (80.1%) | 321 (19.9%) |
| 35 Years and over | 500 (64.6%) | 274 (35.4%) |
| Total | 14,924 (77.2%) | 4,408 (22.8%) |
Educational Attainment by Field of Study in Redwood City
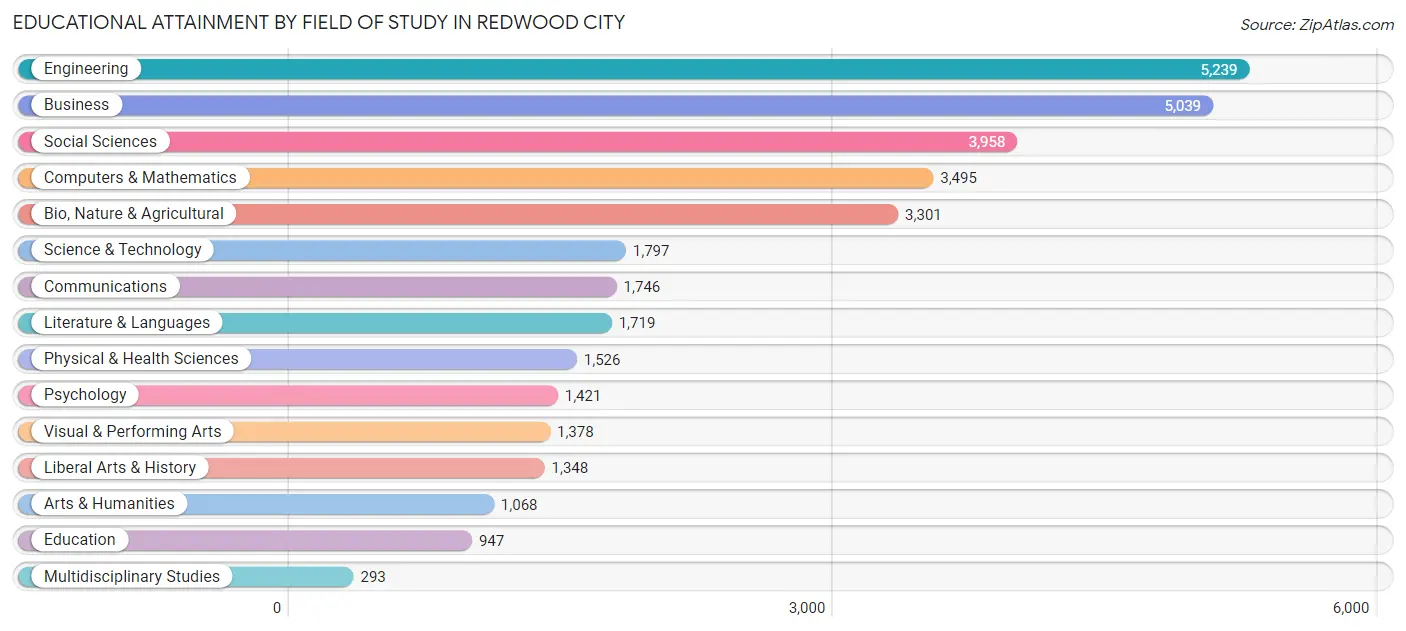
Engineering (5,239 | 15.3%), business (5,039 | 14.7%), social sciences (3,958 | 11.6%), computers & mathematics (3,495 | 10.2%), and bio, nature & agricultural (3,301 | 9.6%) are the most common fields of study among 34,275 individuals in Redwood City who have obtained a bachelor's degree or higher.
| Field of Study | # Graduates | % Graduates |
| Computers & Mathematics | 3,495 | 10.2% |
| Bio, Nature & Agricultural | 3,301 | 9.6% |
| Physical & Health Sciences | 1,526 | 4.4% |
| Psychology | 1,421 | 4.2% |
| Social Sciences | 3,958 | 11.6% |
| Engineering | 5,239 | 15.3% |
| Multidisciplinary Studies | 293 | 0.9% |
| Science & Technology | 1,797 | 5.2% |
| Business | 5,039 | 14.7% |
| Education | 947 | 2.8% |
| Literature & Languages | 1,719 | 5.0% |
| Liberal Arts & History | 1,348 | 3.9% |
| Visual & Performing Arts | 1,378 | 4.0% |
| Communications | 1,746 | 5.1% |
| Arts & Humanities | 1,068 | 3.1% |
| Total | 34,275 | 100.0% |
Transportation & Commute in Redwood City
Vehicle Availability by Sex in Redwood City
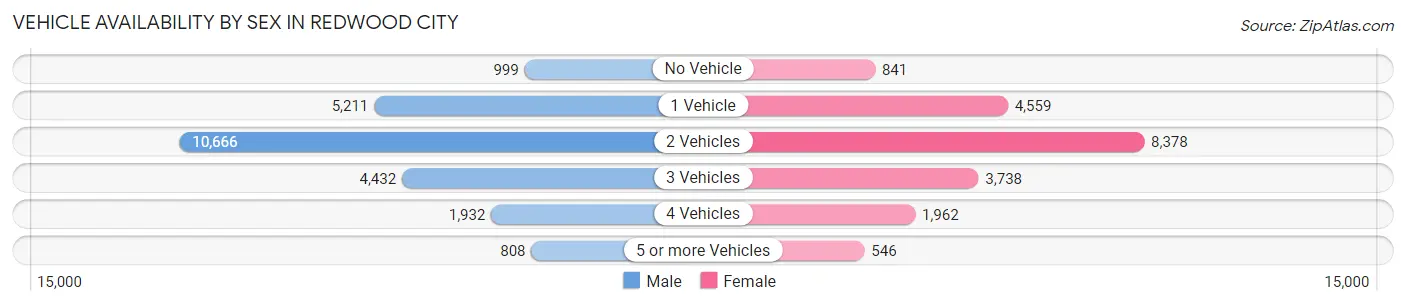
The most prevalent vehicle ownership categories in Redwood City are males with 2 vehicles (10,666, accounting for 44.4%) and females with 2 vehicles (8,378, making up 53.3%).
| Vehicles Available | Male | Female |
| No Vehicle | 999 (4.2%) | 841 (4.2%) |
| 1 Vehicle | 5,211 (21.7%) | 4,559 (22.8%) |
| 2 Vehicles | 10,666 (44.4%) | 8,378 (41.8%) |
| 3 Vehicles | 4,432 (18.4%) | 3,738 (18.7%) |
| 4 Vehicles | 1,932 (8.0%) | 1,962 (9.8%) |
| 5 or more Vehicles | 808 (3.4%) | 546 (2.7%) |
| Total | 24,048 (100.0%) | 20,024 (100.0%) |
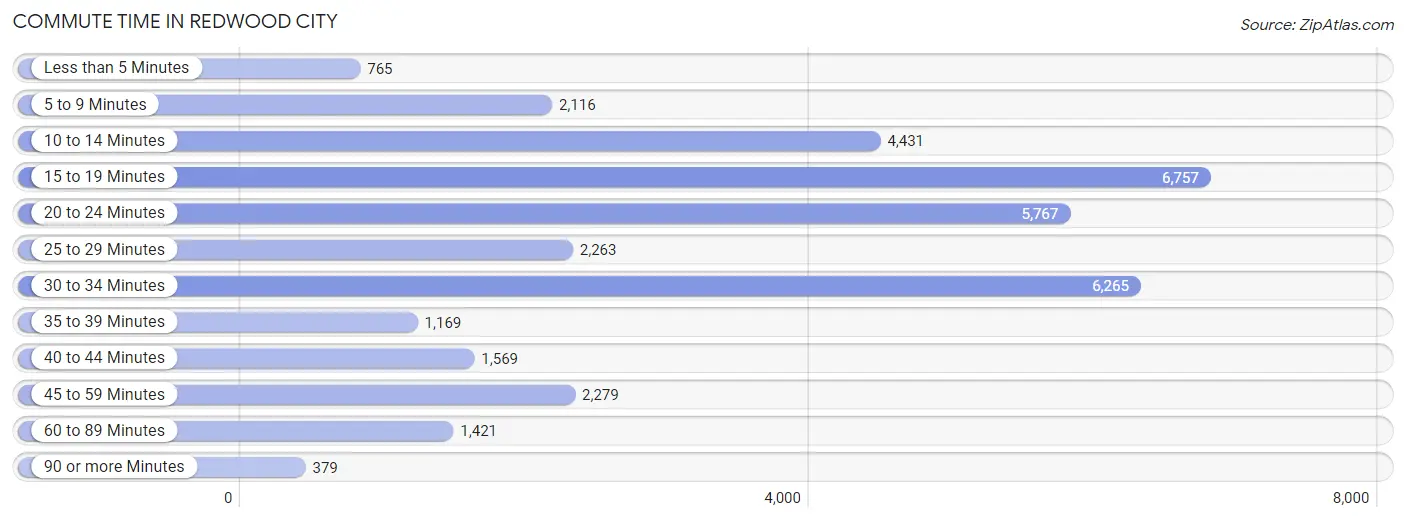
Commute Time in Redwood City
The most frequently occuring commute durations in Redwood City are 15 to 19 minutes (6,757 commuters, 19.2%), 30 to 34 minutes (6,265 commuters, 17.8%), and 20 to 24 minutes (5,767 commuters, 16.4%).
| Commute Time | # Commuters | % Commuters |
| Less than 5 Minutes | 765 | 2.2% |
| 5 to 9 Minutes | 2,116 | 6.0% |
| 10 to 14 Minutes | 4,431 | 12.6% |
| 15 to 19 Minutes | 6,757 | 19.2% |
| 20 to 24 Minutes | 5,767 | 16.4% |
| 25 to 29 Minutes | 2,263 | 6.4% |
| 30 to 34 Minutes | 6,265 | 17.8% |
| 35 to 39 Minutes | 1,169 | 3.3% |
| 40 to 44 Minutes | 1,569 | 4.5% |
| 45 to 59 Minutes | 2,279 | 6.5% |
| 60 to 89 Minutes | 1,421 | 4.0% |
| 90 or more Minutes | 379 | 1.1% |
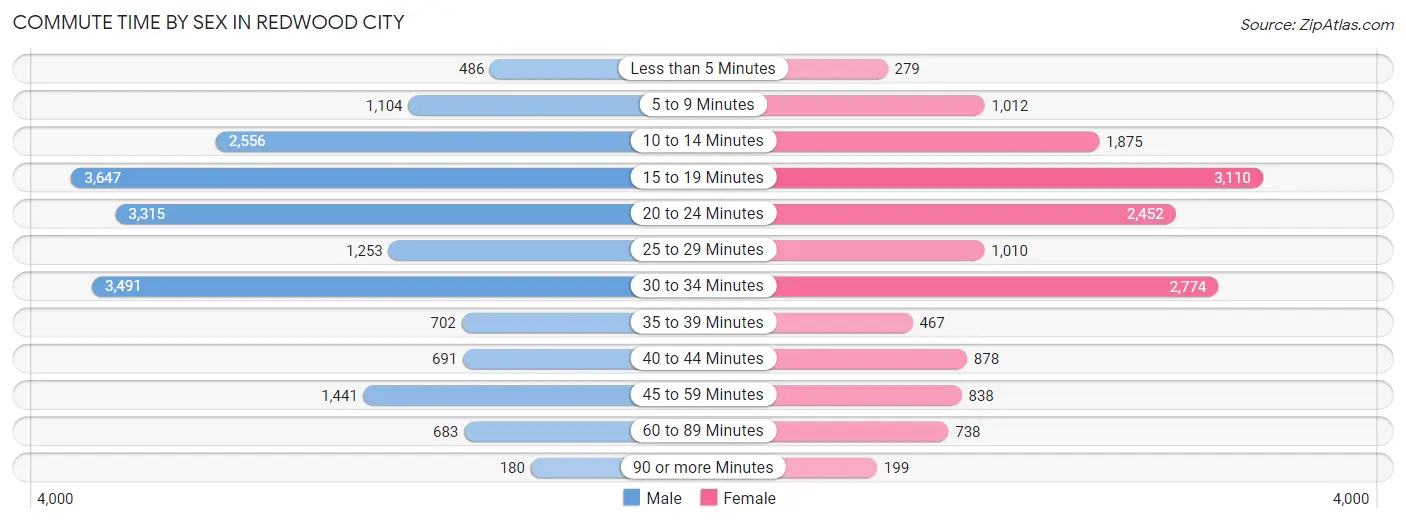
Commute Time by Sex in Redwood City
The most common commute times in Redwood City are 15 to 19 minutes (3,647 commuters, 18.7%) for males and 15 to 19 minutes (3,110 commuters, 19.9%) for females.
| Commute Time | Male | Female |
| Less than 5 Minutes | 486 (2.5%) | 279 (1.8%) |
| 5 to 9 Minutes | 1,104 (5.7%) | 1,012 (6.5%) |
| 10 to 14 Minutes | 2,556 (13.1%) | 1,875 (12.0%) |
| 15 to 19 Minutes | 3,647 (18.7%) | 3,110 (19.9%) |
| 20 to 24 Minutes | 3,315 (17.0%) | 2,452 (15.7%) |
| 25 to 29 Minutes | 1,253 (6.4%) | 1,010 (6.5%) |
| 30 to 34 Minutes | 3,491 (17.9%) | 2,774 (17.7%) |
| 35 to 39 Minutes | 702 (3.6%) | 467 (3.0%) |
| 40 to 44 Minutes | 691 (3.5%) | 878 (5.6%) |
| 45 to 59 Minutes | 1,441 (7.4%) | 838 (5.4%) |
| 60 to 89 Minutes | 683 (3.5%) | 738 (4.7%) |
| 90 or more Minutes | 180 (0.9%) | 199 (1.3%) |
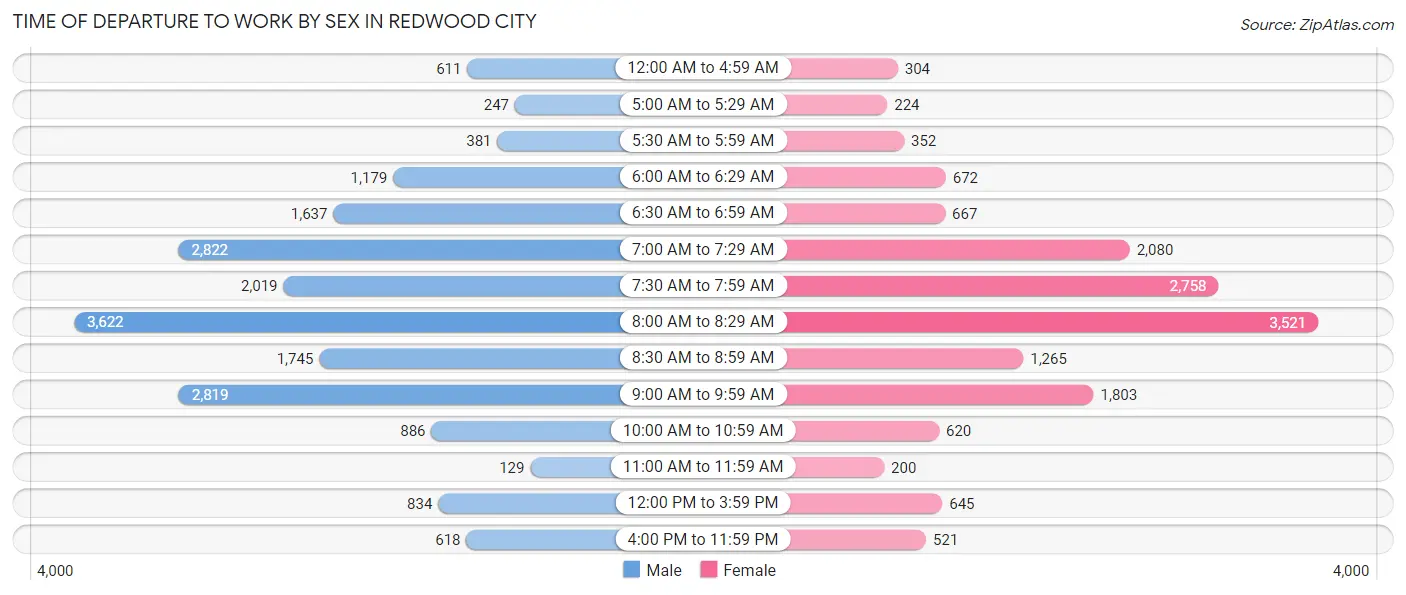
Time of Departure to Work by Sex in Redwood City
The most frequent times of departure to work in Redwood City are 8:00 AM to 8:29 AM (3,622, 18.5%) for males and 8:00 AM to 8:29 AM (3,521, 22.5%) for females.
| Time of Departure | Male | Female |
| 12:00 AM to 4:59 AM | 611 (3.1%) | 304 (1.9%) |
| 5:00 AM to 5:29 AM | 247 (1.3%) | 224 (1.4%) |
| 5:30 AM to 5:59 AM | 381 (1.9%) | 352 (2.2%) |
| 6:00 AM to 6:29 AM | 1,179 (6.0%) | 672 (4.3%) |
| 6:30 AM to 6:59 AM | 1,637 (8.4%) | 667 (4.3%) |
| 7:00 AM to 7:29 AM | 2,822 (14.4%) | 2,080 (13.3%) |
| 7:30 AM to 7:59 AM | 2,019 (10.3%) | 2,758 (17.6%) |
| 8:00 AM to 8:29 AM | 3,622 (18.5%) | 3,521 (22.5%) |
| 8:30 AM to 8:59 AM | 1,745 (8.9%) | 1,265 (8.1%) |
| 9:00 AM to 9:59 AM | 2,819 (14.4%) | 1,803 (11.5%) |
| 10:00 AM to 10:59 AM | 886 (4.5%) | 620 (4.0%) |
| 11:00 AM to 11:59 AM | 129 (0.7%) | 200 (1.3%) |
| 12:00 PM to 3:59 PM | 834 (4.3%) | 645 (4.1%) |
| 4:00 PM to 11:59 PM | 618 (3.2%) | 521 (3.3%) |
| Total | 19,549 (100.0%) | 15,632 (100.0%) |
Housing Occupancy in Redwood City
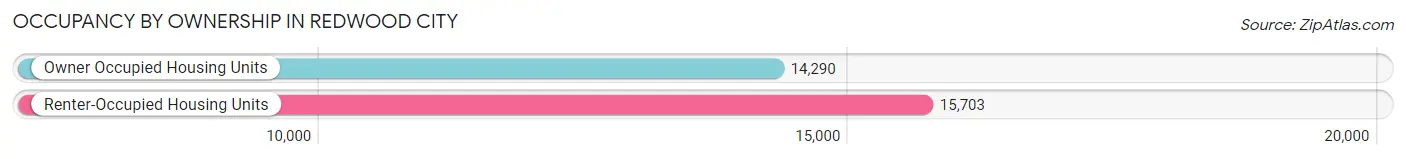
Occupancy by Ownership in Redwood City
Of the total 29,993 dwellings in Redwood City, owner-occupied units account for 14,290 (47.6%), while renter-occupied units make up 15,703 (52.4%).
| Occupancy | # Housing Units | % Housing Units |
| Owner Occupied Housing Units | 14,290 | 47.6% |
| Renter-Occupied Housing Units | 15,703 | 52.4% |
| Total Occupied Housing Units | 29,993 | 100.0% |
Occupancy by Household Size in Redwood City
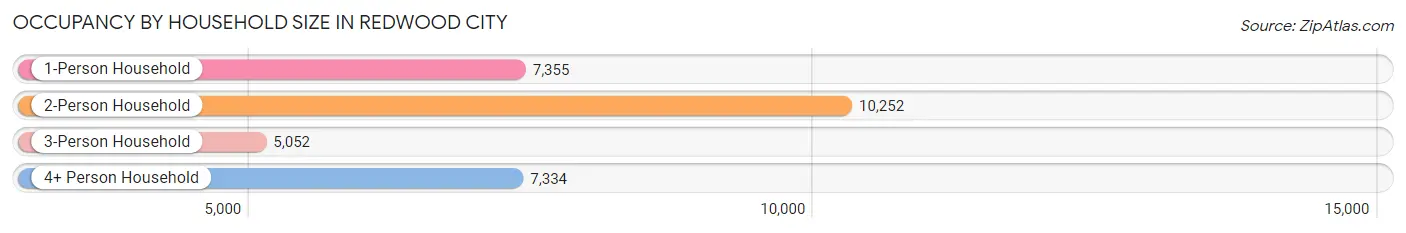
| Household Size | # Housing Units | % Housing Units |
| 1-Person Household | 7,355 | 24.5% |
| 2-Person Household | 10,252 | 34.2% |
| 3-Person Household | 5,052 | 16.8% |
| 4+ Person Household | 7,334 | 24.4% |
| Total Housing Units | 29,993 | 100.0% |
Occupancy by Ownership by Household Size in Redwood City
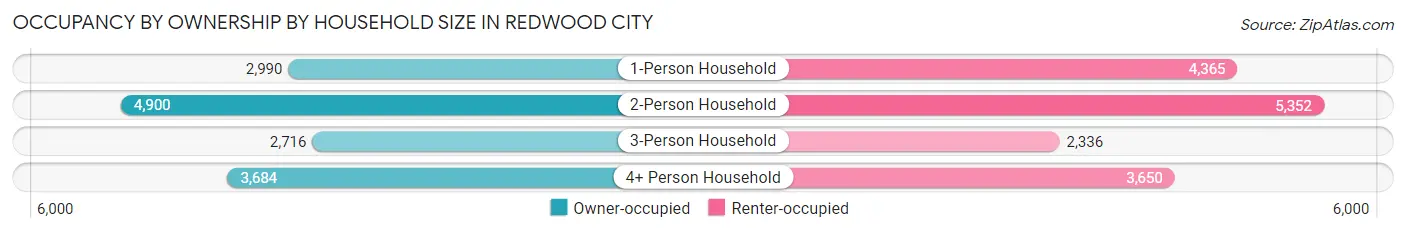
| Household Size | Owner-occupied | Renter-occupied |
| 1-Person Household | 2,990 (40.6%) | 4,365 (59.4%) |
| 2-Person Household | 4,900 (47.8%) | 5,352 (52.2%) |
| 3-Person Household | 2,716 (53.8%) | 2,336 (46.2%) |
| 4+ Person Household | 3,684 (50.2%) | 3,650 (49.8%) |
| Total Housing Units | 14,290 (47.6%) | 15,703 (52.4%) |
Occupancy by Educational Attainment in Redwood City
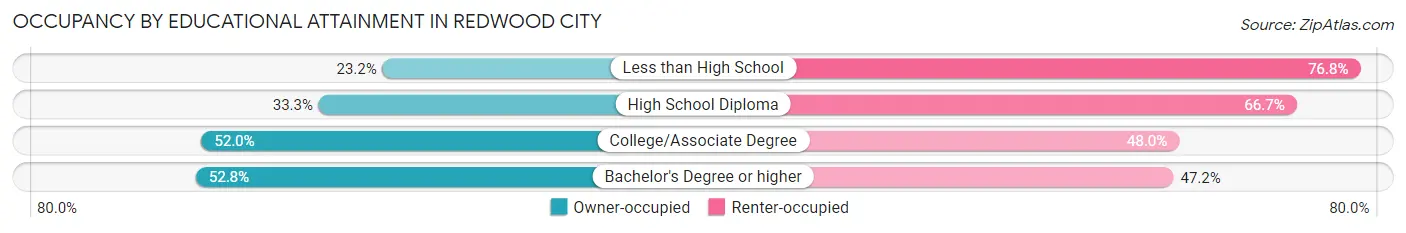
| Household Size | Owner-occupied | Renter-occupied |
| Less than High School | 573 (23.2%) | 1,894 (76.8%) |
| High School Diploma | 1,322 (33.3%) | 2,643 (66.7%) |
| College/Associate Degree | 3,120 (52.0%) | 2,885 (48.0%) |
| Bachelor's Degree or higher | 9,275 (52.8%) | 8,281 (47.2%) |
Occupancy by Age of Householder in Redwood City
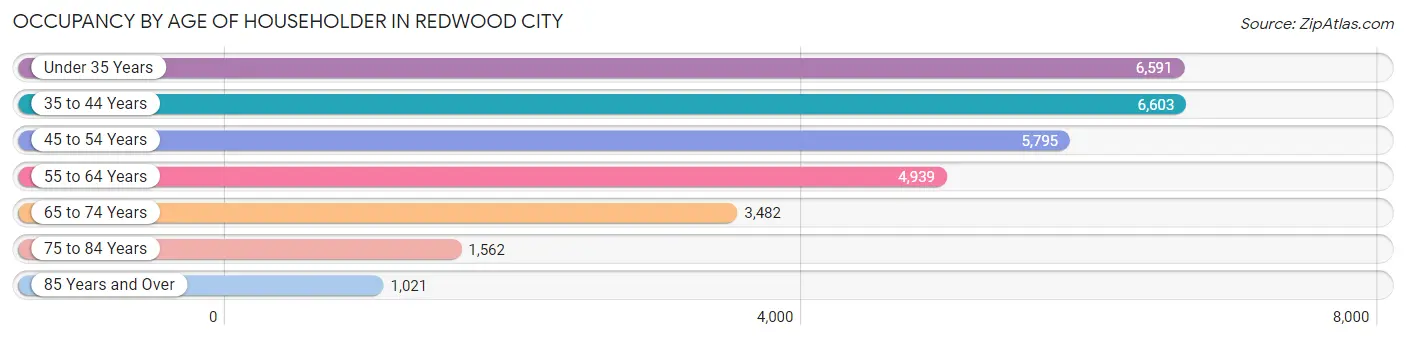
| Age Bracket | # Households | % Households |
| Under 35 Years | 6,591 | 22.0% |
| 35 to 44 Years | 6,603 | 22.0% |
| 45 to 54 Years | 5,795 | 19.3% |
| 55 to 64 Years | 4,939 | 16.5% |
| 65 to 74 Years | 3,482 | 11.6% |
| 75 to 84 Years | 1,562 | 5.2% |
| 85 Years and Over | 1,021 | 3.4% |
| Total | 29,993 | 100.0% |
Housing Finances in Redwood City
Median Income by Occupancy in Redwood City
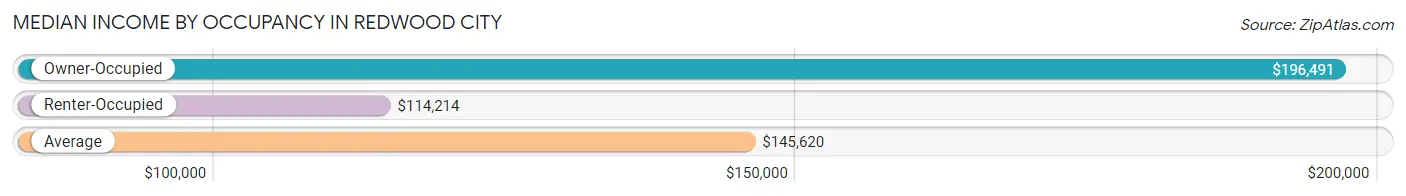
| Occupancy Type | # Households | Median Income |
| Owner-Occupied | 14,290 (47.6%) | $196,491 |
| Renter-Occupied | 15,703 (52.4%) | $114,214 |
| Average | 29,993 (100.0%) | $145,620 |
Occupancy by Householder Income Bracket in Redwood City
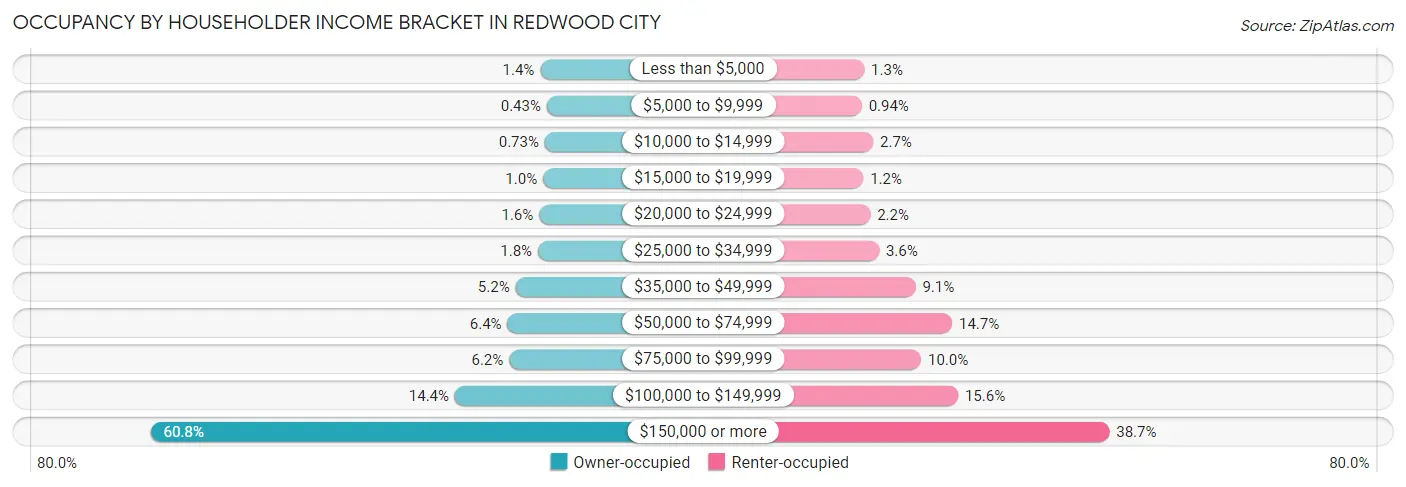
| Income Bracket | Owner-occupied | Renter-occupied |
| Less than $5,000 | 204 (1.4%) | 205 (1.3%) |
| $5,000 to $9,999 | 62 (0.4%) | 148 (0.9%) |
| $10,000 to $14,999 | 105 (0.7%) | 420 (2.7%) |
| $15,000 to $19,999 | 144 (1.0%) | 184 (1.2%) |
| $20,000 to $24,999 | 228 (1.6%) | 352 (2.2%) |
| $25,000 to $34,999 | 255 (1.8%) | 560 (3.6%) |
| $35,000 to $49,999 | 743 (5.2%) | 1,434 (9.1%) |
| $50,000 to $74,999 | 917 (6.4%) | 2,309 (14.7%) |
| $75,000 to $99,999 | 881 (6.2%) | 1,567 (10.0%) |
| $100,000 to $149,999 | 2,063 (14.4%) | 2,452 (15.6%) |
| $150,000 or more | 8,688 (60.8%) | 6,072 (38.7%) |
| Total | 14,290 (100.0%) | 15,703 (100.0%) |
Monthly Housing Cost Tiers in Redwood City
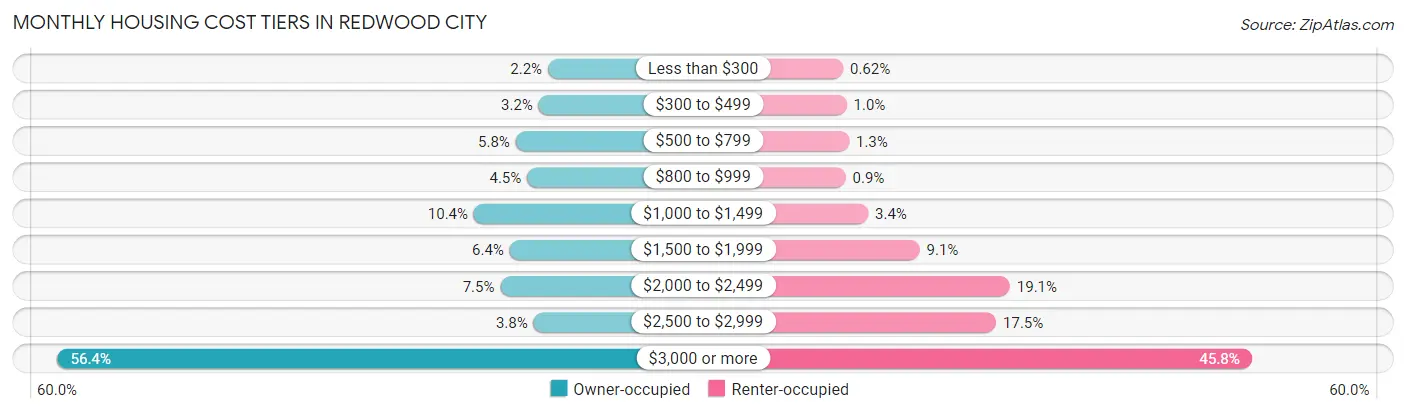
| Monthly Cost | Owner-occupied | Renter-occupied |
| Less than $300 | 313 (2.2%) | 97 (0.6%) |
| $300 to $499 | 458 (3.2%) | 158 (1.0%) |
| $500 to $799 | 822 (5.8%) | 201 (1.3%) |
| $800 to $999 | 642 (4.5%) | 141 (0.9%) |
| $1,000 to $1,499 | 1,482 (10.4%) | 532 (3.4%) |
| $1,500 to $1,999 | 916 (6.4%) | 1,426 (9.1%) |
| $2,000 to $2,499 | 1,065 (7.4%) | 2,991 (19.1%) |
| $2,500 to $2,999 | 540 (3.8%) | 2,753 (17.5%) |
| $3,000 or more | 8,052 (56.4%) | 7,184 (45.8%) |
| Total | 14,290 (100.0%) | 15,703 (100.0%) |
Physical Housing Characteristics in Redwood City
Housing Structures in Redwood City
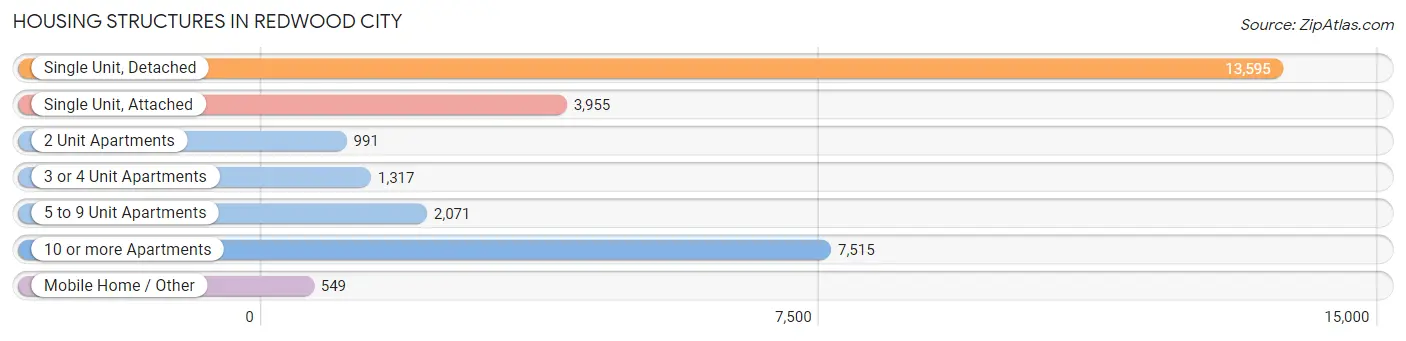
| Structure Type | # Housing Units | % Housing Units |
| Single Unit, Detached | 13,595 | 45.3% |
| Single Unit, Attached | 3,955 | 13.2% |
| 2 Unit Apartments | 991 | 3.3% |
| 3 or 4 Unit Apartments | 1,317 | 4.4% |
| 5 to 9 Unit Apartments | 2,071 | 6.9% |
| 10 or more Apartments | 7,515 | 25.1% |
| Mobile Home / Other | 549 | 1.8% |
| Total | 29,993 | 100.0% |
Housing Structures by Occupancy in Redwood City
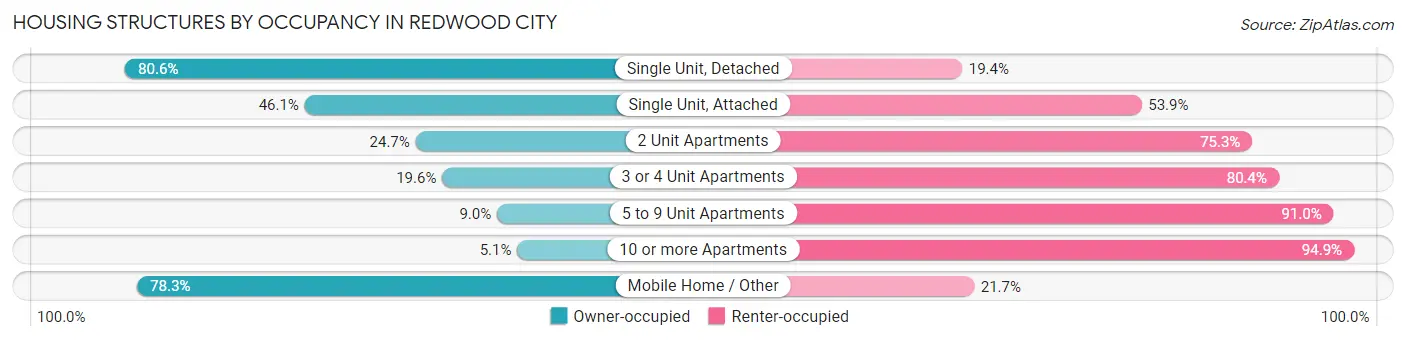
| Structure Type | Owner-occupied | Renter-occupied |
| Single Unit, Detached | 10,962 (80.6%) | 2,633 (19.4%) |
| Single Unit, Attached | 1,822 (46.1%) | 2,133 (53.9%) |
| 2 Unit Apartments | 245 (24.7%) | 746 (75.3%) |
| 3 or 4 Unit Apartments | 258 (19.6%) | 1,059 (80.4%) |
| 5 to 9 Unit Apartments | 187 (9.0%) | 1,884 (91.0%) |
| 10 or more Apartments | 386 (5.1%) | 7,129 (94.9%) |
| Mobile Home / Other | 430 (78.3%) | 119 (21.7%) |
| Total | 14,290 (47.6%) | 15,703 (52.4%) |
Housing Structures by Number of Rooms in Redwood City
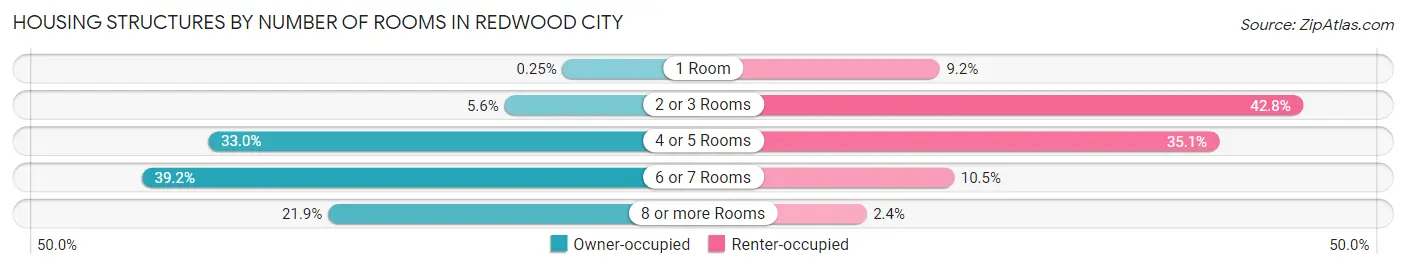
| Number of Rooms | Owner-occupied | Renter-occupied |
| 1 Room | 36 (0.3%) | 1,446 (9.2%) |
| 2 or 3 Rooms | 801 (5.6%) | 6,717 (42.8%) |
| 4 or 5 Rooms | 4,720 (33.0%) | 5,504 (35.0%) |
| 6 or 7 Rooms | 5,599 (39.2%) | 1,654 (10.5%) |
| 8 or more Rooms | 3,134 (21.9%) | 382 (2.4%) |
| Total | 14,290 (100.0%) | 15,703 (100.0%) |
Housing Structure by Heating Type in Redwood City
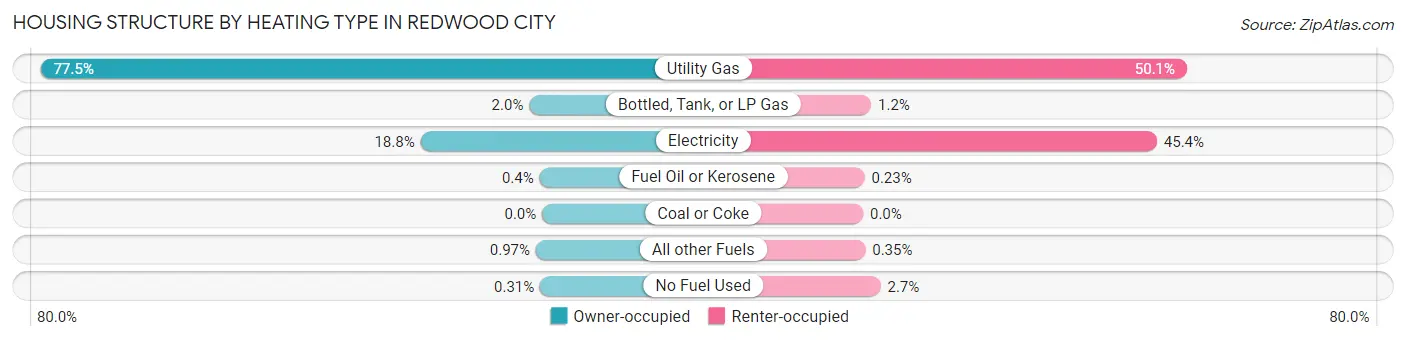
| Heating Type | Owner-occupied | Renter-occupied |
| Utility Gas | 11,081 (77.5%) | 7,860 (50.0%) |
| Bottled, Tank, or LP Gas | 284 (2.0%) | 195 (1.2%) |
| Electricity | 2,686 (18.8%) | 7,133 (45.4%) |
| Fuel Oil or Kerosene | 57 (0.4%) | 36 (0.2%) |
| Coal or Coke | 0 (0.0%) | 0 (0.0%) |
| All other Fuels | 138 (1.0%) | 55 (0.4%) |
| No Fuel Used | 44 (0.3%) | 424 (2.7%) |
| Total | 14,290 (100.0%) | 15,703 (100.0%) |
Household Vehicle Usage in Redwood City
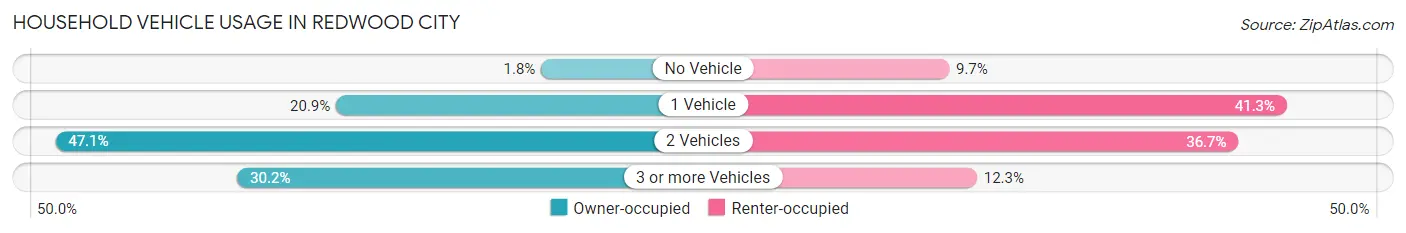
| Vehicles per Household | Owner-occupied | Renter-occupied |
| No Vehicle | 255 (1.8%) | 1,526 (9.7%) |
| 1 Vehicle | 2,990 (20.9%) | 6,478 (41.2%) |
| 2 Vehicles | 6,735 (47.1%) | 5,766 (36.7%) |
| 3 or more Vehicles | 4,310 (30.2%) | 1,933 (12.3%) |
| Total | 14,290 (100.0%) | 15,703 (100.0%) |
Real Estate & Mortgages in Redwood City
Real Estate and Mortgage Overview in Redwood City
| Characteristic | Without Mortgage | With Mortgage |
| Housing Units | 4,126 | 10,164 |
| Median Property Value | $1,536,000 | $1,841,100 |
| Median Household Income | $104,677 | $7,344 |
| Monthly Housing Costs | $1,019 | $7,990 |
| Real Estate Taxes | $5,447 | $156 |
Property Value by Mortgage Status in Redwood City
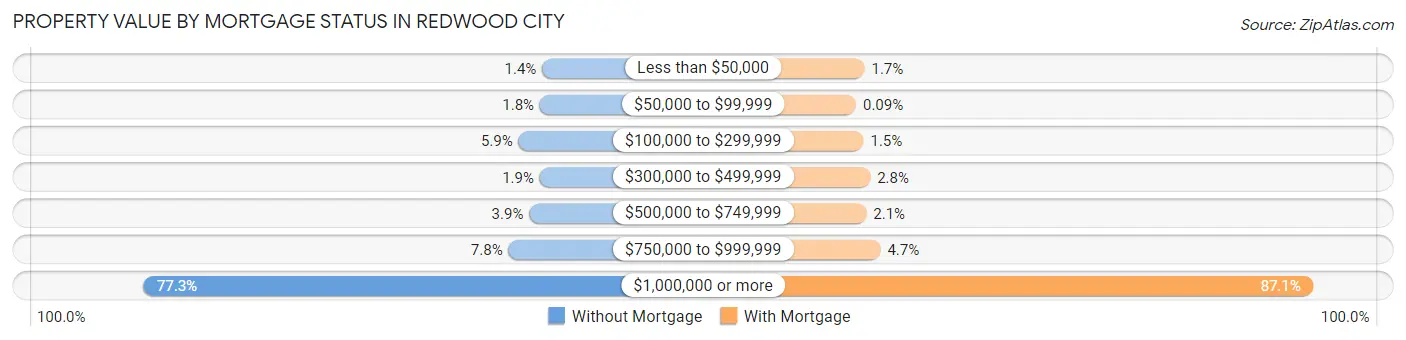
| Property Value | Without Mortgage | With Mortgage |
| Less than $50,000 | 58 (1.4%) | 174 (1.7%) |
| $50,000 to $99,999 | 76 (1.8%) | 9 (0.1%) |
| $100,000 to $299,999 | 244 (5.9%) | 154 (1.5%) |
| $300,000 to $499,999 | 77 (1.9%) | 285 (2.8%) |
| $500,000 to $749,999 | 160 (3.9%) | 208 (2.1%) |
| $750,000 to $999,999 | 323 (7.8%) | 482 (4.7%) |
| $1,000,000 or more | 3,188 (77.3%) | 8,852 (87.1%) |
| Total | 4,126 (100.0%) | 10,164 (100.0%) |
Household Income by Mortgage Status in Redwood City
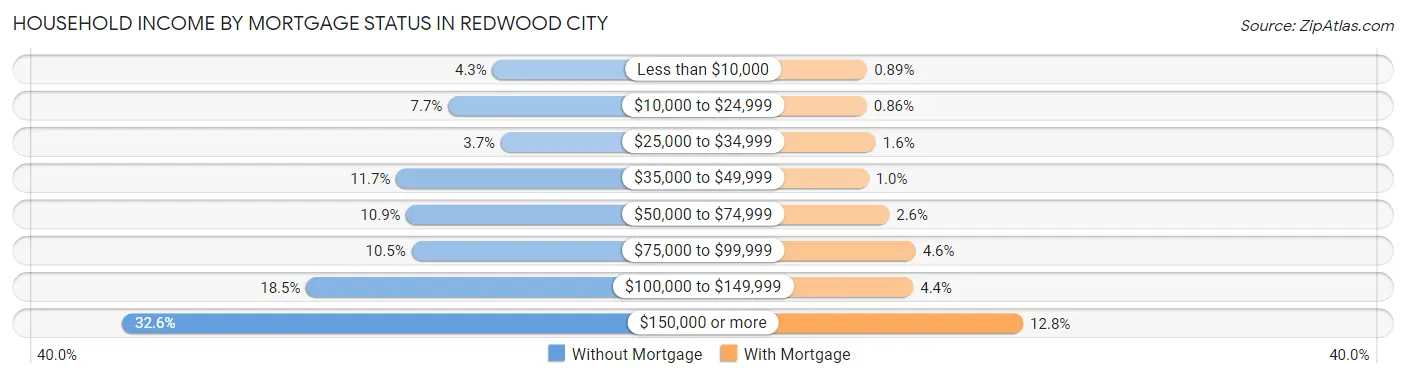
| Household Income | Without Mortgage | With Mortgage |
| Less than $10,000 | 179 (4.3%) | 90 (0.9%) |
| $10,000 to $24,999 | 319 (7.7%) | 87 (0.9%) |
| $25,000 to $34,999 | 153 (3.7%) | 158 (1.5%) |
| $35,000 to $49,999 | 482 (11.7%) | 102 (1.0%) |
| $50,000 to $74,999 | 450 (10.9%) | 261 (2.6%) |
| $75,000 to $99,999 | 434 (10.5%) | 467 (4.6%) |
| $100,000 to $149,999 | 765 (18.5%) | 447 (4.4%) |
| $150,000 or more | 1,344 (32.6%) | 1,298 (12.8%) |
| Total | 4,126 (100.0%) | 10,164 (100.0%) |
Property Value to Household Income Ratio in Redwood City
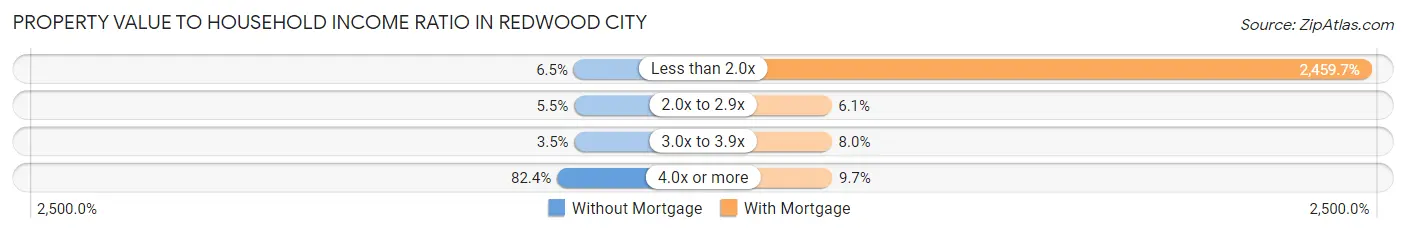
| Value-to-Income Ratio | Without Mortgage | With Mortgage |
| Less than 2.0x | 266 (6.5%) | 250,001 (2,459.7%) |
| 2.0x to 2.9x | 226 (5.5%) | 618 (6.1%) |
| 3.0x to 3.9x | 145 (3.5%) | 809 (8.0%) |
| 4.0x or more | 3,400 (82.4%) | 986 (9.7%) |
| Total | 4,126 (100.0%) | 10,164 (100.0%) |
Real Estate Taxes by Mortgage Status in Redwood City
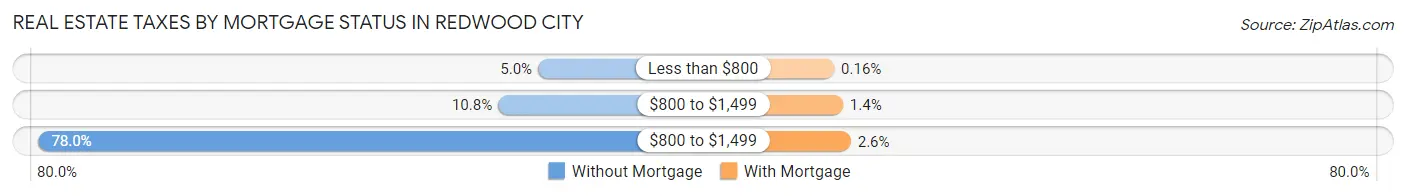
| Property Taxes | Without Mortgage | With Mortgage |
| Less than $800 | 206 (5.0%) | 16 (0.2%) |
| $800 to $1,499 | 447 (10.8%) | 146 (1.4%) |
| $800 to $1,499 | 3,217 (78.0%) | 263 (2.6%) |
| Total | 4,126 (100.0%) | 10,164 (100.0%) |
Health & Disability in Redwood City
Health Insurance Coverage by Age in Redwood City
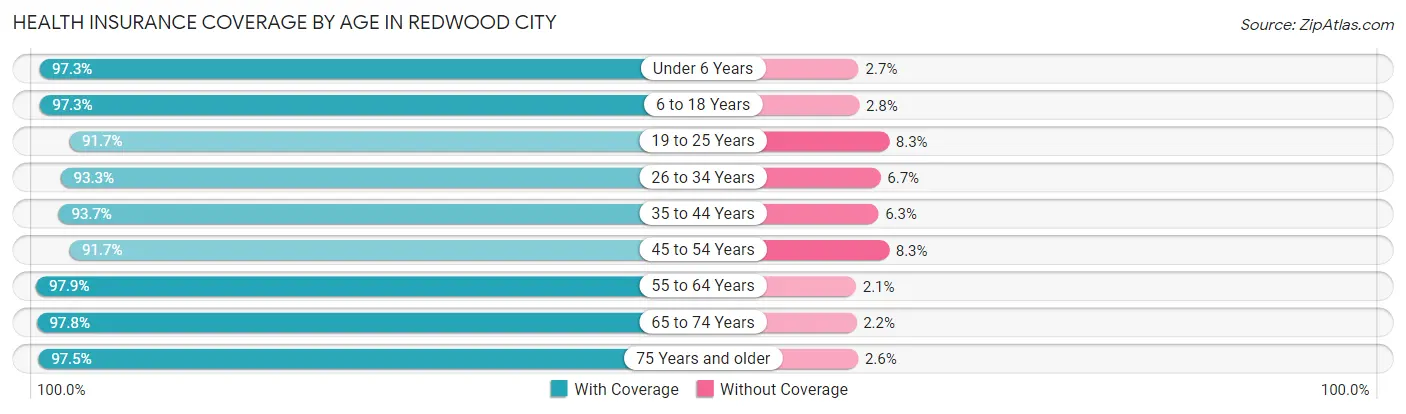
| Age Bracket | With Coverage | Without Coverage |
| Under 6 Years | 5,221 (97.3%) | 144 (2.7%) |
| 6 to 18 Years | 13,234 (97.3%) | 374 (2.8%) |
| 19 to 25 Years | 5,273 (91.7%) | 478 (8.3%) |
| 26 to 34 Years | 12,270 (93.3%) | 885 (6.7%) |
| 35 to 44 Years | 12,044 (93.7%) | 813 (6.3%) |
| 45 to 54 Years | 10,444 (91.7%) | 944 (8.3%) |
| 55 to 64 Years | 9,220 (97.9%) | 202 (2.1%) |
| 65 to 74 Years | 6,223 (97.8%) | 141 (2.2%) |
| 75 Years and older | 4,212 (97.5%) | 110 (2.5%) |
| Total | 78,141 (95.0%) | 4,091 (5.0%) |
Health Insurance Coverage by Citizenship Status in Redwood City
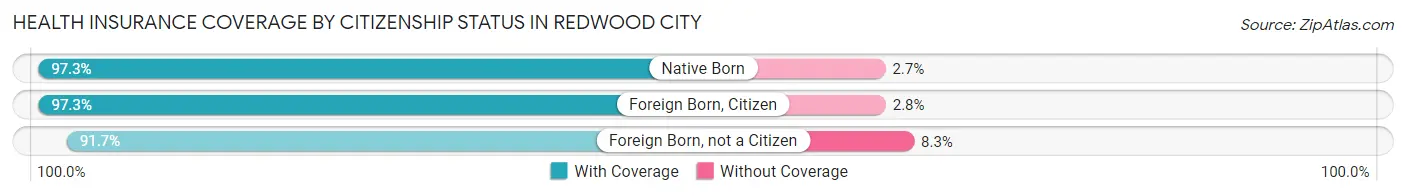
| Citizenship Status | With Coverage | Without Coverage |
| Native Born | 5,221 (97.3%) | 144 (2.7%) |
| Foreign Born, Citizen | 13,234 (97.3%) | 374 (2.8%) |
| Foreign Born, not a Citizen | 5,273 (91.7%) | 478 (8.3%) |
Health Insurance Coverage by Household Income in Redwood City
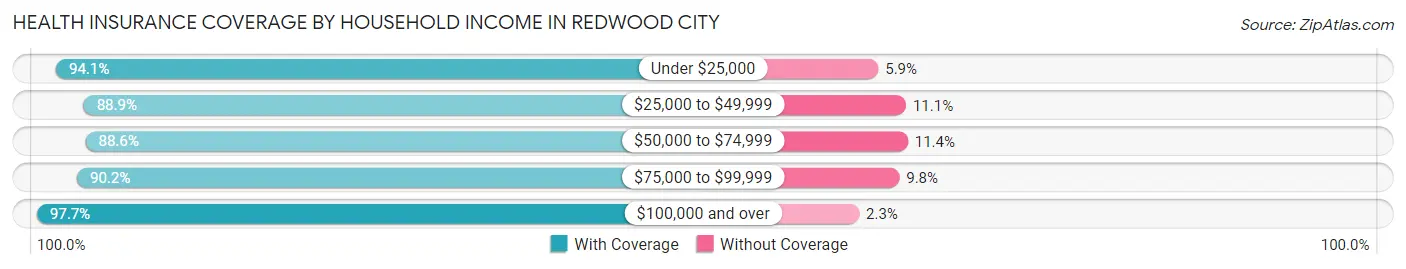
| Household Income | With Coverage | Without Coverage |
| Under $25,000 | 3,351 (94.1%) | 210 (5.9%) |
| $25,000 to $49,999 | 7,194 (88.9%) | 897 (11.1%) |
| $50,000 to $74,999 | 7,810 (88.6%) | 1,008 (11.4%) |
| $75,000 to $99,999 | 6,562 (90.2%) | 715 (9.8%) |
| $100,000 and over | 52,302 (97.7%) | 1,236 (2.3%) |
Public vs Private Health Insurance Coverage by Age in Redwood City
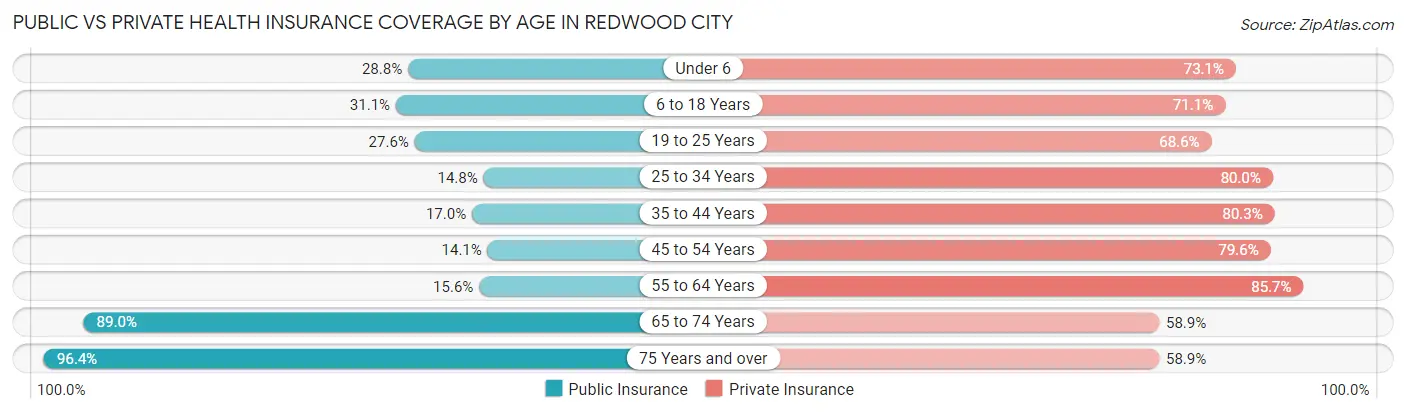
| Age Bracket | Public Insurance | Private Insurance |
| Under 6 | 1,547 (28.8%) | 3,923 (73.1%) |
| 6 to 18 Years | 4,229 (31.1%) | 9,678 (71.1%) |
| 19 to 25 Years | 1,587 (27.6%) | 3,945 (68.6%) |
| 25 to 34 Years | 1,950 (14.8%) | 10,521 (80.0%) |
| 35 to 44 Years | 2,180 (17.0%) | 10,327 (80.3%) |
| 45 to 54 Years | 1,601 (14.1%) | 9,061 (79.6%) |
| 55 to 64 Years | 1,473 (15.6%) | 8,072 (85.7%) |
| 65 to 74 Years | 5,666 (89.0%) | 3,747 (58.9%) |
| 75 Years and over | 4,167 (96.4%) | 2,545 (58.9%) |
| Total | 24,400 (29.7%) | 61,819 (75.2%) |
Disability Status by Sex by Age in Redwood City
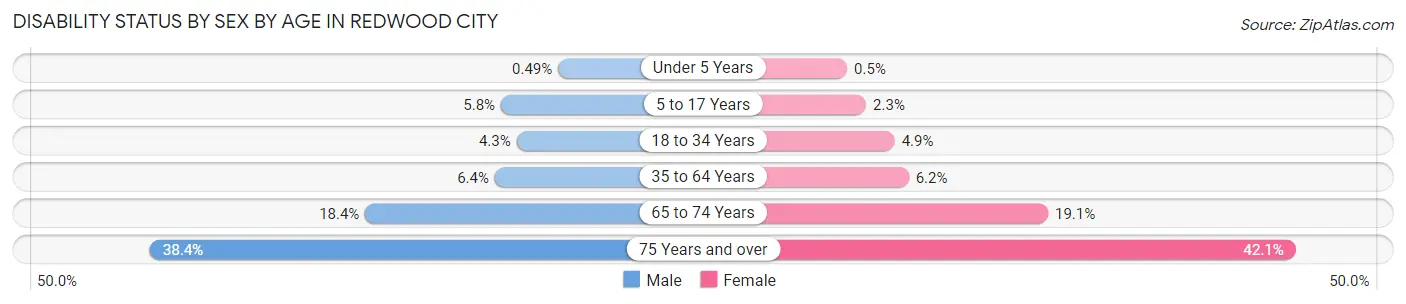
| Age Bracket | Male | Female |
| Under 5 Years | 10 (0.5%) | 12 (0.5%) |
| 5 to 17 Years | 416 (5.8%) | 142 (2.3%) |
| 18 to 34 Years | 449 (4.3%) | 472 (4.9%) |
| 35 to 64 Years | 1,042 (6.4%) | 1,074 (6.2%) |
| 65 to 74 Years | 566 (18.4%) | 629 (19.1%) |
| 75 Years and over | 668 (38.4%) | 1,087 (42.1%) |
Disability Class by Sex by Age in Redwood City
Disability Class: Hearing Difficulty
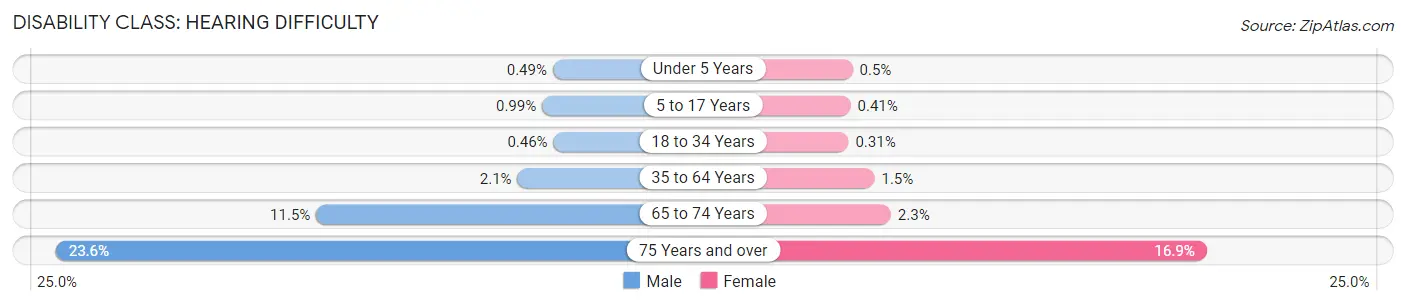
| Age Bracket | Male | Female |
| Under 5 Years | 10 (0.5%) | 12 (0.5%) |
| 5 to 17 Years | 71 (1.0%) | 26 (0.4%) |
| 18 to 34 Years | 48 (0.5%) | 30 (0.3%) |
| 35 to 64 Years | 349 (2.1%) | 263 (1.5%) |
| 65 to 74 Years | 353 (11.5%) | 75 (2.3%) |
| 75 Years and over | 410 (23.5%) | 437 (16.9%) |
Disability Class: Vision Difficulty
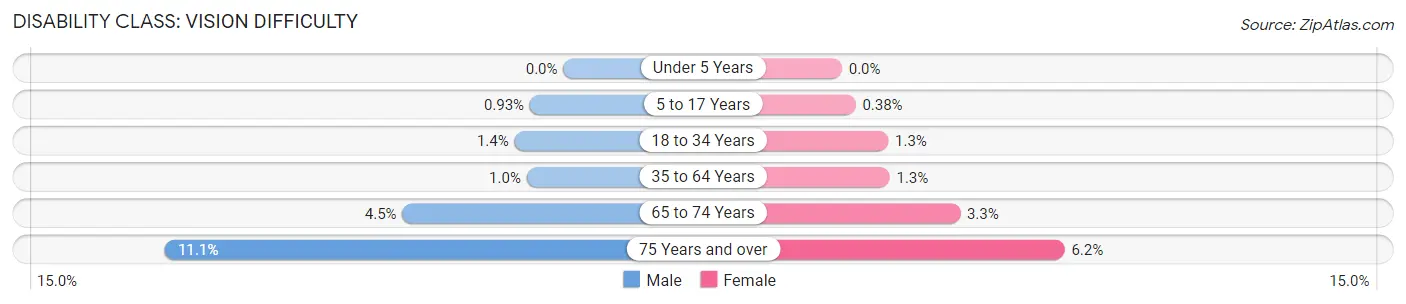
| Age Bracket | Male | Female |
| Under 5 Years | 0 (0.0%) | 0 (0.0%) |
| 5 to 17 Years | 67 (0.9%) | 24 (0.4%) |
| 18 to 34 Years | 141 (1.4%) | 124 (1.3%) |
| 35 to 64 Years | 167 (1.0%) | 230 (1.3%) |
| 65 to 74 Years | 138 (4.5%) | 108 (3.3%) |
| 75 Years and over | 193 (11.1%) | 160 (6.2%) |
Disability Class: Cognitive Difficulty
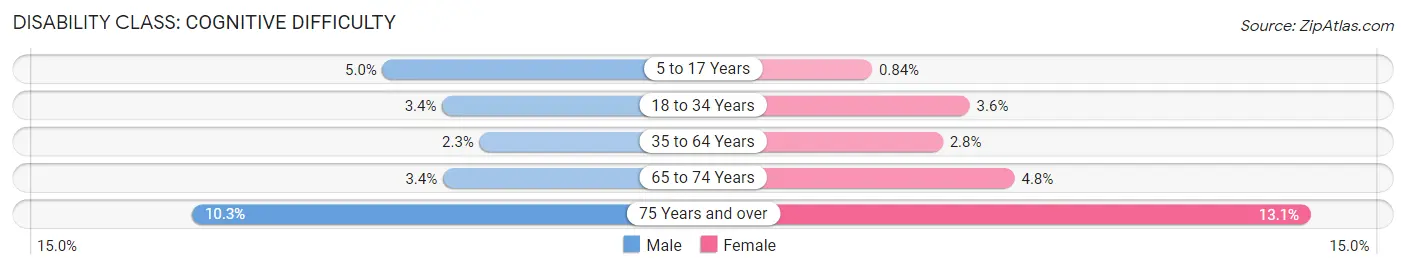
| Age Bracket | Male | Female |
| 5 to 17 Years | 361 (5.0%) | 53 (0.8%) |
| 18 to 34 Years | 349 (3.4%) | 343 (3.6%) |
| 35 to 64 Years | 381 (2.3%) | 485 (2.8%) |
| 65 to 74 Years | 103 (3.4%) | 158 (4.8%) |
| 75 Years and over | 180 (10.3%) | 337 (13.1%) |
Disability Class: Ambulatory Difficulty
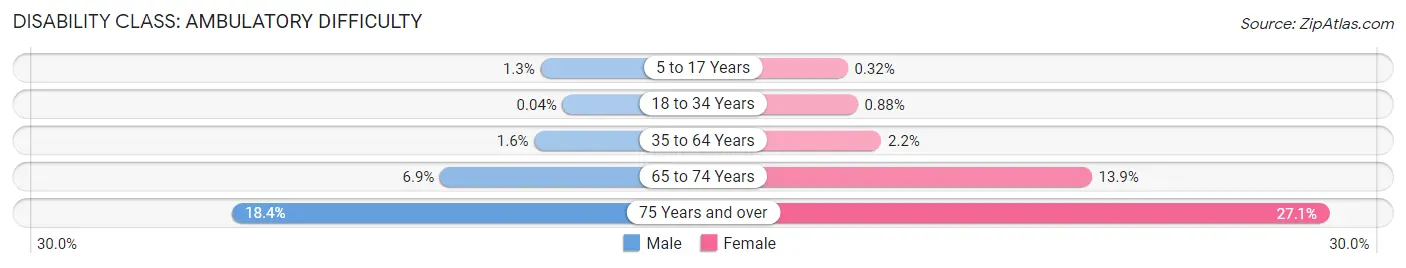
| Age Bracket | Male | Female |
| 5 to 17 Years | 91 (1.3%) | 20 (0.3%) |
| 18 to 34 Years | 4 (0.0%) | 85 (0.9%) |
| 35 to 64 Years | 264 (1.6%) | 379 (2.2%) |
| 65 to 74 Years | 211 (6.9%) | 457 (13.9%) |
| 75 Years and over | 321 (18.4%) | 700 (27.1%) |
Disability Class: Self-Care Difficulty
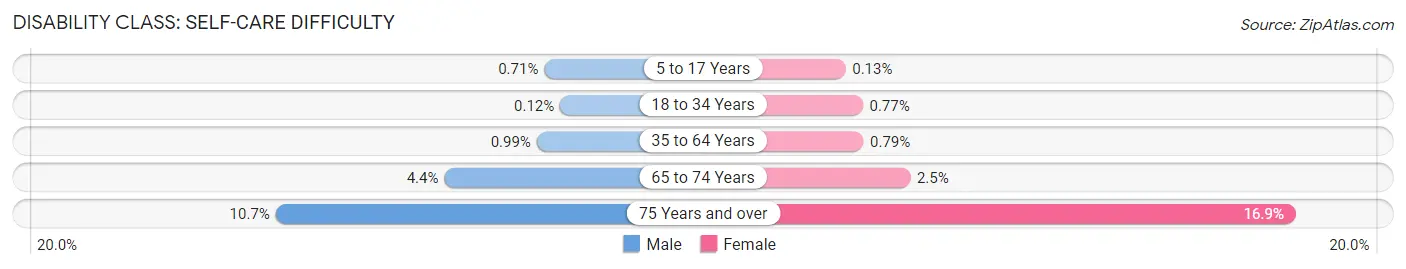
| Age Bracket | Male | Female |
| 5 to 17 Years | 51 (0.7%) | 8 (0.1%) |
| 18 to 34 Years | 12 (0.1%) | 74 (0.8%) |
| 35 to 64 Years | 162 (1.0%) | 136 (0.8%) |
| 65 to 74 Years | 136 (4.4%) | 83 (2.5%) |
| 75 Years and over | 186 (10.7%) | 435 (16.9%) |
Technology Access in Redwood City
Computing Device Access in Redwood City
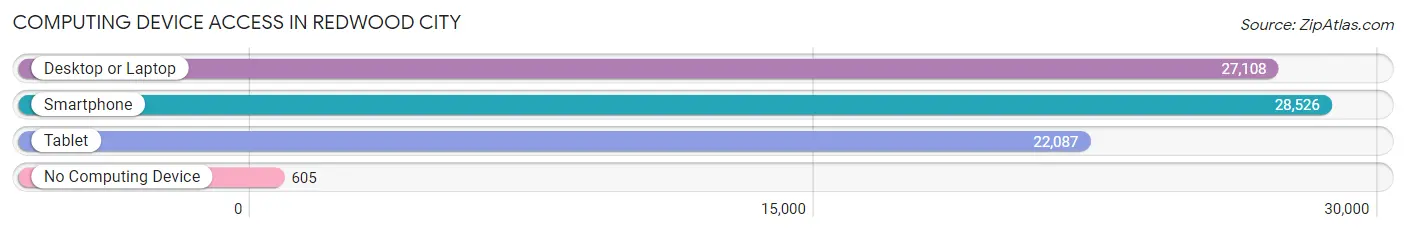
| Device Type | # Households | % Households |
| Desktop or Laptop | 27,108 | 90.4% |
| Smartphone | 28,526 | 95.1% |
| Tablet | 22,087 | 73.6% |
| No Computing Device | 605 | 2.0% |
| Total | 29,993 | 100.0% |
Internet Access in Redwood City
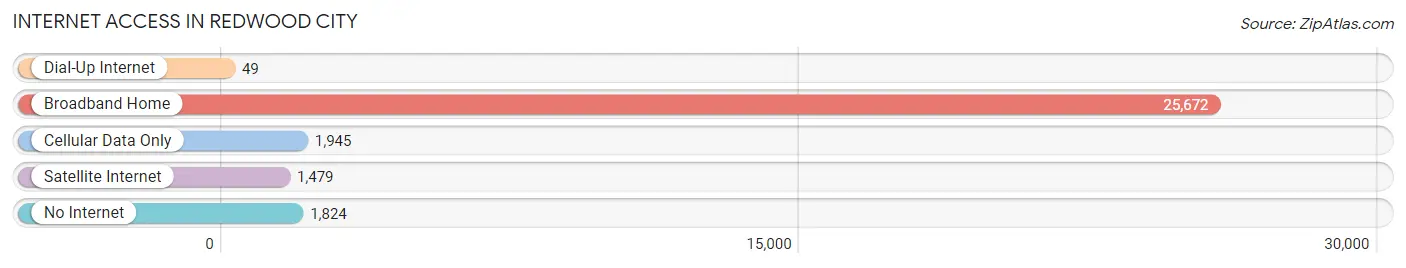
| Internet Type | # Households | % Households |
| Dial-Up Internet | 49 | 0.2% |
| Broadband Home | 25,672 | 85.6% |
| Cellular Data Only | 1,945 | 6.5% |
| Satellite Internet | 1,479 | 4.9% |
| No Internet | 1,824 | 6.1% |
| Total | 29,993 | 100.0% |
Redwood City Summary
Redwood City, California is a city located in San Mateo County, California, United States, approximately 27 miles south of San Francisco. It is the county seat of San Mateo County and the home of several technology companies such as Oracle, Electronic Arts, and Box. Redwood City is the third-largest city in the San Francisco Bay Area, with a population of approximately 85,000 people as of the 2010 census.
History
Redwood City was originally inhabited by the Ohlone people, who lived in the area for thousands of years before the arrival of Europeans. The first European settlers arrived in the area in the late 1700s, and the city was officially founded in 1867. The city was named after the redwood trees that were abundant in the area.
In the late 1800s, Redwood City became a major shipping port for lumber and other goods. The city was also home to several large industries, including a brickyard, a tannery, and a cannery.
In the early 1900s, Redwood City experienced a period of rapid growth, as the population increased from 1,500 in 1900 to over 10,000 by 1920. This growth was largely due to the city’s proximity to San Francisco and the development of the Southern Pacific Railroad.
In the 1950s, Redwood City experienced a period of suburbanization, as many people moved from San Francisco to the city. This trend continued into the 1960s and 1970s, and the population of Redwood City grew to over 70,000 by 1980.
Geography
Redwood City is located in the San Francisco Bay Area, approximately 27 miles south of San Francisco. The city is situated on the San Francisco Peninsula, between San Francisco Bay to the east and the Pacific Ocean to the west.
The city covers an area of approximately 28 square miles, and is bordered by San Carlos to the north, Woodside to the east, and Atherton to the south. The city is divided into several neighborhoods, including Downtown, Woodside Plaza, and Redwood Shores.
The city is home to several parks, including Red Morton Park, Edgewood Park, and Redwood Regional Park. The city is also home to several beaches, including Redwood Shores Beach, Redwood City Beach, and Redwood Creek Beach.
Economy
Redwood City is home to several major technology companies, including Oracle, Electronic Arts, and Box. The city is also home to several other businesses, including the headquarters of the San Mateo County Sheriff’s Office, the San Mateo County Health System, and the San Mateo County Superior Court.
The city’s economy is also supported by several industries, including retail, manufacturing, and healthcare. The city is home to several shopping centers, including Sequoia Station, Woodside Plaza, and Redwood City Town Center.
Demographics
As of the 2010 census, Redwood City had a population of 85,368 people. The racial makeup of the city was 57.2% White, 11.3% Asian, 10.2% Hispanic or Latino, 8.2% African American, 0.7% Native American, and 12.4% other.
The median household income in Redwood City was $90,837 in 2019, and the median home value was $1,092,000. The city’s poverty rate was 8.2%, and the unemployment rate was 3.2%.
Redwood City is served by the Redwood City School District, which includes 11 elementary schools, three middle schools, and two high schools. The city is also home to several private schools, including Sacred Heart Schools, St. Pius X Catholic School, and Redwood Christian Schools.
Common Questions
What is Per Capita Income in Redwood City?
Per Capita income in Redwood City is $77,982.
What is the Median Family Income in Redwood City?
Median Family Income in Redwood City is $164,255.
What is the Median Household income in Redwood City?
Median Household Income in Redwood City is $145,620.
What is Income or Wage Gap in Redwood City?
Income or Wage Gap in Redwood City is 19.3%.
Women in Redwood City earn 80.7 cents for every dollar earned by a man.
What is Family Income Deficit in Redwood City?
Family Income Deficit in Redwood City is $10,379.
Families that are below poverty line in Redwood City earn $10,379 less on average than the poverty threshold level.
What is Inequality or Gini Index in Redwood City?
Inequality or Gini Index in Redwood City is 0.49.
What is the Total Population of Redwood City?
Total Population of Redwood City is 83,077.
What is the Total Male Population of Redwood City?
Total Male Population of Redwood City is 41,443.
What is the Total Female Population of Redwood City?
Total Female Population of Redwood City is 41,634.
What is the Ratio of Males per 100 Females in Redwood City?
There are 99.54 Males per 100 Females in Redwood City.
What is the Ratio of Females per 100 Males in Redwood City?
There are 100.46 Females per 100 Males in Redwood City.
What is the Median Population Age in Redwood City?
Median Population Age in Redwood City is 37.1 Years.
What is the Average Family Size in Redwood City
Average Family Size in Redwood City is 3.3 People.
What is the Average Household Size in Redwood City
Average Household Size in Redwood City is 2.7 People.
How Large is the Labor Force in Redwood City?
There are 47,025 People in the Labor Forcein in Redwood City.
What is the Percentage of People in the Labor Force in Redwood City?
70.0% of People are in the Labor Force in Redwood City.
What is the Unemployment Rate in Redwood City?
Unemployment Rate in Redwood City is 3.9%.