Cities with the Highest Percentage of Population Employed in Computer, Engineering & Science in Tennessee
RELATED REPORTS & OPTIONS
Computer, Engineering & Science
Tennessee
Compare Cities
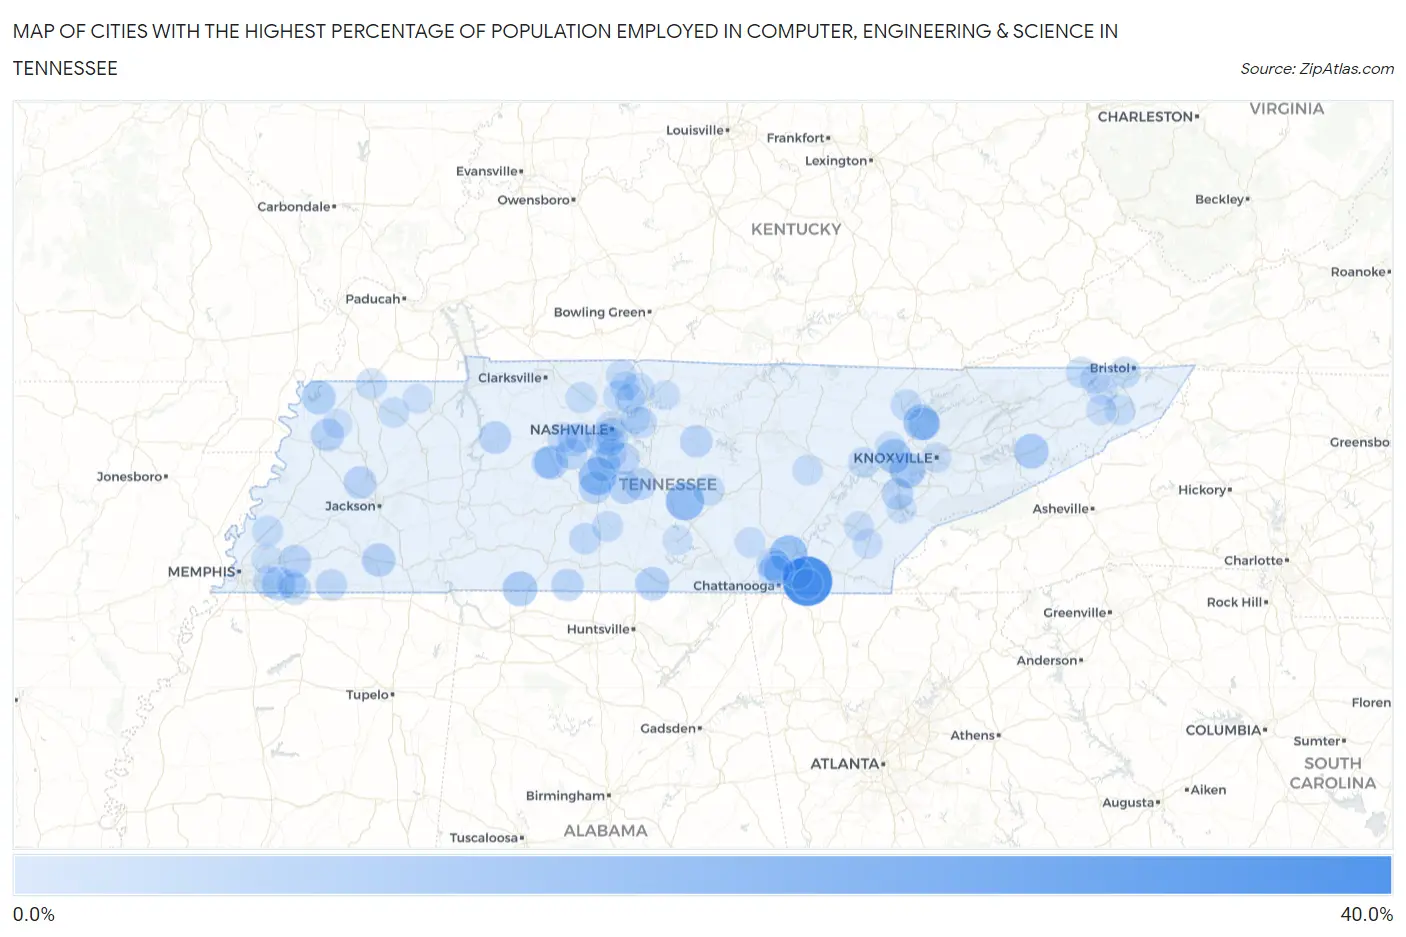
Map of Cities with the Highest Percentage of Population Employed in Computer, Engineering & Science in Tennessee
0.0%
40.0%
Cities with the Highest Percentage of Population Employed in Computer, Engineering & Science in Tennessee
| City | % Employed | vs State | vs National | |
| 1. | Ooltewah | 38.1% | 5.1%(+33.0)#1 | 6.8%(+31.3)#128 |
| 2. | Nixon | 37.8% | 5.1%(+32.8)#2 | 6.8%(+31.1)#131 |
| 3. | Taft | 29.3% | 5.1%(+24.3)#3 | 6.8%(+22.6)#232 |
| 4. | Norene | 26.5% | 5.1%(+21.5)#4 | 6.8%(+19.8)#297 |
| 5. | Dellrose | 24.3% | 5.1%(+19.2)#5 | 6.8%(+17.6)#350 |
| 6. | Sequatchie | 24.2% | 5.1%(+19.2)#6 | 6.8%(+17.5)#352 |
| 7. | Lakewood Park | 19.3% | 5.1%(+14.2)#7 | 6.8%(+12.5)#606 |
| 8. | Huron | 18.9% | 5.1%(+13.9)#8 | 6.8%(+12.2)#643 |
| 9. | Thompson S Station | 18.0% | 5.1%(+12.9)#9 | 6.8%(+11.2)#733 |
| 10. | Mowbray Mountain | 17.5% | 5.1%(+12.5)#10 | 6.8%(+10.8)#769 |
| 11. | Norris | 15.1% | 5.1%(+9.98)#11 | 6.8%(+8.30)#1,126 |
| 12. | Farragut | 14.8% | 5.1%(+9.67)#12 | 6.8%(+7.99)#1,187 |
| 13. | Parrottsville | 13.7% | 5.1%(+8.62)#13 | 6.8%(+6.93)#1,423 |
| 14. | Iron City | 13.6% | 5.1%(+8.56)#14 | 6.8%(+6.87)#1,440 |
| 15. | Oak Ridge | 13.1% | 5.1%(+7.97)#15 | 6.8%(+6.29)#1,612 |
| 16. | Holladay | 12.9% | 5.1%(+7.82)#16 | 6.8%(+6.14)#1,661 |
| 17. | Bon Aqua Junction | 12.6% | 5.1%(+7.52)#17 | 6.8%(+5.84)#1,751 |
| 18. | Collierville | 12.0% | 5.1%(+6.88)#18 | 6.8%(+5.20)#1,949 |
| 19. | Flintville | 11.9% | 5.1%(+6.85)#19 | 6.8%(+5.17)#1,966 |
| 20. | Samburg | 11.9% | 5.1%(+6.82)#20 | 6.8%(+5.14)#1,978 |
| 21. | John Sevier | 11.8% | 5.1%(+6.70)#21 | 6.8%(+5.01)#2,017 |
| 22. | Wildersville | 11.6% | 5.1%(+6.51)#22 | 6.8%(+4.83)#2,072 |
| 23. | Hornsby | 11.5% | 5.1%(+6.39)#23 | 6.8%(+4.71)#2,136 |
| 24. | Sullivan Gardens | 11.0% | 5.1%(+5.88)#24 | 6.8%(+4.20)#2,389 |
| 25. | Newbern | 10.9% | 5.1%(+5.81)#25 | 6.8%(+4.13)#2,421 |
| 26. | Franklin | 10.7% | 5.1%(+5.65)#26 | 6.8%(+3.97)#2,500 |
| 27. | Walnut Grove Cdp Sumner County | 10.6% | 5.1%(+5.54)#27 | 6.8%(+3.86)#2,565 |
| 28. | Eagleville | 10.6% | 5.1%(+5.53)#28 | 6.8%(+3.85)#2,571 |
| 29. | Berry Hill | 10.6% | 5.1%(+5.49)#29 | 6.8%(+3.81)#2,598 |
| 30. | Oakland | 10.5% | 5.1%(+5.44)#30 | 6.8%(+3.75)#2,630 |
| 31. | Belle Meade | 10.5% | 5.1%(+5.37)#31 | 6.8%(+3.69)#2,659 |
| 32. | Gadsden | 10.3% | 5.1%(+5.26)#32 | 6.8%(+3.58)#2,732 |
| 33. | Waverly | 10.2% | 5.1%(+5.08)#33 | 6.8%(+3.40)#2,839 |
| 34. | Andersonville | 10.2% | 5.1%(+5.08)#34 | 6.8%(+3.40)#2,844 |
| 35. | Alexandria | 10.0% | 5.1%(+4.88)#35 | 6.8%(+3.20)#2,973 |
| 36. | Kingston Springs | 9.9% | 5.1%(+4.83)#36 | 6.8%(+3.15)#3,000 |
| 37. | Spring Hill | 9.8% | 5.1%(+4.71)#37 | 6.8%(+3.03)#3,077 |
| 38. | Minor Hill | 9.7% | 5.1%(+4.65)#38 | 6.8%(+2.97)#3,131 |
| 39. | Randolph | 9.6% | 5.1%(+4.53)#39 | 6.8%(+2.85)#3,223 |
| 40. | Lone Oak | 9.6% | 5.1%(+4.52)#40 | 6.8%(+2.84)#3,235 |
| 41. | Rockvale | 9.6% | 5.1%(+4.51)#41 | 6.8%(+2.82)#3,242 |
| 42. | Rossville | 9.3% | 5.1%(+4.18)#42 | 6.8%(+2.49)#3,503 |
| 43. | Nolensville | 9.3% | 5.1%(+4.17)#43 | 6.8%(+2.49)#3,509 |
| 44. | Tellico Village | 9.1% | 5.1%(+4.01)#44 | 6.8%(+2.33)#3,622 |
| 45. | Lyles | 9.0% | 5.1%(+3.89)#45 | 6.8%(+2.20)#3,741 |
| 46. | Fairmount | 8.9% | 5.1%(+3.82)#46 | 6.8%(+2.13)#3,809 |
| 47. | Fairview | 8.8% | 5.1%(+3.73)#47 | 6.8%(+2.05)#3,898 |
| 48. | Gladeville | 8.7% | 5.1%(+3.63)#48 | 6.8%(+1.94)#3,968 |
| 49. | Lynnville | 8.7% | 5.1%(+3.59)#49 | 6.8%(+1.90)#4,008 |
| 50. | La Grange | 8.6% | 5.1%(+3.49)#50 | 6.8%(+1.81)#4,104 |
| 51. | Karns | 8.6% | 5.1%(+3.48)#51 | 6.8%(+1.80)#4,113 |
| 52. | Signal Mountain | 8.5% | 5.1%(+3.42)#52 | 6.8%(+1.73)#4,179 |
| 53. | Shiloh | 8.5% | 5.1%(+3.41)#53 | 6.8%(+1.73)#4,187 |
| 54. | Cottontown | 8.2% | 5.1%(+3.15)#54 | 6.8%(+1.46)#4,443 |
| 55. | Centertown | 8.2% | 5.1%(+3.13)#55 | 6.8%(+1.44)#4,466 |
| 56. | Orebank | 8.2% | 5.1%(+3.10)#56 | 6.8%(+1.42)#4,491 |
| 57. | Walnut Hill | 8.2% | 5.1%(+3.10)#57 | 6.8%(+1.42)#4,497 |
| 58. | Mount Juliet | 8.2% | 5.1%(+3.08)#58 | 6.8%(+1.40)#4,515 |
| 59. | Brentwood | 8.2% | 5.1%(+3.08)#59 | 6.8%(+1.40)#4,520 |
| 60. | Finley | 8.1% | 5.1%(+3.02)#60 | 6.8%(+1.33)#4,582 |
| 61. | Palmersville | 8.0% | 5.1%(+2.92)#61 | 6.8%(+1.24)#4,700 |
| 62. | Harriman | 8.0% | 5.1%(+2.91)#62 | 6.8%(+1.22)#4,719 |
| 63. | Jacksboro | 7.9% | 5.1%(+2.86)#63 | 6.8%(+1.17)#4,773 |
| 64. | Atoka | 7.9% | 5.1%(+2.79)#64 | 6.8%(+1.11)#4,859 |
| 65. | Germantown | 7.9% | 5.1%(+2.77)#65 | 6.8%(+1.09)#4,879 |
| 66. | Pleasant View | 7.8% | 5.1%(+2.73)#66 | 6.8%(+1.05)#4,929 |
| 67. | Pine Crest | 7.7% | 5.1%(+2.63)#67 | 6.8%(+0.942)#5,056 |
| 68. | Millersville | 7.6% | 5.1%(+2.56)#68 | 6.8%(+0.872)#5,153 |
| 69. | Mount Carmel | 7.6% | 5.1%(+2.48)#69 | 6.8%(+0.796)#5,231 |
| 70. | South Fulton | 7.5% | 5.1%(+2.42)#70 | 6.8%(+0.733)#5,298 |
| 71. | Lewisburg | 7.5% | 5.1%(+2.37)#71 | 6.8%(+0.686)#5,347 |
| 72. | Harrison | 7.3% | 5.1%(+2.26)#72 | 6.8%(+0.574)#5,496 |
| 73. | Dresden | 7.1% | 5.1%(+2.04)#73 | 6.8%(+0.354)#5,794 |
| 74. | White Bluff | 7.1% | 5.1%(+2.03)#74 | 6.8%(+0.341)#5,806 |
| 75. | Palmer | 7.1% | 5.1%(+2.02)#75 | 6.8%(+0.334)#5,815 |
| 76. | Big Rock | 7.1% | 5.1%(+1.99)#76 | 6.8%(+0.306)#5,855 |
| 77. | Lake Tansi | 7.0% | 5.1%(+1.94)#77 | 6.8%(+0.257)#5,926 |
| 78. | Cross Plains | 6.9% | 5.1%(+1.78)#78 | 6.8%(+0.093)#6,164 |
| 79. | Walden | 6.7% | 5.1%(+1.64)#79 | 6.8%(-0.041)#6,365 |
| 80. | Spurgeon | 6.7% | 5.1%(+1.59)#80 | 6.8%(-0.091)#6,431 |
| 81. | Nashville | 6.6% | 5.1%(+1.57)#81 | 6.8%(-0.118)#6,482 |
| 82. | Etowah | 6.6% | 5.1%(+1.51)#82 | 6.8%(-0.178)#6,570 |
| 83. | Knoxville | 6.6% | 5.1%(+1.47)#83 | 6.8%(-0.215)#6,620 |
| 84. | Pegram | 6.5% | 5.1%(+1.45)#84 | 6.8%(-0.236)#6,658 |
| 85. | Jonesborough | 6.4% | 5.1%(+1.35)#85 | 6.8%(-0.337)#6,813 |
| 86. | Kingsport | 6.4% | 5.1%(+1.32)#86 | 6.8%(-0.367)#6,861 |
| 87. | Athens | 6.3% | 5.1%(+1.27)#87 | 6.8%(-0.418)#6,958 |
| 88. | Shackle Island | 6.3% | 5.1%(+1.26)#88 | 6.8%(-0.423)#6,973 |
| 89. | Green Hill | 6.3% | 5.1%(+1.21)#89 | 6.8%(-0.471)#7,053 |
| 90. | Tullahoma | 6.3% | 5.1%(+1.20)#90 | 6.8%(-0.479)#7,068 |
| 91. | Trimble | 6.2% | 5.1%(+1.17)#91 | 6.8%(-0.515)#7,119 |
| 92. | Cottage Grove | 6.2% | 5.1%(+1.17)#92 | 6.8%(-0.515)#7,138 |
| 93. | Vonore | 6.2% | 5.1%(+1.14)#93 | 6.8%(-0.540)#7,165 |
| 94. | White House | 6.2% | 5.1%(+1.13)#94 | 6.8%(-0.551)#7,180 |
| 95. | Oliver Springs | 6.2% | 5.1%(+1.12)#95 | 6.8%(-0.564)#7,212 |
| 96. | Collegedale | 6.2% | 5.1%(+1.12)#96 | 6.8%(-0.569)#7,219 |
| 97. | Piperton | 6.1% | 5.1%(+1.05)#97 | 6.8%(-0.631)#7,334 |
| 98. | Oak Hill | 6.1% | 5.1%(+1.00)#98 | 6.8%(-0.683)#7,416 |
| 99. | Castalian Springs | 6.1% | 5.1%(+0.988)#99 | 6.8%(-0.695)#7,446 |
| 100. | Bartlett | 6.0% | 5.1%(+0.965)#100 | 6.8%(-0.719)#7,508 |
Common Questions
What are the Top 10 Cities with the Highest Percentage of Population Employed in Computer, Engineering & Science in Tennessee?
Top 10 Cities with the Highest Percentage of Population Employed in Computer, Engineering & Science in Tennessee are:
#1
38.1%
#2
19.3%
#3
18.0%
#4
17.5%
#5
15.1%
#6
14.8%
#7
13.7%
#8
13.6%
#9
13.1%
#10
12.6%
What city has the Highest Percentage of Population Employed in Computer, Engineering & Science in Tennessee?
Ooltewah has the Highest Percentage of Population Employed in Computer, Engineering & Science in Tennessee with 38.1%.
What is the Percentage of Population Employed in Computer, Engineering & Science in the State of Tennessee?
Percentage of Population Employed in Computer, Engineering & Science in Tennessee is 5.1%.
What is the Percentage of Population Employed in Computer, Engineering & Science in the United States?
Percentage of Population Employed in Computer, Engineering & Science in the United States is 6.8%.