Cities with the Highest Percentage of Population Employed in Computer, Engineering & Science in Mississippi
RELATED REPORTS & OPTIONS
Computer, Engineering & Science
Mississippi
Compare Cities
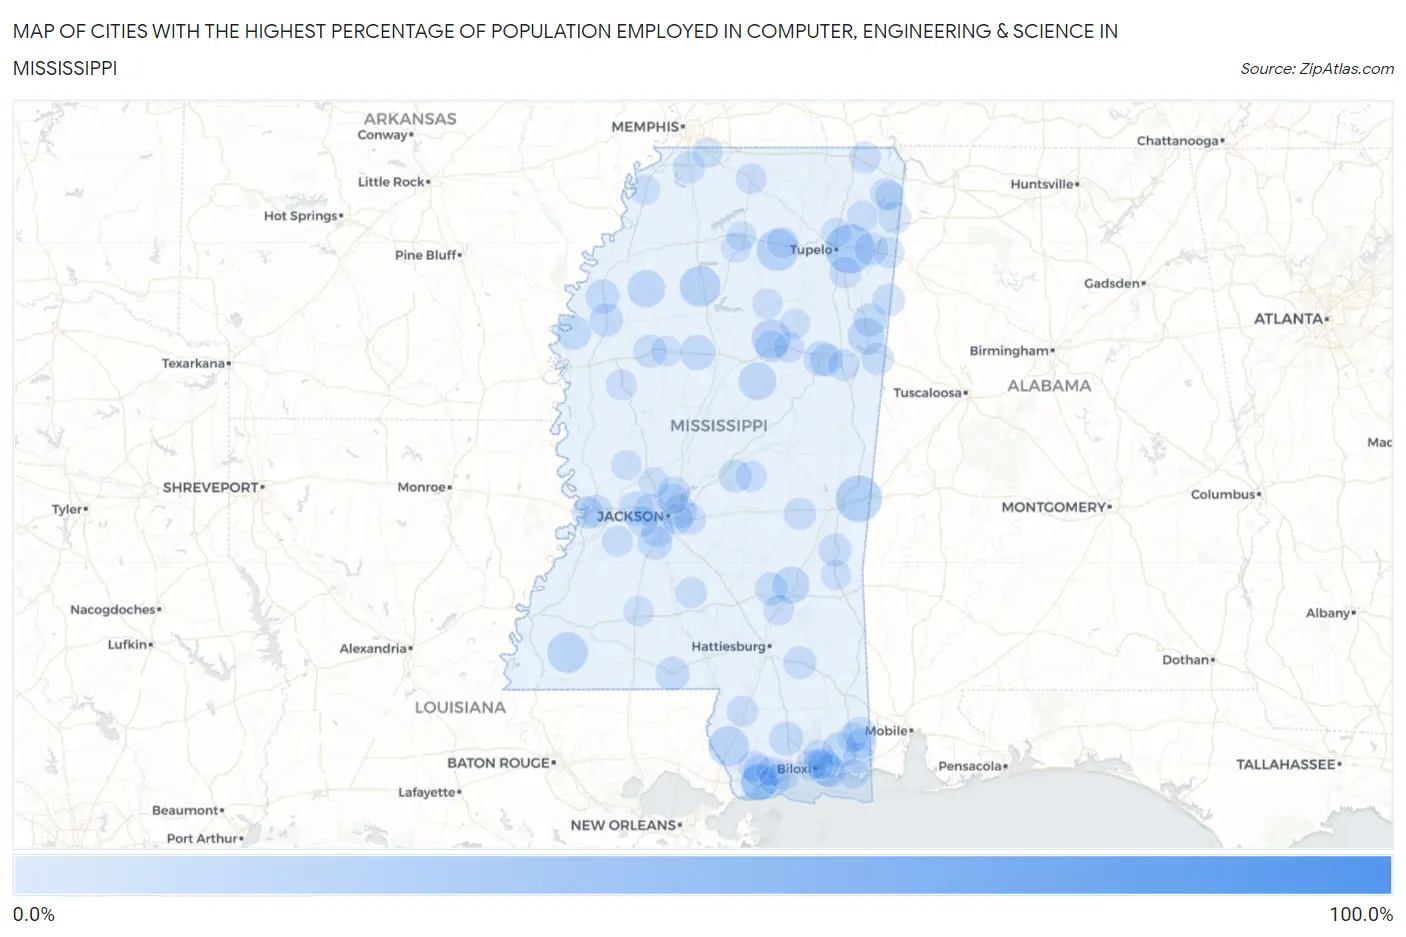
Map of Cities with the Highest Percentage of Population Employed in Computer, Engineering & Science in Mississippi
0.0%
100.0%
Cities with the Highest Percentage of Population Employed in Computer, Engineering & Science in Mississippi
| City | % Employed | vs State | vs National | |
| 1. | Red Banks | 100.0% | 3.5%(+96.5)#1 | 6.8%(+93.2)#11 |
| 2. | Bolivar | 95.8% | 3.5%(+92.3)#2 | 6.8%(+89.1)#25 |
| 3. | Benton | 56.8% | 3.5%(+53.2)#3 | 6.8%(+50.0)#48 |
| 4. | Harperville | 47.6% | 3.5%(+44.1)#4 | 6.8%(+40.9)#80 |
| 5. | Winterville | 44.4% | 3.5%(+40.9)#5 | 6.8%(+37.7)#93 |
| 6. | Mooreville | 25.2% | 3.5%(+21.7)#6 | 6.8%(+18.5)#327 |
| 7. | Toomsuba | 22.0% | 3.5%(+18.5)#7 | 6.8%(+15.2)#445 |
| 8. | Toccopola | 17.0% | 3.5%(+13.5)#8 | 6.8%(+10.3)#826 |
| 9. | Bogue Chitto Cdp Kemper And Neshoba Counties | 16.8% | 3.5%(+13.3)#9 | 6.8%(+10.0)#860 |
| 10. | Tillatoba | 15.8% | 3.5%(+12.3)#10 | 6.8%(+9.02)#991 |
| 11. | Hide A Way Lake | 15.4% | 3.5%(+11.8)#11 | 6.8%(+8.60)#1,073 |
| 12. | Crosby | 15.3% | 3.5%(+11.7)#12 | 6.8%(+8.49)#1,092 |
| 13. | Bond | 15.1% | 3.5%(+11.5)#13 | 6.8%(+8.30)#1,123 |
| 14. | Walthall | 13.9% | 3.5%(+10.4)#14 | 6.8%(+7.12)#1,362 |
| 15. | French Camp | 12.2% | 3.5%(+8.69)#15 | 6.8%(+5.46)#1,876 |
| 16. | Sumner | 12.0% | 3.5%(+8.47)#16 | 6.8%(+5.24)#1,939 |
| 17. | Columbus Afb | 11.3% | 3.5%(+7.78)#17 | 6.8%(+4.54)#2,217 |
| 18. | Bay St Louis | 11.1% | 3.5%(+7.60)#18 | 6.8%(+4.36)#2,302 |
| 19. | Sharon | 11.1% | 3.5%(+7.57)#19 | 6.8%(+4.34)#2,328 |
| 20. | Waveland | 10.9% | 3.5%(+7.33)#20 | 6.8%(+4.10)#2,437 |
| 21. | Vancleave | 10.0% | 3.5%(+6.44)#21 | 6.8%(+3.20)#2,970 |
| 22. | Starkville | 9.4% | 3.5%(+5.90)#22 | 6.8%(+2.66)#3,370 |
| 23. | Carrollton | 9.4% | 3.5%(+5.85)#23 | 6.8%(+2.61)#3,412 |
| 24. | Ocean Springs | 9.3% | 3.5%(+5.75)#24 | 6.8%(+2.51)#3,488 |
| 25. | Bolton | 9.0% | 3.5%(+5.46)#25 | 6.8%(+2.23)#3,719 |
| 26. | Benoit | 8.9% | 3.5%(+5.40)#26 | 6.8%(+2.16)#3,775 |
| 27. | Terry | 8.6% | 3.5%(+5.09)#27 | 6.8%(+1.86)#4,047 |
| 28. | Saucier | 8.4% | 3.5%(+4.89)#28 | 6.8%(+1.66)#4,242 |
| 29. | Winstonville | 8.3% | 3.5%(+4.80)#29 | 6.8%(+1.57)#4,336 |
| 30. | Tylertown | 7.9% | 3.5%(+4.39)#30 | 6.8%(+1.15)#4,806 |
| 31. | Hurley | 7.9% | 3.5%(+4.33)#31 | 6.8%(+1.09)#4,871 |
| 32. | Hamilton | 7.8% | 3.5%(+4.30)#32 | 6.8%(+1.06)#4,903 |
| 33. | Bogue Chitto | 7.8% | 3.5%(+4.26)#33 | 6.8%(+1.02)#4,956 |
| 34. | Cleveland | 7.8% | 3.5%(+4.23)#34 | 6.8%(+0.996)#4,988 |
| 35. | Gulf Park Estates | 7.5% | 3.5%(+4.01)#35 | 6.8%(+0.774)#5,259 |
| 36. | Fulton | 7.4% | 3.5%(+3.82)#36 | 6.8%(+0.587)#5,476 |
| 37. | Mississippi Valley State University | 7.3% | 3.5%(+3.78)#37 | 6.8%(+0.544)#5,527 |
| 38. | Flowood | 7.3% | 3.5%(+3.75)#38 | 6.8%(+0.515)#5,561 |
| 39. | New Augusta | 7.1% | 3.5%(+3.55)#39 | 6.8%(+0.311)#5,850 |
| 40. | Mississippi State | 7.0% | 3.5%(+3.52)#40 | 6.8%(+0.285)#5,884 |
| 41. | Byram | 7.0% | 3.5%(+3.50)#41 | 6.8%(+0.268)#5,915 |
| 42. | Quitman | 7.0% | 3.5%(+3.49)#42 | 6.8%(+0.253)#5,930 |
| 43. | Lena | 7.0% | 3.5%(+3.49)#43 | 6.8%(+0.253)#5,934 |
| 44. | Diamondhead | 7.0% | 3.5%(+3.44)#44 | 6.8%(+0.209)#5,991 |
| 45. | Soso | 6.8% | 3.5%(+3.23)#45 | 6.8%(-0.008)#6,321 |
| 46. | Beechwood | 6.8% | 3.5%(+3.23)#46 | 6.8%(-0.011)#6,330 |
| 47. | Gattman | 6.7% | 3.5%(+3.14)#47 | 6.8%(-0.098)#6,456 |
| 48. | Golden | 6.4% | 3.5%(+2.89)#48 | 6.8%(-0.343)#6,827 |
| 49. | Madison | 6.4% | 3.5%(+2.82)#49 | 6.8%(-0.411)#6,941 |
| 50. | Eupora | 6.2% | 3.5%(+2.71)#50 | 6.8%(-0.526)#7,147 |
| 51. | New Hope | 6.2% | 3.5%(+2.68)#51 | 6.8%(-0.557)#7,196 |
| 52. | Vicksburg | 6.2% | 3.5%(+2.65)#52 | 6.8%(-0.588)#7,254 |
| 53. | Hickory | 6.1% | 3.5%(+2.62)#53 | 6.8%(-0.619)#7,314 |
| 54. | Clinton | 6.1% | 3.5%(+2.59)#54 | 6.8%(-0.647)#7,357 |
| 55. | Farmington | 6.1% | 3.5%(+2.55)#55 | 6.8%(-0.689)#7,434 |
| 56. | Hernando | 6.1% | 3.5%(+2.53)#56 | 6.8%(-0.709)#7,489 |
| 57. | Brandon | 5.9% | 3.5%(+2.38)#57 | 6.8%(-0.852)#7,753 |
| 58. | Paden | 5.7% | 3.5%(+2.19)#58 | 6.8%(-1.05)#8,156 |
| 59. | Kiln | 5.6% | 3.5%(+2.09)#59 | 6.8%(-1.14)#8,301 |
| 60. | Nettleton | 5.6% | 3.5%(+2.06)#60 | 6.8%(-1.18)#8,357 |
| 61. | Helena | 5.5% | 3.5%(+2.00)#61 | 6.8%(-1.24)#8,474 |
| 62. | Gulf Hills | 5.5% | 3.5%(+1.97)#62 | 6.8%(-1.27)#8,527 |
| 63. | Artesia | 5.5% | 3.5%(+1.94)#63 | 6.8%(-1.30)#8,593 |
| 64. | Biloxi | 5.3% | 3.5%(+1.76)#64 | 6.8%(-1.47)#8,946 |
| 65. | Tremont | 5.2% | 3.5%(+1.69)#65 | 6.8%(-1.55)#9,099 |
| 66. | Poplarville | 5.1% | 3.5%(+1.61)#66 | 6.8%(-1.62)#9,254 |
| 67. | Utica | 5.1% | 3.5%(+1.59)#67 | 6.8%(-1.64)#9,297 |
| 68. | Marietta | 5.0% | 3.5%(+1.47)#68 | 6.8%(-1.76)#9,586 |
| 69. | New Hebron | 5.0% | 3.5%(+1.44)#69 | 6.8%(-1.79)#9,648 |
| 70. | Walnut Grove | 4.9% | 3.5%(+1.41)#70 | 6.8%(-1.83)#9,713 |
| 71. | Pearl | 4.9% | 3.5%(+1.40)#71 | 6.8%(-1.84)#9,731 |
| 72. | Thaxton | 4.9% | 3.5%(+1.36)#72 | 6.8%(-1.87)#9,802 |
| 73. | Holly Springs | 4.7% | 3.5%(+1.16)#73 | 6.8%(-2.07)#10,253 |
| 74. | Latimer | 4.7% | 3.5%(+1.13)#74 | 6.8%(-2.11)#10,334 |
| 75. | Isola | 4.6% | 3.5%(+1.11)#75 | 6.8%(-2.12)#10,375 |
| 76. | Big Point | 4.6% | 3.5%(+1.11)#76 | 6.8%(-2.13)#10,393 |
| 77. | Mathiston | 4.6% | 3.5%(+1.10)#77 | 6.8%(-2.14)#10,417 |
| 78. | Pass Christian | 4.6% | 3.5%(+1.08)#78 | 6.8%(-2.16)#10,462 |
| 79. | Ridgeland | 4.6% | 3.5%(+1.04)#79 | 6.8%(-2.19)#10,528 |
| 80. | Ellisville | 4.5% | 3.5%(+0.957)#80 | 6.8%(-2.28)#10,733 |
| 81. | St Martin | 4.5% | 3.5%(+0.922)#81 | 6.8%(-2.31)#10,808 |
| 82. | Flora | 4.4% | 3.5%(+0.844)#82 | 6.8%(-2.39)#11,002 |
| 83. | Long Beach | 4.4% | 3.5%(+0.837)#83 | 6.8%(-2.40)#11,018 |
| 84. | Raymond | 4.3% | 3.5%(+0.774)#84 | 6.8%(-2.46)#11,167 |
| 85. | Brookhaven | 4.2% | 3.5%(+0.695)#85 | 6.8%(-2.54)#11,384 |
| 86. | Wade | 4.2% | 3.5%(+0.686)#86 | 6.8%(-2.55)#11,409 |
| 87. | Calhoun City | 4.2% | 3.5%(+0.626)#87 | 6.8%(-2.61)#11,581 |
| 88. | Greenwood | 4.1% | 3.5%(+0.608)#88 | 6.8%(-2.63)#11,617 |
| 89. | Eudora | 4.1% | 3.5%(+0.581)#89 | 6.8%(-2.66)#11,682 |
| 90. | Shubuta | 4.1% | 3.5%(+0.581)#90 | 6.8%(-2.66)#11,683 |
| 91. | Tishomingo | 4.1% | 3.5%(+0.525)#91 | 6.8%(-2.71)#11,823 |
| 92. | Olive Branch | 4.0% | 3.5%(+0.508)#92 | 6.8%(-2.73)#11,878 |
| 93. | Taylor | 4.0% | 3.5%(+0.504)#93 | 6.8%(-2.73)#11,895 |
| 94. | Mantee | 4.0% | 3.5%(+0.428)#94 | 6.8%(-2.81)#12,088 |
| 95. | Oxford | 3.9% | 3.5%(+0.390)#95 | 6.8%(-2.85)#12,199 |
| 96. | Tunica | 3.8% | 3.5%(+0.293)#96 | 6.8%(-2.94)#12,475 |
| 97. | Pascagoula | 3.7% | 3.5%(+0.209)#97 | 6.8%(-3.03)#12,709 |
| 98. | Satartia | 3.7% | 3.5%(+0.175)#98 | 6.8%(-3.06)#12,825 |
| 99. | Saltillo | 3.7% | 3.5%(+0.153)#99 | 6.8%(-3.08)#12,857 |
| 100. | Delisle | 3.7% | 3.5%(+0.148)#100 | 6.8%(-3.09)#12,876 |
Common Questions
What are the Top 10 Cities with the Highest Percentage of Population Employed in Computer, Engineering & Science in Mississippi?
Top 10 Cities with the Highest Percentage of Population Employed in Computer, Engineering & Science in Mississippi are:
#1
25.2%
#2
22.0%
#3
17.0%
#4
15.8%
#5
15.4%
#6
15.3%
#7
13.9%
#8
12.2%
#9
12.0%
#10
11.3%
What city has the Highest Percentage of Population Employed in Computer, Engineering & Science in Mississippi?
Mooreville has the Highest Percentage of Population Employed in Computer, Engineering & Science in Mississippi with 25.2%.
What is the Percentage of Population Employed in Computer, Engineering & Science in the State of Mississippi?
Percentage of Population Employed in Computer, Engineering & Science in Mississippi is 3.5%.
What is the Percentage of Population Employed in Computer, Engineering & Science in the United States?
Percentage of Population Employed in Computer, Engineering & Science in the United States is 6.8%.