Cities with the Highest Percentage of Population Employed in Computer, Engineering & Science in Maryland
RELATED REPORTS & OPTIONS
Computer, Engineering & Science
Maryland
Compare Cities
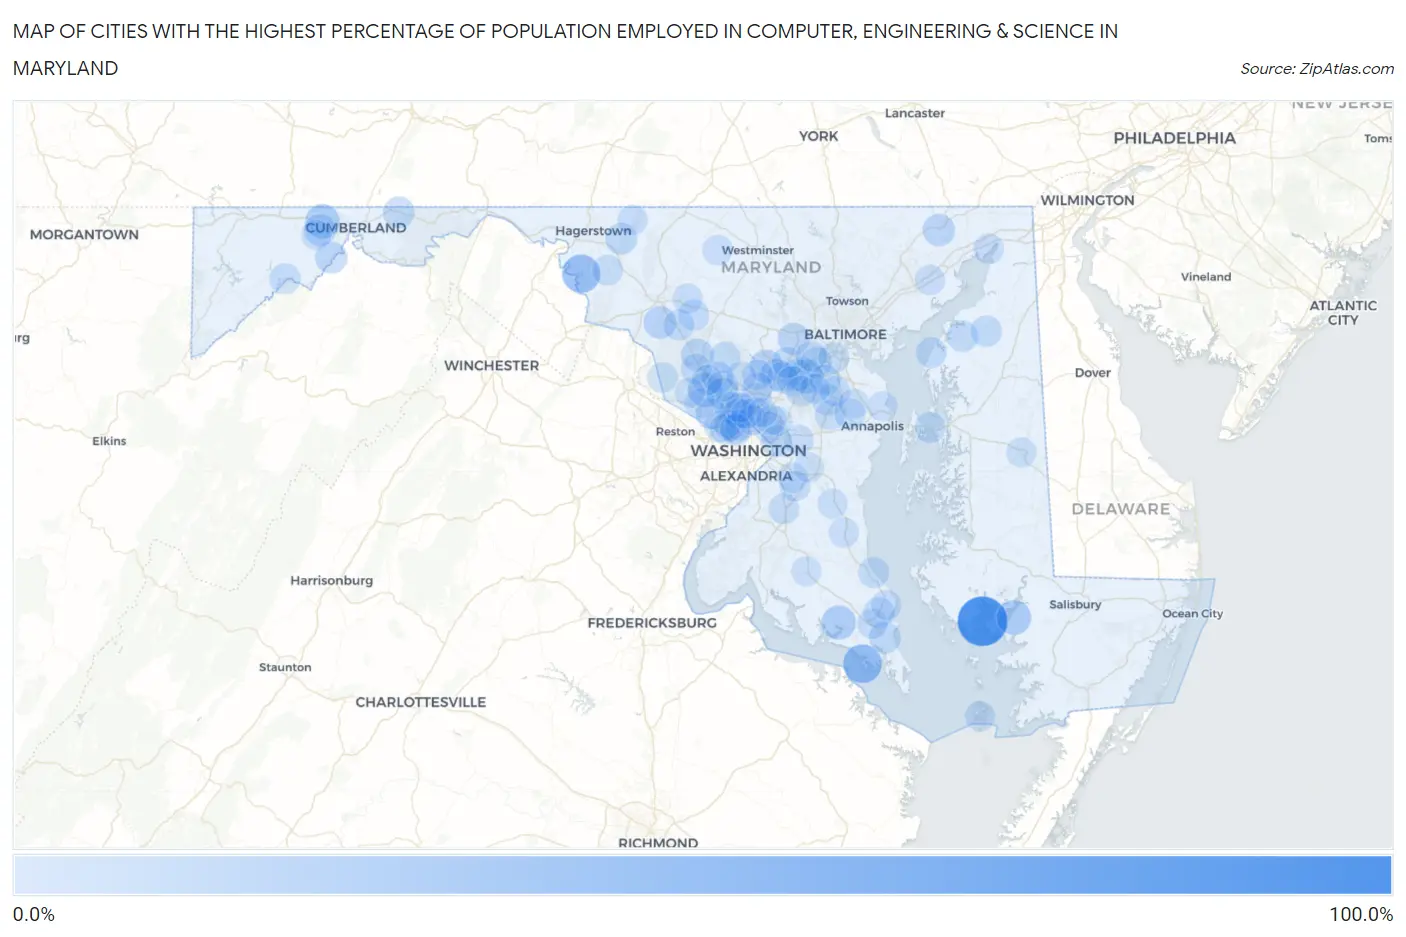
Map of Cities with the Highest Percentage of Population Employed in Computer, Engineering & Science in Maryland
0.0%
100.0%
Cities with the Highest Percentage of Population Employed in Computer, Engineering & Science in Maryland
| City | % Employed | vs State | vs National | |
| 1. | Elliott | 100.0% | 10.7%(+89.3)#1 | 6.8%(+93.2)#17 |
| 2. | Tall Timbers | 50.4% | 10.7%(+39.7)#2 | 6.8%(+43.6)#68 |
| 3. | Mercersville | 48.2% | 10.7%(+37.5)#3 | 6.8%(+41.4)#76 |
| 4. | Tyaskin | 33.3% | 10.7%(+22.7)#4 | 6.8%(+26.6)#164 |
| 5. | Jessup | 32.4% | 10.7%(+21.8)#5 | 6.8%(+25.7)#179 |
| 6. | Zihlman | 31.7% | 10.7%(+21.0)#6 | 6.8%(+24.9)#188 |
| 7. | Leonardtown | 31.1% | 10.7%(+20.4)#7 | 6.8%(+24.4)#200 |
| 8. | North Potomac | 31.0% | 10.7%(+20.3)#8 | 6.8%(+24.3)#204 |
| 9. | Wildewood | 26.7% | 10.7%(+16.0)#9 | 6.8%(+19.9)#295 |
| 10. | Highland | 26.1% | 10.7%(+15.4)#10 | 6.8%(+19.3)#305 |
| 11. | Callaway | 25.3% | 10.7%(+14.6)#11 | 6.8%(+18.5)#326 |
| 12. | Buckeystown | 24.4% | 10.7%(+13.7)#12 | 6.8%(+17.6)#347 |
| 13. | Clarksburg | 24.1% | 10.7%(+13.5)#13 | 6.8%(+17.4)#357 |
| 14. | Fulton | 23.7% | 10.7%(+13.1)#14 | 6.8%(+17.0)#370 |
| 15. | Lewistown | 23.1% | 10.7%(+12.5)#15 | 6.8%(+16.4)#389 |
| 16. | Darlington | 22.8% | 10.7%(+12.1)#16 | 6.8%(+16.0)#411 |
| 17. | Garrett Park | 22.0% | 10.7%(+11.4)#17 | 6.8%(+15.3)#442 |
| 18. | Bier | 22.0% | 10.7%(+11.3)#18 | 6.8%(+15.2)#447 |
| 19. | Ellicott City | 21.9% | 10.7%(+11.2)#19 | 6.8%(+15.2)#450 |
| 20. | Grahamtown | 21.5% | 10.7%(+10.8)#20 | 6.8%(+14.7)#473 |
| 21. | Washington Grove | 21.2% | 10.7%(+10.5)#21 | 6.8%(+14.4)#492 |
| 22. | Rockville | 21.1% | 10.7%(+10.4)#22 | 6.8%(+14.4)#497 |
| 23. | Savage | 21.0% | 10.7%(+10.3)#23 | 6.8%(+14.3)#504 |
| 24. | Jugtown | 20.8% | 10.7%(+10.1)#24 | 6.8%(+14.0)#520 |
| 25. | Lexington Park | 20.5% | 10.7%(+9.80)#25 | 6.8%(+13.7)#535 |
| 26. | Flintstone | 20.0% | 10.7%(+9.32)#26 | 6.8%(+13.2)#551 |
| 27. | Butlertown | 19.5% | 10.7%(+8.86)#27 | 6.8%(+12.8)#588 |
| 28. | Cabin John | 19.4% | 10.7%(+8.73)#28 | 6.8%(+12.6)#600 |
| 29. | Kennedyville | 19.2% | 10.7%(+8.55)#29 | 6.8%(+12.5)#611 |
| 30. | University Park | 19.0% | 10.7%(+8.30)#30 | 6.8%(+12.2)#639 |
| 31. | North Bethesda | 18.9% | 10.7%(+8.24)#31 | 6.8%(+12.2)#647 |
| 32. | Derwood | 18.6% | 10.7%(+7.88)#32 | 6.8%(+11.8)#672 |
| 33. | Calvert Beach | 18.4% | 10.7%(+7.77)#33 | 6.8%(+11.7)#684 |
| 34. | Scaggsville | 18.4% | 10.7%(+7.76)#34 | 6.8%(+11.7)#686 |
| 35. | Friendship Heights Village | 18.4% | 10.7%(+7.74)#35 | 6.8%(+11.7)#688 |
| 36. | Columbia | 18.4% | 10.7%(+7.73)#36 | 6.8%(+11.6)#689 |
| 37. | Cheverly | 18.4% | 10.7%(+7.69)#37 | 6.8%(+11.6)#695 |
| 38. | Elkridge | 18.3% | 10.7%(+7.61)#38 | 6.8%(+11.5)#704 |
| 39. | Solomons | 18.2% | 10.7%(+7.52)#39 | 6.8%(+11.4)#707 |
| 40. | Odenton | 18.2% | 10.7%(+7.51)#40 | 6.8%(+11.4)#709 |
| 41. | Bethesda | 18.1% | 10.7%(+7.40)#41 | 6.8%(+11.3)#720 |
| 42. | Ilchester | 18.1% | 10.7%(+7.38)#42 | 6.8%(+11.3)#723 |
| 43. | South Kensington | 17.9% | 10.7%(+7.19)#43 | 6.8%(+11.1)#742 |
| 44. | Linthicum | 17.8% | 10.7%(+7.14)#44 | 6.8%(+11.0)#745 |
| 45. | Bloomington | 17.7% | 10.7%(+7.07)#45 | 6.8%(+11.0)#753 |
| 46. | Monrovia | 17.7% | 10.7%(+7.03)#46 | 6.8%(+10.9)#755 |
| 47. | Laytonsville | 17.6% | 10.7%(+6.95)#47 | 6.8%(+10.9)#761 |
| 48. | Potomac | 17.6% | 10.7%(+6.90)#48 | 6.8%(+10.8)#767 |
| 49. | Kent Narrows | 17.5% | 10.7%(+6.80)#49 | 6.8%(+10.7)#779 |
| 50. | Severn | 17.3% | 10.7%(+6.63)#50 | 6.8%(+10.5)#796 |
| 51. | Lisbon | 17.1% | 10.7%(+6.47)#51 | 6.8%(+10.4)#814 |
| 52. | Urbana | 17.1% | 10.7%(+6.46)#52 | 6.8%(+10.4)#815 |
| 53. | Crownsville | 17.1% | 10.7%(+6.44)#53 | 6.8%(+10.3)#819 |
| 54. | Tolchester | 17.1% | 10.7%(+6.42)#54 | 6.8%(+10.3)#821 |
| 55. | North Laurel | 16.7% | 10.7%(+6.06)#55 | 6.8%(+9.97)#865 |
| 56. | Colesville | 16.7% | 10.7%(+6.04)#56 | 6.8%(+9.95)#867 |
| 57. | Chevy Chase Section Three | 16.7% | 10.7%(+5.99)#57 | 6.8%(+9.90)#871 |
| 58. | Travilah | 16.6% | 10.7%(+5.94)#58 | 6.8%(+9.85)#883 |
| 59. | Maryland City | 16.5% | 10.7%(+5.86)#59 | 6.8%(+9.77)#888 |
| 60. | Gambrills | 16.5% | 10.7%(+5.79)#60 | 6.8%(+9.70)#897 |
| 61. | California | 16.1% | 10.7%(+5.41)#61 | 6.8%(+9.32)#947 |
| 62. | Germantown | 16.0% | 10.7%(+5.37)#62 | 6.8%(+9.28)#955 |
| 63. | Brandywine | 15.8% | 10.7%(+5.15)#63 | 6.8%(+9.06)#987 |
| 64. | Gaithersburg | 15.8% | 10.7%(+5.10)#64 | 6.8%(+9.01)#992 |
| 65. | Poolesville | 15.7% | 10.7%(+5.02)#65 | 6.8%(+8.93)#1,006 |
| 66. | Ashton Sandy Spring | 15.7% | 10.7%(+5.01)#66 | 6.8%(+8.92)#1,009 |
| 67. | Boonsboro | 15.6% | 10.7%(+4.95)#67 | 6.8%(+8.86)#1,015 |
| 68. | Melwood | 15.5% | 10.7%(+4.83)#68 | 6.8%(+8.74)#1,035 |
| 69. | Smith Island | 15.5% | 10.7%(+4.81)#69 | 6.8%(+8.72)#1,039 |
| 70. | Charlestown | 15.5% | 10.7%(+4.78)#70 | 6.8%(+8.69)#1,047 |
| 71. | Linganore | 15.4% | 10.7%(+4.69)#71 | 6.8%(+8.60)#1,072 |
| 72. | Glen Echo | 15.3% | 10.7%(+4.65)#72 | 6.8%(+8.56)#1,079 |
| 73. | Four Corners | 15.3% | 10.7%(+4.58)#73 | 6.8%(+8.50)#1,090 |
| 74. | Cloverly | 15.2% | 10.7%(+4.50)#74 | 6.8%(+8.41)#1,104 |
| 75. | Lusby | 15.0% | 10.7%(+4.37)#75 | 6.8%(+8.28)#1,131 |
| 76. | Crofton | 14.9% | 10.7%(+4.26)#76 | 6.8%(+8.18)#1,153 |
| 77. | Rosaryville | 14.9% | 10.7%(+4.25)#77 | 6.8%(+8.16)#1,155 |
| 78. | Somerset | 14.9% | 10.7%(+4.18)#78 | 6.8%(+8.09)#1,167 |
| 79. | Mitchellville | 14.7% | 10.7%(+4.00)#79 | 6.8%(+7.91)#1,204 |
| 80. | Green Valley | 14.7% | 10.7%(+3.99)#80 | 6.8%(+7.91)#1,205 |
| 81. | Union Bridge | 14.6% | 10.7%(+3.96)#81 | 6.8%(+7.87)#1,209 |
| 82. | Dunkirk | 14.6% | 10.7%(+3.93)#82 | 6.8%(+7.84)#1,217 |
| 83. | Silver Spring | 14.6% | 10.7%(+3.92)#83 | 6.8%(+7.83)#1,218 |
| 84. | Huntingtown | 14.6% | 10.7%(+3.91)#84 | 6.8%(+7.82)#1,219 |
| 85. | Edgemont | 14.4% | 10.7%(+3.71)#85 | 6.8%(+7.62)#1,247 |
| 86. | Riverside | 14.4% | 10.7%(+3.71)#86 | 6.8%(+7.62)#1,248 |
| 87. | West Denton | 14.3% | 10.7%(+3.61)#87 | 6.8%(+7.52)#1,277 |
| 88. | North Kensington | 14.2% | 10.7%(+3.56)#88 | 6.8%(+7.47)#1,287 |
| 89. | Forest Glen | 14.2% | 10.7%(+3.49)#89 | 6.8%(+7.40)#1,295 |
| 90. | Marlboro Village | 14.0% | 10.7%(+3.35)#90 | 6.8%(+7.26)#1,328 |
| 91. | Charlotte Hall | 14.0% | 10.7%(+3.33)#91 | 6.8%(+7.24)#1,334 |
| 92. | Herald Harbor | 13.8% | 10.7%(+3.16)#92 | 6.8%(+7.07)#1,385 |
| 93. | Berwyn Heights | 13.8% | 10.7%(+3.10)#93 | 6.8%(+7.01)#1,402 |
| 94. | Darnestown | 13.7% | 10.7%(+3.07)#94 | 6.8%(+6.98)#1,409 |
| 95. | Fort Meade | 13.7% | 10.7%(+3.04)#95 | 6.8%(+6.95)#1,417 |
| 96. | Cape St Claire | 13.7% | 10.7%(+3.00)#96 | 6.8%(+6.91)#1,430 |
| 97. | Shaft | 13.6% | 10.7%(+2.96)#97 | 6.8%(+6.87)#1,439 |
| 98. | College Park | 13.5% | 10.7%(+2.87)#98 | 6.8%(+6.78)#1,470 |
| 99. | Hillandale | 13.5% | 10.7%(+2.86)#99 | 6.8%(+6.77)#1,474 |
| 100. | Olney | 13.5% | 10.7%(+2.78)#100 | 6.8%(+6.69)#1,499 |
Common Questions
What are the Top 10 Cities with the Highest Percentage of Population Employed in Computer, Engineering & Science in Maryland?
Top 10 Cities with the Highest Percentage of Population Employed in Computer, Engineering & Science in Maryland are:
#1
100.0%
#2
50.4%
#3
48.2%
#4
33.3%
#5
32.4%
#6
31.7%
#7
31.1%
#8
31.0%
#9
26.1%
#10
24.4%
What city has the Highest Percentage of Population Employed in Computer, Engineering & Science in Maryland?
Elliott has the Highest Percentage of Population Employed in Computer, Engineering & Science in Maryland with 100.0%.
What is the Percentage of Population Employed in Computer, Engineering & Science in the State of Maryland?
Percentage of Population Employed in Computer, Engineering & Science in Maryland is 10.7%.
What is the Percentage of Population Employed in Computer, Engineering & Science in the United States?
Percentage of Population Employed in Computer, Engineering & Science in the United States is 6.8%.