Zip Codes with the Highest Percentage of Population Employed in Computer, Engineering & Science in Porterville, CA
RELATED REPORTS & OPTIONS
Computer, Engineering & Science
Porterville
Compare Zip Codes
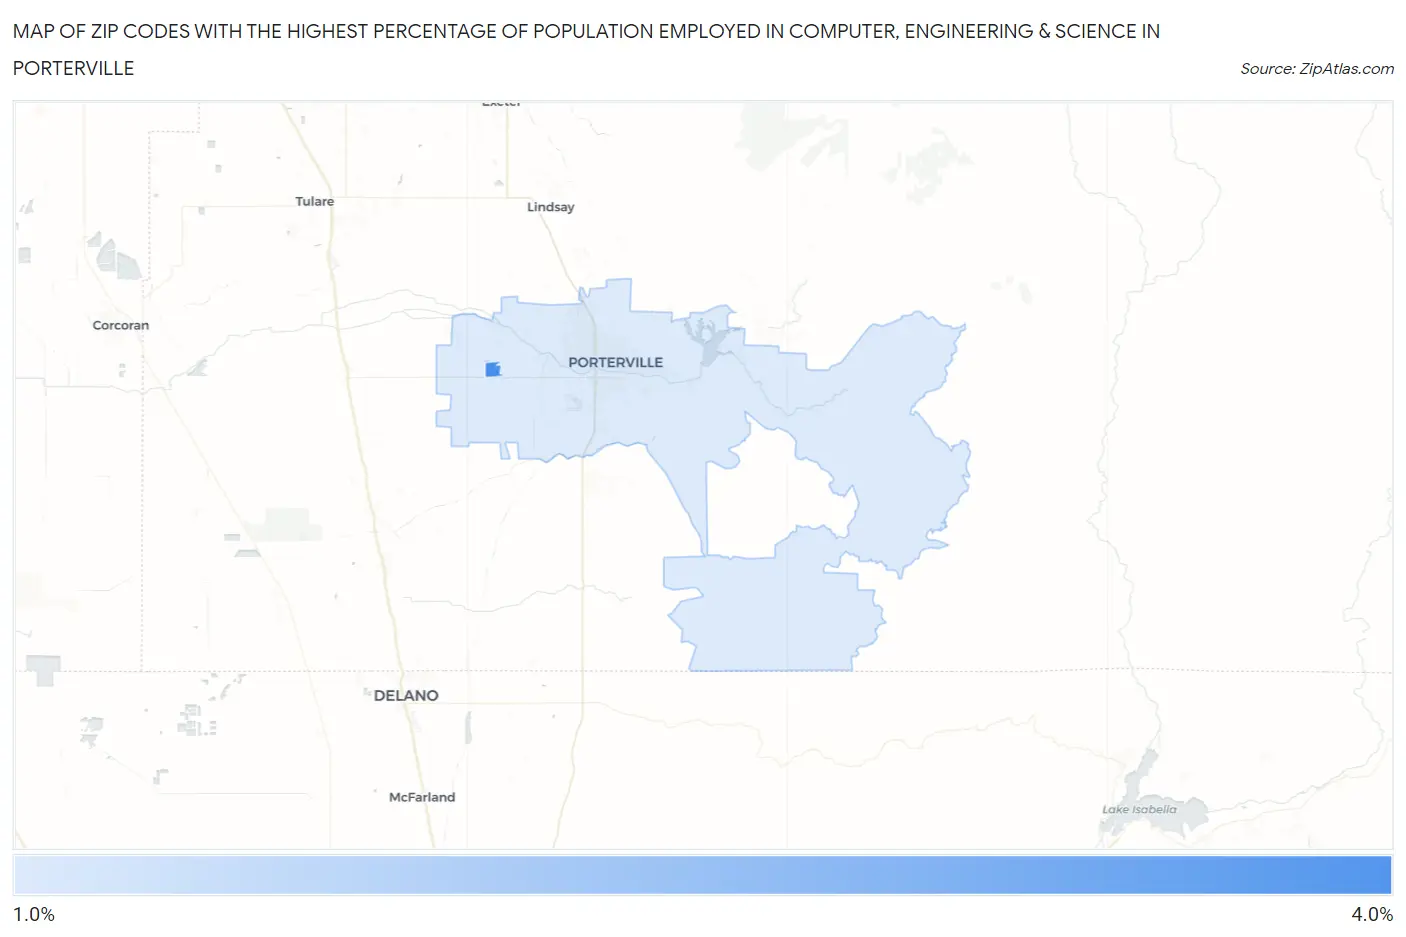
Map of Zip Codes with the Highest Percentage of Population Employed in Computer, Engineering & Science in Porterville
1.5%
3.1%
Zip Codes with the Highest Percentage of Population Employed in Computer, Engineering & Science in Porterville, CA
| Zip Code | % Employed | vs State | vs National | |
| 1. | 93258 | 3.1% | 8.0%(-4.82)#1,167 | 6.8%(-3.63)#17,598 |
| 2. | 93257 | 1.5% | 8.0%(-6.43)#1,399 | 6.8%(-5.23)#23,496 |
1
Common Questions
What are the Top Zip Codes with the Highest Percentage of Population Employed in Computer, Engineering & Science in Porterville, CA?
Top Zip Codes with the Highest Percentage of Population Employed in Computer, Engineering & Science in Porterville, CA are:
What zip code has the Highest Percentage of Population Employed in Computer, Engineering & Science in Porterville, CA?
93258 has the Highest Percentage of Population Employed in Computer, Engineering & Science in Porterville, CA with 3.1%.
What is the Percentage of Population Employed in Computer, Engineering & Science in Porterville, CA?
Percentage of Population Employed in Computer, Engineering & Science in Porterville is 1.5%.
What is the Percentage of Population Employed in Computer, Engineering & Science in California?
Percentage of Population Employed in Computer, Engineering & Science in California is 8.0%.
What is the Percentage of Population Employed in Computer, Engineering & Science in the United States?
Percentage of Population Employed in Computer, Engineering & Science in the United States is 6.8%.