Cities with the Highest Percentage of Population Employed in Computer, Engineering & Science in South Carolina
RELATED REPORTS & OPTIONS
Computer, Engineering & Science
South Carolina
Compare Cities
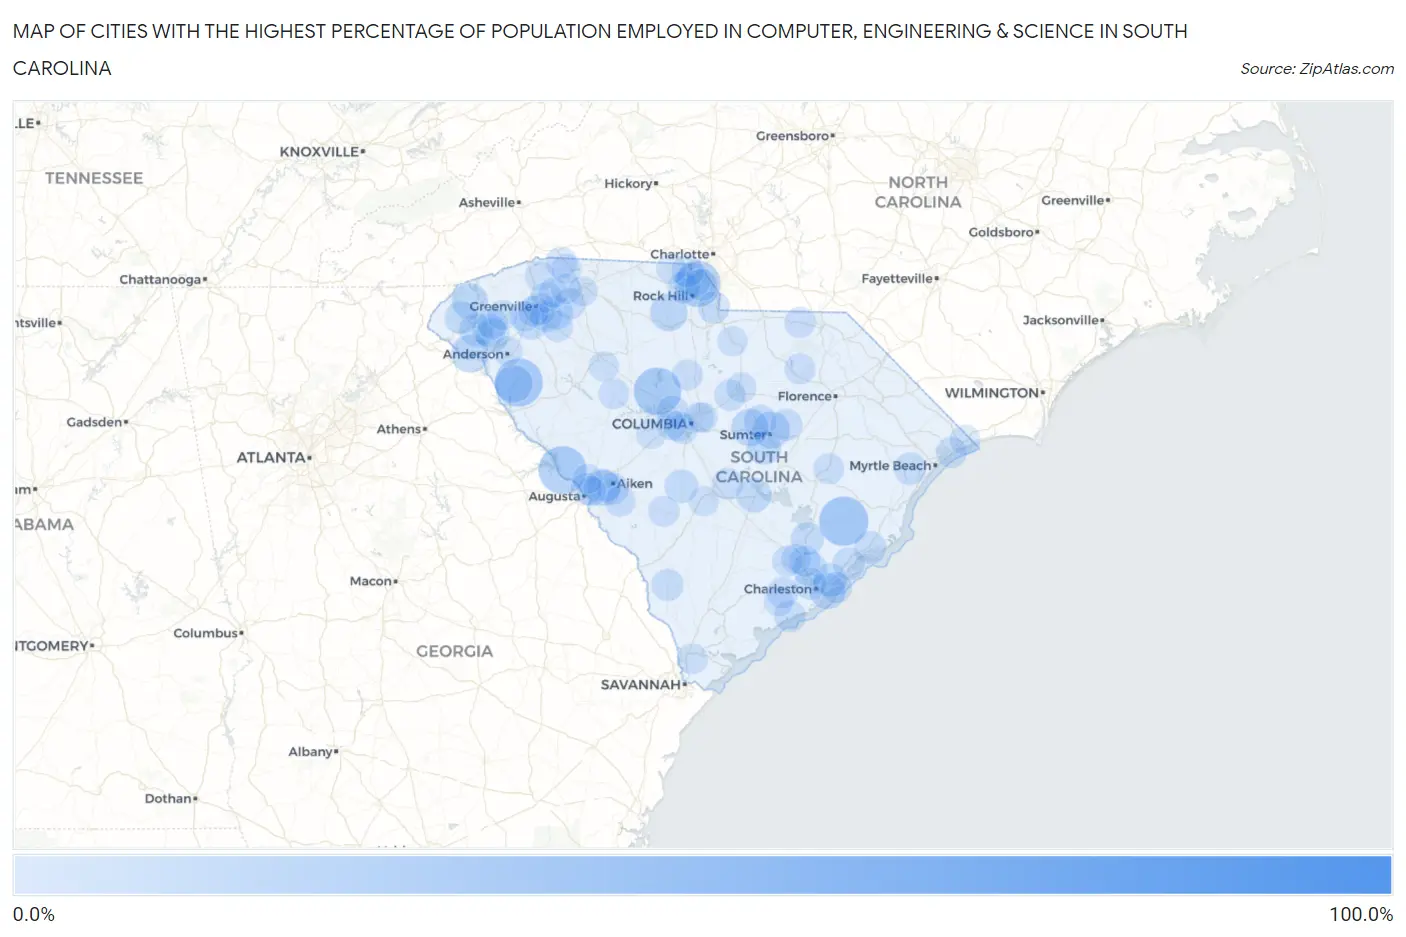
Map of Cities with the Highest Percentage of Population Employed in Computer, Engineering & Science in South Carolina
0.0%
100.0%
Cities with the Highest Percentage of Population Employed in Computer, Engineering & Science in South Carolina
| City | % Employed | vs State | vs National | |
| 1. | Browntown | 100.0% | 5.3%(+94.7)#1 | 6.8%(+93.2)#6 |
| 2. | Jamestown | 31.9% | 5.3%(+26.6)#2 | 6.8%(+25.2)#184 |
| 3. | Antreville | 30.3% | 5.3%(+24.9)#3 | 6.8%(+23.5)#216 |
| 4. | Clarks Hill | 30.0% | 5.3%(+24.7)#4 | 6.8%(+23.2)#222 |
| 5. | Peak | 29.4% | 5.3%(+24.1)#5 | 6.8%(+22.6)#231 |
| 6. | Riverview | 27.5% | 5.3%(+22.2)#6 | 6.8%(+20.7)#272 |
| 7. | Helena | 25.9% | 5.3%(+20.6)#7 | 6.8%(+19.1)#311 |
| 8. | La France | 23.7% | 5.3%(+18.3)#8 | 6.8%(+16.9)#372 |
| 9. | Fair Play | 16.2% | 5.3%(+10.9)#9 | 6.8%(+9.43)#932 |
| 10. | Lowrys | 15.7% | 5.3%(+10.4)#10 | 6.8%(+8.98)#997 |
| 11. | Lake Secession | 15.7% | 5.3%(+10.4)#11 | 6.8%(+8.93)#1,008 |
| 12. | Mulberry | 15.5% | 5.3%(+10.1)#12 | 6.8%(+8.71)#1,041 |
| 13. | Stateburg | 15.5% | 5.3%(+10.1)#13 | 6.8%(+8.71)#1,044 |
| 14. | Gloverville | 15.4% | 5.3%(+10.0)#14 | 6.8%(+8.59)#1,074 |
| 15. | Sandy Springs | 14.1% | 5.3%(+8.75)#15 | 6.8%(+7.33)#1,311 |
| 16. | Adams Run | 13.8% | 5.3%(+8.50)#16 | 6.8%(+7.07)#1,384 |
| 17. | Sullivan S Island | 13.7% | 5.3%(+8.39)#17 | 6.8%(+6.97)#1,411 |
| 18. | Salem | 13.7% | 5.3%(+8.38)#18 | 6.8%(+6.96)#1,414 |
| 19. | Santee | 12.4% | 5.3%(+7.09)#19 | 6.8%(+5.67)#1,797 |
| 20. | Privateer | 11.9% | 5.3%(+6.58)#20 | 6.8%(+5.16)#1,971 |
| 21. | Hanahan | 11.4% | 5.3%(+6.08)#21 | 6.8%(+4.66)#2,155 |
| 22. | Golden Grove | 11.4% | 5.3%(+6.07)#22 | 6.8%(+4.65)#2,158 |
| 23. | Floydale | 11.4% | 5.3%(+6.02)#23 | 6.8%(+4.60)#2,192 |
| 24. | Chickasaw Point | 11.4% | 5.3%(+6.01)#24 | 6.8%(+4.59)#2,202 |
| 25. | Utica | 11.3% | 5.3%(+5.95)#25 | 6.8%(+4.53)#2,221 |
| 26. | Tega Cay | 11.2% | 5.3%(+5.84)#26 | 6.8%(+4.42)#2,276 |
| 27. | Mount Pleasant | 10.9% | 5.3%(+5.52)#27 | 6.8%(+4.10)#2,436 |
| 28. | Pendleton | 10.8% | 5.3%(+5.48)#28 | 6.8%(+4.06)#2,456 |
| 29. | Neeses | 10.7% | 5.3%(+5.37)#29 | 6.8%(+3.95)#2,512 |
| 30. | Five Forks | 10.7% | 5.3%(+5.34)#30 | 6.8%(+3.91)#2,532 |
| 31. | Clemson | 10.6% | 5.3%(+5.26)#31 | 6.8%(+3.83)#2,579 |
| 32. | Walhalla | 10.2% | 5.3%(+4.83)#32 | 6.8%(+3.40)#2,834 |
| 33. | Moncks Corner | 9.8% | 5.3%(+4.46)#33 | 6.8%(+3.04)#3,072 |
| 34. | Mcclellanville | 9.8% | 5.3%(+4.41)#34 | 6.8%(+2.99)#3,104 |
| 35. | Dalzell | 9.6% | 5.3%(+4.24)#35 | 6.8%(+2.82)#3,251 |
| 36. | Sheldon | 9.6% | 5.3%(+4.22)#36 | 6.8%(+2.80)#3,266 |
| 37. | Awendaw | 9.2% | 5.3%(+3.83)#37 | 6.8%(+2.41)#3,563 |
| 38. | Newport | 9.1% | 5.3%(+3.78)#38 | 6.8%(+2.36)#3,601 |
| 39. | Bucksport | 9.1% | 5.3%(+3.75)#39 | 6.8%(+2.33)#3,626 |
| 40. | Lake Wylie | 9.0% | 5.3%(+3.62)#40 | 6.8%(+2.20)#3,747 |
| 41. | Mayesville | 8.9% | 5.3%(+3.54)#41 | 6.8%(+2.12)#3,830 |
| 42. | Warrenville | 8.9% | 5.3%(+3.52)#42 | 6.8%(+2.10)#3,840 |
| 43. | Baxter | 8.7% | 5.3%(+3.34)#43 | 6.8%(+1.91)#3,999 |
| 44. | Luray | 8.7% | 5.3%(+3.31)#44 | 6.8%(+1.89)#4,020 |
| 45. | Van Wyck | 8.7% | 5.3%(+3.31)#45 | 6.8%(+1.89)#4,023 |
| 46. | Fort Mill | 8.6% | 5.3%(+3.29)#46 | 6.8%(+1.87)#4,038 |
| 47. | Greenville | 8.5% | 5.3%(+3.20)#47 | 6.8%(+1.78)#4,127 |
| 48. | Charleston | 8.5% | 5.3%(+3.20)#48 | 6.8%(+1.78)#4,129 |
| 49. | Aiken | 8.5% | 5.3%(+3.17)#49 | 6.8%(+1.75)#4,157 |
| 50. | Irmo | 8.4% | 5.3%(+3.03)#50 | 6.8%(+1.61)#4,290 |
| 51. | North Augusta | 8.3% | 5.3%(+2.99)#51 | 6.8%(+1.57)#4,322 |
| 52. | Seabrook Island | 8.3% | 5.3%(+2.97)#52 | 6.8%(+1.54)#4,363 |
| 53. | Cameron | 8.1% | 5.3%(+2.71)#53 | 6.8%(+1.29)#4,621 |
| 54. | Landrum | 8.0% | 5.3%(+2.66)#54 | 6.8%(+1.24)#4,692 |
| 55. | Hollywood | 7.9% | 5.3%(+2.59)#55 | 6.8%(+1.17)#4,781 |
| 56. | Mauldin | 7.8% | 5.3%(+2.44)#56 | 6.8%(+1.02)#4,958 |
| 57. | Lugoff | 7.8% | 5.3%(+2.42)#57 | 6.8%(+0.993)#4,996 |
| 58. | Isle Of Palms | 7.6% | 5.3%(+2.23)#58 | 6.8%(+0.806)#5,219 |
| 59. | Reidville | 7.5% | 5.3%(+2.18)#59 | 6.8%(+0.762)#5,268 |
| 60. | Goose Creek | 7.5% | 5.3%(+2.15)#60 | 6.8%(+0.723)#5,311 |
| 61. | North Hartsville | 7.4% | 5.3%(+2.05)#61 | 6.8%(+0.627)#5,420 |
| 62. | Fountain Inn | 7.3% | 5.3%(+1.99)#62 | 6.8%(+0.571)#5,500 |
| 63. | Briarcliffe Acres | 7.3% | 5.3%(+1.95)#63 | 6.8%(+0.531)#5,540 |
| 64. | Blackville | 7.3% | 5.3%(+1.94)#64 | 6.8%(+0.516)#5,559 |
| 65. | Kingstree | 7.2% | 5.3%(+1.84)#65 | 6.8%(+0.413)#5,688 |
| 66. | Springdale | 7.1% | 5.3%(+1.78)#66 | 6.8%(+0.362)#5,784 |
| 67. | Winnsboro Mills | 7.1% | 5.3%(+1.77)#67 | 6.8%(+0.345)#5,802 |
| 68. | Taylors | 7.1% | 5.3%(+1.76)#68 | 6.8%(+0.334)#5,814 |
| 69. | Chesterfield | 7.1% | 5.3%(+1.72)#69 | 6.8%(+0.296)#5,870 |
| 70. | Dunean | 7.1% | 5.3%(+1.71)#70 | 6.8%(+0.290)#5,879 |
| 71. | New Ellenton | 6.9% | 5.3%(+1.54)#71 | 6.8%(+0.118)#6,137 |
| 72. | Central | 6.8% | 5.3%(+1.48)#72 | 6.8%(+0.056)#6,224 |
| 73. | Summerville | 6.8% | 5.3%(+1.46)#73 | 6.8%(+0.041)#6,259 |
| 74. | Silverstreet | 6.8% | 5.3%(+1.44)#74 | 6.8%(+0.015)#6,299 |
| 75. | Hardeeville | 6.6% | 5.3%(+1.30)#75 | 6.8%(-0.119)#6,483 |
| 76. | Little River | 6.6% | 5.3%(+1.29)#76 | 6.8%(-0.129)#6,492 |
| 77. | Powdersville | 6.6% | 5.3%(+1.22)#77 | 6.8%(-0.199)#6,593 |
| 78. | Lyman | 6.5% | 5.3%(+1.18)#78 | 6.8%(-0.247)#6,688 |
| 79. | Ladson | 6.5% | 5.3%(+1.13)#79 | 6.8%(-0.292)#6,751 |
| 80. | Gilbert | 6.5% | 5.3%(+1.11)#80 | 6.8%(-0.313)#6,778 |
| 81. | Forest Acres | 6.4% | 5.3%(+1.09)#81 | 6.8%(-0.337)#6,814 |
| 82. | Oak Grove | 6.3% | 5.3%(+0.998)#82 | 6.8%(-0.425)#6,976 |
| 83. | Camden | 6.3% | 5.3%(+0.934)#83 | 6.8%(-0.488)#7,087 |
| 84. | Harbor Island | 6.2% | 5.3%(+0.908)#84 | 6.8%(-0.515)#7,128 |
| 85. | Joanna | 6.2% | 5.3%(+0.878)#85 | 6.8%(-0.545)#7,171 |
| 86. | Tigerville | 6.2% | 5.3%(+0.864)#86 | 6.8%(-0.559)#7,198 |
| 87. | Liberty | 6.2% | 5.3%(+0.863)#87 | 6.8%(-0.560)#7,203 |
| 88. | Hamer | 6.2% | 5.3%(+0.834)#88 | 6.8%(-0.588)#7,255 |
| 89. | Heath Springs | 6.1% | 5.3%(+0.793)#89 | 6.8%(-0.630)#7,332 |
| 90. | Columbia | 6.1% | 5.3%(+0.777)#90 | 6.8%(-0.645)#7,352 |
| 91. | Greer | 6.1% | 5.3%(+0.717)#91 | 6.8%(-0.705)#7,481 |
| 92. | Clover | 6.0% | 5.3%(+0.682)#92 | 6.8%(-0.740)#7,543 |
| 93. | Anderson | 6.0% | 5.3%(+0.647)#93 | 6.8%(-0.775)#7,615 |
| 94. | Campobello | 6.0% | 5.3%(+0.635)#94 | 6.8%(-0.788)#7,632 |
| 95. | Cordova | 6.0% | 5.3%(+0.610)#95 | 6.8%(-0.812)#7,686 |
| 96. | Clearwater | 5.9% | 5.3%(+0.604)#96 | 6.8%(-0.819)#7,695 |
| 97. | Lexington | 5.9% | 5.3%(+0.603)#97 | 6.8%(-0.819)#7,697 |
| 98. | Murphys Estates | 5.9% | 5.3%(+0.603)#98 | 6.8%(-0.820)#7,698 |
| 99. | Arcadia | 5.9% | 5.3%(+0.581)#99 | 6.8%(-0.842)#7,740 |
| 100. | Meggett | 5.9% | 5.3%(+0.532)#100 | 6.8%(-0.891)#7,845 |
Common Questions
What are the Top 10 Cities with the Highest Percentage of Population Employed in Computer, Engineering & Science in South Carolina?
Top 10 Cities with the Highest Percentage of Population Employed in Computer, Engineering & Science in South Carolina are:
#1
31.9%
#2
30.3%
#3
30.0%
#4
29.4%
#5
27.5%
#6
16.2%
#7
15.7%
#8
15.7%
#9
15.5%
#10
15.5%
What city has the Highest Percentage of Population Employed in Computer, Engineering & Science in South Carolina?
Jamestown has the Highest Percentage of Population Employed in Computer, Engineering & Science in South Carolina with 31.9%.
What is the Percentage of Population Employed in Computer, Engineering & Science in the State of South Carolina?
Percentage of Population Employed in Computer, Engineering & Science in South Carolina is 5.3%.
What is the Percentage of Population Employed in Computer, Engineering & Science in the United States?
Percentage of Population Employed in Computer, Engineering & Science in the United States is 6.8%.